PRINCIPLES OF APPLIED PSYCHOPHYSIOLOGY AND POLYGRAPH TESTING · 2015-07-02 · PRINCIPLES OF...
182
MARK HANDLER & RAYMOND NELSON FOR LAFAYETTE INSTRUMENT COMPANY PRINCIPLES OF APPLIED PSYCHOPHYSIOLOGY AND POLYGRAPH TESTING
Transcript of PRINCIPLES OF APPLIED PSYCHOPHYSIOLOGY AND POLYGRAPH TESTING · 2015-07-02 · PRINCIPLES OF...

M A R K H A N D L E R & R A Y M O N D N E L S O N
F O R L A F A Y E T T E I N S T R U M E N T C O M P A N Y
PRINCIPLES OF APPLIED
PSYCHOPHYSIOLOGY AND POLYGRAPH
TESTING

A DEFINITION OF PSYCHOLOGY
The science of behavior and
cognitive (mental)
processes.
March 23, 2015 © 2014 | Lafayette Instrument Company 2

A DEFINITION OF PHYSIOLOGY
The study of the function of
living organisms.
March 23, 2015 © 2014 | Lafayette Instrument Company 3

PSYCHOPHYSIOLOGY
The study of relations between psychological
manipulations and the resultant physiological
responses, measured in the living organism, to
promote understanding of the relationship
between mental and bodily processes.
Andreassi, J.L. (2000), Psychophysiology, Human Behavior &
Physiological Response 4th edition.
March 23, 2015 © 2014 | Lafayette Instrument Company 4

PSYCHOLOGY & PHYSIOLOGY
Psychology Physiology
March 23, 2015 © 2014 | Lafayette Instrument Company 5

FORENSIC PSYCHOPHYSIOLOGY
• The science that deals with the relationship and
applications of applied psychophysiology to the
legal system. Yankee, W.J. (1992)
• The modifier “forensic” delimits this science from the
broader discipline of psychophysiology.
• The same aspects & rules of science apply
to both.
March 23, 2015 © 2014 | Lafayette Instrument Company 6

CONSTRUCT VALIDITY (1)
• What is a construct?
• An ideal “object” that is not directly observable
• As opposed to “real” observable objects
• For example, “intelligence” is a construct
• How do we operationalize a construct?
• The process of defining a construct to make it observable
and quantifiable
• For example, intelligence tests
March 23, 2015 © 2014 | Lafayette Instrument Company 7

CONSTRUCT VALIDITY (2)
Refers to how well explanatory theories and concepts account for a test’s performance
“A solid theoretical and scientific base can give confidence about the robustness of a test across examinees and settings and against the threat of countermeasures and can lead to its improvement over time.”
National Academy of Sciences (2003), p.101
March 23, 2015 © 2014 | Lafayette Instrument Company 8

CONSTRUCT VALIDITY (3)
“… research has confirmed that the polygraph
instrument measures physiological reactions that may
be associated with an examinee’s stress, fear, anger,
excitement, or anxiety about deception, or with an
examinee’s orienting response to information that is
especially relevant to some forbidden act.”
National Academy of Sciences (2003), p.72
March 23, 2015 © 2014 | Lafayette Instrument Company 9

TESTING- BASICS (1)
• Stimulus–Stimulus (Associative) Learning > Response• Top Down process
• Sometimes referred to as “stimulus substitution”
• Measure the response• Measure it several times- all measurements are estimates
• Measure it similarly every time
Lutz, Learning & Memory 2nd Edition (2005)
March 23, 2015 © 2014 | Lafayette Instrument Company 10

TESTING- BASICS (2)
• Aggregate the data together to get a more stable estimate. Ex. Add or average data together.
• Compare the aggregated value to ipsative or normative decision thresholds.
• The stimulus activates or does not activate a representation of another stimulus.
• Test administrator (examiner) is NOT the test stimulus.
March 23, 2015 © 2014 | Lafayette Instrument Company 11

SALIENCE (1)
• The adjective “salient” is defined as “prominent” or
“conspicuous” by the Random House Unabridged
Dictionary (2006).
• The Kernerman English Multilingual Dictionary
defines “salient” as “main”, “chief”, “most
noticeable”.
March 23, 2015 © 2014 | Lafayette Instrument Company 12

SALIENCE (2)
• Salience means that a stimulus is prominent,
conspicuous, and/or striking.
• Stimuli may be salient because they are
threatening, novel, surprising, familiar, complicated,
pertinent, or otherwise significant.
• We may not know why one stimulus is more salient
than another to an individual.
March 23, 2015 © 2014 | Lafayette Instrument Company 13

SALIENCE (3)
• Psychophysiological arousal occurs when stimuli are
salient.
• Arousal is commensurate with the degree of
salience.
• More salient > More arousalPodlesney & Raskin (1978)
March 23, 2015 © 2014 | Lafayette Instrument Company 14

PSYCHOPHYSIOLOGICAL BASIS OF POLYGRAPH
• Emotional Theory- From a Cognitive Perspective
• Cognitive Theory
• Behavioral conditioning (Learning) Theory
March 23, 2015 © 2014 | Lafayette Instrument Company 15

EMOTIONAL SYNDROMES, STATES AND REACTIONS
• Emotional syndromes are what we think of when we
"picture" an emotional state.
• Emotional states are the condition we find ourselves
in while experiencing an emotion.
• Emotional reactions (responses) are responses to
the emotional state
March 23, 2015 © 2014 | Lafayette Instrument Company 16

EMOTIONAL RESPONSES (1)
• Emotional responses can be
characterized by the presence of four
major components:
• a cognitive component
• an affective component
• a biological component
• a behavioral component
March 23, 2015 © 2014 | Lafayette Instrument Company 17

EMOTIONAL RESPONSES (2)
• The cognitive component accounts for the
conscious or unconscious perception and appraisal
of the stimulus in terms of emotional significance or
meaning to the subject.
• How salient is it?
• The affective component provides the subjective
experience or feelings associated with a particular
emotion.
• Humans and other animals have historically used the
affective component to increase learning and enhance survival.
March 23, 2015 © 2014 | Lafayette Instrument Company 18

EMOTIONAL RESPONSES (3)
• The biological component includes the bodily
effects resulting from activation of the autonomic
and central nervous system.
• The behavioral component provides the impetus to
engage in action or behavior, and can be a useful
point of observation when we seek to understand a
person's motivation and goals.
• Emotionality is sometimes used to describe the measurable
aspects resulting from emotion.
March 23, 2015 © 2014 | Lafayette Instrument Company 19

EMOTIONALITY (1)
• Some of the changes we consider in PDD testing are likely the result of emotional states, which are also dependent on motivation, experience, memory, and cognition.
• Some of the physical manifestations of emotionality, attempted to be measured during PDD testing, include changes in:• Respiratory
• Cardiovascular
• Vasomotor
• Electrodermal Activity
March 23, 2015 © 2014 | Lafayette Instrument Company 20

EMOTIONALITY (2)
• We will never know precisely what emotion(s) our
examinees experience.
• Individual emotions are semi-predictable events
assumed to be the direct result of the PDD test
questions, but responses and response potential
may vary.
• PDD testing theories hold that observed
emotionality associated with the test question will
contribute to the physiological reactions that can
be measured and interpreted.
March 23, 2015 © 2014 | Lafayette Instrument Company 21

PURPOSE OF EMOTIONS
• Emotional states are the result of evolutionary fine-
tuning that is intended to ensure the survival of an
organism.
• This is accomplished by preparing and motivating
the individual to contend with goal relevant stimuli
(including PDD questions).
• Emotions serve to produce responses that enhance
survivability of an encounter.
March 23, 2015 © 2014 | Lafayette Instrument Company 22

COGNITION
• Cognitive activity broadly describes any conscious
or unconscious thought process that results in the
appraisal of, and response to, a stimulus.
• Recent neuropsychological models have supported
the notion that, at least in humans, emotional and
cognitive functions are strongly reciprocally
connected.
March 23, 2015 © 2014 | Lafayette Instrument Company 23

COGNITION AND THE FRONTAL CORTEX
• All executive functions are “caused by” or in
furtherance of “goals”
• Structures the present to serve the future
• Major Executive Functions of F.C.
• Planning
• Decision Making
• Executive attention
Joaquin Fuster, The Prefrontal Cortex, 4th edition (2008)
March 23, 2015 © 2014 | Lafayette Instrument Company 24

EXECUTIVE ATTENTION
The 3 aspects of goal directed action organization
1. Working memory- sustained attention focused on some
internal representation
• Memory we use in the short term, to perform acts
• May be sensory, motor, or mixed
• Reactivated percept or motor act to be performed
• Representation of cognitive or behavioral goal
2. Preparatory Set- priming of motor or sensory neural
structures (pre-motor and basal ganglia)
3. Interference inhibition a.k.a. Inhibitory Control
• Competing sensory inputs & motor instincts held in check
March 23, 2015 © 2014 | Lafayette Instrument Company 25

COGNITION IN THE POLYGRAPH CONTEXT
• Examinees are presented with a number of stimuli,
in the form of test questions, and presumably attend
to each sequentially.
• Examinees conduct an appraisal with respect to
what that test question (stimulus) means.
• This appraisal relates to the examinee's goals, standards,
and attitudes related to passing the test.
March 23, 2015 © 2014 | Lafayette Instrument Company 26

APPRAISALS
• Appraisals are simply an evaluation that are
assigned emotional meaning, value or salience.
• Cognition and appraisal are a process of
evaluating a stimulus for goal congruence within
the examinee's motivational framework.
March 23, 2015 © 2014 | Lafayette Instrument Company 27

BEHAVIORAL CONDITIONING (LEARNING) THEORY
• A relatively permanent change in the mechanism
of behavior, involving a specific stimulus and the
response to that stimulus, based on a prior
experience with that stimulus or one that is similar
• Mechanism- because behavior is determined by many
factors other than learning. Whether you eat depends on
hunger, motivation to find food, food likes and food
location. Only food location involves learning.
March 23, 2015 © 2014 | Lafayette Instrument Company 28

CONDITIONING
• Procedure in which an organism learns to associate
a particular stimulus with a particular response.
• Conditioning can occur when a subject associates
a stimulus with goal congruence.
• What does that stimulus (test question) mean to me passing
this test?
March 23, 2015 © 2014 | Lafayette Instrument Company 29

ASSOCIATIVE LEARNING (1)
• Memory and Learning are intimately intertwined
• Learning is the acquisition of new knowledge
through experience
• Memory is the retention of that knowledge
March 23, 2015 © 2014 | Lafayette Instrument Company 30

ASSOCIATIVE LEARNING (2)
• Learned Response- when an organism modifies its
behavior based on a prior experience.
• Memory can be described as the neural process
by which the organism:
• Associates a present stimulus or experience with
memories of similar past experiences and
• Projects future consequences (good or bad)
• Enables the organism to form an appropriate
response to the appraised circumstances.
March 23, 2015 © 2014 | Lafayette Instrument Company 31

BEHAVIORAL CONDITIONING
• Behavior (physiological responses) conditioning
(associative learning related to goals) occurs to
stimuli in systems tied to that goal.
• Stimulus-Stimulus learning- subjects respond to a
conditioned stimulus not because it elicits a
conditioned response but because it activates a
representation of another stimulus.
Lutz, Learning & Memory 2nd Edition (2005)
March 23, 2015 © 2014 | Lafayette Instrument Company 32

PDD AND ASSOCIATIVE LEARNING
• Polygraph test questions are appraised in relation to
goal congruence of “passing the test”
• Examinees assess each question with regards to goals (passing the test), standards and attitudes
• That assessment results in assigning salience through
associative learning or conditioning
March 23, 2015 © 2014 | Lafayette Instrument Company 33

ALLOSTASIS
• Allostasis can be described as a central nervous
system mediated, integrated brain-body response.
• Geared towards viability or survival.
• It occurs in regulatory systems which have no fixed
set point and all are the result of evolutionary
tinkering.
• The evolutionary benefits of adopting a "Why wait?"
response is beneficial.
• Allostasis, meaning literally "maintaining stability (or
homeostasis) through change" was introduced by Sterling and Eyer(1988).
March 23, 2015 © 2014 | Lafayette Instrument Company 34

ALLOSTASIS EXPLAINED
• The allostatic model acknowledges the organism
can use prior information to predict demand and
adjust proactively before the demand is needed.
• For example, blood pressure typically rises slightly
during the moments just before a person stands
after sitting or relaxing.
• Anticipatory increase in blood pressure is adaptive, and
can help prevent lightheadedness by mitigating the
gravitational pull of blood towards the feet when we stand up.
March 23, 2015 © 2014 | Lafayette Instrument Company 35

EMOTIONALITY, ALLOSTASIS & LEARNING
• There is no clear “set point” for any particular emotion and thus it is better described under the concept of allostasis than homeostasis.
• Allostasis describes the changes that occur behaviorally and physiologically to facilitate survival based on an assessment of the stimulus.
• Once the dangerous condition has passed and the organism experiences relief, the arousal state should subside, and allodynamic regulation should function to restore set points.
March 23, 2015 © 2014 | Lafayette Instrument Company 36

SOME PRINCIPLES OF PSYCHOPHYSIOLOGY (1)
• TONIC LEVEL• Resting level/baseline of activity prior to stimulation
• Result of CNS activity, reaction to stimuli, balance between SNS and PNS (autonomic tone)
• TONIC CHANGE• Change to new tonic level
• PHASIC CHANGE• Movement from and back to baseline
• TONIC RESPONSE• Tonic change following stimulus
March 23, 2015 © 2014 | Lafayette Instrument Company 37

SOME PRINCIPLES OF PSYCHOPHYSIOLOGY (2)
• PHASIC ACTIVITY
• Discrete/evoked response to specific stimulus
• RESPONSE
• Change following application of stimulus
• Specific (cause is known or presumed) e.g. question
• Non-specific (cause unknown or uncertain) e.g. thoughts
generated by subject
March 23, 2015 © 2014 | Lafayette Instrument Company 38

SOME PRINCIPLES OF PSYCHOPHYSIOLOGY (3)
• AROUSAL
• Change of activity to bring about action/reaction
• DIRECTIONAL FRACTIONATION
• Different systems display opposite response
• ORIENTING RESPONSE
• Reflex response, adjustment to sensory input
• Subject focuses attention to external stimuli, e.g. voice,
discomfort
March 23, 2015 © 2014 | Lafayette Instrument Company 39

SOME PRINCIPLES OF PSYCHOPHYSIOLOGY (4)
• HABITUATION
• Decrease in physiological response following repeated
stimuli
• Stimulus loses significance to receiver
• Decrease in arousal or reactions
• DISHABITUATION
• Can occur only after habituation
• After interruption and re-presentation of stimulus, response is
less significant
March 23, 2015 © 2014 | Lafayette Instrument Company 40

SOME PRINCIPLES OF PSYCHOPHYSIOLOGY (5)
• Sensitization
• Increase in physiological response following repeated
exposure to the stimulus
• Significance of the stimulus increases for the receiver
• Increase in arousal or reaction
• Desensitization
• Can occur only after sensitization
• Receiver can learn to decrease arousal and response to a
stimulus
March 23, 2015 © 2014 | Lafayette Instrument Company 41

SOME PRINCIPLES OF PSYCHOPHYSIOLOGY (6)
• DEFENSIVE RESPONSE• Similar to oriented response but stimulus is much more
intense/potentially painful
• Habituation is slower
• STARTLE RESPONSE• Similar to defensive response but stimulus is less intense
• Stimulus has sudden onset
• Biologically important as it tends to “disconnect” other ongoing processes to attend to the stimulus
March 23, 2015 © 2014 | Lafayette Instrument Company 42

SOME PRINCIPLES OF PSYCHOPHYSIOLOGY (7)
• WILDER’S LAW (principle) OF INITIAL VALUES• Concept that focuses on the pre-stimulus level in
considering the potential response magnitude. The higher the initial level, the smaller the potential increase in response to a given stimulus.
• STIMULUS RESPONSE SPECIFICITY• Response is specific to the stimulus
March 23, 2015 © 2014 | Lafayette Instrument Company 43

SOME PRINCIPLES OF PSYCHOPHYSIOLOGY (8)
Other factors influencing Autonomic response:
• Stimulus characteristics
• Intensity, frequency, novelty, complexity
• Attention to stimulus
• Conflict regarding stimulus
• Associations (thoughts) and Imagery (visualizations)
March 23, 2015 © 2014 | Lafayette Instrument Company 44

INSTRUMENTATION AND EDA
PDD considerations related to instrumentation
• Tonic level (baseline)
• Stimulus onset
• Answer
• Phasic response
• Latency
• Response onset
• Amplitude
• Duration
• Recovery
• Rise time
• Rebound
• Non-specific response
• Expected Response Onset Window
March 23, 2015 © 2014 | Lafayette Instrument Company 45

INSTRUMENTATION AND EDA
• Studies have consistently supported that EDA
amplitude of response can discriminate deception
and truth-telling at statistically significantly levels
• Studies are inconsistent regarding complexity and
duration as capable of discriminating deception
and truth-telling
March 23, 2015 © 2014 | Lafayette Instrument Company 46

PHYSIOLOGICAL RECORDINGS
• Endosomatic- electrical activity within body
• EKG, EEG, SPR
• Exosomatic- apply external energy
• Conductance/resistance EDA responses
• Transduce- change of energy form e.g. electrical to
mechanical
• Pneumograph/cardiograph
March 23, 2015 © 2014 | Lafayette Instrument Company 47

EQUIPMENT AND FILTERING
• Filters- modifies output signal
• Low pass (filters out high frequencies)
• High pass (filters out low frequencies)
• Band pass (allows certain frequencies to pass)
• Notch (filters out certain frequencies)
• Smoothing filter removes high-frequency artifacts from the data
March 23, 2015 © 2014 | Lafayette Instrument Company 48

PDD COMPONENTS & PSYCHOPHYSIOLOGY
• EDA
• Cardiograph
• Respiration
• Photoelectric Plethysmograph
March 23, 2015 © 2014 | Lafayette Instrument Company 49

March 23, 2015 © 2014 | Lafayette Instrument Company 50
ELECTRODERMAL RESPONSES

TERMINOLOGY
• GSR• Not accurate
• Galvanic process- A galvanic cell is one that uses a chemical reaction resulting from electrical contact between two dissimilar metals to produce an electrical current.
• EDA in polygraph does not conform to Galvanic models
• Psychogalvanic reflex • Not accurate
• EDA is not galvanic
• Reflex- Refers to behavior that does not require learning. EDA is not a reflex.
March 23, 2015 © 2014 | Lafayette Instrument Company 51

CORRECT TERMINOLOGY
• Electrodermal activity (response)
• The human integumentary system does not function the
same as a dummy resistor
• It has capacitance effects
• There are also individual differences
March 23, 2015 © 2014 | Lafayette Instrument Company 52

ELECTRODERMAL ACTIVITY/RESPONSE
• Driven by the Sympathetic/Autonomic Nervous System (S/ANS)
• Ideally recorded with wet Ag/AgCl electrodes
• Field polygraph often uses plates
• Best recorded on the palms (thenar and
hypothenar eminences)
• On average is responsible for about 50% of the
diagnostic information in the charts
March 23, 2015 © 2014 | Lafayette Instrument Company 53

PORAL VALVE MODEL (1)
March 23, 2015 © 2014 | Lafayette Instrument Company 54
PORAL VALVE MODEL (2)
• Edelberg (1993) proposed the “poral valve model”,
a hydraulic model for the explanation of phasic
changes in SP and SC.
• Edelberg’s poral valve model is fully adequate as
an explanation for the rapid recovery of SCRs.
March 23, 2015 © 2014 | Lafayette Instrument Company 55

PORAL VALVE MODEL (3)
Figure A on diagram
If the upper levels of the corneum are sufficiently hydrated, it is likely that most of the sweat pores and more distal portions of the duct will be collapsed under the pressure of the swelling (Sarkany, Shuster & Stammers, 1965). If the ducts are relatively empty and their pores on the skin surface are closed, each sudomotor impulse will fill the duct axially and laterally. As the ducts diffuse sweat and fill there will be a resultant increase in conductance and increase in negative potential on the surface of the skin.
March 23, 2015 © 2014 | Lafayette Instrument Company 56

PORAL VALVE MODEL (4)
Figure B on diagram
During continuing responses, the ducts will be
completely filled with sweat, and intraductal pressure
will increase, forcing more ion-laden sweat into the
lower and less hydrated zone of the corneum. This
results in a further increase of conductance and
possibly contributes to the positive SPR.
March 23, 2015 © 2014 | Lafayette Instrument Company 57

PORAL VALVE MODEL (5)
Figure C on diagram
If the secretions are sufficiently strong, intraductal pressure will exceed the tissue pressure of the corneum, causing/resulting in a dilation of the poral region in the corneum, including the collapsed terminal portion of the acrosyringium. Sweat will be forced out through the sweat pore onto the surface of the skin while still being moved laterally into the corneum. The result is a rapid increase in skin conductance and a positive SPR due to the internal circuit effect caused by the increase in the conductance of the corneum.
March 23, 2015 © 2014 | Lafayette Instrument Company 58
PORAL VALVE MODEL (6)
Figure D on diagram
As sweat pours out on the surface and into the
corneum, the ductal pressure drops, which allows the
corneum to collapse the acrosyringium and close the
pore. Together these actions will quickly decrease
conductance thus accelerating recovery and will
contribute to the positive SPR. This sudden increase in
resistance may appear as a “reabsorption” response.
March 23, 2015 © 2014 | Lafayette Instrument Company 59

• Several suggested the electrodermal component
provides the greatest contribution to diagnostic
accuracy
• Capps & Ansley, (1992)
• Harris & Olsen (1994)
• Kircher & Raskin (1988, 2002)
• Raskin, Kircher, Honts, & Horowitz (1988)
• Kircher, Krisjianson, Gardner & Webb (2005)
• Harris, Horner & McQuarrie (2000)
• Krapohl & McManus (1999)
COMPONENT WEIGHTS
March 23, 2015 © 2014 | Lafayette Instrument Company 60

RESISTANCE OR CONDUCTANCE
• Limited research suggests conductance might be
more stable
• Data are not compelling or conclusive
• Scientific community tends to prefer conductance
• Mathematically Inverse
• Conductance = 1/Ω * 1,000,000 = 1,000,000 / (S/1)
• Relationship is non-linear
March 23, 2015 © 2014 | Lafayette Instrument Company 61

RESISTANCE AND CONDUCTANCE
March 23, 2015 © 2014 | Lafayette Instrument Company 62
Note the non-linearity

RESISTANCE AND CONDUCTANCE
• Mathematically, but not linearly related
• Human psychophysiological responses have not
been shown to be linear
• Human sensory data may be loglinear
• Perceived intensity of a stimulus may not have a straight
linear relationship to the intensity of the stimulus
• Relationship between resistance and
conductance is approximately linear within the
normal range of EDA
March 23, 2015 © 2014 | Lafayette Instrument Company 63

EVERYTHING YOU EVER WANTED TO KNOW ABOUT SWEATING
Eccrine glands located throughout the body
Denser concentrations in palms and feet, Enervated by Acetylcholine, and Regulated in part by the Hypothalmus
Apocrine glands located mainly in private areas
Cholinergic and hormonal (adrenergic) activation, Hair follicles, Foster production of bacteria (BO), and Thought to play a role in mating for some species
Three main types of sweating
Emotional sweating- fear and anxiety stimulate cholinergic activity in the hypothalamus.
Thermoregulatory sweating- hypothalamic acetylcholine signals
gustatory sweating- spicy food.
Sweating disorders
Hyperhidrosis (Reynaud's)- excessive sweating (axillary or palmar).
Frey's syndrome- facial sweating in response to salivatory stimuli.
March 23, 2015 © 2014 | Lafayette Instrument Company 64

EDA- INTERPRETATION
• Ascending data (phasic response)
• Represents activation of the S/ANS (acetylcholine)
• Scored
• Descending data
• Not Scored
• Evaporation
• Not PS/ANS
• Also includes descending EDA response noise
• Possible due to capacitance or other phenomena
• Most polygraphs remove with filtering
March 23, 2015 © 2014 | Lafayette Instrument Company 65

COMPLEXITY
Kircher, Kristjansson, Gardner and Webb (2005)
• Vertical amplitude is diagnostic
• Complexity was found to be negatively correlated with deception• Not statistically significant
• Conflicts with earlier studies • Kircher and Raskin (1988)
• May be due to instrumentation and data collection
• Consistent with other studies • Honts and Devitt (1992)
• Significant negative correlation between complexity and deception
March 23, 2015 © 2014 | Lafayette Instrument Company 66

March 23, 2015 © 2014 | Lafayette Instrument Company 67

BIGGER IS BETTER
Nelson, Handler & Senter (2014) showed that small
ratio differences are diagnostic
March 23, 2015 © 2014 | Lafayette Instrument Company 68

EXAMPLE ROC PLOT DEMONSTRATES “BIGGER IS BETTER” PRINCIPLE TESTING
• Area Under the Curve
• Grand Mean = .970 (.953 to .986)
• R1 = .938 (.890 to .984)
• R2 = .918 (.882 to .946)
• R3 = .901 (.870 to .938)
• No significant differences from OSS-3
March 23, 2015 © 2014 | Lafayette Instrument Company 69

EDRS AND CAUSES
From a polygraph perspective, studies of ORs, DRs,
habituation, information processing (including
learning and memory), mental load, motivation and
emotion would seem most germane.
These areas would best serve to inform the polygraph
profession about potential sensitivity and specificity of
EDRs and may help better understand the
psychophysiological construct of PDD testing.
March 23, 2015 © 2014 | Lafayette Instrument Company 70

EDR AROUSAL PATHS-BOUCSEIN (1992) MODEL
This model divides arousal into four sub-systems:
• Amygdala centered affect arousal system
• Hippocampus centered effort system
• Preparatory activation system, is centered on the
basal ganglia system and is involved in
somatomotor activity
• General arousal system centered on the Reticular
Activating System
March 23, 2015 © 2014 | Lafayette Instrument Company 71
EDA MYTHS
• EDA should not produce a persistent descending
pattern of data
• Manual EDA should provide hand-free operation in
the field
• The human integumentary system (skin) is a simple
and linear physiological data problem
• Unfiltered EDA data should be easy to interpret
March 23, 2015 © 2014 | Lafayette Instrument Company 72

EDA FACTS
• Relationship between Resistance and
Conductance is mathematical but non-linear
• The human integumentary system does not behave
the same as a dummy resistor
• All data can be thought of as a signal with a range
of frequencies
• All signals require processing to get from the sensor
to the computer screen, printer or data file
March 23, 2015 © 2014 | Lafayette Instrument Company 73

MORE EDA FACTS
• Raw / Manual EDA = Minimum level of signal
processing necessary to produce usable and
interpretable data
• Automatic EDA = Filtered EDA
• All instrument manufacturers provide for some
filtration of the electrodermal data
March 23, 2015 © 2014 | Lafayette Instrument Company 74

EDA SIGNAL PROCESSING- OPTIONS
• Hardware- resistors and capacitors (R/C filters)
• Firmware (in the box)- software encoded into a
computer chip after the analog to digital
conversion
• Software- in the computer system
• Processing of recorded data
• Processing of displayed data
March 23, 2015 © 2014 | Lafayette Instrument Company 75

MORE SIGNAL PROCESSING OPTIONS
• Analog Filters
• High Pass
• Low Pass
• Band Pass
• Notch
• Digital Signal Processing
• Manage individual frequency bands
March 23, 2015 © 2014 | Lafayette Instrument Company 76

EDA SENSOR- GOALS
• Sensitive and responsive under a wide range of circumstances
• Minimum level of signal processing necessary to produce usable data
• Manual EDA- does not necessarily provide highest level of diagnostic accuracy
• Automatic EDA- hands-free use in the field and can be adjusted to provide high correlation with manual EDA and ground truth
• Strong correlation between Manual and Automatic EDA for decisions
March 23, 2015 © 2014 | Lafayette Instrument Company 77

LAFAYETTE INSTRUMENT EDA RECORDING DEVICES
• LX4000
• Constant current
• Skin resistance
• LX5000
• Constant current
• Constant voltage
• Skin resistance
• Skin conductance
March 23, 2015 © 2014 | Lafayette Instrument Company 78

EDA NORMAL & RECORDING RANGES
• Normal range for tonic EDA• 50K to 500K Ohms
• 2 to 20 Siemens
• LX4000• 10 kΩ to 2 МΩ
• LX5000• 10 kΩ to 2.3 МΩ • Skin resistance mode
• .25 S to 200 S (5 kΩ to 4 МΩ)• Skin conductance mode
* All onscreen display is in skin resistance units regardless of recording mode
March 23, 2015 © 2014 | Lafayette Instrument Company 79
EDA CURRENT DENSITIES
• LX4000 EDA skin-resistance circuit
• Constant current of 6.7 μA
• LX5000
• Constant voltage w/ a maximum current of 10 μA
• Average EDA electrode area = 2 cm2
• Both devices conform to the published safety
recommendations in psychophysiology
Boucsein, Fowles, Grimmes, Ben-Shakkar, Roth, Dawson,
& Filion (2012)
March 23, 2015 © 2014 | Lafayette Instrument Company 80

EDA ELECTRICAL SAFETY
• Powered by 5V USB
• Electrically isolated to 2000 volts
• No direct path from subject to ground
• No risk of electrical shock
March 23, 2015 © 2014 | Lafayette Instrument Company 81

EDA ISSUES
• All data are a matter of signal and noise
• EDA data can be somewhat noisy for some
individuals
• High frequency noise
• Low frequency noise
March 23, 2015 © 2014 | Lafayette Instrument Company 82

HIGH FREQUENCY ‘NOISE’ IN EDA CHANNEL
Un-smooth jittery tracing for some individuals
• Older analog instruments may have included low-
pass hardware smoothing filters to reduce high
frequency noise
• Most modern polygraph instruments are likely to
use software smoothing
March 23, 2015 © 2014 | Lafayette Instrument Company 83

LOW FREQUENCY ‘NOISE’ IN EDA CHANNEL
• Tonic instability
• Descending EDA data is most common form
• Ascending EDA data is less common
• Well documented in the literature in
psychophysiology
• Lead to the development of Automatic EDA
modes
• Automatic = High pass filtering
March 23, 2015 © 2014 | Lafayette Instrument Company 84

AN EXAMPLE OF DOWNWARD TONIC DRIFT. IN THIS EXAMPLE THE AUTO EDA (GREEN) AND RAW EDA
(PURPLE) SEEM TO GO DIFFERENT DIRECTIONS AT R7.
March 23, 2015 © 2014 | Lafayette Instrument Company 85
Non-Lafayette Chart

EDA SIGNAL PROCESSING
• Hardware processing
• Older instruments
• Resistors and capacitors
• Software processing
• Newer instruments
• Device firmware- programmed into computer chips that are
assembled into the hardware device
• Application software- runs within a computer operating system
March 23, 2015 © 2014 | Lafayette Instrument Company 86

LXSOFTWARE SIGNAL PROCESSING
• No signal processing is done in hardware
• Hardware is used only to acquire data
• No signal processing is done in firmware
• Firmware are used only to send the data to the computer
• All signal processing is done in the application
software
• Greatest degree of accountability and control
March 23, 2015 © 2014 | Lafayette Instrument Company 87
EDA MODES
• Manual (raw) EDA
• Detrended EDA
• Automatic EDA
March 23, 2015 © 2014 | Lafayette Instrument Company 88

MANUAL (RAW) EDA
• Unfiltered
• Minimum signal processing for on screen display
March 23, 2015 © 2014 | Lafayette Instrument Company 89

MANUAL EDA
March 23, 2015 © 2014 | Lafayette Instrument Company 90

DETRENDED EDA
• First introduced in 2007
• Designed to provide reactions that conform
perfectly to those observed when using the Manual
EDA mode
• Designed to manage most common form of tonic
EDA instability
• Descending EDA
• Present version will not correct ascending tonic instability
March 23, 2015 © 2014 | Lafayette Instrument Company 91

DETRENDED EDA
March 23, 2015 © 2014 | Lafayette Instrument Company 92

DESIGN OF THE DETRENDED EDA
• Time series data are monitored for negative and
positive slope changes
• No processing is applied to interpreted response
segments
• Positive slope
• Negative slope is interpreted only for duration
• Negative slope segments are held constant at the
baseline until the slope changes positive
March 23, 2015 © 2014 | Lafayette Instrument Company 93

DETRENDED EDA
Result is an EDA waveform for which reaction
segments conform to those of the Manual EDA while
managing the most common form of tonic instability.
March 23, 2015 © 2014 | Lafayette Instrument Company 94

AUTOMATIC EDA
• Remove high frequency noise via smoothing
• Low-pass filter
• Remove low frequency noise by automatically re-
centering the data
• High-pass filter
March 23, 2015 © 2014 | Lafayette Instrument Company 95

AUTOMATIC EDA
March 23, 2015 © 2014 | Lafayette Instrument Company 96

March 23, 2015 © 2014 | Lafayette Instrument Company 97
LXSOFTWARE 11.2.+ AUTOMATIC EDA

DESIGN GOALS
• Stable EDA tracing that can manage virtually all
forms of tonic instability
• Provide data that have high visual usability
• Auto EDA scores have very strong concordance
with Manual EDA scores
• Diagnostic value of the data is as good or better
than that of Manual EDA data
March 23, 2015 © 2014 | Lafayette Instrument Company 98

METHOD
• Fourier analysis of the frequency spectrum of
interest to TDA tasks in field settings
• Heuristic analysis and feedback from field
examiners
• Statistical analysis of diagnostic value of the data
March 23, 2015 © 2014 | Lafayette Instrument Company 99

FOURIER ANALYSIS
Fast Fourier Transform (FFT) is used to graphically
display the frequencies contained in a time series
waveform.
March 23, 2015 © 2014 | Lafayette Instrument Company 100

SAMPLE CHART- MANUAL EDA
March 23, 2015 © 2014 | Lafayette Instrument Company 101

FOURIER TRANSFORMATION OF MANUAL EDA DATA
March 23, 2015 © 2014 | Lafayette Instrument Company 102
Fourier Transform – Manual EDA

DETRENDED EDA
March 23, 2015 © 2014 | Lafayette Instrument Company 103

FOURIER TRANSFORMATION OF DETRENDED EDA DATA
March 23, 2015 © 2014 | Lafayette Instrument Company 104
Fourier transform – Detrended EDA

AUTO EDA
• Low-pass (smoothing) corner frequencies were
evaluated mathematically (FFT) and heuristically
from .2hz to .5hz
• High-pass (centering) corner frequencies were
evaluated mathematically (FFT) and heuristically
from .01hz to .05hz
• Visual usability and diagnostic coefficients
peaked at
• Low-pass fc = .2hz
• High-pass fc = .03hz
March 23, 2015 © 2014 | Lafayette Instrument Company 105

FOURIER TRANSFORM- AUTO EDA
March 23, 2015 © 2014 | Lafayette Instrument Company 106

SAMPLE CHART- AUTO EDA
March 23, 2015 © 2014 | Lafayette Instrument Company 107

EDA ISSUES
Processing the EDA signal may change the data such
that occasional differences in EDA scores may be
observed when comparing the data in Manual and
Automatic modes
March 23, 2015 © 2014 | Lafayette Instrument Company 108

March 23, 2015 © 2014 | Lafayette Instrument Company 109
WHICH EDA MODE IS BEST?

ANSWER- TAKING AN “EVIDENCE-BASED” APPROACH
• The mode with the strongest diagnostic coefficient
• Diagnostic coefficient is calculated as the
coefficient of determination using the point biserial
correlation of the logged R/C ratio and the binary
case status
• Coefficient of determination = R2
• Pronounced “R squared”
• Also referred to as the “criterion coefficient”
March 23, 2015 © 2014 | Lafayette Instrument Company 110

CRITERION COEFFICIENT
• Coefficient of determination = R2
• R = point-biserial correlation coefficient
• Logged R/C ratios and binary case criterion state
• More conservative than proportion of correct
scores
• Some scores are correct due to random chance
• Proportion of guilt/innocent cases that is explained
by the EDA data
March 23, 2015 © 2014 | Lafayette Instrument Company 111

MANUAL EDA MODE
• R2 = .476
• 47.6% of the variance in guilt vs innocent case
status was explained by the Manual EDA
• Consistent with trend of data suggesting that EDA
data account for approximately ½ of the final score
and test result
March 23, 2015 © 2014 | Lafayette Instrument Company 112

DETRENDED EDA MODE
• R2 = .476
• 47.6% of the variance in guilt vs innocent case
status was explained by the Detrended EDA
• Perfect concordance with the Manual EDA
• Detrended EDA mode performs as intended
March 23, 2015 © 2014 | Lafayette Instrument Company 113

AUTOMATIC EDA MODE
• R2 = .492
• 49.2% of the variance in guilt vs innocent case
status was explained by the Automatic EDA
• Strongest criterion coefficient observed
• Explains slight more variance in case status
compared to Manual EDA and Detrended EDA
• Difference is not significant
• Automatic EDA is as good or better
March 23, 2015 © 2014 | Lafayette Instrument Company 114

LAFAYETTE RECOMMENDS
• All EDA Modes work well
• No EDA Mode outperforms others at a statistically
significant level
• All EDA Modes have advantages and
disadvantages
March 23, 2015 © 2014 | Lafayette Instrument Company 115

EDA MODES- PROS AND CONS
• Manual EDA
• Greatest user control
• Most noise
• Detrended EDA
• Manage most tonic instability while maintaining perfect
concordance with Manual EDA reactions
• Will sometimes mask all Tonic EDA
• Automatic EDA
• Manage all forms of tonic instability
• Strongest criterion coefficient
March 23, 2015 © 2014 | Lafayette Instrument Company 116

LAFAYETTE RECOMMENDS
• Use the EDA Mode you find works best when
collecting & reviewing data
• Use the EDA Mode required by agency regulations
• Use the EDA Mode you can defend most effectively
• Consider using the Automatic EDA Mode
March 23, 2015 © 2014 | Lafayette Instrument Company 117

TAKE HOME POINTS
• All signals require processing
• Manual data is processed with the minimum level of
processing necessary to produce satisfying and
interpretable data
• Lafayette offers a complete range of accurate and
sophisticated EDA solutions
• Complete manual control
• Hands-off automatic control with accurate data
• Traditional and improved automatic mode
• Accountable and transparent descriptions of signal
processing
March 23, 2015 © 2014 | Lafayette Instrument Company 118

March 23, 2015 © 2014 | Lafayette Instrument Company 119
BLOOD PRESSURE

RELATIVE BLOOD PRESSURE-CARDIOGRAPH (1)
The cardiovascular readings observed during a
psychophysiological detection of deception
examination change following emotion evoking
questions. The changes can be observed in the
baseline and tracing amplitude waveform
recordings.
March 23, 2015 © 2014 | Lafayette Instrument Company 120

RELATIVE BLOOD PRESSURE-CARDIOGRAPH (2)
• The cardiovascular circulation is a closed system
consisting of the heart muscle, arteries, capillaries,
and veins.
• In polygraphy, we are primarily concerned with
observing changes that occur in the heart muscle
and blood vessels through continuous
measurements obtained with a partially inflated
blood-pressure cuff.
March 23, 2015 © 2014 | Lafayette Instrument Company 121

RELATIVE BLOOD PRESSURE-CARDIOGRAPH (3)
• Emotion-evoking questions are known to cause a
baseline arousal and sometimes a change in pulse
amplitude.
• Baseline arousal, a diagnostic feature routinely
discussed in polygraph literature, is a rise in the pulse
waveform from a pre-stimulus level.
• Previous investigators have reported the primary
cause of baseline arousal is a change in relative
blood pressure.
March 23, 2015 © 2014 | Lafayette Instrument Company 122

RELATIVE BLOOD PRESSURE-CARDIOGRAPH (4)
• Blood pressure is determined by cardiac output
and peripheral resistance.
• Cardiac output is the amount of blood the heart is
pumping for a given time period.
• Cardiac output is a function of stroke volume times
the number of beats per minute.
• Stroke volume is how much the heart pumps
(ml/beat) and is a function of how hard the heart
beats (contractile force) and how much blood is
available to pump (end diastolic volume, or EDV).
March 23, 2015 © 2014 | Lafayette Instrument Company 123

RELATIVE BLOOD PRESSURE-CARDIOGRAPH (5)
• EDV is the volume of blood in a ventricle at the end of filling.
• The greater the EDV, the greater the distention (stretching) of the ventricle.
• An increase in EDV increases the preload on the heart and, through the Frank-Starling Mechanism increases the amount of blood ejected from the ventricle during systole.
• End diastolic volume is generally controlled by venous return or the blood returned to the venae cavae prior to being delivered to the right atrium.
• Bainbridge (1915) observed that right atrial distention produced an increase in heart rate (Bainbridge reflex).
March 23, 2015 © 2014 | Lafayette Instrument Company 124

RELATIVE BLOOD PRESSURE-CARDIOGRAPH (6)
• There are two primary factors that aid to increase venous return; the respiratory pump and the muscular pump.
• The respiratory pump describes pressure changes in the venae cavae that result from breathing. As we inhale, chest pressure decreases, negative pressure is generated and blood is “sucked” back towards the heart. The greater the depth or length of inhalation, the greater the amount of negative pressure influence created for venous return.
• The muscular pump describes the manner in which the skeletal muscle contraction presses against veins to force blood back towards the heart.
March 23, 2015 © 2014 | Lafayette Instrument Company 125

RELATIVE BLOOD PRESSURE-CARDIOGRAPH (7)
• Respiratory Sinus Arrhythmia (RSA) is a phenomenon that was first described by Ludwig in 1847.
• RSA is mediated through the vagal influence of the heart and describes the changes in heart rate as affected by inspiration and expiration.• Nucleus ambiguus provide myelinated B fiber innervation to
supra-diaphragmatic structures (airway and heart).
• Changes in RSA are affected by frequency of respiration and tidal volume (in consciously made respiration) and can result in respiratory blood pressure fluctuations (RBPF).• During slowed breathing, SNS can contribute to RSA resulting
in chronotropic and inotropic increases = increased cardiac output.
March 23, 2015 © 2014 | Lafayette Instrument Company 126

RELATIVE BLOOD PRESSURE-CARDIOGRAPH (8)
• In summary, there are several factors affecting
blood pressure
• Cardiac output increases by increasing the heart rate, contractile force or end diastolic volume
• Altering the diameter of the blood vessel changes
peripheral resistance to flow
• Any combination of these factors can result in a rise
in blood pressure
March 23, 2015 © 2014 | Lafayette Instrument Company 127

RESPIRATORY BLOOD PRESSURE FLUCTUATIONS (RBPF)
• During polygraph examinations, the cardiovascular
waveform normally maintains a relatively stable
baseline
• There are times, however, when the baseline is
undulating and renders the value of the data
questionable
• What are some remedies?
• Ensure the cuff is not contacting the subject’s chest
• Move the cuff to the forearm or calf
March 23, 2015 © 2014 | Lafayette Instrument Company 128

March 23, 2015 © 2014 | Lafayette Instrument Company 129
RESPIRATION

RESPIRATION (1)
• One of the required physiological signals in PDD
testing is that of movement associated with
pulmonary ventilation (breathing).
• Respiratory data are generally obtained via a
pneumograph transducer placed around the
thorax and abdomen of the test subject.
March 23, 2015 © 2014 | Lafayette Instrument Company 130

RESPIRATION (2)
• PDD examiners have historically evaluated
breathing movement data through a subjective
approach that relies on the presence or absence of
various signature patterns indicative of deception.
• Timm (1982a; 1982b) introduced the concept of the
Respiration Line Length (RLL) as an objective,
though general, measure of increases or decreases
in respiration activity.
March 23, 2015 © 2014 | Lafayette Instrument Company 131

RESPIRATION (3)
• The primary function of the respiratory system is to
supply the cells of the body with oxygen and to
vacate the body of carbon dioxide.
• Breathing describes the collective actions that
move air into and out of the lungs.
March 23, 2015 © 2014 | Lafayette Instrument Company 132

RESPIRATION (4)
March 23, 2015 © 2014 | Lafayette Instrument Company 133
Breathing involves moving air through the airway (dead air space) composed of the nasal cavity, pharynx, larynx, trachea, bronchi bronchial tree then into the lungs.
The airway, through which the air travels, warms, humidifies and cleans the air
before directing it to the lungs.

VENTILATION DYNAMICS
• The mechanics of breathing generates a pressure differential between the inside and outside of the lungs, causing air to move one direction or the other.
• Air, as with fluids, moves from areas of higher pressure to lower pressure regions.
• The act of breathing causes the pressure inside of the lungs to be lower than that outside and thus air flows inward (Boyle’s Law).
• This negative intrapulmonary pressure is made possible by the expansion of the lungs resulting from the ventilation dynamics of the diaphragmatic and intercostal muscles.
March 23, 2015 © 2014 | Lafayette Instrument Company 134

VENTILATION DYNAMICS (2)
• The muscles of normal, quiet inspiration (eupnea)
include the diaphragm and the external intercostals.
• The diaphragm is a large, domed shaped muscle that
separates the abdominal cavity from the thoracic
cavity. The diaphragm is attached to the sternum and
is the muscle most responsible for eupneic breathing.
• During normal quiet breathing the diaphragm
contracts, causing it to descend about one half inch
into the abdominal cavity. This results in stretching the
thoracic cavity downward, increasing its volume.
March 23, 2015 © 2014 | Lafayette Instrument Company 135

VENTILATION DYNAMICS (3)
March 23, 2015 © 2014 | Lafayette Instrument Company 136
Simultaneously, contraction of the intercostal muscles lift the rib cage and pull the sternum outward, like a handle on a bucket. The lungs are passive, they have no capacity to expand or contract on their own but rather are subject to external forces.The combination of the contractions of the
diaphragmatic and intercostal muscles results in an action that increases the thoracic cavity by approximately 500 milliliters, causing a drop of intrapulmonary pressure of about 1-2 mmHg and air rushes into the lungs.

VENTILATION DYNAMICS (4)
• Expiration during eupnic breathing is passive and is
accomplished through the elastic nature of the
lungs and relaxation of the inspiratory muscles.
• As the muscles relax and the lungs recoil, the
volume of the thoracic cavity decreases and there
is no longer a difference in pressure between the
inside and outside of the lungs.
• Additionally, alveoli ducts and bronchioles have
elastic fibers that recoil inward, expelling air.
March 23, 2015 © 2014 | Lafayette Instrument Company 137

REGULATORY CONTROL OF BREATHING
March 23, 2015 © 2014 | Lafayette Instrument Company 138
Breathing dynamics, are controlled
in part by nuclei and centers in the
brain stem.
The respiratory rhythmicity centers
are located in the lower brain stem,
medulla oblongata, with refining
regulatory centers in the pons.
In the medulla, the rhythmic
respiratory center is comprised of
two distinct respiratory areas known
as the dorsal respiratory group
(DRG) and the ventral respiratory
group (VRG). The DRG neurons are
the primary innervators of the
phrenic nerve and thus the
diaphragm muscle.

REGULATORY CONTROL OF BREATHING (2)
• The VRG contains mostly expiratory neurons.
• The VRG is also involved in innervating the larynx and pharynx via vagal motoneurons which assists in maintaining airway patency.
• During inhalation, the VRG innervates the external intercostal muscles and has some connection to the phrenic nerve.
• Expiratory neurons originating in the VRG project to the internal intercostal muscles and abdominal muscles but these function mostly during intense and rapid exhalation such as during exercise when passive exhalation would take too long.
March 23, 2015 © 2014 | Lafayette Instrument Company 139
INHIBITION OF BREATHING AND A REVIEW OF THE ORIENTING RESPONSE
• Relative (comparative) breathing movement
inhibition has been found to be a reliable indicator
of arousal during polygraph testing.
• A number of theories have been proposed to
explain the underlying cause of arousal during PDD
testing and many of these incorporate some
reference to the Orienting Response (OR).
• Possibly via Dorsal Motor Nucleus of the Vagus (DMNX)
which innervates using the sub-diaphragmatic,
unmyelinated vagal output.
March 23, 2015 © 2014 | Lafayette Instrument Company 140

OR AND BREATHING MECHANICS
• The orienting response, first described by Pavlov (1927).
• Said to bring an immediate response in both human and animal to changes in their surroundings. Pavlov sometimes called it the “what is it” reaction, and noted it was of great significance for survival.
• Some of the stimuli that are known to cause an OR include: novelty, intensity, color, surprise, a conditioned stimulus, complexity, uncertainty or conflict.
March 23, 2015 © 2014 | Lafayette Instrument Company 141

OR AND BREATHING MECHANICS (2)
• The orienting response increased the probability of survival.
• Pavlov wrote “The biological significance of this reflex is obvious. If the animal were not provided with such a reflex, its life would hang at any moment by a thread”(Pavlov, 1927, p.12).
• Pavlov’s early description of the reaction discussed the postural changes and skeletal responses that seemed to be aimed at an investigatory and assessing response.
• These postural changes include: momentary cessation of motor activity (freezing), an orientation of the head towards the stimulus and an adjustment in receptors (pricking up the ears or a cocking of the head) towards the source of the stimulus.
• Pavlov believed the purpose of the OR was to prepare for better reception and response to a possibly threatening stimulus.
March 23, 2015 © 2014 | Lafayette Instrument Company 142

OR AND BREATHING MECHANICS (3)
• Significant stimuli are said to possess signal value,
and can evoke an enhanced or greater OR.
• The significance or salience of a stimulus can affect
the magnitude of an OR.
• Sokolov wrote that Signal stimuli are stimuli that are
not necessarily novel but rather familiar and
important. From a survival standpoint, it may be
more beneficial to an organism to respond to a
stimulus of known importance than one which is
novel.
March 23, 2015 © 2014 | Lafayette Instrument Company 143

OR AND BREATHING MECHANICS (4)
• Sokolov found that an organism could self-assign
salience to the particular stimulus and this salience
may result from a previous experience or reflect an
innate biologically programmed autonomic or
behavioral response.
• While the OR can be an affectively neutral
response, it may just as well be one that occurs
concomitantly with an emotional stimulus.
March 23, 2015 © 2014 | Lafayette Instrument Company 144

OR AND BREATHING MECHANICS (5)
• Descriptions of the physiological responses
associated with the OR in humans are well
documented (Darrow 1936; Lynn 1966; Sokolov,
1963).
• These include increased skin conductance,
decreased heart rate, vasoconstriction in the limbs,
an initial delay in respiration rate and decrease in
frequency, and an increase in general muscle
tonus.
March 23, 2015 © 2014 | Lafayette Instrument Company 145

OR AND BREATHING MECHANICS (6)
• Reduction in respiration results in quieting, making
the animal less likely to be seen due to reduced
movement and may result in increased olfactory
intake.
• Dilation of the bronchioles reduces resistance which
allows for a sustained level of oxygen intake with
minimized movement associated with pulmonary
ventilation.
March 23, 2015 © 2014 | Lafayette Instrument Company 146

RLL AND ORS
• There is an abundance of empirical data from
polygraph testing supporting the idea that
reduction of respiration line excursion infers salience
and contributes to decisions of truthfulness or
deception.
• Sometimes referred to as RLL
• RLL has become the primary metric by which the
respiration channel is evaluated and arguably, the
OR contributes to some degree to this reduction in
RLL.
March 23, 2015 © 2014 | Lafayette Instrument Company 147

RLL AND ORS (2)
• RLL encompasses several breathing waveform
patterns affecting depth and rate into a single
metric.
• Overall when the subject perceives the question
more salient, the behavior pathway is to conserve
energy until needed.
• Thus when greater salience is perceived cognitively
along with the emotional mix generated out of the
limbic system, an increase in sympathetic arousal is
launched.
March 23, 2015 © 2014 | Lafayette Instrument Company 148

RLL AND ORS (3)
• The receptor mix in the airway receives
norepinephrine resulting in dilation with a
consequent reduction in airflow resistance.
Because air flow is increased through a dilated
airway, diaphragmatic and intercostal muscle
contraction can be reduced which is reflected in
lower respiratory waveform amplitude. As a
consequence not only is the ventilation amplitude
decreased but the respiratory cycles are reduced.
• In sum, the RLL is shortened as question perceived
salience is increased.
March 23, 2015 © 2014 | Lafayette Instrument Company 149

March 23, 2015 © 2014 | Lafayette Instrument Company 150
THE PHOTOELECTRIC PLETHYSMOGRAPH

THE PHOTOELECTRIC PLETHYSMOGRAPH (PLE)
How does it work?
Courtesy of How Equipment Works.com and used
with permission.
http://www.howequipmentworks.com/physics/respi_
measurements/oxygen/oximeter/pulse_oximeter.ht
ml

BLOOD FLOW THROUGH THE CAPILLARIES
March 23, 2015 © 2014 | Lafayette Instrument Company 152

BLOOD FLOW THROUGH THE CAPILLARIES (1)
March 23, 2015 © 2014 | Lafayette Instrument Company 153

PULSE OXIMETRY
March 23, 2015 © 2014 | Lafayette Instrument Company 154

OXYGEN SATURATION
• Pulse oximeters measure oxygen saturation.
• Oxygen enters the lungs and then is passed on into
blood. The blood carries the oxygen to the various
organs in our body.
• Oxygen is carried in our blood is by means of hemoglobin.
• You can imagine hemoglobin molecules(Hb) as "cars" and
our blood vessels as "roads". The oxygen molecules get into
these cars and travel around the body till they reach their
destination.
March 23, 2015 © 2014 | Lafayette Instrument Company 155

HEMOGLOBIN TRANSPORT & O2
SATURATION (1)
March 23, 2015 © 2014 | Lafayette Instrument Company 156

HEMOGLOBIN TRANSPORT & O2
SATURATION (2)
March 23, 2015 © 2014 | Lafayette Instrument Company 157

HEMOGLOBIN TRANSPORT & O2
SATURATION (3)
March 23, 2015 © 2014 | Lafayette Instrument Company 158

PULSE OXIMETRY AND LIGHT (1)
March 23, 2015 © 2014 | Lafayette Instrument Company 159
Pulse oximetry uses light to estimate
oxygen saturation. Light is emitted from
light sources which goes across the pulse
oximeter probe and reaches the light
detector.
If a finger is placed in between the light
source and the light detector, the light
will now have to pass through the finger
to reach the detector. Part of the light
will be absorbed, scattered, or
reflected by the finger and the part not
absorbed, scattered, or reflected
reaches the light detector.

PULSE OXIMETRY AND LIGHT (2)
March 23, 2015 © 2014 | Lafayette Instrument Company 160
The amount of light absorbed depends on the following:
1. Concentration of the light absorbing substance.
2. Length of the light path in the absorbing substance3. The fact that oxyhemoglobin and deoxyhemoglobin absorb red and infrared light differently

PHYSICAL PROPERTY NO.1 : AMOUNT OF LIGHT ABSORBED IS RELATED TO THE AMOUNT OF THE LIGHT ABSORBING SUBSTANCE
March 23, 2015 © 2014 | Lafayette Instrument Company 161
Hemoglobin (Hb) absorbs light. The
amount of light absorbed is proportional to
the concentration of Hb in the blood
vessel.
One blood vessel has a low Hb
concentration and the other blood vessel
has a high Hb concentration.
Each single Hb absorbs some of the light,
so more the Hb per unit area, more is the
light is absorbed. This property is described
in a law in physics called "Beer's Law".
Beer's Law: Amount of light absorbed is
proportional to the concentration of the
light absorbing substance.
By measuring how much light reaches the
light detector, the pulse oximeter knows
how much light has been absorbed.

PHYSICAL PROPERTY NO.2 : AMOUNT OF LIGHT ABSORBED IS PROPORTIONAL TO
THE LENGTH OF THE LIGHT PATH
March 23, 2015 © 2014 | Lafayette Instrument Company 162
Look how both arteries have the same
concentration (same Hb per unit area,
blue square) However, the artery on
right is wider than the one on the left.
The light emitted from the source has
to travel through the artery. The light
travels in a shorter path in the narrow
artery and travels through a longer
path in the wider artery ( paths are
shown as green lines below). The
concentration of Hb is the same in
both arteries, but the light meets more
Hb in the wider artery, since it travels in
a longer path. Therefore, longer the
path the light has to travel, more is the
light absorbed. This property is
described in a law in physics called
"Lambert's Law".
Lambert's Law: Amount of light
absorbed is proportional to the length
of the path that the light has to travel
in the absorbing substance
More vasoconstriction on
the left than on the right

A LITTLE ABOUT LIGHT WAVELENGTH
March 23, 2015 © 2014 | Lafayette Instrument Company 163
All light is composed of waves.
The distance between the "tips"
of the waves is equal to the
wavelength.
Light wavelengths are very short, and the unit of measurement is nanometer (nm) (1 meter = 1,000,000,000 nanometers!).
For an example, the wave on the left has a wavelength of 650 nm and the wave on the right has a longer wavelength of 950 nm

PHYSICAL PROPERTY NO.3 : OXYGENATED BLOOD, DEOXYGENATED
BLOOD, AND LIGHT ABSORPTION
March 23, 2015 © 2014 | Lafayette Instrument Company 164
Blood with more oxygen
(oxyhemoglobin) absorbs more
infrared light than red light
Blood with less oxygen
(deoxyhemoglobin) absorbs
more red light than infrared
light

COMBINING THE OXYGENATED AND DEOXYGENATED GRAPHS
March 23, 2015 © 2014 | Lafayette Instrument Company 165

HUMAN BEINGS NORMALLY HAVE OXYGEN SATURATED BLOOD
March 23, 2015 © 2014 | Lafayette Instrument Company 166
Oxygenated Hb absorbs more
infrared light than red light.
Deoxygenated Hb absorbs
more Red light than Infrared
light
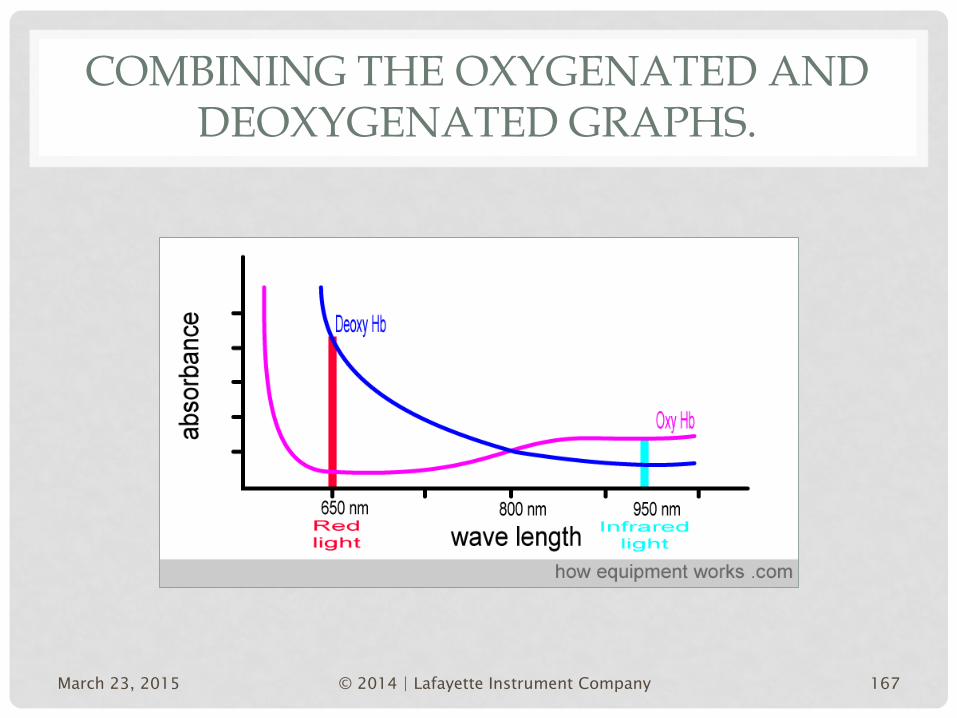
COMBINING THE OXYGENATED AND DEOXYGENATED GRAPHS.
March 23, 2015 © 2014 | Lafayette Instrument Company 167

USING RATIOS OF DIFFERENT LIGHT ABSORPTION
March 23, 2015 © 2014 | Lafayette Instrument Company 168
The ratio of the amount of red light absorbed compared to the amount of infrared light absorbed changes depending on the
amounts of oxygenated Hb and deoxygenated Hb present.

ABSORPTION RATIOS
March 23, 2015 © 2014 | Lafayette Instrument Company 169
Much Infrared light got absorbed and
only a little red light got absorbed. That
means there was a lot of Hb in the
blood.
Much red light was absorbed and only
a little Infrared light was absorbed.
That means there was little Hb in the
blood.
Absorption Absorption

LIGHT THAT IS NOT ABSORBED IS SCATTERED
March 23, 2015 © 2014 | Lafayette Instrument Company 170
Light is shone down into the skin. Blood is not a neat red liquid. Instead,
it is full of various irregular objects such
as red cells etc. This makes the light
scatter, instead of going in a straight
line.

WE WANT OUR PLE TO MEASURE PULSATILE BLOOD VOLUME CHANGES
March 23, 2015 © 2014 | Lafayette Instrument Company 171
In a body part such as a finger, arterial
blood is not the only thing that absorbs
light. Skin and other tissues also absorb
some light. This poses a problem ,
because the pulse oximeter should only
analyze arterial blood while ignoring
the absorbance of light by surrounding
tissues.
One is a thin finger and the other is a
fat finger. The tissues in the thin finger
absorbs only a little extra light, while the
fatter finger shown on the right absorbs
much more light. However, the pulse
oximeter has no way to measure if the
finger is fat or thin, and therefore has
the potential to get confused because
it doesn't know how much light is
absorbed by blood and how much is
absorbed by the tissues surrounding
blood.

SO HOW DO WE FIGURE OUT HOW MUCH LIGHT IS ABSORBED BY THE BLOOD AND HOW MUCH IS ABSORBED
BY “EVERYTHING ELSE”
March 23, 2015 © 2014 | Lafayette Instrument Company 172
Fortunately, there is a clever solution to the problem. The pulse oximeter wants to only analyze arterial blood, ignoring the other tissues around the blood. Luckily, arterial blood is the only thing pulsating in the finger.
Everything else is non pulsating. Any "changing absorbance" must therefore be due to arterial blood.
The pulse oximeter knows that any
absorbance that is not changing , must be
due to non pulsatile things such as skin and
other "non arterial" tissues.
‘Changing absorption’ is represented by the AC signal.
‘Static absorption’ is represented by the DC signal.

‘SEPARATING THE WHEAT FROM THE CHAFF”
March 23, 2015 © 2014 | Lafayette Instrument Company 173
The changing (AC) component is due
to pulsatile arterial blood, the static
(DC) component due to all other
absorption.
Using the total light we can subtract
the static component for a display of
only that which changes in time.

THE CHANGING SIGNAL IS REALLY, REALLY SMALL!
March 23, 2015 © 2014 | Lafayette Instrument Company 174
We have exaggerated the changing
component in the diagrams to help us
understand the principles.
In reality, the changing component is
very small. Typically , only about 2 % of
the total signal is pulsatile (AC).

AN ADDITIONAL PROBLEM
March 23, 2015 © 2014 | Lafayette Instrument Company 175
We are interested in the AC component.
Different light wavelengths produce different patterns of AC absorption.

DIFFERENCE IN AC AMPLITUDE IN RED VERSUS INFRARED LIGHT
March 23, 2015 © 2014 | Lafayette Instrument Company 176
Red Light
Infrared Light
Pulse Oximetry, John T B Moyle, BMJ Publishing Group, ISBN 0-7279-0831-6

WHY CHOOSE INFRARED FOR THE PLE (1)
• Larger difference in AC component compared to visible red light.• The highly oxygenated blood does not absorb much visible
light.
• Very little backscatters to the receptor.
• The difference in backscattered light is less appreciable.
• The highly oxygenated blood is well absorbed in proportion to the amount of blood under the light at any given time.
• The difference in backscattered light is more appreciable.
• The infrared signal (approximately 940 nm) is more stable over time, especially when compared to the red signal (660 nm), which is more susceptible to changes in the oxygen saturation.
• Less affected by ambient light.
March 23, 2015 © 2014 | Lafayette Instrument Company 177

WHY CHOOSE INFRARED FOR THE PLE (2)
• Readily available from commercial manufacturers.
• The majority of research validating the PLE was
conducted using a device operating in the infrared
region.
• There is a huge difference in light absorbed with
OxyHb versus DeoxyHb with visible red light.
• There is little difference in light absorbed between
Oxy Hb and Deoxy HB with IR light.
March 23, 2015 © 2014 | Lafayette Instrument Company 178

IR & RED LIGHT PLE WITH VARIOUS FILTER SETTINGS
March 23, 2015 © 2014 | Lafayette Instrument Company 179
A3- LX4000 PLE with a high pass filter
set to 0.1 second time constant {1.59
Hz} (visible red light)
SE*- IR PLE set to AC mode with a
high pass filter set to 1.59 Hz {infrared
light}
FE- IR PLE set to DC mode, no filtering,
{infrared light}
PL- LX5000 PLE with a 0.33 Hz high
pass filter on the hardware and a 0.5
high pass filter on the software.
(visible red light)
The second trace (SE*) is the best, IR
with a 1.59Hz high pass. The first and
fourth traces use the red light PLE and
show much less reaction than the IR
versions. The third trace shows the
maximum baseline wander that you
would see without the high pass filter.
<IR
<IR
<VR
<VR

PLE FINDINGS FROM HONTS & REAVY (2009) DATA
• N = 249
• No significant difference between PL/DL PLE scores.
• PLE highly correlated with ground truth.
• PLE outperformed or equaled the Pearson
Correlation the cardio component.
March 23, 2015 © 2014 | Lafayette Instrument Company 180

FINAL THOUGHTS
Test data analysis is a process of identifying valid
methods of measuring physiological responses that
can discriminate deception and truth-telling at rates
that are significantly greater than chance.
March 23, 2015 © 2014 | Lafayette Instrument Company 181

WHAT DOES THE POLYGRAPH MEASURE?
• Lies? No.
• Fear? No.
• Polygraph measures an array of physiological responses to a sequence of verbal stimulus questions, for which the resulting data is aggregated and compared with normative data to calculate a statistical probability of error or confidence in a categorical conclusion of deception or truth-telling.
March 23, 2015 © 2014 | Lafayette Instrument Company 182