Prime Oxford City Index - content.knightfrank.com · RESIDENTIAL RESEARCH Source: Knight Frank...
2
750 Up to £400,000 £400,000 - £500,000 £500,000 - £ ,000 £750,000 - £1,000,000 £1,000,000+ OXFORD SALES MARKET INSIGHT 2018 Source: Knight Frank Research / VOA Source: Land Registry 2000-present 1973-1999 1945-1972 1900-1939 Pre-1900 17% 27% 22% 20% 14% Property prices in Oxford Achieved prices, year to January 2018 William Kirkland, Head of Knight Frank’s Oxford office “Prices have edged down over the last year but this reflects a greater flexibility on the part of vendors, who have become more accepting of the need to price competitively following the introduction of higher rates of stamp duty. Demand for family homes in the city centre remains strong – driven by a desire to be close to some of the city’s excellent schools. As asking prices better align with buyer expectations, we expect to see more sales being agreed. More recently, we have seen an uptick in new listings, which should help underpin activity in 2018.” Market update Average prime prices in Oxford fell by 1.7% in the year to March 2018. However, a fall in values should be viewed in the context of a market continuing to adjust to higher rates of stamp duty, as well as wider economic and political uncertainty following Brexit. Indeed, despite the fall, demand remained strong with 29% more new prospective buyers registering in the year to April 2018 than during the previous 12 month period. Viewings rose 20% over the same time and the number of offers made on properties being offered for sale by Knight Frank increased 41%. -1.7% Annual prime price change 0.2% Quarterly prime price change Oxford: Fact file Property type all properties Property age all properties Detached Semi-detached Terraced Flat 35% 33% 25% 7%
Transcript of Prime Oxford City Index - content.knightfrank.com · RESIDENTIAL RESEARCH Source: Knight Frank...

Contains OS data © Crown Copyright and database right 2017
750
Up to £400,000
£400,000 - £500,000
£500,000 - £ ,000
£750,000 - £1,000,000
£1,000,000+
OXFORD SALES MARKET INSIGHT 2018
Source: Knight Frank Research / VOA Source: Land Registry
2000-present
1973-1999
1945-1972
1900-1939
Pre-1900 17%
27%
22%
20%
14%
Property prices in Oxford Achieved prices, year to January 2018
William Kirkland, Head of Knight Frank’s Oxford office
“ Prices have edged down over the last year but this reflects a
greater flexibility on the part of vendors, who have become
more accepting of the need to price competitively following the
introduction of higher rates of stamp duty. Demand for family
homes in the city centre remains strong – driven by a desire to
be close to some of the city’s excellent schools. As asking prices
better align with buyer expectations, we expect to see more
sales being agreed. More recently, we have seen an uptick in new
listings, which should help underpin activity in 2018.”
Market update
Average prime prices in Oxford
fell by 1.7% in the year to March
2018. However, a fall in values
should be viewed in the context
of a market continuing to adjust
to higher rates of stamp duty,
as well as wider economic and
political uncertainty following
Brexit. Indeed, despite the fall,
demand remained strong with
29% more new prospective
buyers registering in the year
to April 2018 than during the
previous 12 month period.
Viewings rose 20% over the
same time and the number of
offers made on properties being
offered for sale by Knight Frank
increased 41%.
-1.7% Annual prime price change
0.2% Quarterly prime price change
Oxford: Fact file
Property type all properties
Property age all properties
Detached
Semi-detached
Terraced
Flat 35%
33%
25%
7%
RESIDENTIAL RESEARCH
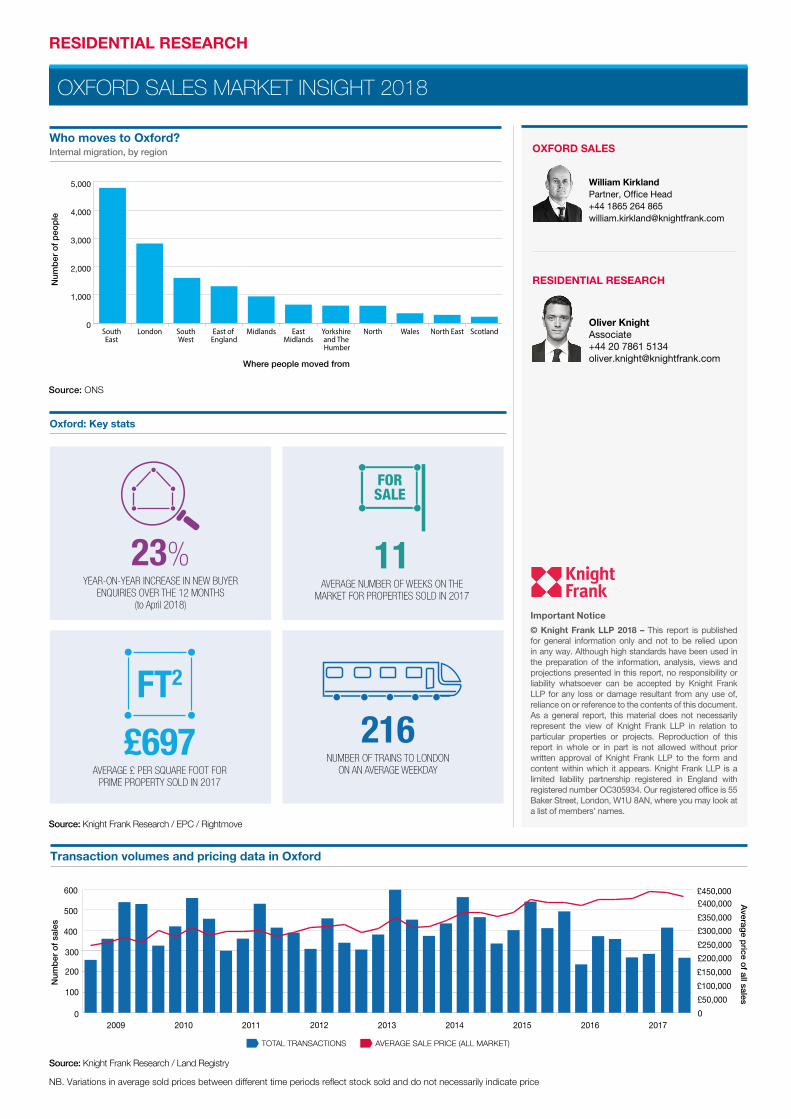
Source: Knight Frank Research / Land Registry
NB. Variations in average sold prices between different time periods reflect stock sold and do not necessarily indicate price
OXFORD SALES MARKET INSIGHT 2018
Oxford: Key stats
0
100
200
300
400
500
600
TOTAL TRANSACTIONS AVERAGE SALE PRICE (ALL MARKET)
Averag
e price o
f all salesN
umb
er o
f sa
les
2009 2010 2011 2012 2013 2014 2015 2016 20170
£50,000
£100,000
£150,000
£200,000
£250,000
£300,000
£350,000
£400,000£450,000
Source: Knight Frank Research / EPC / Rightmove
Important Notice
© Knight Frank LLP 2018 – This report is published for general information only and not to be relied upon in any way. Although high standards have been used in the preparation of the information, analysis, views and projections presented in this report, no responsibility or liability whatsoever can be accepted by Knight Frank LLP for any loss or damage resultant from any use of, reliance on or reference to the contents of this document. As a general report, this material does not necessarily represent the view of Knight Frank LLP in relation to particular properties or projects. Reproduction of this report in whole or in part is not allowed without prior written approval of Knight Frank LLP to the form and content within which it appears. Knight Frank LLP is a limited liability partnership registered in England with registered number OC305934. Our registered office is 55 Baker Street, London, W1U 8AN, where you may look at a list of members’ names.
£697
FT2
AVERAGE £ PER SQUARE FOOT FOR PRIME PROPERTY SOLD IN 2017
216NUMBER OF TRAINS TO LONDON
ON AN AVERAGE WEEKDAY
11AVERAGE NUMBER OF WEEKS ON THE
MARKET FOR PROPERTIES SOLD IN 2017
23%YEAR-ON-YEAR INCREASE IN NEW BUYER
ENQUIRIES OVER THE 12 MONTHS(to April 2018)
£697
FT2
AVERAGE £ PER SQUARE FOOT FOR PRIME PROPERTY SOLD IN 2017
216NUMBER OF TRAINS TO LONDON
ON AN AVERAGE WEEKDAY
11AVERAGE NUMBER OF WEEKS ON THE
MARKET FOR PROPERTIES SOLD IN 2017
23%YEAR-ON-YEAR INCREASE IN NEW BUYER
ENQUIRIES OVER THE 12 MONTHS(to April 2018)
£697
FT2
AVERAGE £ PER SQUARE FOOT FOR PRIME PROPERTY SOLD IN 2017
216NUMBER OF TRAINS TO LONDON
ON AN AVERAGE WEEKDAY
11AVERAGE NUMBER OF WEEKS ON THE
MARKET FOR PROPERTIES SOLD IN 2017
23%YEAR-ON-YEAR INCREASE IN NEW BUYER
ENQUIRIES OVER THE 12 MONTHS(to April 2018)
£697
FT2
AVERAGE £ PER SQUARE FOOT FOR PRIME PROPERTY SOLD IN 2017
216NUMBER OF TRAINS TO LONDON
ON AN AVERAGE WEEKDAY
11AVERAGE NUMBER OF WEEKS ON THE
MARKET FOR PROPERTIES SOLD IN 2017
23%YEAR-ON-YEAR INCREASE IN NEW BUYER
ENQUIRIES OVER THE 12 MONTHS(to April 2018)
Source: ONS
Who moves to Oxford? Internal migration, by region
Num
ber
of
peo
ple
Where people moved from
0
1,000
2,000
3,000
4,000
5,000
ScotlandNorth EastWalesNorthYorkshire and The Humber
EastMidlands
MidlandsEast of England
SouthWest
LondonSouthEast
OXFORD SALES
William KirklandPartner, Office Head+44 1865 264 [email protected]
Transaction volumes and pricing data in Oxford
RESIDENTIAL RESEARCH
Oliver KnightAssociate+44 20 7861 [email protected]