PRIMARY CENSUS ABSTRACT - tn · PDF filePopulation of India - Census 2011 ... Senapati...
57
1 PRIMARY CENSUS ABSTRACT CENSUS OF INDIA 2011 DATA HIGHLIGHTS
Transcript of PRIMARY CENSUS ABSTRACT - tn · PDF filePopulation of India - Census 2011 ... Senapati...

1
PRIMARY CENSUS ABSTRACT
CENSUS OF INDIA 2011
DATA HIGHLIGHTS
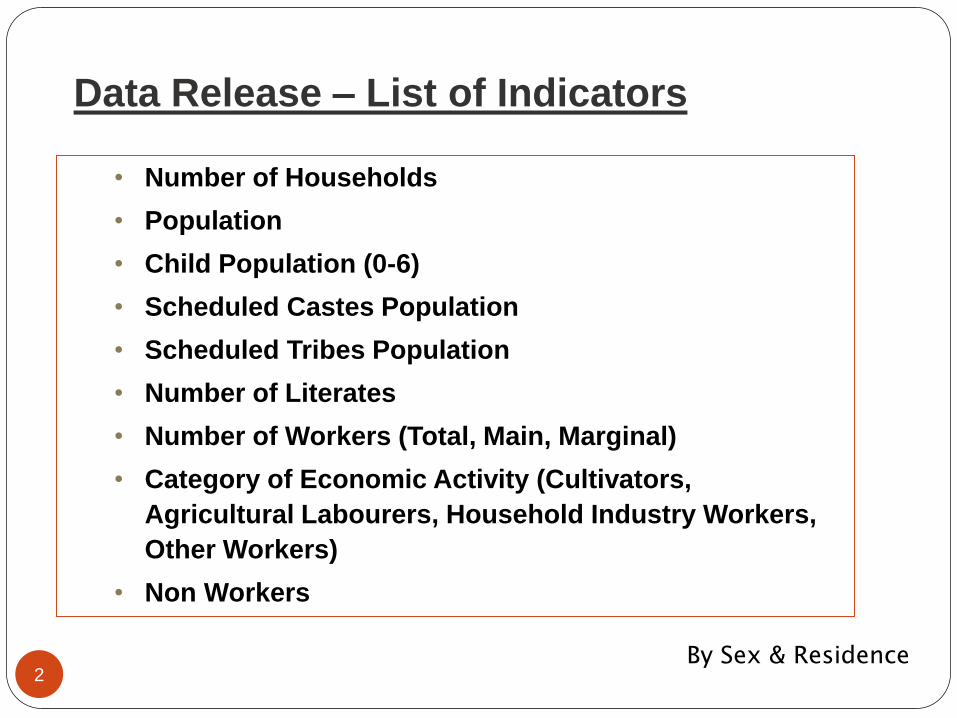
Data Release – List of Indicators
2
• Number of Households
• Population
• Child Population (0-6)
• Scheduled Castes Population
• Scheduled Tribes Population
• Number of Literates
• Number of Workers (Total, Main, Marginal)
• Category of Economic Activity (Cultivators,
Agricultural Labourers, Household Industry Workers,
Other Workers)
• Non Workers
By Sex & Residence

DATA HIGHLIGHTS
3
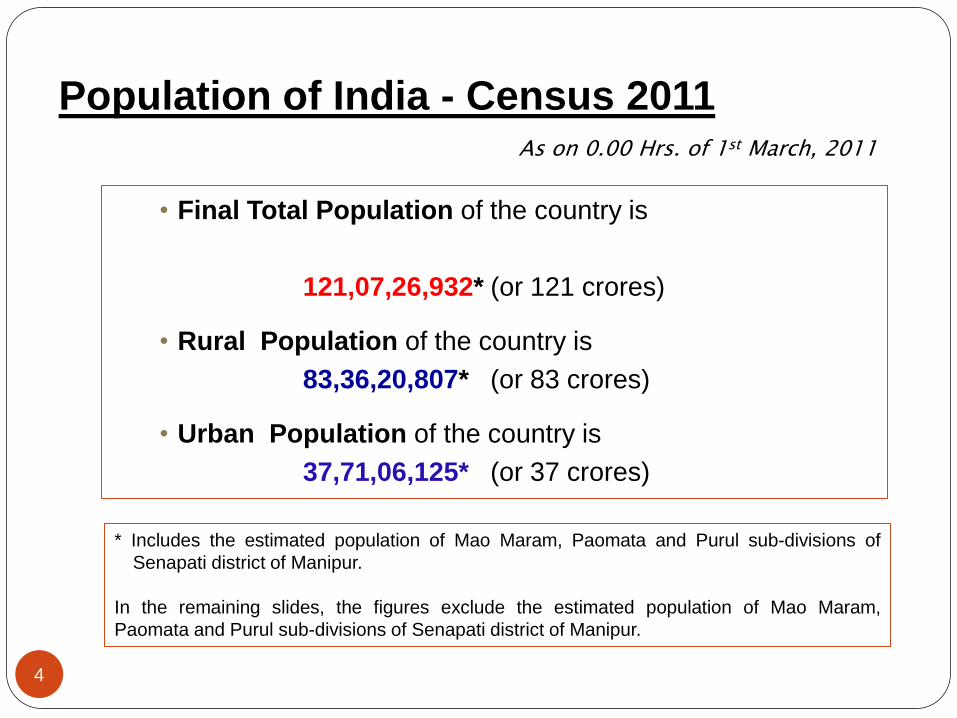
Population of India - Census 2011
• Final Total Population of the country is
121,07,26,932* (or 121 crores)
• Rural Population of the country is
83,36,20,807* (or 83 crores)
• Urban Population of the country is
37,71,06,125* (or 37 crores)
As on 0.00 Hrs. of 1st March, 2011
* Includes the estimated population of Mao Maram, Paomata and Purul sub-divisions of
Senapati district of Manipur.
In the remaining slides, the figures exclude the estimated population of Mao Maram,
Paomata and Purul sub-divisions of Senapati district of Manipur.
4

Population of Tamil Nadu - Census 2011
• Final Total Population of the State is
7,21,47,030 (or 7.2 crores)
• Rural Population of the state is
3,72,29,590 (or 3.7 crores)
• Urban Population of the state is
3,49,17,440 (or 3.4 crores)
As on 0.00 Hrs. of 1st March, 2011
5
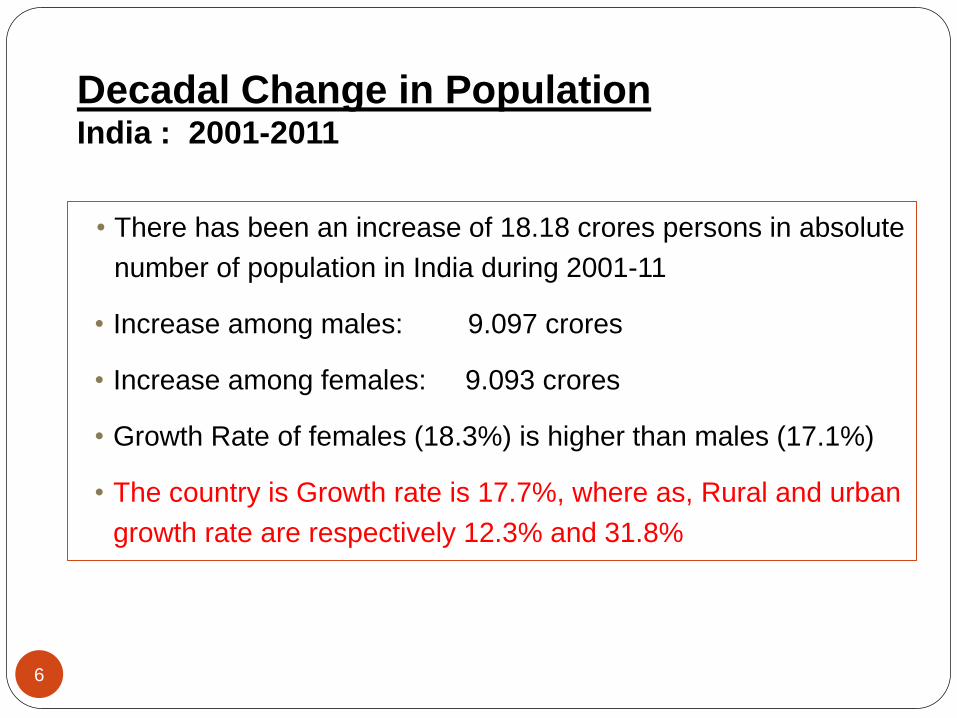
Decadal Change in Population India : 2001-2011
• There has been an increase of 18.18 crores persons in absolute
number of population in India during 2001-11
• Increase among males: 9.097 crores
• Increase among females: 9.093 crores
• Growth Rate of females (18.3%) is higher than males (17.1%)
• The country is Growth rate is 17.7%, where as, Rural and urban
growth rate are respectively 12.3% and 31.8%
6
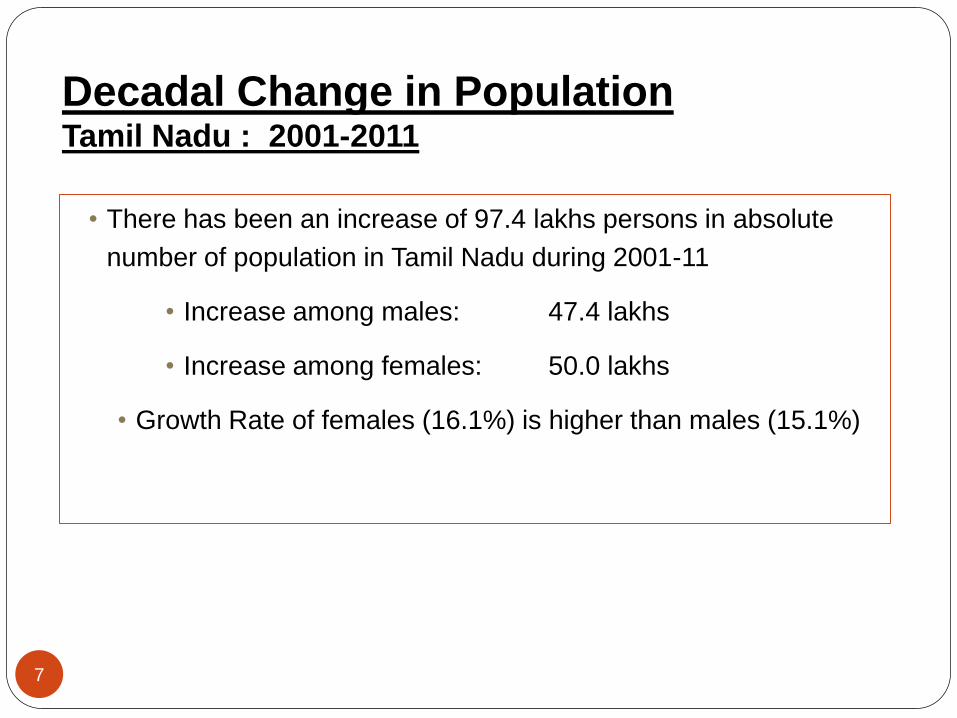
Decadal Change in Population Tamil Nadu : 2001-2011
• There has been an increase of 97.4 lakhs persons in absolute
number of population in Tamil Nadu during 2001-11
• Increase among males: 47.4 lakhs
• Increase among females: 50.0 lakhs
• Growth Rate of females (16.1%) is higher than males (15.1%)
7

Decadal Change in Population Tamilnadu : 2001-2011
• Population of Tamilnadu grew by 15.6% during 2001-11,
against 11.7% in the previous decade
• Among the Districts, highest decadal growth in population has
been recorded in Kancheepuram (39.0%) and decline in
decadal growth recorded in The Nilgiris District (-3.5 %).
• 11 Districts have recorded population growth above 15%.
8

Tamil Nadu - Population, 2011
9

Tamil Nadu - Percentage of Decadal change :
10
1991-2001 2001 -2011

16.4 13.0 13.3
-5.1
6.6
21.9 19.3 20.0
18.1
12.3
-7.5
-5.0
-2.5
0.0
2.5
5.0
7.5
10.0
12.5
15.0
17.5
20.0
22.5
25.0
1961-71 1971-81 1981-91 1991-01 2001-11
De
ca
da
l c
ha
ng
e
(Rural)
TAMIL NADU INDIA
38.6
28.0
19.6
44.1
27.0
38.2
46.1
36.4
31.5 31.8
15.0
18.0
21.0
24.0
27.0
30.0
33.0
36.0
39.0
42.0
45.0
48.0
1961-71 1971-81 1981-91 1991-01 2001-11
De
ca
da
l c
ha
ng
e
(Urban)
TAMIL NADU INDIA
Percentage of Decadal change : 1961-2011
India and Tamil Nadu
11

Tamil Nadu - Proportion of Rural and Urban
Population
during the last five decades
12

Density of Population - India : 2011
• Delhi (11,320) turns out to be the most densely inhabited followed
by Chandigarh (9,258), among all States/UTs, both in 2001 and
2011 Census.
• Among the major States, Bihar occupies the first position with a
density of 1106, surpassing West Bengal which occupied the first
position during 2001.
• The minimum population density works out in Arunachal Pradesh
(17) for both 2001 and 2011 Census.
Density of Population , India
2001 2011
325 382
(Persons per sq. km.)
13
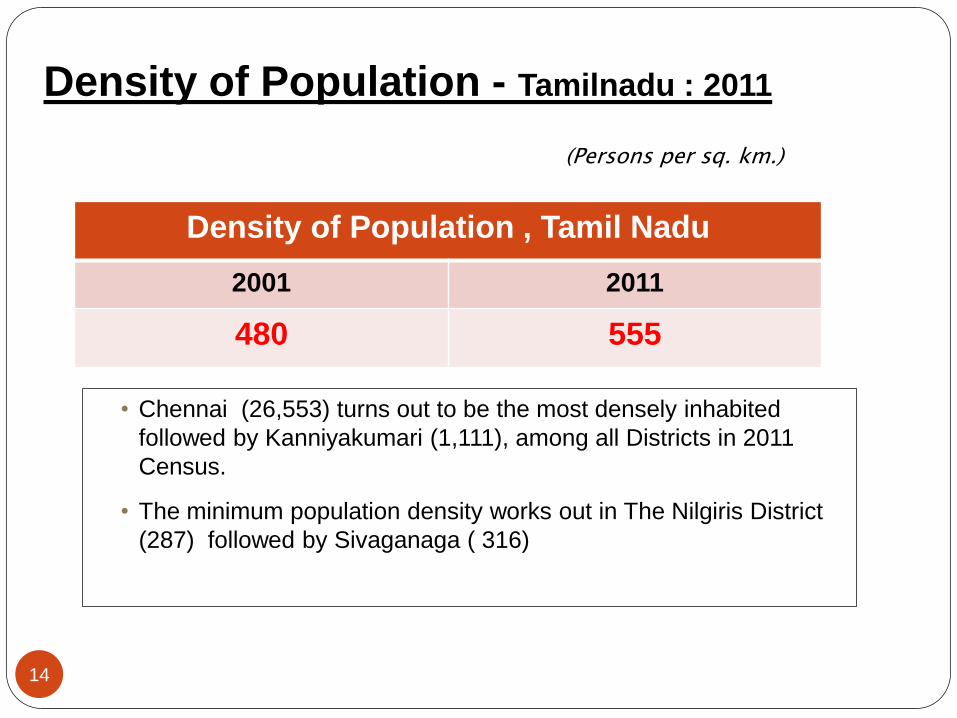
Density of Population - Tamilnadu : 2011
• Chennai (26,553) turns out to be the most densely inhabited
followed by Kanniyakumari (1,111), among all Districts in 2011
Census.
• The minimum population density works out in The Nilgiris District
(287) followed by Sivaganaga ( 316)
Density of Population , Tamil Nadu
2001 2011
480 555
(Persons per sq. km.)
14
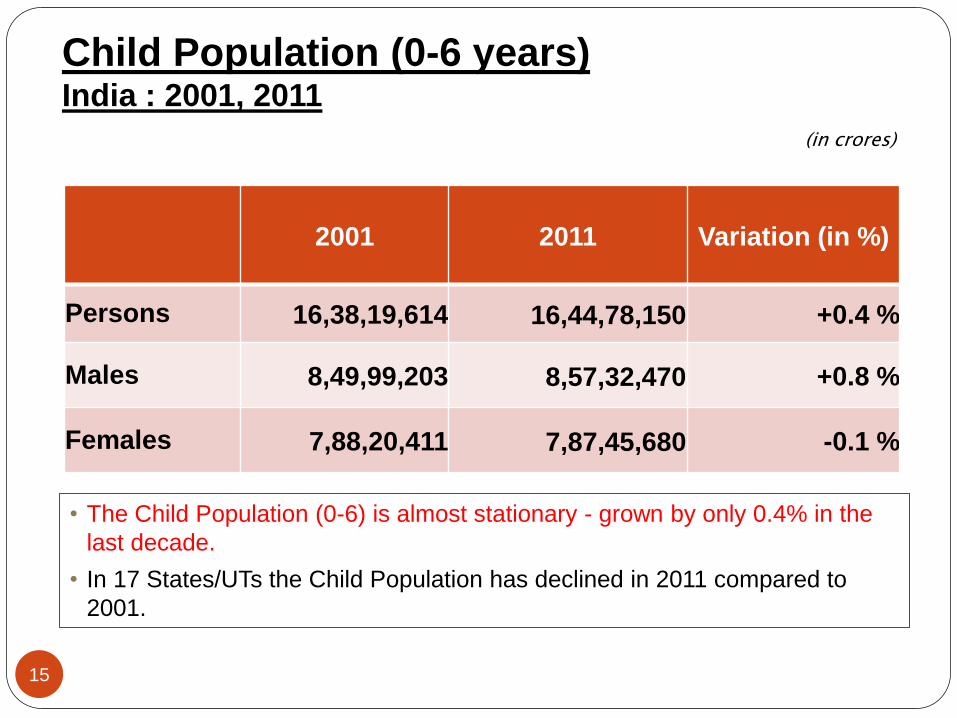
Child Population (0-6 years) India : 2001, 2011
2001 2011 Variation (in %)
Persons 16,38,19,614 16,44,78,150 +0.4 %
Males 8,49,99,203 8,57,32,470 +0.8 %
Females 7,88,20,411 7,87,45,680 -0.1 %
• The Child Population (0-6) is almost stationary - grown by only 0.4% in the
last decade.
• In 17 States/UTs the Child Population has declined in 2011 compared to
2001.
(in crores)
15
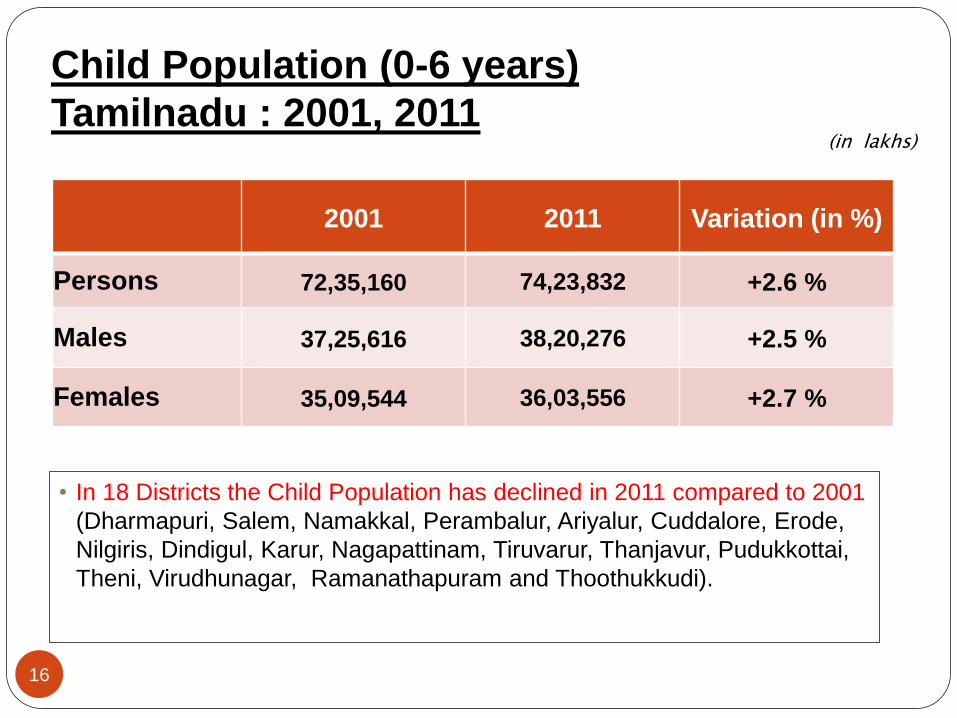
Child Population (0-6 years)
Tamilnadu : 2001, 2011
2001 2011 Variation (in %)
Persons 72,35,160 74,23,832 +2.6 %
Males 37,25,616 38,20,276 +2.5 %
Females 35,09,544 36,03,556 +2.7 %
• In 18 Districts the Child Population has declined in 2011 compared to 2001
(Dharmapuri, Salem, Namakkal, Perambalur, Ariyalur, Cuddalore, Erode,
Nilgiris, Dindigul, Karur, Nagapattinam, Tiruvarur, Thanjavur, Pudukkottai,
Theni, Virudhunagar, Ramanathapuram and Thoothukkudi).
(in lakhs)
16

Sex Composition of Child Population (0-6)
Tamil Nadu 2011
• The total number of children in Tamil Nadu 74 lakhs, about 1.88
lakhs more than the number recorded in 2001
• Both Male and Female Child (0-6) population have increased
marginally during 2001-11
• Proportion of Child population for the State is 11.5%, 11 Districts
recorded proportion of child population less than 11.5% and 21
Districts recorded proportion of Child population greater than 11.5%
17
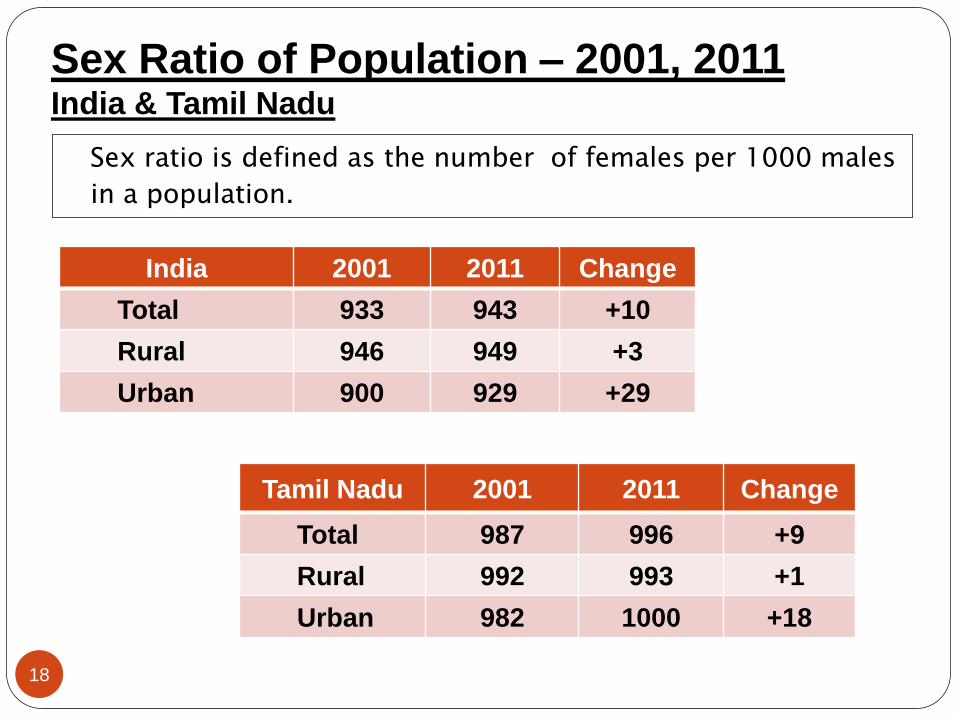
Sex Ratio of Population – 2001, 2011 India & Tamil Nadu
Tamil Nadu 2001 2011 Change
Total 987 996 +9
Rural 992 993 +1
Urban 982 1000 +18
India 2001 2011 Change
Total 933 943 +10
Rural 946 949 +3
Urban 900 929 +29
Sex ratio is defined as the number of females per 1000 males
in a population.
18

992
978 977
974
987
996
1003
990 987
981
992
993
963
951
956 960
982
1000
950
960
970
980
990
1000
1010
1961 1971 1981 1991 2001 2011
Se
x R
ati
o
Total Rural Urban
Sex Ratio by residence : 1961-2011 -
Tamil Nadu
19

Districts Ranked by Sex Ratio : Tamil Nadu-2011
Top 5 Districts Sex Ratio Bottom 5 Districts Sex Ratio
The Nilgiris 1042 Dharmapuri 946
Thanjavur 1035 Salem 954
Nagapattinam 1025 Krishnagiri 958
Tirunelveli 1023 Ramanathapuram 983
Thoothukkudi 1023 Namakkal 986
20
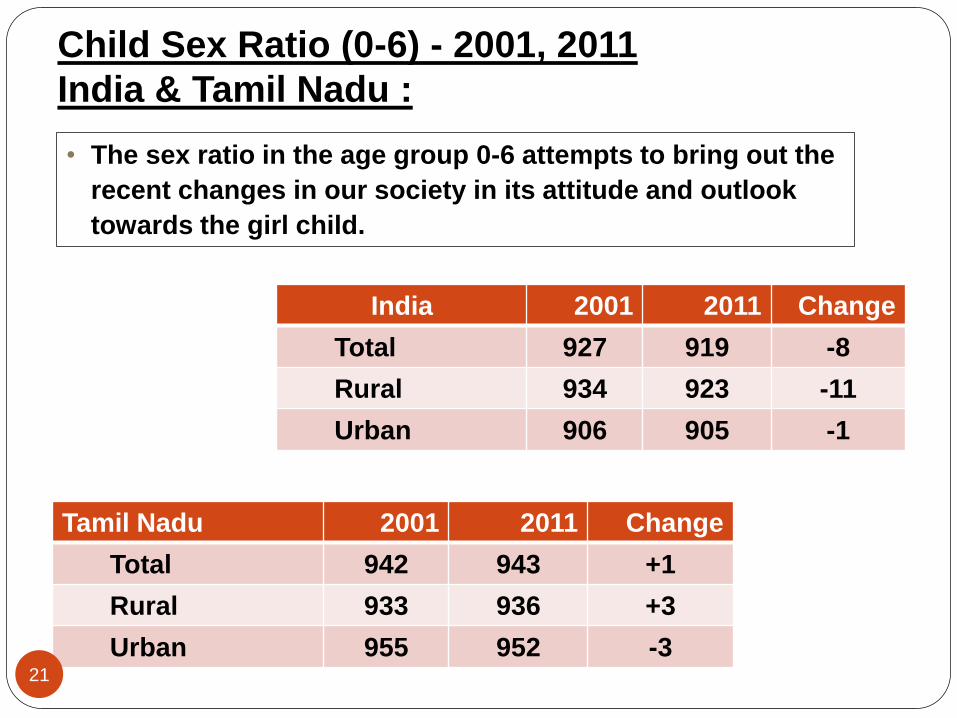
Child Sex Ratio (0-6) - 2001, 2011
India & Tamil Nadu :
Tamil Nadu 2001 2011 Change
Total 942 943 +1
Rural 933 936 +3
Urban 955 952 -3
India 2001 2011 Change
Total 927 919 -8
Rural 934 923 -11
Urban 906 905 -1
• The sex ratio in the age group 0-6 attempts to bring out the
recent changes in our society in its attitude and outlook
towards the girl child.
21
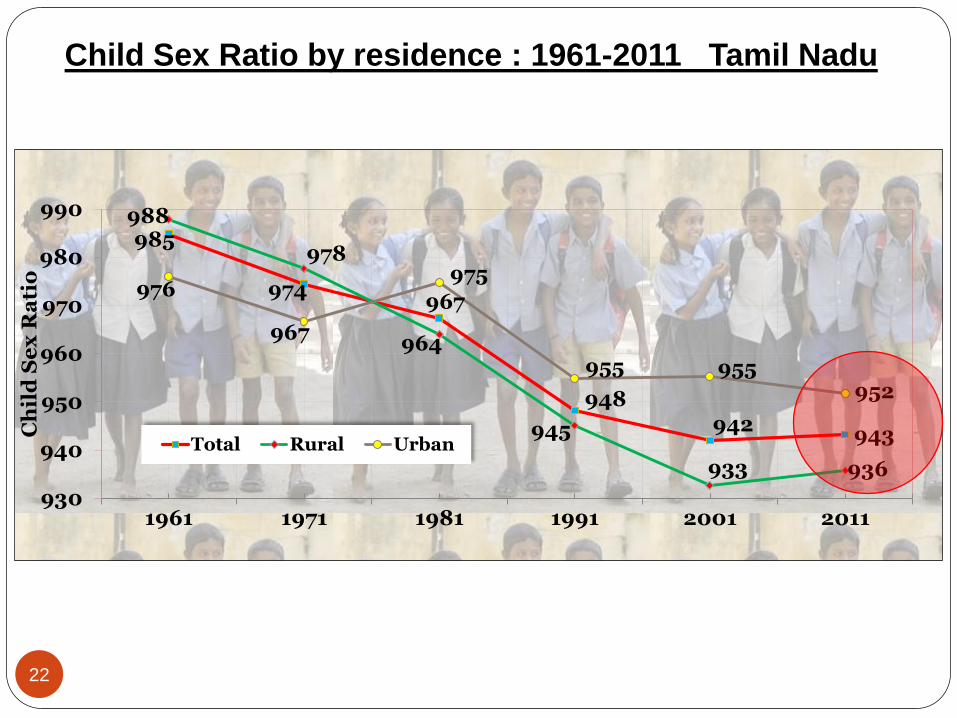
985
974 967
948 942
943
988
978
964
945
933 936
976
967
975
955 955 952
930
940
950
960
970
980
990
1961 1971 1981 1991 2001 2011
Ch
ild
Se
x R
ati
o
Total Rural Urban
Child Sex Ratio by residence : 1961-2011 Tamil Nadu
22

Districts Ranked - Tamil Nadu Child Sex Ratio (0-6) 2011
Top 5 Ranks Sex Ratio
(0-6) Bottom 5 Ranks
Sex Ratio
(0-6)
The Nilgiris 985 Cuddalore 896
Kanniyakumari 964 Ariyalur 897
Thoothukkudi 963 Perambalur &
Dharmapuri 913
Ramanathapuram 961 Namakkal 914
Sivaganga,
Tirunelveli &
Pudukkottai
960 Salem 916
23
Scheduled Caste (SC)
&
Scheduled Tribe (ST)
24

Population of Scheduled Castes – India &Tamil Nadu : 2011
Tamil Nadu 2001 2011 Variation (%)
Persons 1,18,57,504 1,44,38,445 +21.8 %
Males 59,32,925 72,04,687 +21.4 %
Females 59,24,579 72,33,758 +22.1 %
India 2001 2011 Variation (%)
Persons 16,66,35,700 20,13,78,086 +20.8 %
Males 8,60,88,760 10,35,35,165 +20.3 %
Females 8,05,46,940 9,78,42,921 +21.5 %
25
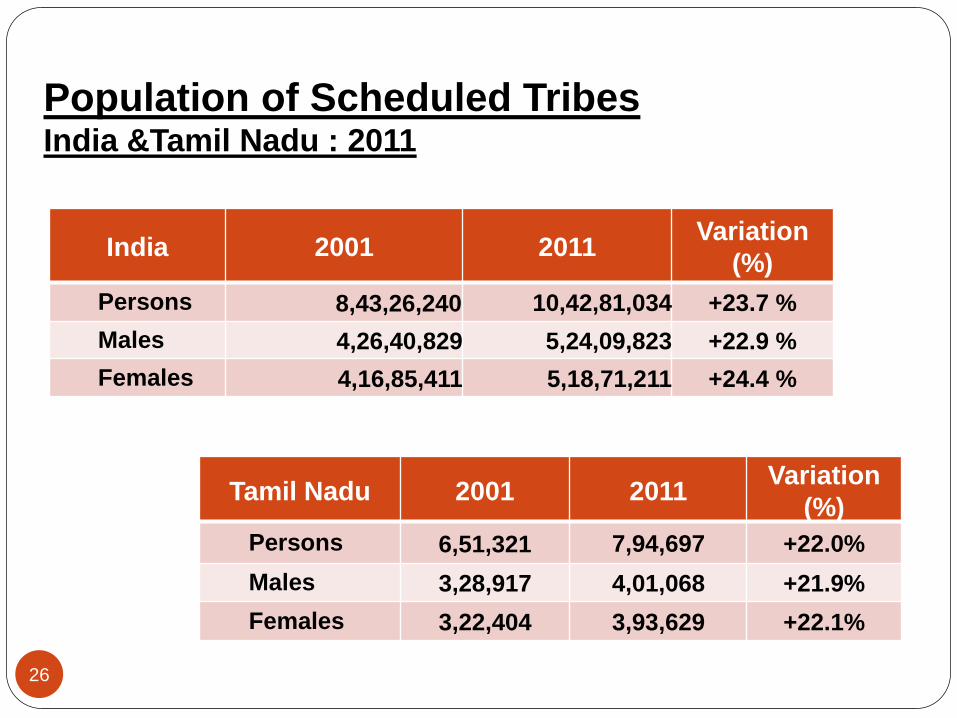
Population of Scheduled Tribes India &Tamil Nadu : 2011
Tamil Nadu 2001 2011 Variation
(%)
Persons 6,51,321 7,94,697 +22.0%
Males 3,28,917 4,01,068 +21.9%
Females 3,22,404 3,93,629 +22.1%
India 2001 2011 Variation
(%)
Persons 8,43,26,240 10,42,81,034 +23.7 %
Males 4,26,40,829 5,24,09,823 +22.9 %
Females 4,16,85,411 5,18,71,211 +24.4 %
26

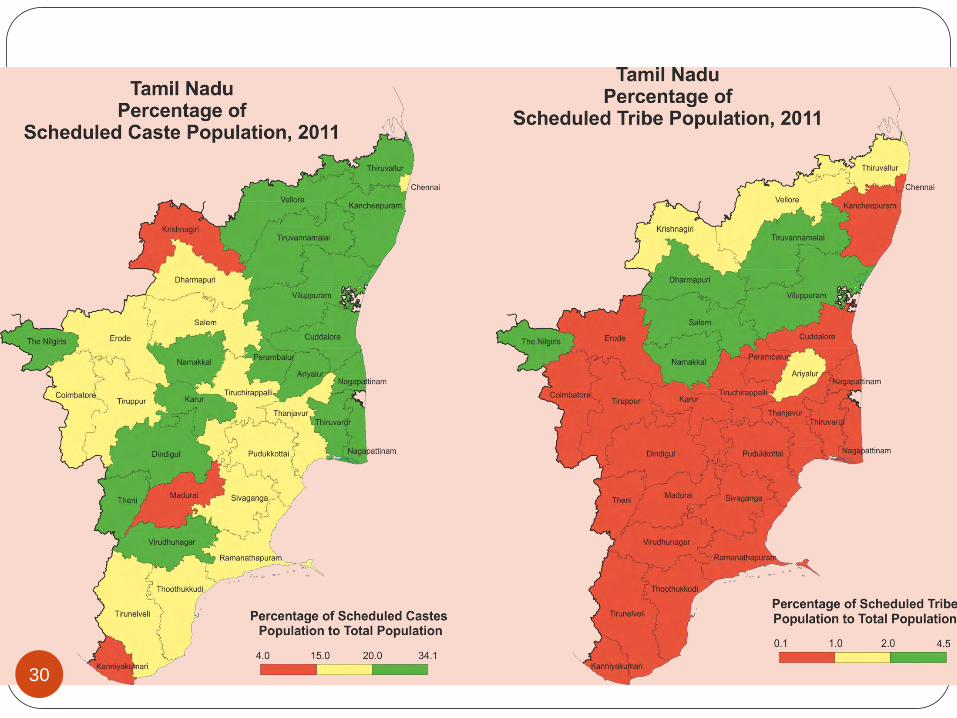
Proportion of SC/ST Population Tamil Nadu – 2001, 2011
Proportion of SCs Proportion of STs
2001 2011 2001 2011
Total 19.0 20.0 1.0 1.1
Rural 23.8 25.5 1.6 1.8
Urban 12.9 14.2 0.4 0.4
(In proportion)
27
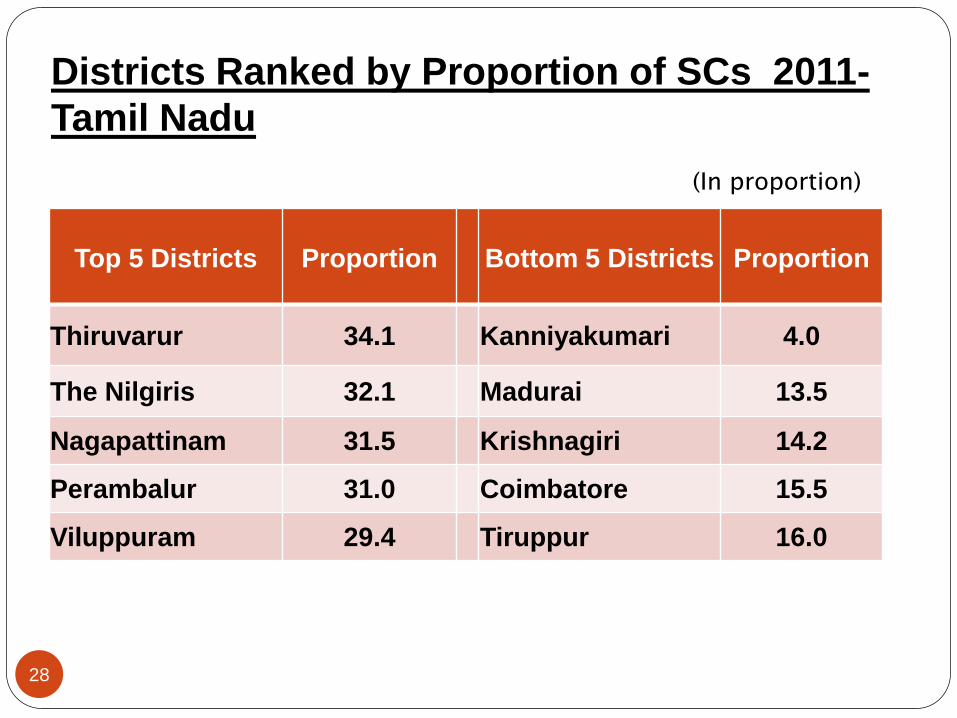
Districts Ranked by Proportion of SCs 2011-
Tamil Nadu
Top 5 Districts Proportion Bottom 5 Districts
Proportion
Thiruvarur 34.1 Kanniyakumari 4.0
The Nilgiris 32.1 Madurai 13.5
Nagapattinam 31.5 Krishnagiri 14.2
Perambalur 31.0 Coimbatore 15.5
Viluppuram 29.4 Tiruppur 16.0
28
(In proportion)
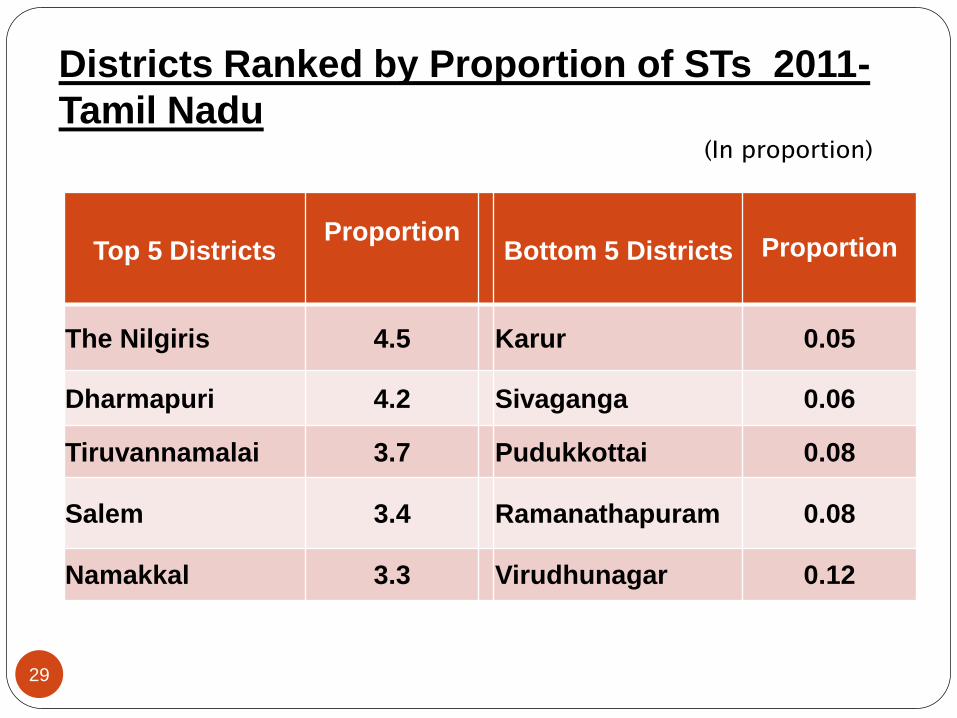
Top 5 Districts Proportion
Bottom 5 Districts
Proportion
The Nilgiris 4.5 Karur 0.05
Dharmapuri 4.2 Sivaganga 0.06
Tiruvannamalai 3.7 Pudukkottai 0.08
Salem 3.4 Ramanathapuram 0.08
Namakkal 3.3 Virudhunagar 0.12
Districts Ranked by Proportion of STs 2011-
Tamil Nadu
29
(In proportion)
30

Literates
&
Literacy Rates
31
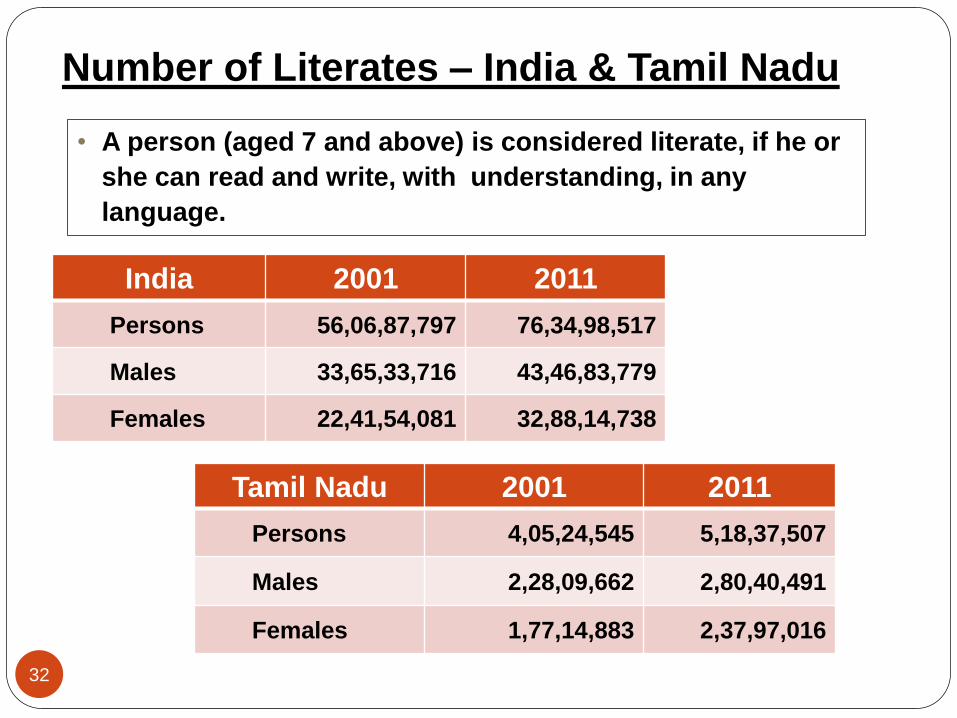
Number of Literates – India & Tamil Nadu
• A person (aged 7 and above) is considered literate, if he or
she can read and write, with understanding, in any
language.
India 2001 2011
Persons 56,06,87,797 76,34,98,517
Males 33,65,33,716 43,46,83,779
Females 22,41,54,081 32,88,14,738
32
Tamil Nadu 2001 2011
Persons 4,05,24,545 5,18,37,507
Males 2,28,09,662 2,80,40,491
Females 1,77,14,883 2,37,97,016

Literacy Rate , Change 2001- 2011 India & Tamil Nadu
India 2001 2011 Difference
(2011 – 2001)
Persons 64.8 73.0 +8.2
Males 75.3 80.9 +5.6
Females 53.7 64.6 +10.9
(in %)
33
Tamil Nadu 2001 2011 Difference
(2011 – 2001)
Persons 73.5 80.1 +6.6
Males 82.4 86.8 +4.4
Females 64.4 73.4 +9.0

Districts Ranked by Literacy Rate 2011
Tamil Nadu
Top 5 Districts Literacy
Rate
Bottom 5 Districts
Literacy
Rate
Kanniyakumari 91.7 Dharmapuri 68.5
Chennai 90.2 Ariyalur 71.3
Thoothukkudi 86.2 Krishnagiri 71.5
The Nilgiris 85.2 Viluppuram 71.9
Kancheepuram 84.5 Erode 72.6
(In %)
34

35
Workers,
Work Participation
Rate (WPR)
&
Categories of
Economic Activity
36
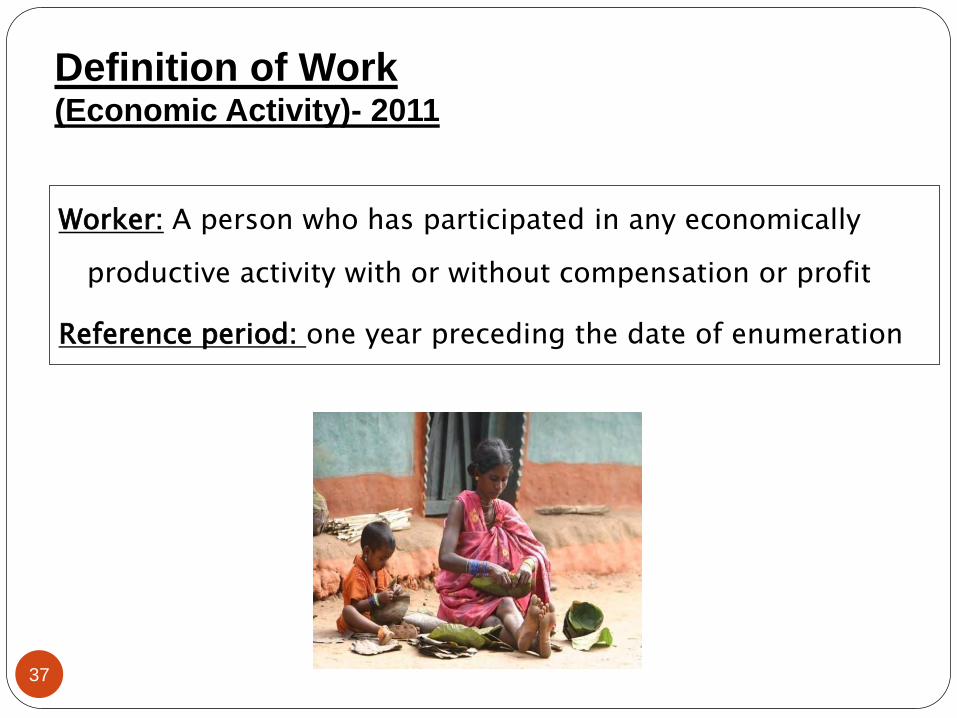
Definition of Work (Economic Activity)- 2011
Worker: A person who has participated in any economically
productive activity with or without compensation or profit
Reference period: one year preceding the date of enumeration
37

Number of Workers by Residence - 2011
India Number of
Workers Non-Workers
Work
Participation
Rate*
Total 48,17,43,311 72,88,26,262 39.8%
Rural 34,85,97,535 48,48,65,913 41.8%
Urban 13,31,45,776 24,39,60,349 35.3%
* Work Participation Rate is defined as the number of workers per 100 population
38
Tamil Nadu Number of
Workers Non-Workers
Work
Participation
Rate*
Total 3,28,84,681 3,92,62,349 45.6%
Rural 1,88,61,330 1,83,68,260 50.7%
Urban 1,40,23,351 2,08,94,089 40.2%
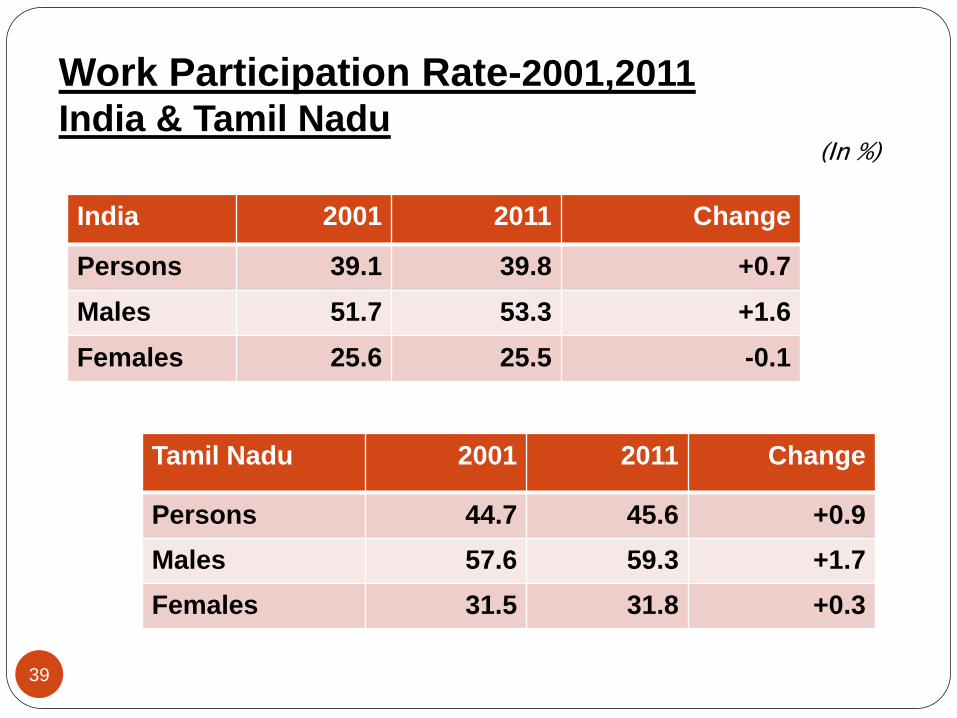
Work Participation Rate-2001,2011
India & Tamil Nadu
Tamil Nadu 2001 2011 Change
Persons 44.7 45.6 +0.9
Males 57.6 59.3 +1.7
Females 31.5 31.8 +0.3
(In %)
India 2001 2011 Change
Persons 39.1 39.8 +0.7
Males 51.7 53.3 +1.6
Females 25.6 25.5 -0.1
39
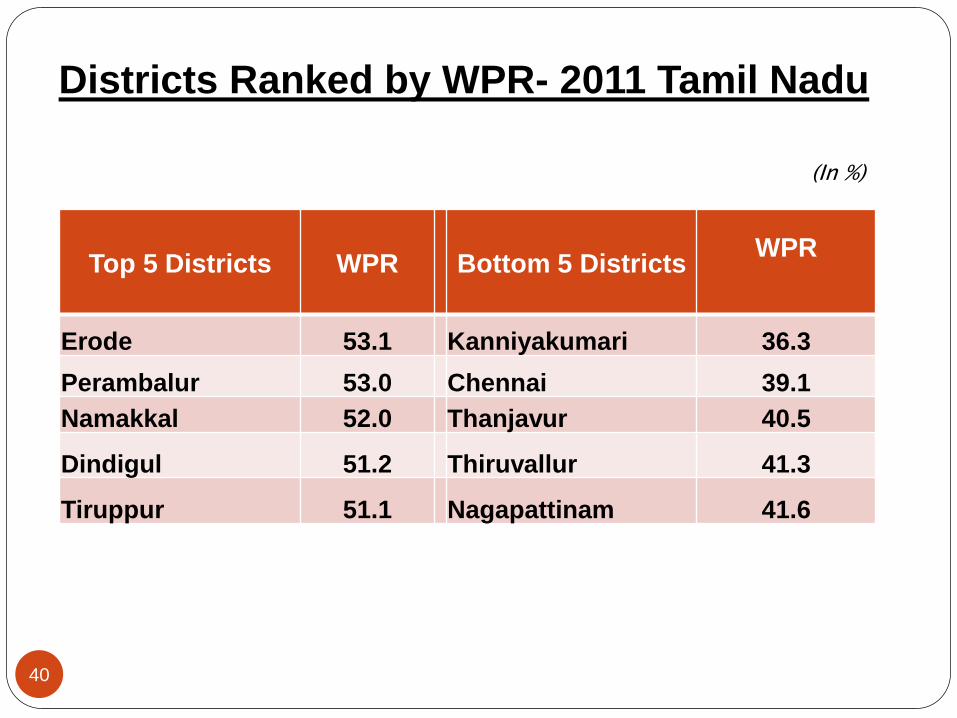
Districts Ranked by WPR- 2011 Tamil Nadu
Top 5 Districts
WPR
Bottom 5 Districts WPR
Erode 53.1 Kanniyakumari 36.3
Perambalur 53.0 Chennai 39.1
Namakkal 52.0 Thanjavur 40.5
Dindigul 51.2 Thiruvallur 41.3
Tiruppur 51.1 Nagapattinam 41.6
(In %)
40
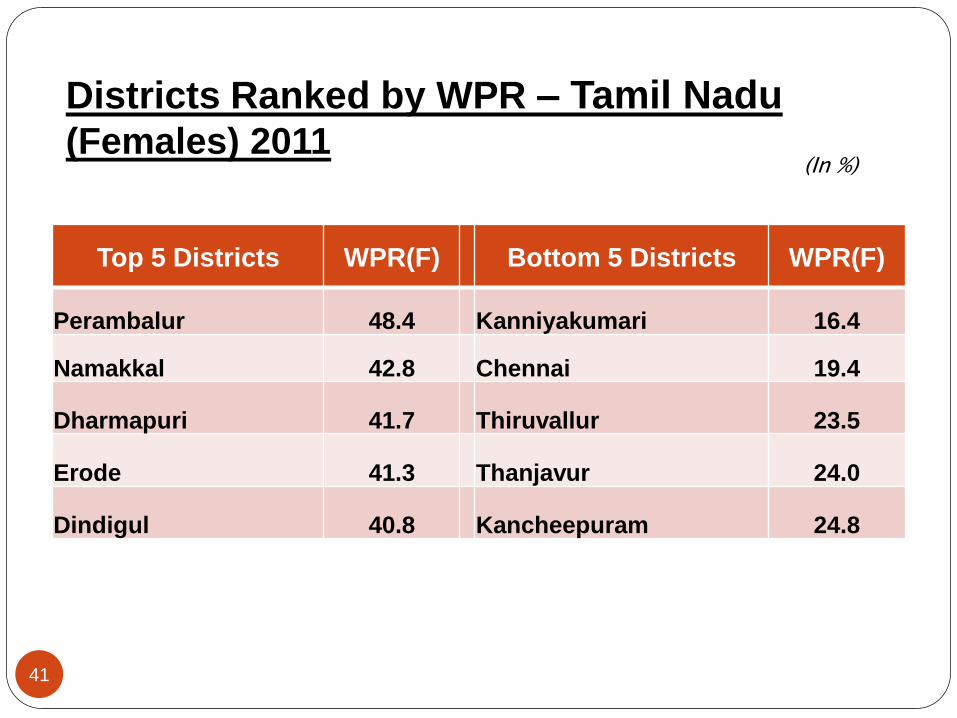
Districts Ranked by WPR – Tamil Nadu (Females) 2011
Top 5 Districts WPR(F) Bottom 5 Districts WPR(F)
Perambalur 48.4 Kanniyakumari 16.4
Namakkal 42.8 Chennai 19.4
Dharmapuri 41.7 Thiruvallur 23.5
Erode 41.3 Thanjavur 24.0
Dindigul 40.8 Kancheepuram 24.8
(In %)
41
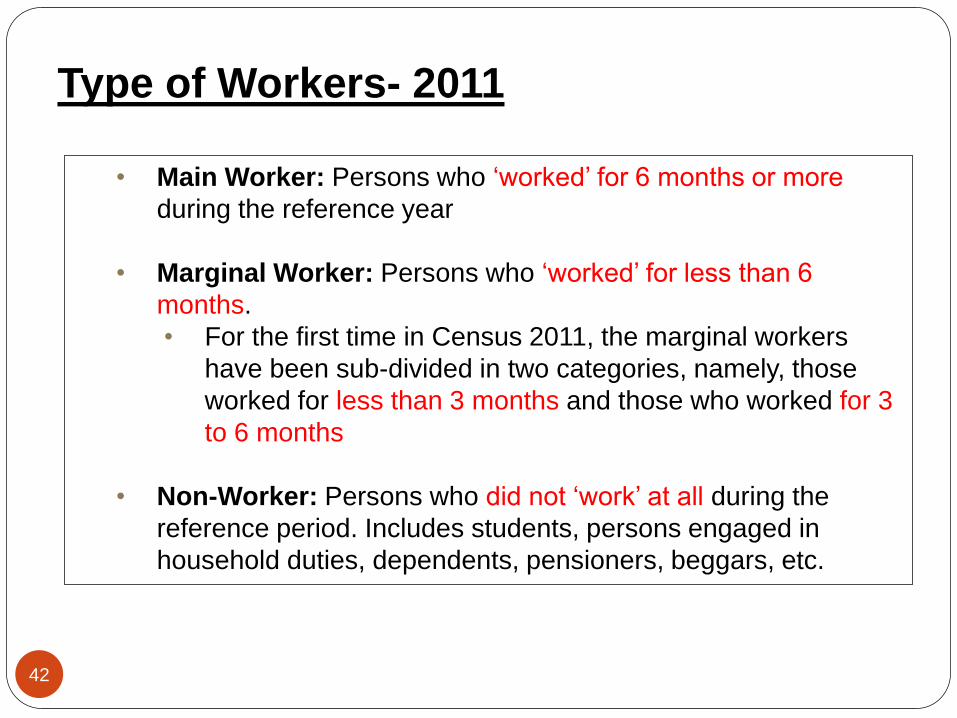
Type of Workers- 2011
• Main Worker: Persons who ‘worked’ for 6 months or more
during the reference year
• Marginal Worker: Persons who ‘worked’ for less than 6
months.
• For the first time in Census 2011, the marginal workers
have been sub-divided in two categories, namely, those
worked for less than 3 months and those who worked for 3
to 6 months
• Non-Worker: Persons who did not ‘work’ at all during the
reference period. Includes students, persons engaged in
household duties, dependents, pensioners, beggars, etc.
42

Type of Workers - 2001, 2011
Tamil Nadu
Tamil Nadu Sex 2001 2011 Change
Main Workers
Persons 85.2 85.0 -0.2
Males 90.1 88.5 -1.6
Females 76.2 78.4 2.2
Marginal Workers
Persons 14.8 15.0 0.2
Males 9.9 11.5 1.6
Females 23.8 21.6 -2.2
(in %)
43

Decadal Change in WPR Districts: 2001,2011
• The WPR in the Tamil Nadu has recorded a marginal increase from
44.7% in 2001 to 45.6% in 2011
• Majority of the Districts have shown increase in WPR between 2001-
2011 ; Highest increase in Chennai(4.8 %)
• In 12 Districts, WPR has declined : Namakkal, Erode, Karur,
Perambalur, Ariyalur, Theni, Virudhunagar,
Tirunelveli , Thoothukkudi, Dharmapuri, Krishnagiri, Tiruppur.
44
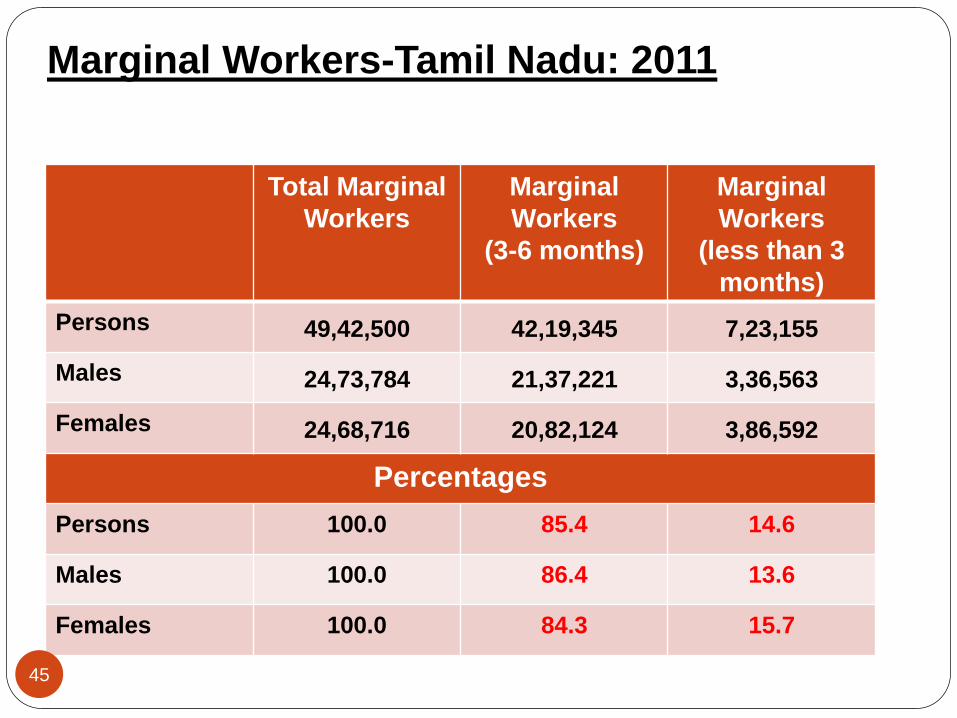
Marginal Workers-Tamil Nadu: 2011
Total Marginal
Workers
Marginal
Workers
(3-6 months)
Marginal
Workers
(less than 3
months)
Persons 49,42,500 42,19,345 7,23,155
Males 24,73,784 21,37,221 3,36,563
Females 24,68,716 20,82,124 3,86,592
Percentages
Persons 100.0 85.4 14.6
Males 100.0 86.4 13.6
Females 100.0 84.3 15.7
45
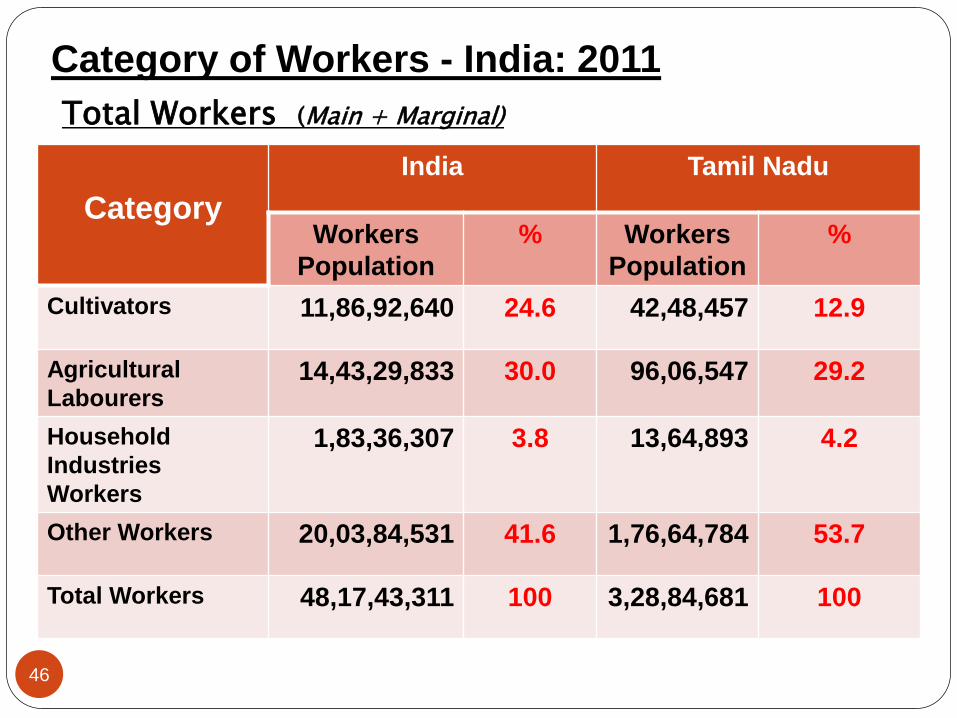
Category of Workers - India: 2011
Total Workers (Main + Marginal)
46
Category
India Tamil Nadu
Workers
Population
% Workers
Population
%
Cultivators 11,86,92,640 24.6 42,48,457 12.9
Agricultural
Labourers 14,43,29,833 30.0 96,06,547 29.2
Household
Industries
Workers
1,83,36,307 3.8 13,64,893 4.2
Other Workers 20,03,84,531 41.6 1,76,64,784 53.7
Total Workers 48,17,43,311 100 3,28,84,681 100
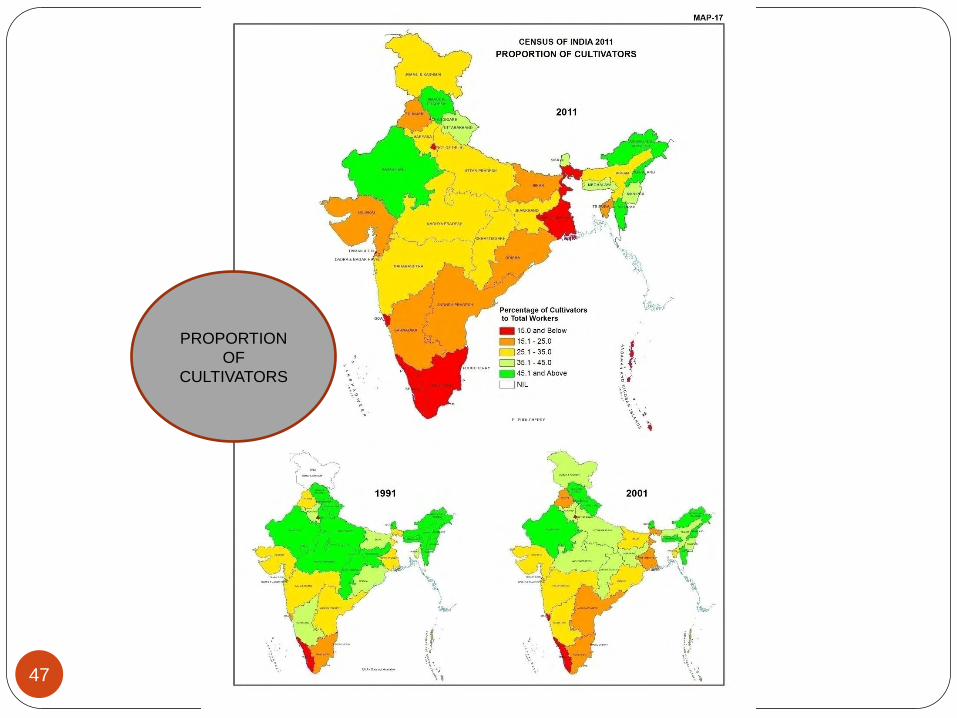
PROPORTION
OF
CULTIVATORS
47
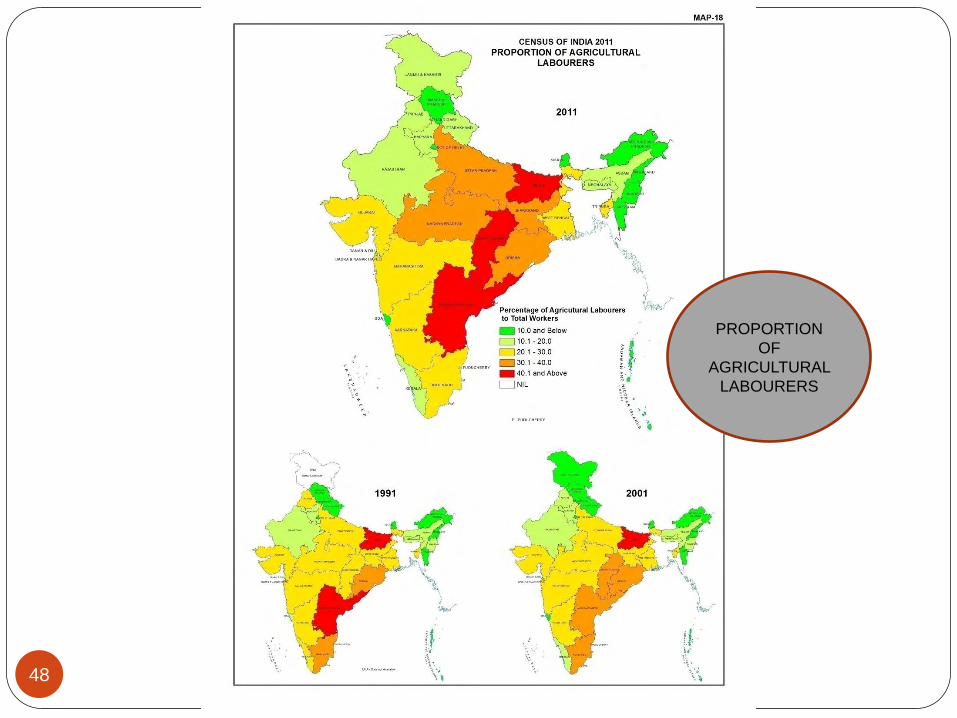
PROPORTION
OF
AGRICULTURAL
LABOURERS
48

Category of Workers : India Change in Proportions - 2001 &2011
India Category 2001 2011 Change
Workers (Main + Marginal)
All Areas Total Workers 100.0 100.0
Cultivators 31.7 24.6 - 7.1
Ag. Labourers 26.5 30.0 +3.5
HHI Workers 4.2 3.8 -0.4
Other Workers 37.6 41.6 +4.0
(in %)
• Agriculture sector (cultivators and agricultural labourers put
together) : 54.6 % of Total Workers, decline by 3.6 percent
points 49
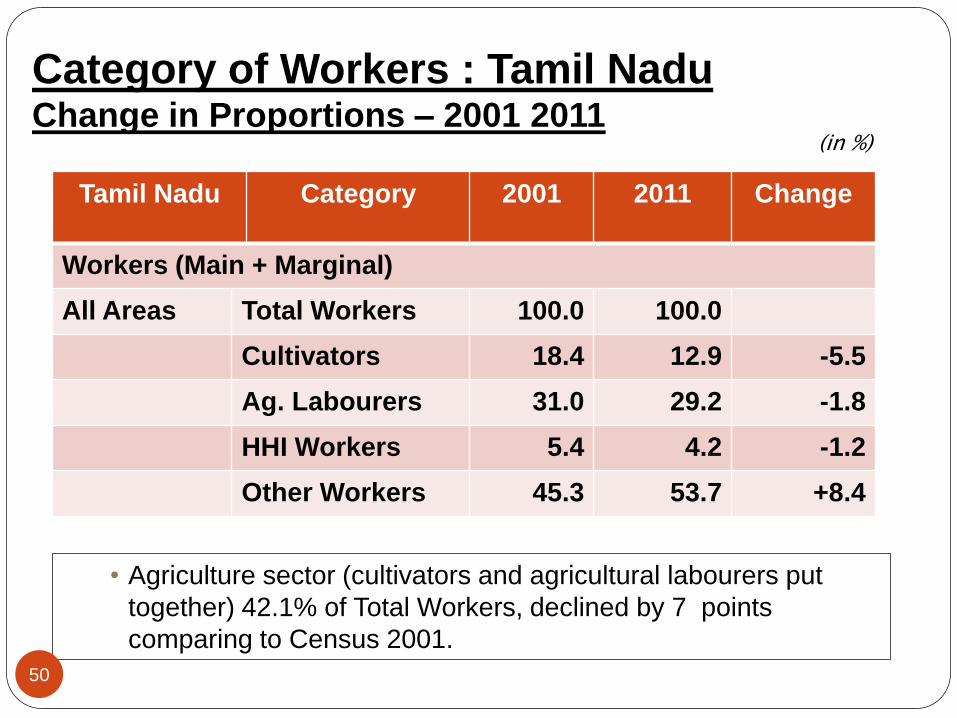
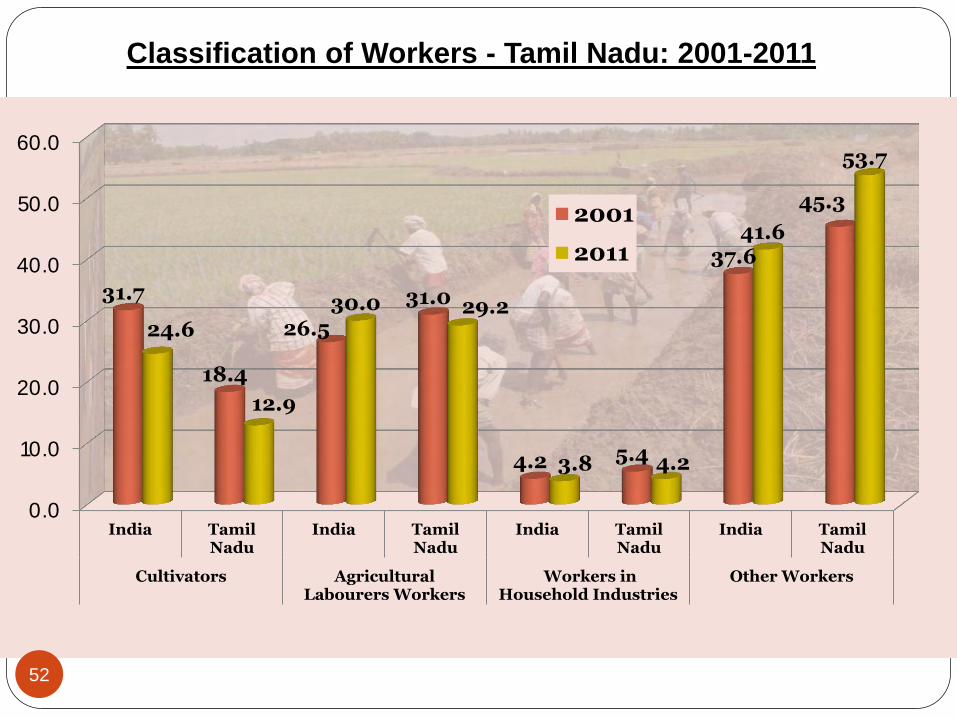
Category of Workers : Tamil Nadu Change in Proportions – 2001 2011
Tamil Nadu Category 2001 2011 Change
Workers (Main + Marginal)
All Areas Total Workers 100.0 100.0
Cultivators 18.4 12.9 -5.5
Ag. Labourers 31.0 29.2 -1.8
HHI Workers 5.4 4.2 -1.2
Other Workers 45.3 53.7 +8.4
(in %)
• Agriculture sector (cultivators and agricultural labourers put
together) 42.1% of Total Workers, declined by 7 points
comparing to Census 2001.
50
0.0
5.0
10.0
15.0
20.0
25.0
30.0
35.0
1961 1971 1981 1991 2001 2011
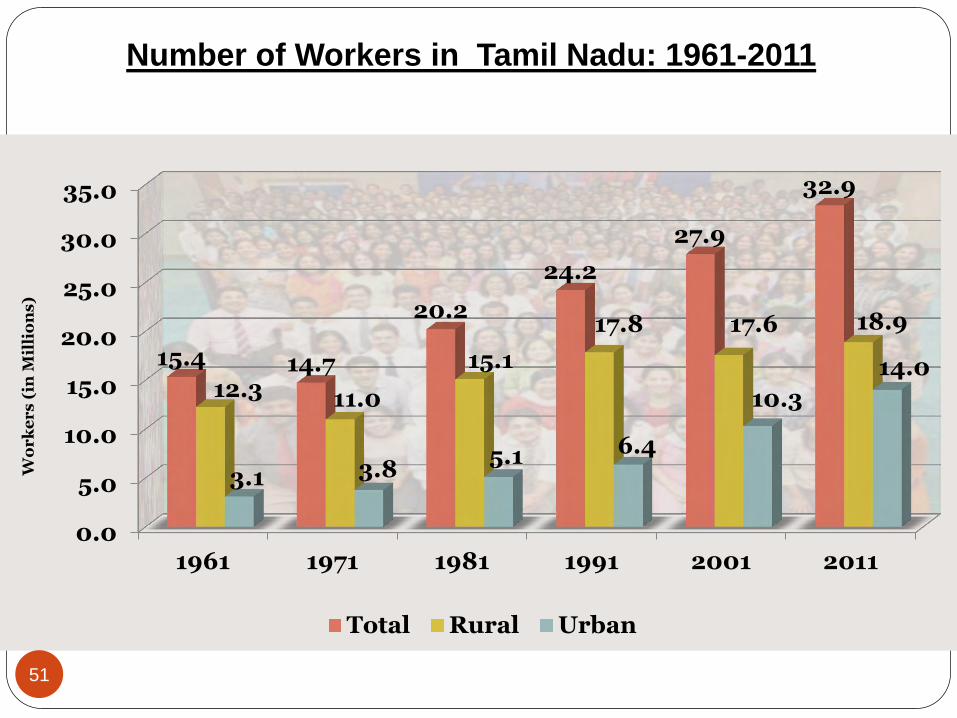
15.4 14.7
20.2
24.2
27.9
32.9
12.3 11.0
15.1
17.8 17.6 18.9
3.1 3.8 5.1 6.4
10.3
14.0
Wo
rk
er
s (
in M
illi
on
s)
Total Rural Urban
Number of Workers in Tamil Nadu: 1961-2011
51
0.0
10.0
20.0
30.0
40.0
50.0
60.0
India TamilNadu
India TamilNadu
India TamilNadu
India TamilNadu
Cultivators AgriculturalLabourers Workers
Workers inHousehold Industries
Other Workers
31.7
18.4
26.5
31.0
4.2 5.4
37.6
45.3
24.6
12.9
30.0 29.2
3.8 4.2
41.6
53.7
2001
2011
Classification of Workers - Tamil Nadu: 2001-2011
52
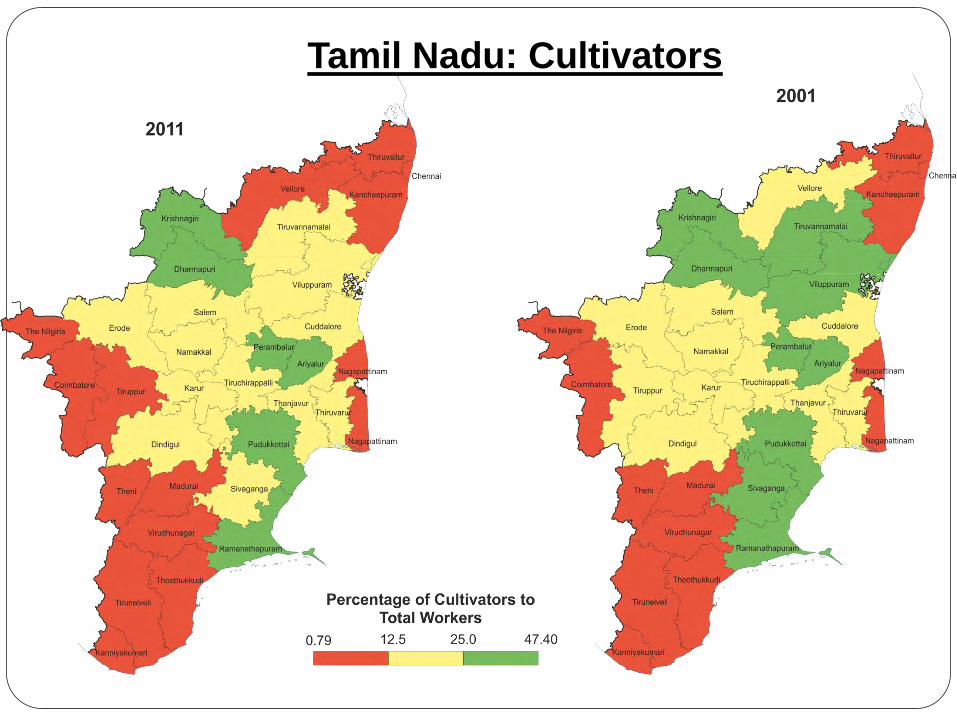
Tamil Nadu: Cultivators
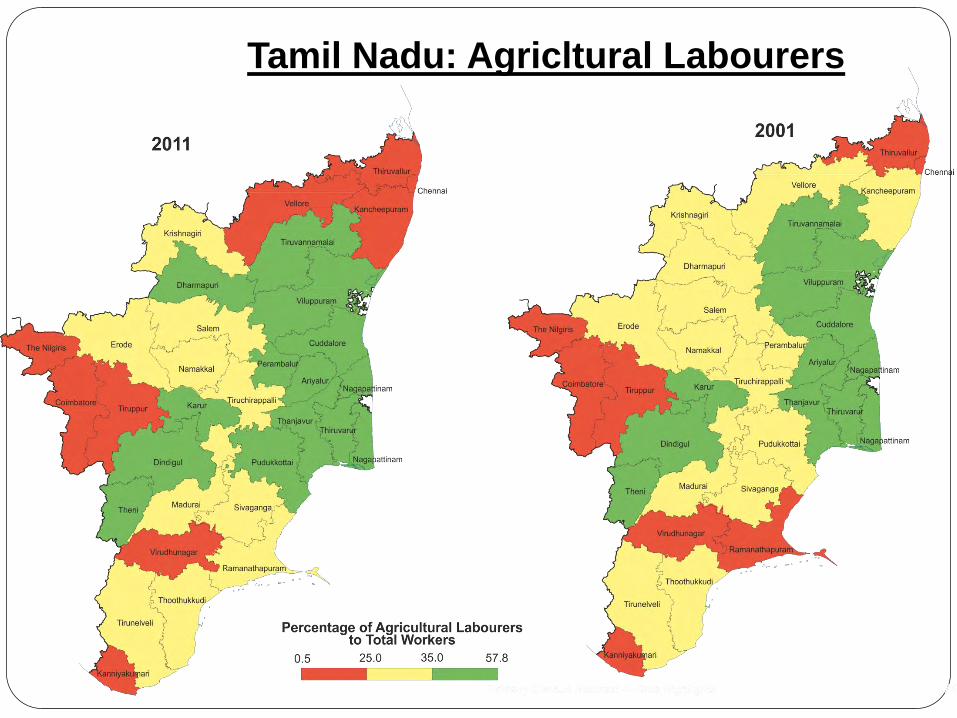
Tamil Nadu: Agricltural Labourers
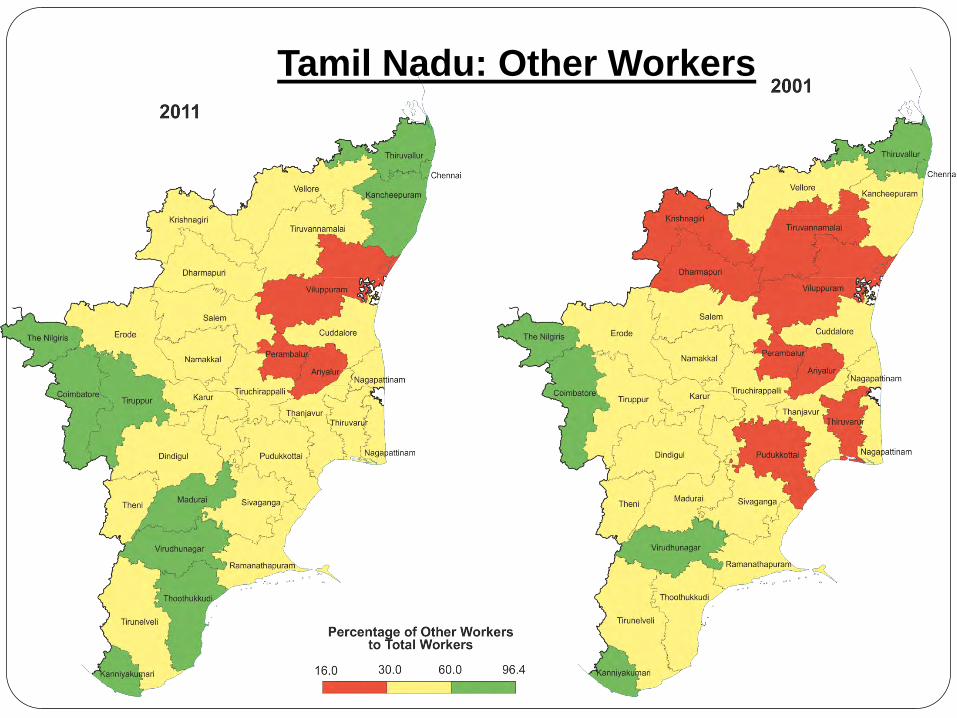
Tamil Nadu: Other Workers
56
•This output would not have been possible without the
painstaking efforts of all the enumerators, supervisors and field
functionaries who had taken strenuous efforts to complete their
tasks within the stipulated time.
• There were 1,15,688 enumerators and 18,664 Supervisors who
collected the data in the field, under the supervision and able
guidance of Charge officers (Tahsildars / Municipal
Commissioners) and Principal Census Officers ( District
Collectors).
• I hope this publication stands up to the requirements of data
users.

Thank you
http://www.census.tn.nic.in
57