2011 Census Teacher’s Kit census info .pdf2011 Census 4 Teacher’s Guide The Census of Population...
86
Transcript of 2011 Census Teacher’s Kit census info .pdf2011 Census 4 Teacher’s Guide The Census of Population...
2011 Census Teacher’s Kit
Teacher’s Guide
2 2011 Census Teacher’s Guide
IntroductionThis guide contains useful information for both teachers and students. The first few pages contain information specific to the teacher. The guide also includes background information on the Census of Population, a census vocabulary and Quick census facts. For detailed information on the Census of Agriculture, please see Activity 5.
Teacher-ready activities have been divided into three suggested grade levels: elementary, intermediate, and senior. Some activities have classroom extensions to enrich students’ comprehension.
Overall objectives• Encourage teachers and students to complete
the census questionnaire; ensure that they pass on this message to friends and families.
• Create awareness and understanding about the importance of the census and the information it will provide.
• Increase awareness among teachers and students about census information as a valuable tool for student and teacher research projects.
When should I use the Teacher’s Kit?The best time to conduct these activities is in early May 2011. This will coincide with Statistics Canada’s national, provincial and local census awareness campaigns, and with the census information that will arrive at households across Canada.
EnrichmentIn addition to the enrichment exercises in each activity, here are some additional ideas:
• Quick census facts can be reproduced and sent home with students to help spread the census message.
• Motivate students to actively participate in the census by having them generate community awareness projects. Ask them for their ideas on what they can do to make area residents aware of the upcoming census.
• A variety of school communications vehicles could be used to generate awareness among the student body: announcements on the public address system, posters in gymnasiums and school buses, messages on the school’s cable TV or radio station, displays on classroom bulletin boards, census stories in the school newspaper, and announcements on the school’s website.
Take a look at the 1911 Census of Canada (elementary level)Students can examine a few pages from the 1911 Census of Canada. (Print downloadable pages available at www.collectionscanada.gc.ca/databases/census-1911.) Students could be led in a class discussion about the type of information found and what that information may tell them about the people who are listed. For example, students can take a look at the size of families, the age of parents when they had their first child, the occupations that people had, the number and ages of children who were working or going to school, the number of people who could read and write, etc.
Teacher’s Guide
3 2011 Census Teacher’s Guide
Research the changes in population in your community (intermediate/senior levels)Students can research a street in their community using the 1911 Census of Canada and compare it with what they would find on the same street today. If the community did not exist in 1911, students can select a nearby community that is listed in the 1911 Census. (Students can print the relevant pages from www.collectionscanada.gc.ca/databases/census-1911.)
By examining the data contained in the census pages, students can create a snapshot of the way life was in 1911. What were the characteristics of the people who lived in the students’ chosen area? How are the people listed similar to the people who live there today? How do they differ? (Students can compare a wide range of interesting factors, such as the number of households, the number and ages of the people who live there, their occupations and employers, where they were born, the language they spoke, etc.)
Teacher’s Guide
Research family history (senior level)Working in groups, students can research various ancestors of members of the class. Only ancestors who were living in Canada in 1911 should be chosen. Each group should select several names to search, as some names may not be found in the census records. Those without ancestors living in Canada in 1911 can “adopt” a classmate’s ancestor to research.
To search the 1911 Census of Canada, available online at www.collectionscanada.gc.ca/databases/census-1911, students will need to know where in Canada (town, city, etc.) an ancestor was living in 1911. Once students have located an ancestor, they will be able to check the census record to find such interesting information as: other family members and their ages, occupations, employers, religion, place of birth, whether they could read and write, etc.
Each group could compile this information in a brief report for a family history. Students may wish to find additional information by checking other genealogical sources such as ship passenger lists, military records, immigration records, cemetery records, etc. A good place to continue the search is the Canadian Genealogy Centre (www.lac-bac.ca/genealogy).
4 2011 Census Teacher’s Guide
The Census of Population
Statistics Canada takes a Census of Population every five years. The last census was in May 2006; the next one will be in May 2011. The 2011 Census will ask people questions about their age, sex, marital status, relationship to others in the household and mother tongue.
Census historyCensus taking is not a new idea. During the third and fourth centuries B.C., the Babylonians, Chinese, and Egyptians enumerated their populations to collect taxes and to fight foreign wars. The Romans were avid census takers and regularly held censuses to learn about areas in their far-reaching empire.
In contrast to early censuses, later censuses became more than just a way to levy taxes or to muster men for fighting. They were seen as an inquiry into the social and economic state of the nation.
The first modern censusIntendant Jean Talon is generally regarded as the first in the world to put a modern census into practice. Sent by Louis XIV to administer the colony of New France, Talon recognized the importance of having reliable information on which to organize the colony and further its development. This first census in 1666 enumerated 3,215 inhabitants and collected information on age, sex, marital status, locality, and occupation. A supplementary inquiry in 1667 asked about the area of land under cultivation and the number of cattle and sheep.
No fewer than 36 censuses were conducted during the French regime. Each one brought new questions on topics such as the production of various crops, the number of public buildings, churches, grist mills and sawmills, and the number of firearms and swords.
The first census under the British regime was taken in 1765 and contained much the same information as the censuses in the latter part of the French regime. As time progressed, new topics appeared such as race, ethnicity, religion, and place of birth.
During the 1800s, separate censuses were held at various times in the Atlantic colonies, Upper and Lower Canada, and in Manitoba. In 1867, the British North America Act (now called the Constitution Act) brought about Confederation and called for a Census of Canada to be taken every 10 years, starting in 1871. Census results would be used to determine the number of members in the House of Commons.
A mid-decade agricultural census was first held in Manitoba in 1896.
When the provinces of Saskatchewan and Alberta were created in 1905, the increasingly rapid settlement of the west made the quinquennial census a constitutional requirement. A new Census and Statistics Act called for additional censuses of population and agriculture to be taken in the provinces of Manitoba, Saskatchewan and Alberta in 1906 and every 10 years after that until the population of each of the three provinces reached 1.25 million. These censuses continued until 1956, when Canada began taking national censuses of population and agriculture every five years.
The Census of Canada
5 2011 Census Teacher’s Guide
A census every five years
In 1956, the Dominion Bureau of Statistics began taking national censuses every five years to provide up-to-date information on the nation’s rapidly changing population. The mid-decade census was made mandatory in the Statistics Act of 1971.
How is the census taken?During May 2011, every household in Canada will be asked to complete a census questionnaire – either online or on paper. Over 13.4 million households are expected to take part.
Questionnaire: In 2011, Statistics Canada will be encouraging households to complete the census questionnaire online. Benefits of completing a questionnaire online include improved data quality, time savings for respondents and less paper. Paper questionnaires will still be available for those respondents who prefer to fill out the census form by hand.
In addition, the 2011 Census will again include a question asking respondents to consent to have their census information released after 92 years. This information is valuable to historical researchers, genealogists, academics and journalists.
Every household in Canada is required to complete a census questionnaire. The questionnaire asks basic questions such as age, sex, marital status, relationship to others in the household and mother tongue.
Methodology: In 80% of the country, Statistics Canada will contact people by mail. Most of these households will receive a letter requesting they fill their census forms using the online option, while the remaining will receive the paper questionnaire itself.
In rural and less populated parts of the country, households will receive a visit from an interviewer who will deliver a census questionnaire. These forms will contain a secure access code that respondents can use if they want to complete the questionnaire online.
Since there are fewer people living in northern and remote areas, and on Indian reserves, all respondents living in these areas will complete a census questionnaire with the help of an interviewer.
What questions are asked?The information collected must be clearly in the public interest needed at the small geographic level (for example a community or neighbourhood) and not obtainable from other sources. The questions are approved by Order in Council and published in the Canada Gazette.
The questions remain the same from census to census. In this way, trends can be tracked over the years, such as the growth or decline in the population in various areas of the country.
The Census of Canada
6 2011 Census Teacher’s Guide
Who uses census data?Census data are used by governments, businesses and industries, social organizations and countless other agencies. For instance:
Census data are essential for calculating the population estimates used to allocate transfer payments from the federal government to the provinces and territories, and from the provinces to the municipalities. In 2009-2010, provinces and territories received over $60 billion from the federal government through major transfers, direct targeted support and trust funds.
Governments of all levels use census data to develop policies on economic and social programs. Municipalities use census data to assess the need for community programs and services, such as transportation, police and youth services.
The health care industry uses census data to forecast health care needs and costs, and select sites for hospitals, seniors’ homes, and clinics.
Social service agencies use census data to assess many social needs such as daycare.
The education sector uses census data to plan post-secondary and adult education programs. School boards use population figures by age group to project school enrolments.
The media use census data as background for articles.
More than a civic responsibility?It is vital that decision makers have accurate information when making policies that will shape our country’s future. For this reason, answering census questions is more than a civic responsibility – it is required by the Statistics Act. This law states the legal obligation of every household to participate in the census. By the same law, Statistics Canada must protect the confidentiality of the personal information provided by respondents.
Privacy and confidentialityUnder the Statistics Act, all personal census information must be kept confidential. Only Statistics Canada employees who have a need to examine individual forms have access to completed questionnaires. No one outside of Statistics Canada can have access to personal census information.
The Census of Canada
7 2011 Census Teacher’s Guide
Resources for census materialCensus information can be obtained free of charge in many libraries. Academic and large city libraries have a full range of Statistics Canada products in a variety of media while others carry a selection of publications.
On the Statistics Canada website (www.statcan.gc.ca) by clicking on Census in the top right hand corner, then 2006 Community Profiles, you can type in your city or town to find specific information about your community and area.
You can download an Activity Sheet containing a Word Find Puzzle and a 2011 Census Quiz, as well as this Teacher’s Kit from the census website at www.census2011.gc.ca. The Teacher’s Kit includes this Teacher’s Guide and eight activities.
Additional educational material is available free of charge on the Statistics Canada website at www.statcan.gc.ca. Enter “Learning resources” in the online search tool.
Online translations of the census question are available in several languages on the census website (www.census2011.gc.ca). The full list of languages can be accessed on the census website.
The Census of Canada
8 2011 Census Teacher’s Guide
census: “census” comes from the Latin word censere – to appraise. The Canadian census takes place once every five years. The information it collects, from every person in Canada, provides data on topics that are important to the country. Census data are used to make many decisions at all levels of government and private business. The next census takes place in May 2011.
census metropolitan area (CMA): area consisting of one or more neighbouring municipalities situated around a major urban core. A census metropolitan area must have a total population of at least 100,000 of which 50,000 or more live in the urban core. Winnipeg, Manitoba is a CMA.
Census of Population: an enumeration of every household and person in Canada once every five years. All households will receive a census questionnaire (2A) which contains eight questions on basic topics such as age, sex, marital status, 92 year consent and mother tongue.
census reference day: the day for which the information is provided. For the 2011 Census, the reference day is May 10, 2011. Respondents may fill out a questionnaire before or after the reference day, but they should provide information as it relates to their household on May 10, 2011.
census tract (CT): an area that is small and relatively stable. Census tracts usually have a population of 2,500 to 8,000. They are located in large urban centres that must have an urban core population of 50,000 or more.
citizenship: refers to the legal citizenship status of the respondent. Persons who are citizens of more than one country were instructed to provide the name of the other country(ies).
cluster: a grouping
complete count: the census goal – to obtain information from everyone who is a resident of Canada, as well as Canadians working abroad for the federal and provincial governments, Canadian embassies, Canadian Armed Forces, and their families.
confidentiality: the Statistics Act requires that all personal census information be kept confidential. Data are released only after responses have been combined in a database to produce statistics.
data: facts from which conclusions can be drawn.
diversity: as in cultural diversity, multicultural, different cultures in Canada (see multicultural).
dwelling: a set of living quarters in which a person or a group of persons resides or could reside.
enumeration: the process of counting or naming one by one; to list. In most parts of Canada, enumeration takes place by having people complete the questionnaire themselves (online or on paper). In remote areas, enumeration takes place by personal interview.
Census vocabulary
9 2011 Census Teacher’s Guide
federal electoral district (FED): an area represented by a Member of Parliament (MP) elected to the House of Commons. The number of seats in the House of Commons is based on the population counts from each decennial census. Population counts from the 2001 Census (a decennial census) increased the number of federal electoral districts from 301 to 308. The federal electoral district boundaries used for the 2011 Census are based on the 2003 Representation Order. The next decennial census is 2011. After the population count is released for the 2011 Census, the Chief Electoral Officer will determine if the number of federal electoral districts should be increased and in turn the number of seats in the House of Commons.
grid map: a system of survey lines running parallel to lines of latitude and longitude, used for the division of an area into counties, lots, etc.
household: refers to a person or a group of persons (other than foreign residents) who occupy the same dwelling and do not have a usual place of residence elsewhere in Canada. It may consist of: a family group (census family); two or more families sharing a dwelling; a group of unrelated persons; or one person living alone.
House of Commons: the elected House of Parliament. Each member of the House of Commons is elected from one of Canada’s federal electoral districts (FEDs or ridings).
immigrant: a person who has moved to a new country.
immigrant population: people who are, or have been, landed immigrants in Canada. A landed immigrant is a person who has been granted the right to live in Canada permanently by immigration authorities. Some immigrants have resided in Canada for a number of years, while others have arrived recently.
immigrate: the movement of people into a country. Most immigrants are born outside Canada, but a small number were born in Canada.
immigration: the act of entering a foreign country as a permanent resident.
immigration source areas: immigrants to Canada were born in many countries all over the world. Statistics Canada has arranged these countries by six source areas: 1 – North America (excluding Canada), 2 – Central and South America and the Caribbean, 3 – Europe, 4 – Africa, 5 – Asia and the Middle East, and 6 – Oceania.
interviewer: the person who is responsible for contacting people about the census. Census interviewers follow-up when people have not returned a questionnaire. Some interviewers also physically deliver census questionnaires and others conduct personal interviews in remote areas or villages, where regular enumeration is difficult.
landed immigrant: landed immigrants are people who have been granted the right to live in Canada permanently by immigration authorities.
mother tongue: the first language learned at home in childhood and still understood by the individual at the time of the census.
Census vocabulary
10 2011 Census Teacher’s Guide
multicultural: having a number of distinct cultures existing side by side in the same country.
naturalized citizen: is a person who has been issued a Canadian Citizenship Certificate. This includes persons born in the United Kingdom or other Commonwealth countries who have immigrated to Canada and who have become Canadian citizens.
period of immigration: refers to a person who is a landed immigrant by the period of time in which he or she first obtained landed immigrant status. A landed immigrant is a person who has been granted the right to live in Canada by immigration authorities
place of birth: for people born in Canada, place of birth refers to the province or territory of birth. For people born outside of Canada, place of birth refers to the country in which they were born.
population: the total number of people living in a given area. Population density refers to the number of persons per square kilometre.
questionnaire: a document containing a series of questions. It is used to ensure that information is collected in a standardized manner and is usually designed so that the answers can be tabulated quickly.
rural areas: includes all territory lying outside urban areas. Taken together, urban and rural areas cover all of Canada.
settlement: a group of buildings or community and the people living there.
stacked column: a column in a bar graph. The column is broken into proportional segments to total 100%.
statistics: numerical facts about people, the weather, business conditions, etc.; the science of collecting and classifying such facts in order to show their significance.
survey: a study made by gathering information in the form of statistics. Although the census is often referred to as Canada’s largest survey, the terms census and survey really mean different things. In a census, information is gathered from the entire population. In a survey, information is gathered from a smaller sample within the population.
undercount (noun): the estimated number of people who were not counted in the census.
urban area: a geographical area with a minimum population concentration of 1,000 persons and a population density of at least 400 people per square kilometre, based on the previous census population counts (2006). All territory outside urban areas is classified as rural. Together, urban and rural areas cover all of Canada.
Census vocabulary
11 2011 Census Teacher’s Guide
What is a census?
The census provides a statistical picture of a country and its people. Almost every country in the world carries out a census on a regular basis.
The Canadian census collects information, in five year intervals, on every man, woman and child living in Canada.
A Census of Agriculture is taken at the same time as the Census of Population. The Census of Agriculture collects information on every agricultural operation in Canada.
When will the next census be held?
May 2011.
Why take a census?
The census collects important information that is used for decision making.
Who will be included in the census?
Every household in Canada is included, as well as Canadians and their families who are working abroad for the federal and provincial governments, Canadian embassies or the Canadian Armed Forces.
How is the information collected?
In 2011, Statistics Canada will be encouraging households to fill in their questionnaires online. There are many benefits to completing a questionnaire online such as improved data quality, time savings for respondents and less paper waste. Paper questionnaires will still be available to respondents who prefer to fill out their census form by hand.
Census Help Line
The Census Help Line (CHL) is available to help answer questions from respondents. The CHL provides assistance in English, French, and in several other languages. The CHL begins operating on May 2nd, from 8 a.m. to 8 p.m., at this toll-free number: 1-877-777-2011. TTY users call: 1-866-753-7083.
Questionnaires
All households will receive a census questionnaire (2A). One person completes the census form for everyone in the household. The census questionnaire contains eight questions on topics such as age, sex, marital status and mother tongue.
Legal requirements and confidentiality
According to the Statistics Act:
• a census must be conducted every five years.
• every household in Canada must participate in the census.
Users of census data
All levels of government, private sector, social service sectors and media use census data to make informed decisions that affect the lives of everyone in Canada. This could include anything from calculating transfer payments to the provinces to determining the number of police officers in your community.
Quick census facts

12 2011 Census Teacher’s Guide
Please send us your comments and suggestions regarding this kit. To be added to the mailing list or to receive a kit, please contact:
Statistics Canada Census Communications
100 Tunney’s Pasture Driveway, 10th Floor Ottawa, Ontario K1A 0T6
Fax: 613-951-0930 Toll-free fax: 1-877-256-2370
E-mail: [email protected]
To download the 2011 Census Teacher’s Kit from the census website, visit www.census2011.gc.ca.
Send us your comments
OverviewThis activity introduces students to the concept of a census and explains why one is taken in Canada every five years.
Duration: 1 class period
Note: See the Teacher’s Guide for general background on the census and census vocabulary.
Learning objectives• Explain the term census and name some of
the information gathered by the census.
• Use counting techniques to take a census (household and classroom).
• Collect information and organize data.
Vocabularycensus, interviewer, household, population
Materials• Teacher’s Guide
• Handout 1: The census logo
• Handout 2: Taking a census
• Coloured pencils, markers, crayons (not included).
Getting startedExplain to students that a census collects information on every man, woman and child in Canada every five years. A census is taken because Canada is always changing. The next census takes place in May 2011.
The information that the census provides is used to make important decisions. For example, in areas where there are many children, playgrounds and schools may be built.
Census activity1. Distribute Handout 1: The census logo.
Explain that the census logo shows a group of people. These people represent everyone who will participate in the census in May 2011. Have the students colour the census logo in the official census colours (red, yellow and green).
2. Tell the students that they are now going to take a census, and distribute copies of Handout 2: Taking a census. Read the introduction with them and then have them answer the questions.
3. Ask the students to take the handouts home to remind their families of the census in May 2011.
Suggested level: elementarySubjects: art, social studies, mathematics, language arts
Activity 1: Taking a census
2 2011 Census Activity 1
1. Have the students count the members of the class. They could then organize the data by sex, age, or other characteristics they are in-terested in. This could be done by having the students form groups for the characteristic in question (e.g., girls on one side, boys on the other). Have them re-group for each charac-teristic.
The class should choose items of interest to the students. These could range from favourite colours to method of getting to school. The aim here is to have students recognize that information can be gathered and that the results influence decisions. For example, favourite colours could determine the colours for a new school crest; method of getting to school could determine the number of bike racks needed in the schoolyard.
2. Expand this activity by designating a few students as “interviewers.” Each interviewer could be responsible for one particular item, e.g., favourite TV shows, types of pets, etc. The results could be listed on the chalkboard, followed by a discussion of the class profile.
If desired, students could graph the results.
Have the students create a bulletin board display of what they have done in class. Add pictures and drawings.
Activity 1: Enrichment

2011 Census Activity 1
Name: Date:
Handout 1: The census logo
2011 Census Activity 1
Name: Date:
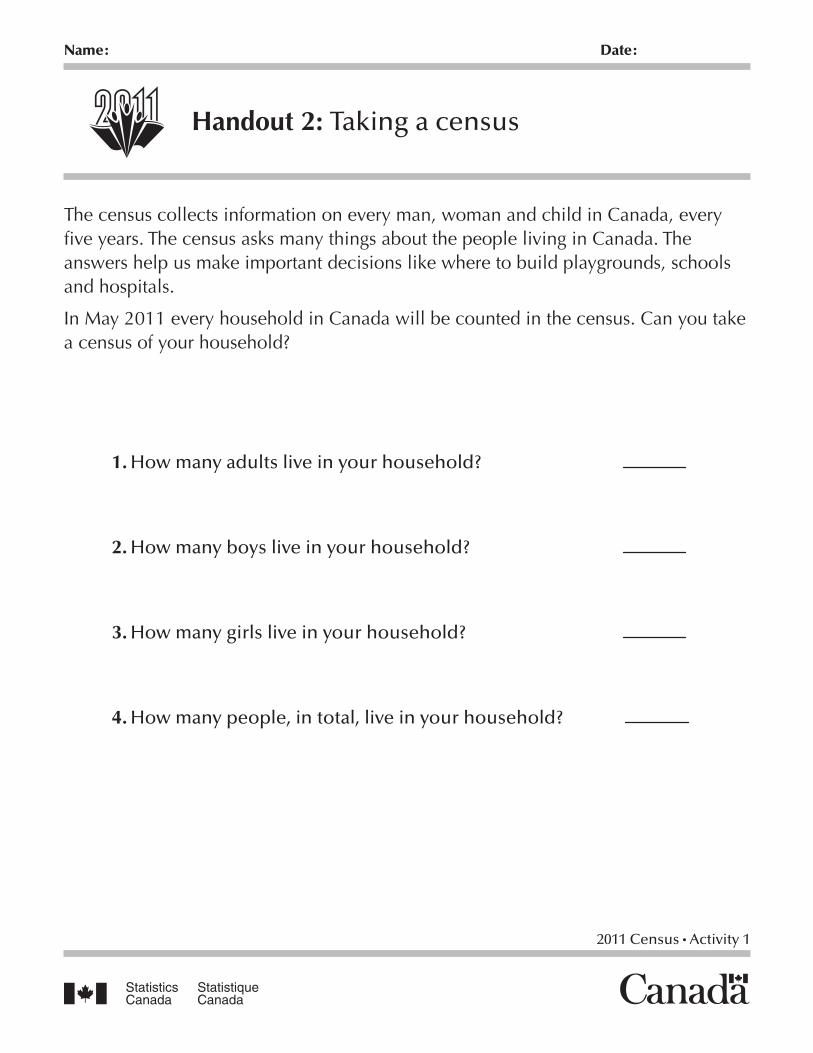
The census collects information on every man, woman and child in Canada, every five years. The census asks many things about the people living in Canada. The answers help us make important decisions like where to build playgrounds, schools and hospitals.
In May 2011 every household in Canada will be counted in the census. Can you take a census of your household?
1. How many adults live in your household?
2. How many boys live in your household?
3. How many girls live in your household?
4. How many people, in total, live in your household?
Handout 2: Taking a census
OverviewThis activity shows students how the answers to the census are useful in decision making when they are totalled and associated with geographic areas.
Students will take part in activities which allow them to use a stylized neighbourhood map, summarize data about persons in households, and make decisions based on the results of their calculations.
Duration: 2 class periods
Note: See the Teacher’s Guide for general background on the census and census vocabulary.
Learning objectives• Define the term census.
• Summarize and verify a set of data.
• Use an example to make a decision.
• See how important decisions are affected when census information is not complete.
• Understand how individual behaviours can have an impact on others.
Vocabularycensus, dwelling, population
Materials• Teacher’s Guide
• Handout 1: Map of Centreville neighbourhood
• Handout 2: Counting the Centreville neighbourhood
• Red pencils / markers (not included).
Getting started1. Introduce this activity by discussing the
vocabulary. Tell the students that they are going to be learning some important words. Begin with the word “census.” Ask the students if they know the meaning of this word.
2. Tell the students that a census takes place every five years in Canada. Ask them if they know when the next census will take place. As a follow-up question, ask why a census is taken every five years in Canada. (Answers: May 2011; to provide accurate and up-to-date information.)
3. Explain the words “population” and “dwelling.” Ask the students why these are important words to know. Tell them that these words describe what is counted in a census. The census also collects information about people (such as age and sex).
4. Tell the students that they will see how information collected in the census is used in making decisions.
Suggested level: elementarySubjects: mathematics, social studies, geography
Activity 2: Add! Don’t subtract! —A complete count
2 2011 Census Activity 2
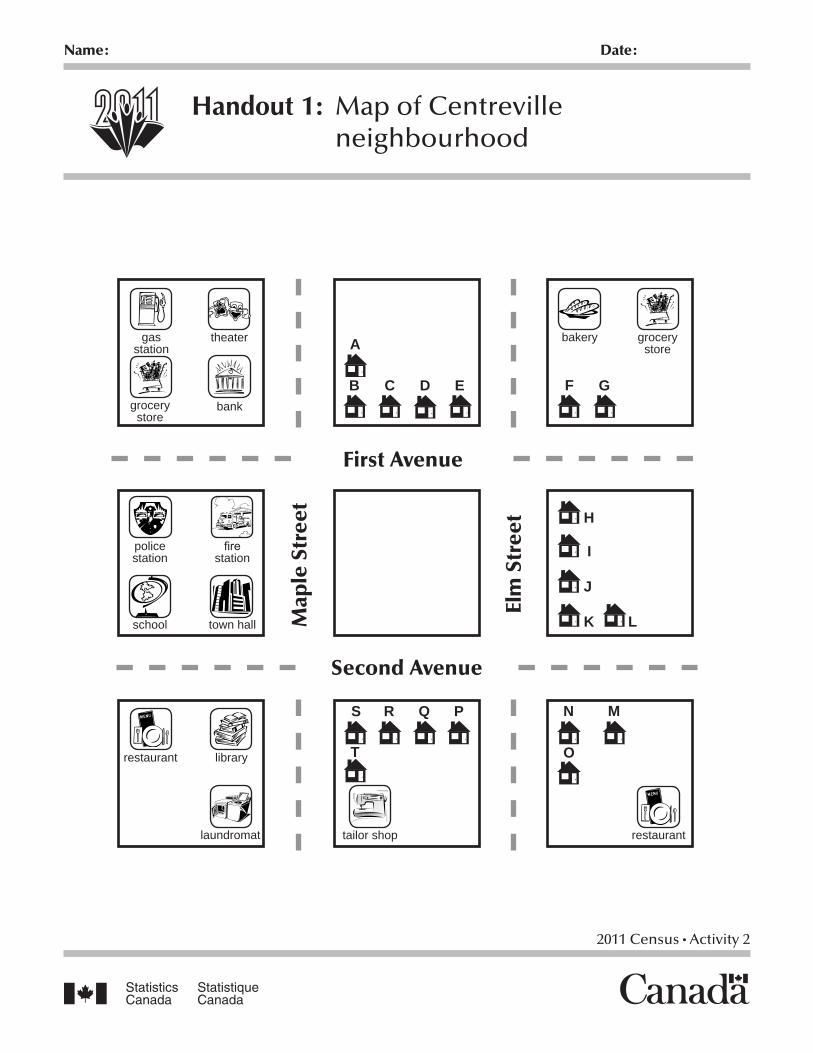
Census activity1. Distribute Handout 1: Map of Centreville
neighbourhood. Go over the map with the students and answer any questions.
2. Present the following story to the class:
The mayor of Centreville wants to build a new park on the vacant block in the centre of your map. The park would be used by people in the surrounding neighbourhood. The mayor has posed this question: Do children and seniors make up at least one-half of the neighbourhood’s population? If they do, he will propose building the park. If they do not, he will agree to build a shopping mall for adults.
You are the town planner. The mayor has given you a table that shows results from the census describing the ages of people in the neighbourhood. He has asked you to help him decide whether or not to build the park.
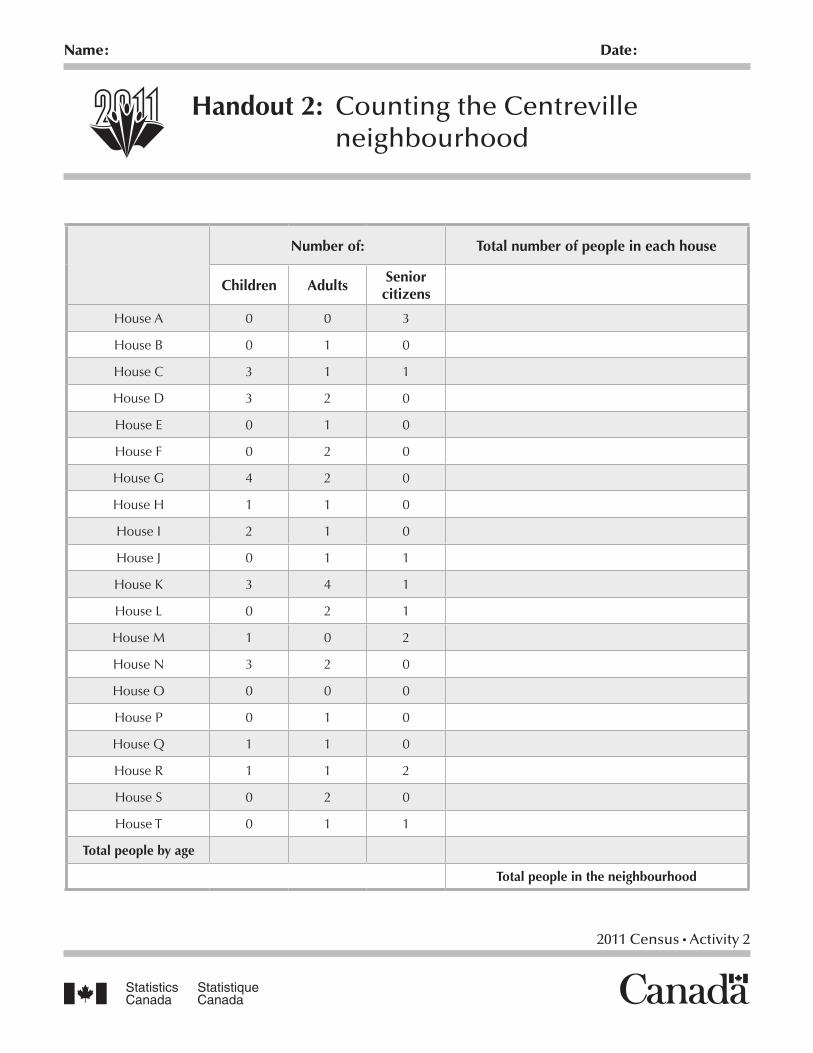
3. Distribute Handout 2: Counting the Centreville neighbourhood. Tell the students that they will be totalling the numbers of children, adults and senior citizens living in Houses A to T.
4. Familiarize the students with the table. Emphasize that in order for the mayor to make his decision, the information must be totalled. A decision cannot be made just by looking at the information about the people in the neighbourhood.
5. Have the students calculate the total number of people in each house by adding across each row. Next, ask them to determine the total population of the neighbourhood by adding the column titled Total number of people in each house (Answer: 60).
Have students calculate the totals for each of the columns marked Children, Adults, and Senior citizens (Answers: 22, 26, 12). Have them write their answers at the bottom of each column.
Have the students cross-check their calculations by adding the total of the three columns together. The sum should equal the figure for the total number of people in the neighbourhood.
6. Ask the students which of their totals will answer the mayor’s question. Ask them how they will arrive at their answer.
The students only need to use the figures in the columns: Children (22), Senior citizens (12) and Total number of people in the neighbourhood (60). The question they must answer is: Are the number of children plus the number of senior citizens greater than or equal to one-half of the total number of people in the neighbourhood, or is 22 + 12 equal to or greater than 60 divided by 2? The answer is yes. The park can be built on the centre block of the map.
Activity 2: Add! Don’t subtract! –A complete count
3 2011 Census Activity 2
Explain to the students that they are now going to learn what happens when some people are not counted. They will repeat the process in steps 5 and 6, except this time the census information they have to work with will not be complete.
1. Using the red pencils / markers, have the students put an X over Houses A, C, D, I and R on the map and cross out all the information from these houses on the table of information presented in Handout 2.
Ask the students to imagine that some people did not fill in their census questionnaires. The people in Houses A and C did not think they had to fill in their questionnaire. The people in Houses D and I did not care about the census and the people in House R refused to return their questionnaire.
Because people were left out of the census, the numbers describing the neighbourhood have changed. Ask the students to find out how much the information has changed. Ask them if the changes in information will change the mayor’s decision.
2. Have the students repeat the calculations they did for the complete count. The new figures are: Children (13), Adults (23), Senior citizens (6) and Total number of people in the neighbourhood (42).
Now the question is: Is 19 greater than or equal to 21? The answer is no. Because some people were not counted in the census, the mayor will build a shopping mall instead of a park, when in fact the park was needed.
Discuss with the students how the decisions of a few people who left themselves out of the census affected the whole neighbourhood. See if they can apply the concept to their own community.
Activity 2: Enrichment
2011 Census Activity 2
Name: Date:
Handout 1: Map of Centreville neighbourhood
First Avenue
Second Avenue
Map
le S
tree
t
Elm
Str
eet
bakery grocery store
gas station
grocery store
theater
bank
A
B C D E F G
H
I
J
K L
P
T
N M
O
police station
fire station
school town hall
libraryrestaurant
restaurantlaundromat tailor shop
S R Q
2011 Census Activity 2
Name: Date:
Handout 2: Counting the Centreville neighbourhood
Number of: Total number of people in each house
Children Adults Senior citizens
House A 0 0 3
House B 0 1 0
House C 3 1 1
House D 3 2 0
House E 0 1 0
House F 0 2 0
House G 4 2 0
House H 1 1 0
House I 2 1 0
House J 0 1 1
House K 3 4 1
House L 0 2 1
House M 1 0 2
House N 3 2 0
House O 0 0 0
House P 0 1 0
House Q 1 1 0
House R 1 1 2
House S 0 2 0
House T 0 1 1
Total people by age
Total people in the neighbourhood
OverviewThis activity gives students hands-on experience with census data, introduces them to data for small geographic areas, refines decision-making skills and demonstrates some of the actual uses of information collected by the census.
Students will examine sets of imaginary data associated with several community services, decide which neighbourhoods would benefit most from each service, and illustrate their findings on a grid map.
Duration: 1-2 class periods
Note: See the Teacher’s Guide for general background on the census and census vocabulary.
Learning objectives• Interpret a statistical table and a grid map.
• Sort and rank numeric values.
• Graphically display information on a grid map.
• Name at least one type of information collected in a census.
Vocabularycensus, census data, grid map
Materials• Handout 1: Important decisions don’t just
happen!
• Handout 2: Census data — Table 2: Population by neighbourhood. (Optional to make an overhead rather than pass out individual copies.)
• Handout 3: Census grid map of Maple and “Student exercise” instructions. (You may wish to make an overhead of this handout so that you can use it when explaining the exercise and when reviewing the answers with the class.)
• Coloured pencils or markers (not included).
Getting startedAsk your students to imagine that they work for a company called Data-R-Us, which provides statistical data to the public. Data-R-Us will be looking at statistical data for a town called Maple, a community where 75% of the families have children younger than six years of age. What special concerns do they think the residents of this community have?
Ask your students to brainstorm ideas for the kinds of special services a town like Maple should offer. The answers will vary but will probably include schools, daycare centres, playgrounds, libraries, sports complexes and health centres.
Suggested level: elementary, intermediateSubjects: social studies, mathematics, geography
Activity 3: Important decisions don’t just happen! Using data to plan your services
2 2011 Census Activity 3
Have students explain their recommendations. Ask what factors influenced their decisions. Did they consider the number of families with young children?
Share with the students, that in today’s world, millions of dollars can be lost on a guess. That’s why people need facts to make decisions. For example, retail businesses use data to help choose new locations or to add new products and they often turn to data that have been gathered by the census.
1. Explain to the students that real-life decisions require the support of this type of statistical information. The Canadian census is an important source of current statistical data and it is conducted by Statistics Canada every five years. The next census will take place in May 2011.
Allot time to discuss the upcoming census with the class and how census data are used everyday in our communities. Census data are used at the local, provincial and federal government levels as well as by community organizations, businesses and individuals. (See “Who uses census data?” in the Teacher’s Guide.)
2. Tell the students that, as employees of Data-R-Us, they are going to complete four requests that have come in from the town of Maple. They will use the statistical data provided to give their recommendations to the clients.
Teacher instructions1. Distribute Handout 1. Explain to the
students that they are going to be researchers at Data-R-Us. Their task will be to select the most appropriate neighbourhoods, in the fictional town of Maple, for new community services. Read Handout 1 aloud (or have student volunteers read it for you) and discuss Table 1.
2. This exercise lends itself to group work. Divide the class into groups of three to five students and tell them that they will be asked to work together to determine where to locate the services on a map.
3. Distribute Handout 2 and discussTable 2. Column 1 lists each neighbourhood by number; column 2 the population aged 15 years and under; column 3 lists the population aged 65 years and over; and column 4 lists the total population including people who are older than 15 and younger than 65.
To demonstrate how to interpret the data presented in Handout 2 Table 2, discuss the following with the class:
The largest number of people 15 years of age and younger is in neighbourhood 1. Also in this neighbourhood you will see that there are more children than seniors (people – 65 years and over). Based on this information, neighbourhood 1 will be a neighbourhood to consider for a playground.
Activity 3: Important decisions don’t just happen! Using data to plan your services
3 2011 Census Activity 3
4. Students will use Handout 1 Table 1 and Handout 2 Table 2 to decide on the best neighbourhoods for each service. This will be determined by finding neighbourhoods with the largest number of people who need the service. For example, for the playground, they will choose the neighbourhoods with the greatest number of children.
5. Distribute Handout 3 to each group or to each student. This handout is a grid map of Maple where each neighbourhood is identified by a number. It also contains the specific instructions the students should follow to complete the exercise — under the title “Student exercise.”
Student exercise1. Find the four best neighbourhoods for the
playground.
2. Find the four best neighbourhoods for the seniors’ centre.
3. Find the two best neighbourhoods for the medical centre by using the results from request numbers one and two.
4. Find the five best neighbourhoods for the bus route.
• Once your group decides which neighbourhoods the first service should be located in, mark them on the census grid map. Do this by filling in the squares for each neighbourhood with the colour for the service. (The colour for each service is shown in the legend.) Neighbourhood 1, one of the choices for locating the playground, has already been marked for you. You may go ahead and colour it in with yellow. Continue to find the next best neighbourhoods for a playground and the senior’s centre. (It is possible to have more than one service located in the same neighbourhood.)
• After you have correctly identified the best neighbourhoods for the playground and the senior’s centre, the best place for the medical centre should be automatically evident. (Hint* the neighbourhoods selected for the playground and the seniors’ centre will overlap.) Indicate the best neighbourhoods for the medical centre by circling the two neighbourhoods with the appropriate colour.
• The final task is to identify the five best neighbourhoods for the bus route using Handout 1 Table 1 and Handout 2. The bus route should accommodate the neighbourhoods with the largest populations.
Activity 3: Important decisions don’t just happen! Using data to plan your services
4 2011 Census Activity 3
Activity 3: Enrichment
1. Have your students discuss other census data that would be important in researching the best location for these services. Of course not all other important data are necessarily census-related. Availability of land, land prices in the community, existing street patterns, bus routes, and the present locations of similar services will be considered in the selection of a site.
2. Ask your students to visit the Statistics Canada website www.statcan.gc.ca and research census data on the age distribution of their own community and province.
Go to the Statistics Canada website www.statcan.gc.ca and find the “browse by” section. Click on “key resource” and select “Community Profiles” from the list.
Students can type the name of their community in the space provided for “place name.” Information about smaller communities can be found by clicking the link for “Census Tract (CT) Profiles” (above the “place name”) and typing a postal code in Option 1.
Alternatively, access this information yourself and provide the selected data to your students.
3. Have the students report on any new services in their community. Discuss why these new services are located where they are. Municipal offices, chambers of commerce and provincial development agencies are good sources of current information about communities.
5 2011 Census Activity 3
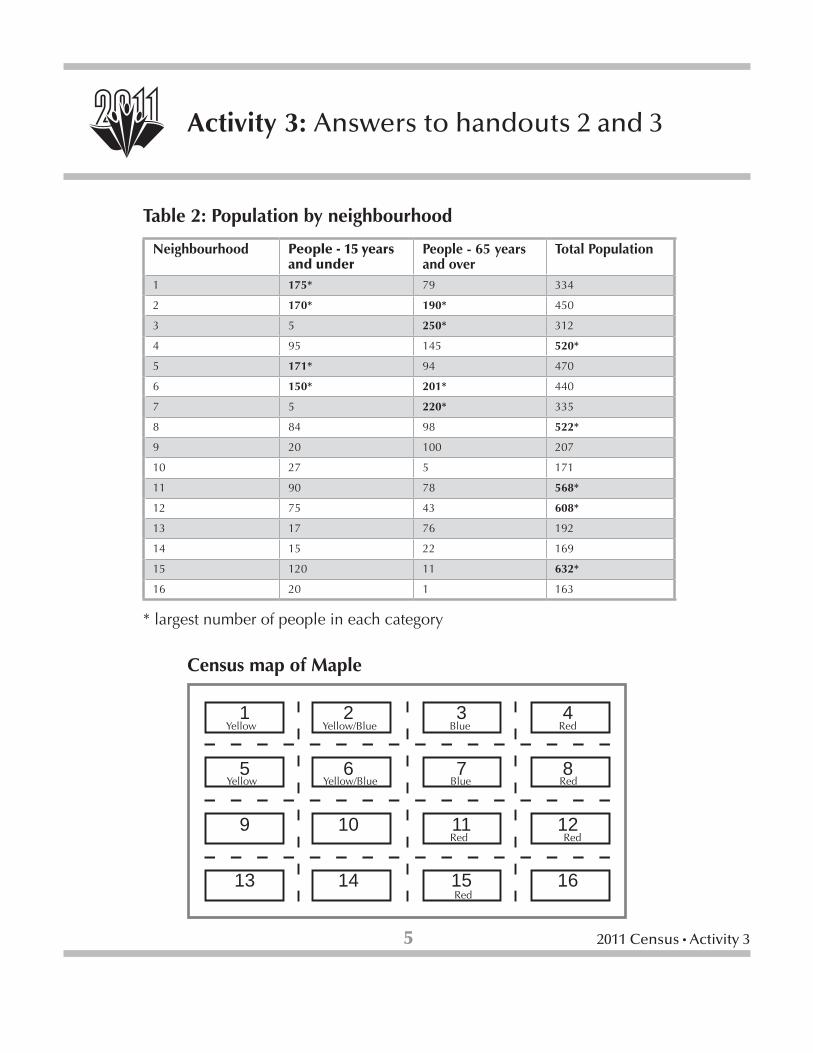
Activity 3: Answers to handouts 2 and 3
Table 2: Population by neighbourhood
Neighbourhood People - 15 years and under
People - 65 years and over
Total Population
1 175* 79 334
2 170* 190* 450
3 5 250* 312
4 95 145 520*
5 171* 94 470
6 150* 201* 440
7 5 220* 335
8 84 98 522*
9 20 100 207
10 27 5 171
11 90 78 568*
12 75 43 608*
13 17 76 192
14 15 22 169
15 120 11 632*
16 20 1 163
Census map of Maple
1 2 3 4
5 6 7 8
9 10 11 12
13 14 15 16
Yellow Yellow/Blue Blue Red
Yellow Yellow/Blue Blue Red
Red Red
Red
* largest number of people in each category
2011 Census Activity 3
Name: Date:
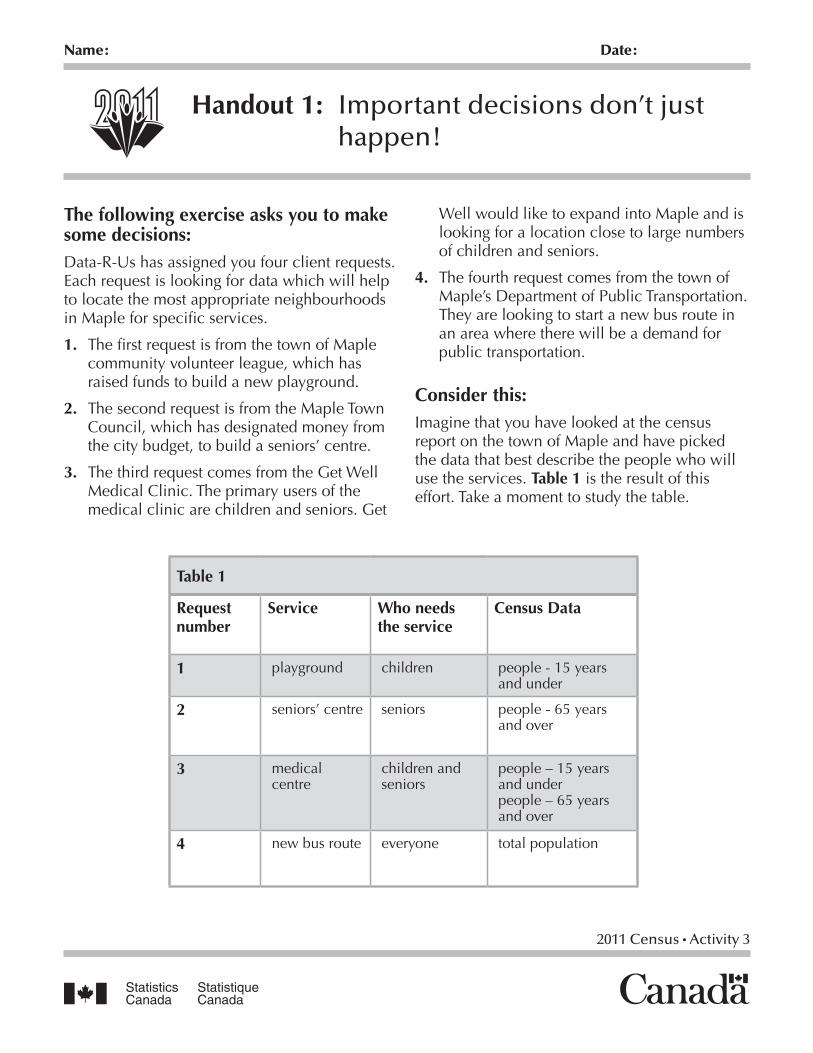
Handout 1: Important decisions don’t just happen!
The following exercise asks you to make some decisions:Data-R-Us has assigned you four client requests. Each request is looking for data which will help to locate the most appropriate neighbourhoods in Maple for specific services.
1. The first request is from the town of Maple community volunteer league, which has raised funds to build a new playground.
2. The second request is from the Maple Town Council, which has designated money from the city budget, to build a seniors’ centre.
3. The third request comes from the Get Well Medical Clinic. The primary users of the medical clinic are children and seniors. Get
Well would like to expand into Maple and is looking for a location close to large numbers of children and seniors.
4. The fourth request comes from the town of Maple’s Department of Public Transportation. They are looking to start a new bus route in an area where there will be a demand for public transportation.
Consider this:Imagine that you have looked at the census report on the town of Maple and have picked the data that best describe the people who will use the services. Table 1 is the result of this effort. Take a moment to study the table.
Table 1
Request number
Service Who needs the service
Census Data
1 playground children people - 15 years and under
2 seniors’ centre seniors people - 65 years and over
3 medical centre
children and seniors
people – 15 years and under people – 65 years and over
4 new bus route everyone total population
2011 Census Activity 3
Name: Date:
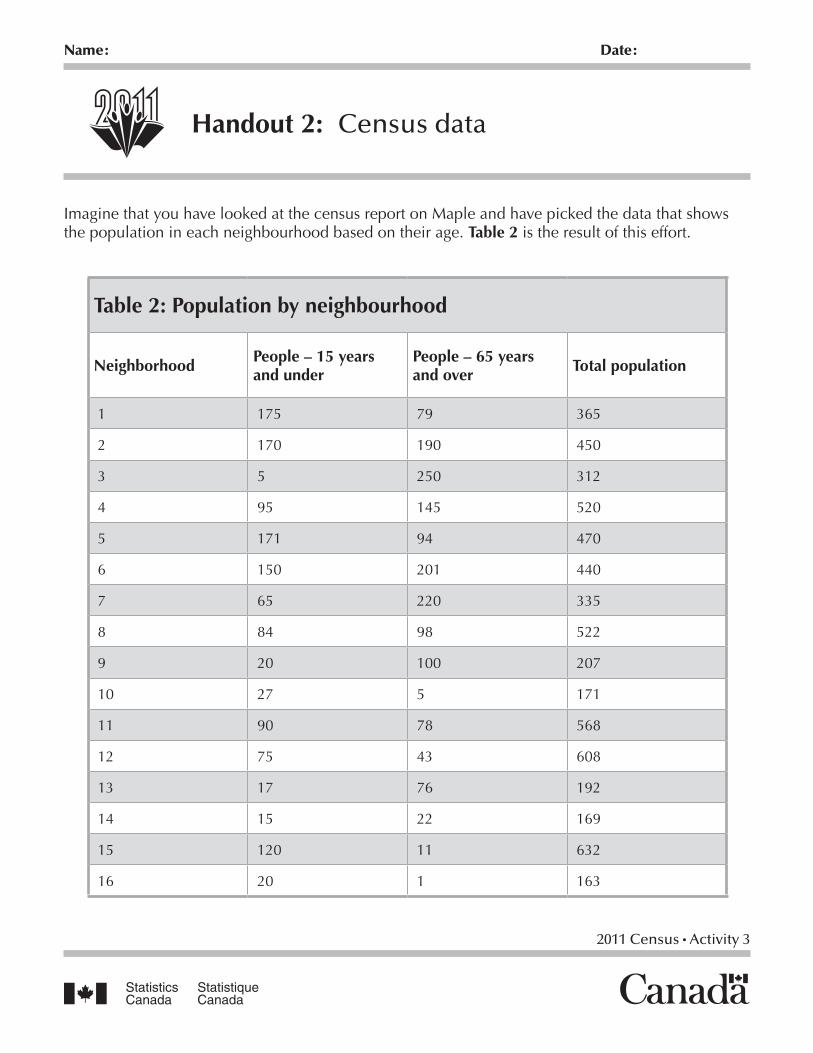
Table 2: Population by neighbourhood
Neighborhood People – 15 years and under
People – 65 years and over Total population
1 175 79 365
2 170 190 450
3 5 250 312
4 95 145 520
5 171 94 470
6 150 201 440
7 65 220 335
8 84 98 522
9 20 100 207
10 27 5 171
11 90 78 568
12 75 43 608
13 17 76 192
14 15 22 169
15 120 11 632
16 20 1 163
Handout 2: Census data
Imagine that you have looked at the census report on Maple and have picked the data that shows the population in each neighbourhood based on their age. Table 2 is the result of this effort.

2011 Census Activity 3
Name: Date:
Handout 3: Census grid map of Maple
The town is divided into 16 neighbourhoods which appear on the grid map below.
Census map of Maple
1 2 3 4
5 6 7 8
9 10 11 12
13 14 15 16
Legend - best locations
playgound
seniors’ centre
medical centre
bus route
Yellow
blue
green
red
1. Find the four best neighbourhoods for the playground.
2. Find the four best neighbourhoods for the seniors’ centre.
3. Find the two best neighbourhoods for the medical centre by using the results from request numbers one and two.
4. Find the five best neighbourhoods for the bus route.
• Once your group decides which neighbourhoods the first service should be located in, mark them on the census grid map. Do this by filling in the squares for each neighbourhood with the colour for the service. (The colour for each service is shown in the legend.) Neighbourhood 1, one of the choices for locating the playground, has already been marked for you. You may go
ahead and colour it in with yellow. Continue to find the next best neighbourhoods for a playground and the senior’s centre. (It is possible to have more than one service located in the same neighbourhood.)
• After you have correctly identified the best neighbourhoods for the playground and the senior’s centre, the best place for the medical centre should be automatically evident. (Hint* the neighbourhoods selected for the playground and the seniors’ centre will overlap.) Indicate the best neighbourhoods for the medical centre by circling the two neighbourhoods with the appropriate colour.
• The final task is to identify the five best neighbourhoods for the bus route using Handout 1 Table 1 and Handout 2. The bus route should accommodate the neighbourhoods with the largest populations.
Yellow

2011 Census Activity 3
Name: Date:
The Census logo
Census, May 2011
OverviewThis activity makes students aware of the countries in which people who immigrate to Canada are born. Students will gain an understanding of the multicultural nature of Canadian society by examining the cultural diversity present within their classroom.
Duration: 1-2 class periods. As an enrichment exercise, they can look at how immigrants contribute to our society.
Note: See the Teacher’s Guide for general background on the census and census vocabulary.
Learning objectives• Develop an awareness of the countries in
which people who immigrate to Canada are born.
• Help students locate their country of birth on a world map.
• Explore / express personal experiences of immigration to Canada through pictures or stories.
• Recognise contributions that immigrants have made and continue to make to Canadian society.
Vocabularydiversity, immigrate, immigration, immigration source areas, place of birth
Materials• Teacher’s Guide
• Handout 1: Immigration source areas
• Handout 2: Immigrant population by country of birth and period of immigration
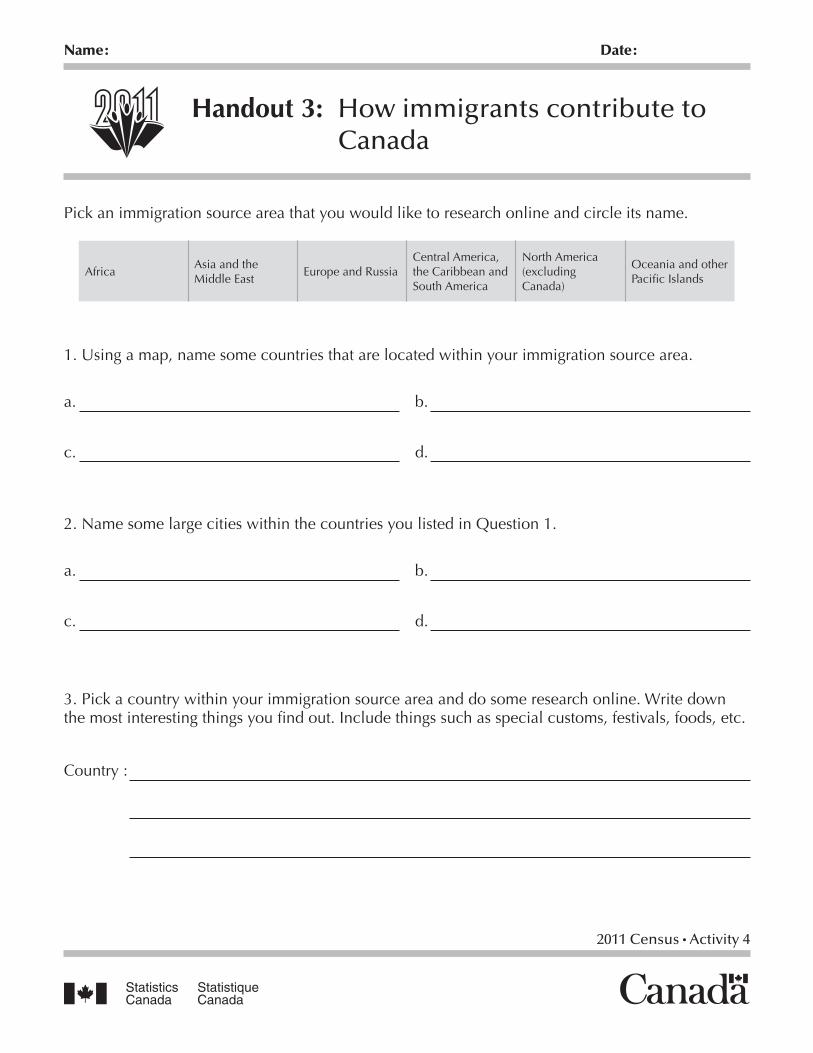
• Handout 3: How immigrants contribute to Canada
Getting startedUsing the background information provided in the Teacher’s Guide, tell students about the census and let them know that Canada’s next census takes place in May 2011. Explain that immigration information is used to provide services for new immigrants to Canada.
Suggested level: elementary, intermediateSubjects: geography, social studies, language arts
Activity 4: Where do we come from?
2 2011 Census Activity 4
Census activity1. Distribute Handout 1: Immigration source
areas
Ask your students to name the country in which they were born and find its approximate location on the world map. Instruct students to write in the name of their country near its location and draw an arrow connecting their place of birth to where they live now in Canada. Students who were born in Canada can simply place a dot near their place of birth. Have all students outline or colour in the countries based on the colour key at the bottom of the Handout 1.
(Maps can be displayed so that students can see the various places of birth of their classmates. Options include increasing the size of the map and having all students write on one map or copying the map to an overhead and using this for the entire class.)
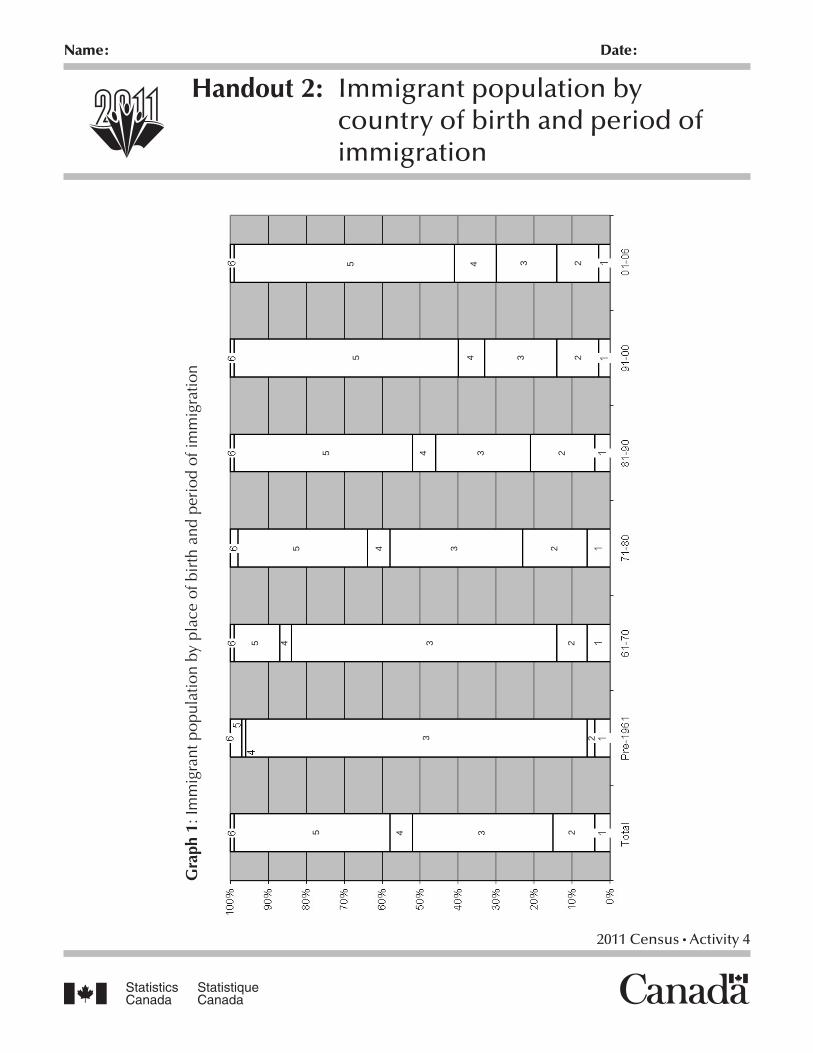
2. On Handout 2: Immigrant population by country of birth and period of immigration, you will find a graph.
Ask your students to colour the stacked columns in the graph according to the colour key at the bottom of Handout 1. Compare Handout 1 and Handout 2side-by-side in order to have a better visual representation of the origins of Canada’s immigrant population.
For more detailed information check our website www.statcan.gc.ca.
• Clickonthecensusimageonthetoprightcorner of the page.
• SelectReleasetopicsunder2006Census,on the left side of the page.
• SelectImmigrationandcitizenship.
• SelectTopic-basedtabulations.
• SelectPeriodofimmigration.
• Table5providesthefulldatausedtoproduce the table in Handout 2.
Activity 4: Where do we come from?
3 2011 Census Activity 4
3. Let your students tell the story
(a) Do a mini survey of the classroom counting the total number of students from each country. Display the results on the board, Smartboard or overhead.
(b) In a class that includes students who have immigrated to Canada, invite students to share their experiences.
(c) If all of the students were born in Canada, invite someone from outside the class who immigrated to Canada to share their experiences.
(d) Students with parents, grandparents, or neighbours who are immigrants, could ask them about their experience, and report back to the class with the stories they have gathered.
Here are a few questions you can use to start the discussion.
Where were you born?
How long ago did you come to Canada?
Why did you come?
When you immigrated to Canada, were there others who came here at the same time?
Activity 4: Where do we come from?
Did you already speak English or French when you came to Canada?
What language(s) did you learn as a young child? Do you still speak it (them) now?
Did you play the same or different games? Tell us about your culture’s art and music.
What was the most important thing you brought with you when you came to Canada?
What did you find hardest to learn or adjust to in Canada?
What do you like best about living here?
(e) Have each student express ideas about immigrating to Canada by writing a story or drawing pictures. Students who were born in Canada may write or draw from the perspective of a fictional student who immigrated to Canada.
4 2011 Census Activity 4
1. Ask your students to write a story (their own or one they have heard) about immigration to Canada. This story could be included in a book format where each student’s story can be a chapter.
2. Using Handout 3: How immigrants contribute to Canada, help your students research a source area and country of their choice or a country which fits into the social studies curriculum. The work could be done individually or in groups.
3. Ask your students to visit the Statistics Canada website, www.statcan.gc.ca, and research immigration characteristics of their community and province.
• Clickonthecensusimageonthetoprightcorner of the page.
• Selectthe2006 Community Profiles button, which also appears on the right side of the page.
Ask students to produce a chart using the data in the profiles. Charts may be drawn by hand or, where available, by using software such as Excel.
Activity 4: Enrichment

2011 Census Activity 4
Name: Date:
Handout 1: Immigration source areas
Map of immigration source areas
42
6
3
1
65
Colour key1. North America (excluding Canada). . . . . . . . . . . . . . . . . . . red2. Central America, the Caribbean and South America. . . .green3. Europe and Russia. . . . . .. . . . . . . . . . . . . . . . . . . . . . .yellow
1. Africa. . . . . . . . . . . . . . . . . . . . . . . . . blue2. Asia excluding Russia. . . . . . . . . . . . orange3. Oceania and other Pacific Islands. . . purple
Color the map and graph using the colour key.
Colour key legend
1. North America (excluding Canada) red
2. Central America, the Caribbean and South America green
3. Europe and Russia yellow
4. Africa blue
5.AsiaandtheMiddleEast orange
6.OceaniaandotherPacificIslands purple
2011 Census Activity 4
Name: Date:
Handout 2: Immigrant population by country of birth and period of immigration
2345
23
2345
2345
2345
2345
2345
Gra
ph 1
: Im
mig
rant
pop
ulat
ion
by p
lace
of b
irth
and
per
iod
of im
mig
ratio
n
2011 Census Activity 4
Name: Date:
Handout 3: How immigrants contribute to Canada
Pickanimmigrationsourceareathatyouwouldliketoresearchonlineandcircleitsname.
AfricaAsia and the Middle East
Europe and RussiaCentral America, the Caribbean and South America
North America (excluding Canada)
Oceania and other PacificIslands
1. Using a map, name some countries that are located within your immigration source area.
a.
c.
b.
d.
2. Name some large cities within the countries you listed in Question 1.
a.
c.
b.
d.
3.Pickacountrywithinyourimmigrationsourceareaanddosomeresearchonline.Writedownthe most interesting things you find out. Include things such as special customs, festivals, foods, etc.
Country :
2011 Census Activity 4
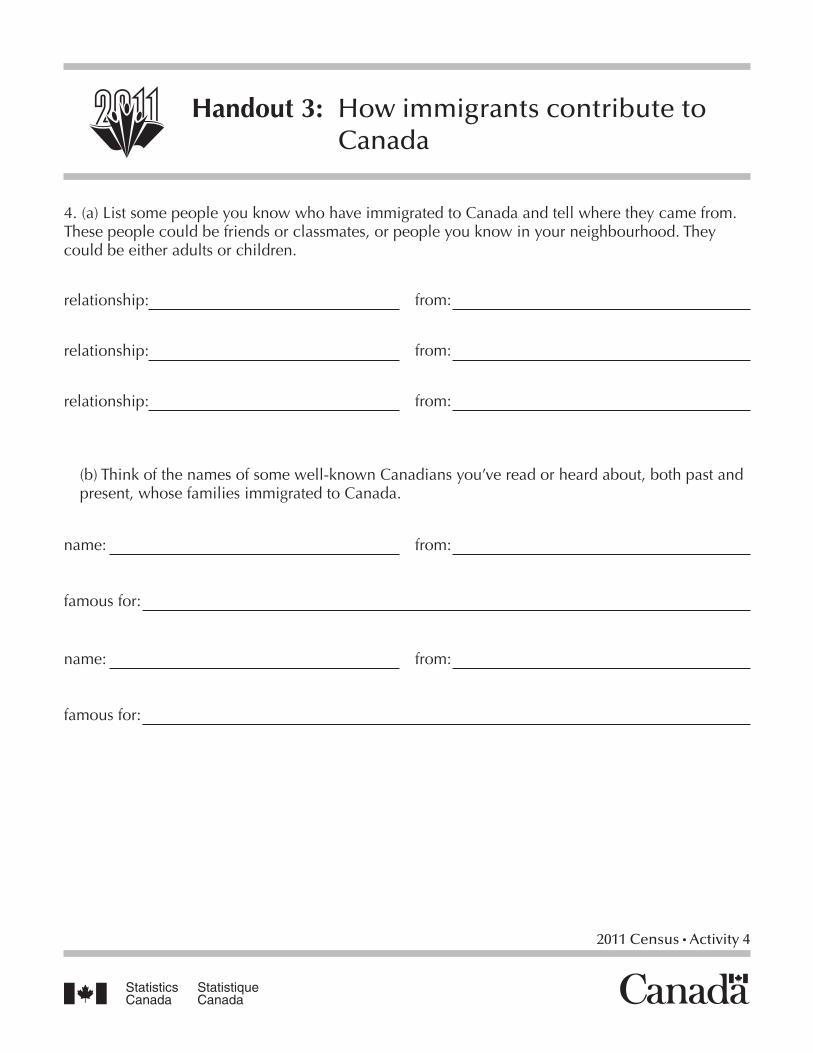
4. (a) List some people you know who have immigrated to Canada and tell where they came from. These people could be friends or classmates, or people you know in your neighbourhood. They could be either adults or children.
relationship:
relationship:
relationship:
(b) Think of the names of some well-known Canadians you’ve read or heard about, both past and present, whose families immigrated to Canada.
Handout 3: How immigrants contribute to Canada
from:
from:
from:
name: from:
famous for:
name: from:
famous for:
OverviewThis activity introduces students to the Census of Agriculture. Students will appreciate the value of agriculture in today’s society and its effect on their lives. Three activities, which provide a detailed picture of Canada’s most important primary industry, are available for various grade levels.
Students will examine sets of imaginary data associated with several community services, decide which neighbourhoods would benefit most from each service, and illustrate their findings on a grid map.
Duration: Handout 1 — 1/2 periodHandouts 2-4 — 1-2 class periods per handout.
Note: See the Teacher’s Guide for general background on the census and census vocabulary. More information on the Census of Agriculture is provided in this activity under the section Census of Agriculture. You may wish to review this information with you students before starting the activities.
Learning objectives• Develop a knowledge of agriculture and its
role as a primary industry.
• Understand the impact agriculture has on every resident in Canada.
• Appreciate that statistics represent real people and their actions.
Materials• Teacher’s Guide
• Handout 1: Breads of the world
• Handout 2: Agriculture today
• Handout 3: A farming tradition
• Handout 4: Land size conversions and comparisons
Getting startedUsing the background information provided in the Teacher’s Guide, tell students about the census and let them know that Canada’s next census takes place in May 2011.
Explain to your students that there are two types of censuses: a Census of Population and a Census of Agriculture. The Census of Agriculture is taken at the same time as the Census of Population to find out about the country’s farming and food production.
In May 2011, each agriculture operation in Canada will receive a Census of Agriculture questionnaire in the mail. The Census of Agriculture collects a wide range of data on the agriculture industry. More information on the Census of Agriculture can be found on pages 5-6.
Suggested level: elementary, intermediate, seniorSubjects: mathematics, geography, science, language arts, history, theatre arts,
economics, family studies
Activity 5: Agriculture at a glance
2 2011 Census Activity 5
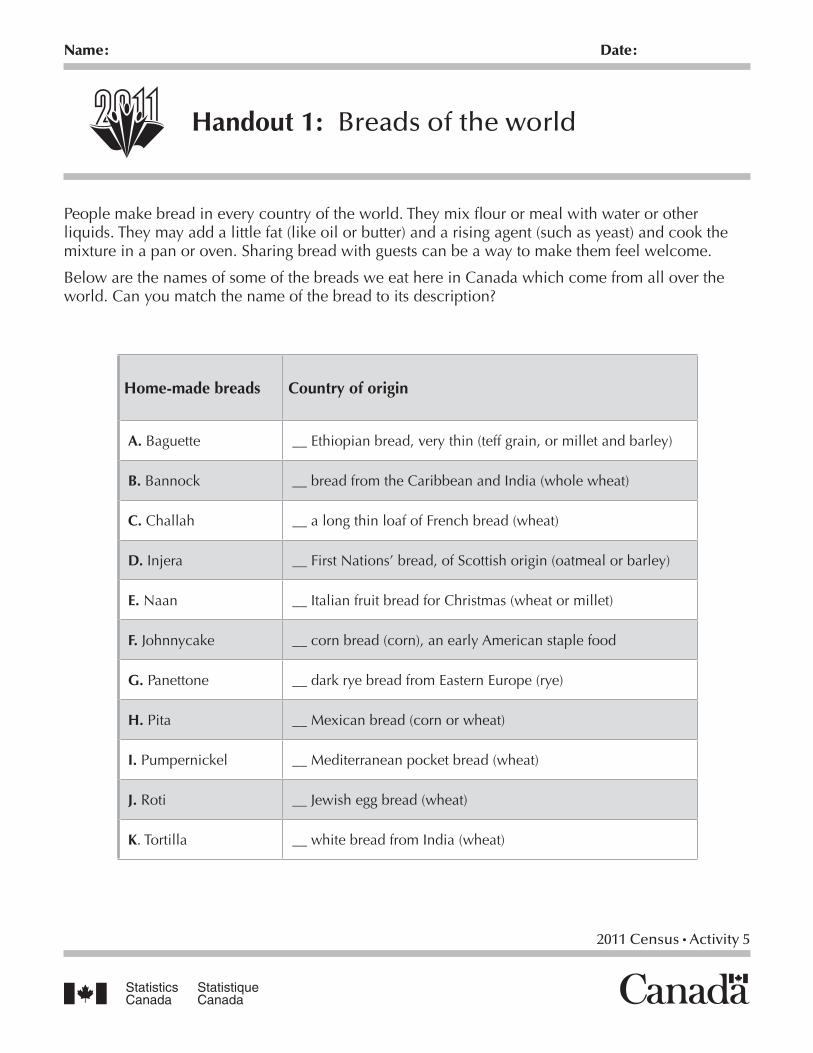
Census activity1. Distribute Handout 1: Breads of the world.
Have students match the bread name to its grain and country of origin. This activity is suitable for elementary, intermediate and senior grade levels.
Answers: D, J, A, B, G, F, I, K, H, C, E
To expand on this activity, ask the students to bring in samples of the grain products listed in Handout 1.
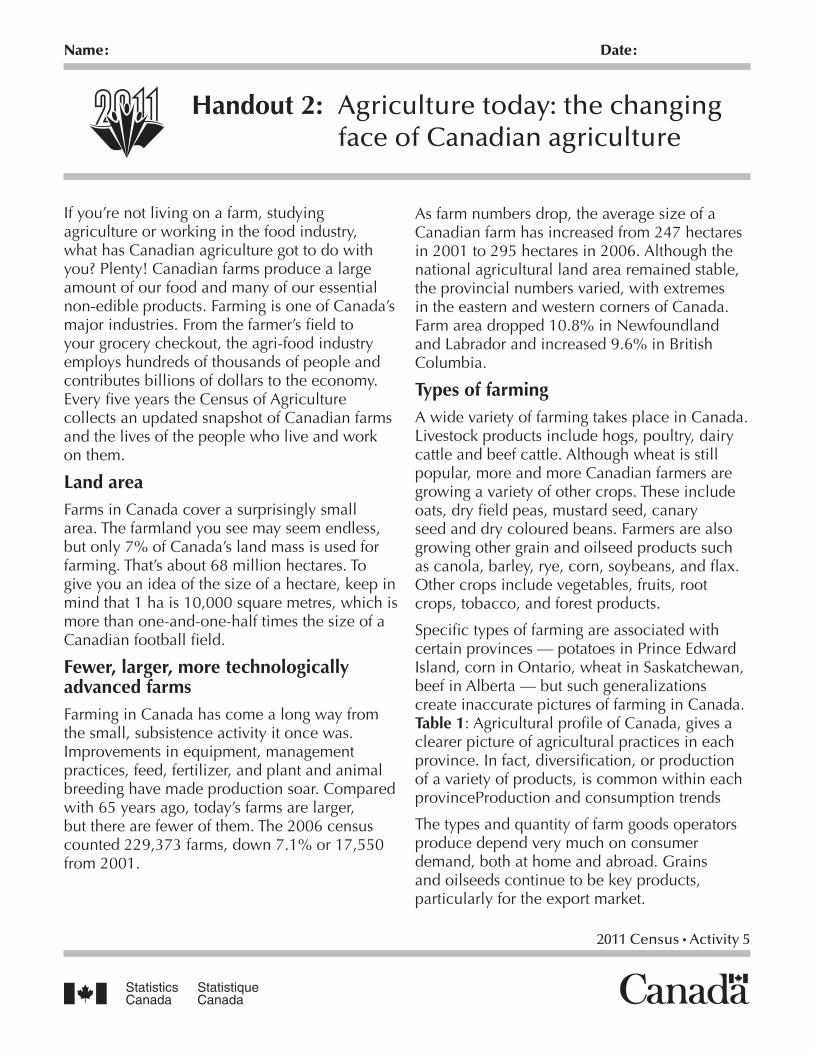
2. Distribute Handout 2: Agriculture today, to your students. Read Handout 2 together as a group. You may also choose to print an instructor’s copy only and place interesting facts for discussion on the board or overhead.
Discuss the trends in farming identified in Handout 2. These include:
All grade levels
• types of farming
• the decreasing number of farms
• management of farms by men and women
• families on farms
Intermediate and senior grade levels only
• the move to larger, more specialized farms
• production and consumption trends
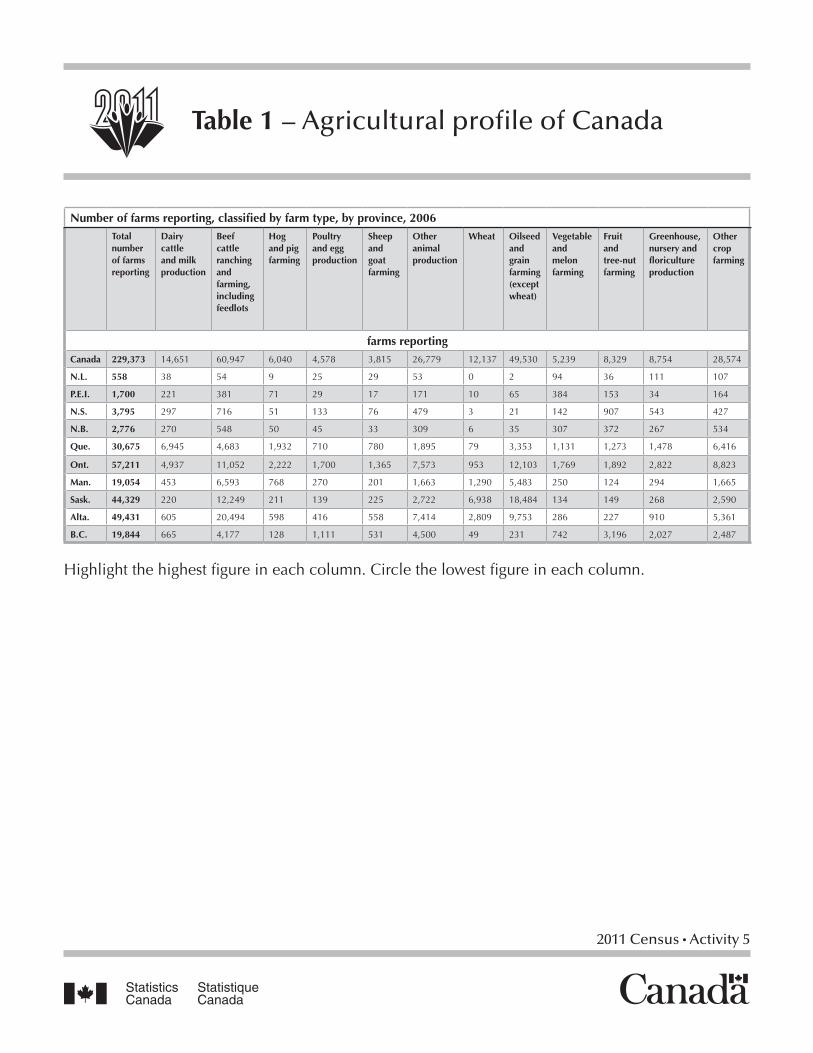
Have the students review the information provided in Table 1. To highlight the difference in Canada’s provinces, students can highlight the highest figure in each
column and circle the lowest figure in each column. You can then discuss with the students the differences across the provinces and the information they find most surprising.
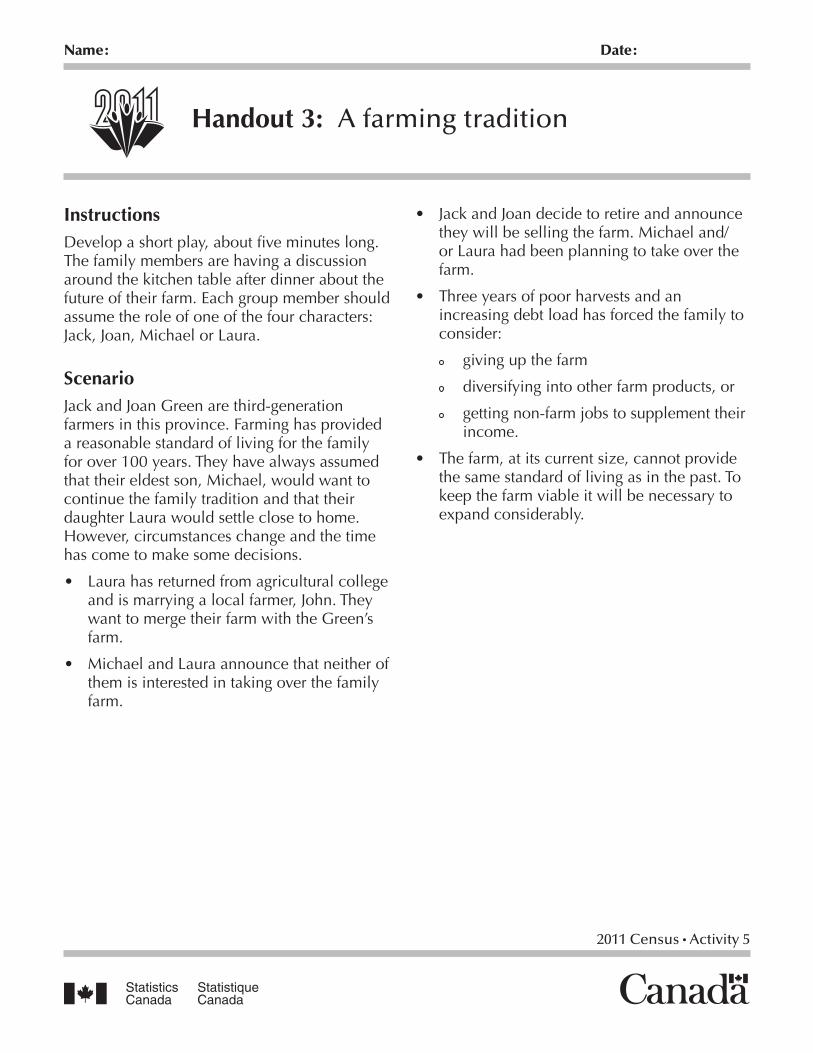
3. Divide the class into small groups of four.Distribute Handout 3: A farming tradition. Have your students read through Handout 3. Have them choose a character to portray. Students can role play one of the scenarios or make up their own scenario. Each character can add his/her point of view based on the farming trends identified in Handout 2. This activity is suitable for all grade levels.
Students can create cue cards to remember facts. They may rehearse the scene around a desk that could serve as the kitchen table.
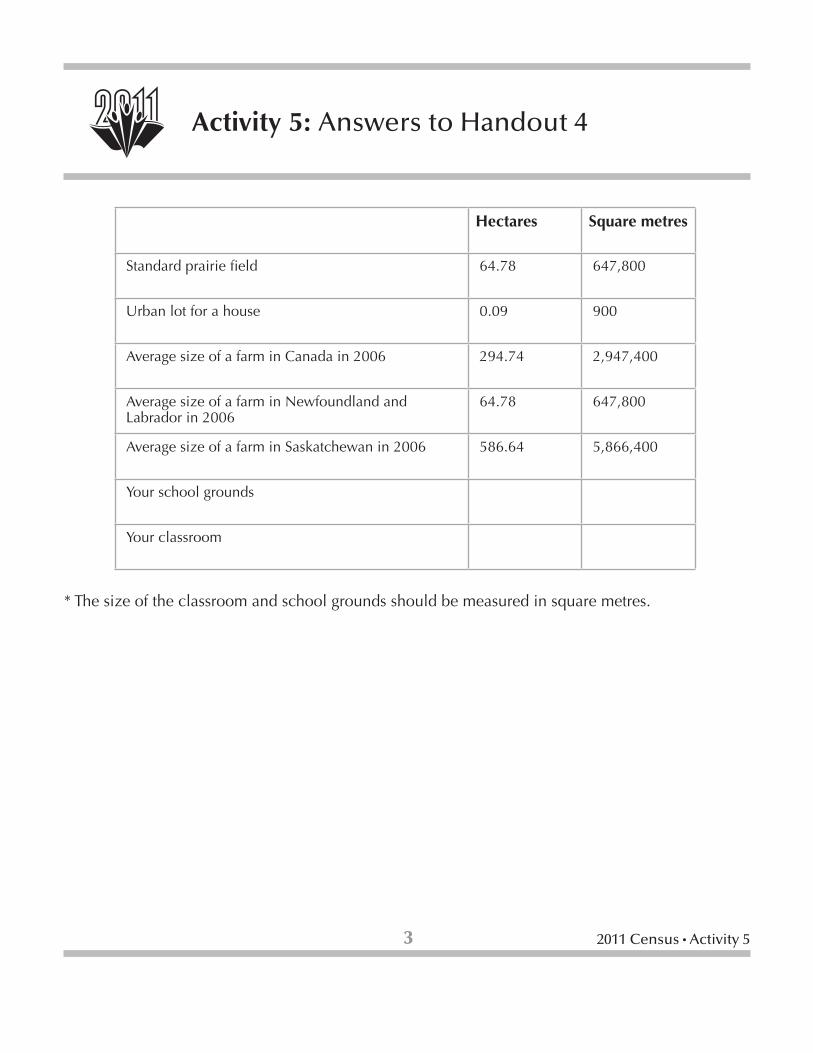
4. Distribute Handout 4: Land size conversions and comparisons. This activity is suitable for intermediate and senior grade levels. Calculators are required.
Have students convert the figures provided in Handout 4, and add in the school’s figures. Measurements of the school grounds may be available from the school or students may measure it themselves.
Review the conversion formula and the steps to writing numbers in scientific notation.
1 hectare [ha] = 10,000 square metres [m2].
Activity 5: Agriculture at a glance
3 2011 Census Activity 5
Activity 5: Answers to Handout 4
* The size of the classroom and school grounds should be measured in square metres.
Hectares Square metres
Standard prairie field 64.78 647,800
Urban lot for a house 0.09 900
Average size of a farm in Canada in 2006 294.74 2,947,400
Average size of a farm in Newfoundland and Labrador in 2006
64.78 647,800
Average size of a farm in Saskatchewan in 2006 586.64 5,866,400
Your school grounds
Your classroom
4 2011 Census Activity 5
Organize a field trip to a nearby farm to study the farm operation and interview the farm operators.
Invite a guest speaker to class to talk about farming from his or her perspective. This could be a retired farmer, a student from an agricultural college, an agricultural scientist, a representative from provincial agricultural offices or laboratories, a real-estate agent, a farm auctioneer or a practising farmer.
Activity 5: Enrichment
5 2011 Census Activity 5
Activity 5: The Census of Agriculture
HistoryThe Census of Agriculture is taken at the same time as the Census of Population to find out about the country’s farming and food production.
Agriculture is an important part of our economy. Jean Talon’s census of 1667 tells us that the colony had 11,448 arpents of land (3,915 hectares) under cultivation, 3,107 cattle, and 85 sheep.
A mid-decade agricultural census was first held in Manitoba in 1896.
When the provinces of Saskatchewan and Alberta were created in 1905, the increasingly rapid settlement of the west made the quinquennial census a constitutional requirement. A new Census and Statistics Act called for additional censuses of population and agriculture to be taken in the provinces of Manitoba, Saskatchewan and Alberta in 1906 and every 10 years after that until the population of each of the three provinces reached 1.25 million. These censuses continued until 1956, when Canada began taking national censuses of population and agriculture every five years.
New in 2011In May 2011, each agriculture operation in Canada will receive a Census of Agriculture questionnaire in the mail. The Census of Agriculture collects a wide range of data on the agriculture industry such as number of farms and farm operators, farm areas, business operating arrangements, land management practices, livestock numbers and crop areas, operating expenses and receipts, farm capital and farm
machinery and equipment. These data provide a comprehensive picture of the agriculture industry across Canada every five years at the national, provincial/territoral and sub-provincial levels.
Users of Census of Agriculture dataCensus of Agriculture data are used by various organizations for many reasons:
• operators use census data to make production, marketing and investment decisions. They can also keep abreast of trends in Canadian agriculture through the analysis of Census of Agriculture data published by the agriculture media.
• producer groups and marketing agencies use census data to tell Canadians and government how they are doing economically through their non-government organizations.
• companies supplying agricultural products and services use the data to determine where to locate their service centres.
• government policy advisors use the data to help develop programs related to safety nets and human resources for the agriculture sector.
• operators can keep abreast of trends in Canadian agriculture through the analysis of Census of Agriculture data published by the agriculture media.
• agriculture websites can target their information to current trends and needs in the sector based on census data.
6 2011 Census Activity 5
Vocabulary• Census of Agriculture: an enumeration
of every farm, ranch or other agricultural operation with sales of agricultural products during the year prior to the census. Held every five years in conjunction with the Census of Population, the Census of Agriculture asks questions about land use, crops, livestock, agricultural labour, farm income, and land management practices.
• Biotechnology: a science that relates biology to technology
• Census farm: an agricultural operation producing at least one agricultural product for sale
• Diversification: giving variety to, expanding into different fields
• Hectare: the metric unit for measuring farmland. One hectare equals 10,000 square metres.
• Net farm income: net income (gross receipts from farm sales minus depreciation and cost of operation) earned by working for oneself (self-employment) as an owner/operator of his/her farm.
• Non-farm work: (formerly called off-farm work) the number of days farm operators worked away from the farming operation at paid agricultural and non-agricultural work.
Activity 5: The Census of Agriculture
2011 Census Activity 5
Name: Date:
Home-made breads Country of origin
A. Baguette __ Ethiopian bread, very thin (teff grain, or millet and barley)
B. Bannock __ bread from the Caribbean and India (whole wheat)
C. Challah __ a long thin loaf of French bread (wheat)
D. Injera __ First Nations’ bread, of Scottish origin (oatmeal or barley)
E. Naan __ Italian fruit bread for Christmas (wheat or millet)
F. Johnnycake __ corn bread (corn), an early American staple food
G. Panettone __ dark rye bread from Eastern Europe (rye)
H. Pita __ Mexican bread (corn or wheat)
I. Pumpernickel __ Mediterranean pocket bread (wheat)
J. Roti __ Jewish egg bread (wheat)
K. Tortilla __ white bread from India (wheat)
Handout 1: Breads of the world
People make bread in every country of the world. They mix flour or meal with water or other liquids. They may add a little fat (like oil or butter) and a rising agent (such as yeast) and cook the mixture in a pan or oven. Sharing bread with guests can be a way to make them feel welcome.
Below are the names of some of the breads we eat here in Canada which come from all over the world. Can you match the name of the bread to its description?
2011 Census Activity 5
Name: Date:
Handout 2: Agriculture today: the changing face of Canadian agriculture
If you’re not living on a farm, studying agriculture or working in the food industry, what has Canadian agriculture got to do with you? Plenty! Canadian farms produce a large amount of our food and many of our essential non-edible products. Farming is one of Canada’s major industries. From the farmer’s field to your grocery checkout, the agri-food industry employs hundreds of thousands of people and contributes billions of dollars to the economy. Every five years the Census of Agriculture collects an updated snapshot of Canadian farms and the lives of the people who live and work on them.
Land areaFarms in Canada cover a surprisingly small area. The farmland you see may seem endless, but only 7% of Canada’s land mass is used for farming. That’s about 68 million hectares. To give you an idea of the size of a hectare, keep in mind that 1 ha is 10,000 square metres, which is more than one-and-one-half times the size of a Canadian football field.
Fewer, larger, more technologically advanced farmsFarming in Canada has come a long way from the small, subsistence activity it once was. Improvements in equipment, management practices, feed, fertilizer, and plant and animal breeding have made production soar. Compared with 65 years ago, today’s farms are larger, but there are fewer of them. The 2006 census counted 229,373 farms, down 7.1% or 17,550 from 2001.
As farm numbers drop, the average size of a Canadian farm has increased from 247 hectares in 2001 to 295 hectares in 2006. Although the national agricultural land area remained stable, the provincial numbers varied, with extremes in the eastern and western corners of Canada. Farm area dropped 10.8% in Newfoundland and Labrador and increased 9.6% in British Columbia.
Types of farmingA wide variety of farming takes place in Canada. Livestock products include hogs, poultry, dairy cattle and beef cattle. Although wheat is still popular, more and more Canadian farmers are growing a variety of other crops. These include oats, dry field peas, mustard seed, canary seed and dry coloured beans. Farmers are also growing other grain and oilseed products such as canola, barley, rye, corn, soybeans, and flax. Other crops include vegetables, fruits, root crops, tobacco, and forest products.
Specific types of farming are associated with certain provinces — potatoes in Prince Edward Island, corn in Ontario, wheat in Saskatchewan, beef in Alberta — but such generalizations create inaccurate pictures of farming in Canada. Table 1: Agricultural profile of Canada, gives a clearer picture of agricultural practices in each province. In fact, diversification, or production of a variety of products, is common within each provinceProduction and consumption trends
The types and quantity of farm goods operators produce depend very much on consumer demand, both at home and abroad. Grains and oilseeds continue to be key products, particularly for the export market.
2011 Census Activity 5
Handout 2: Agriculture today: the changing face of Canadian agriculture
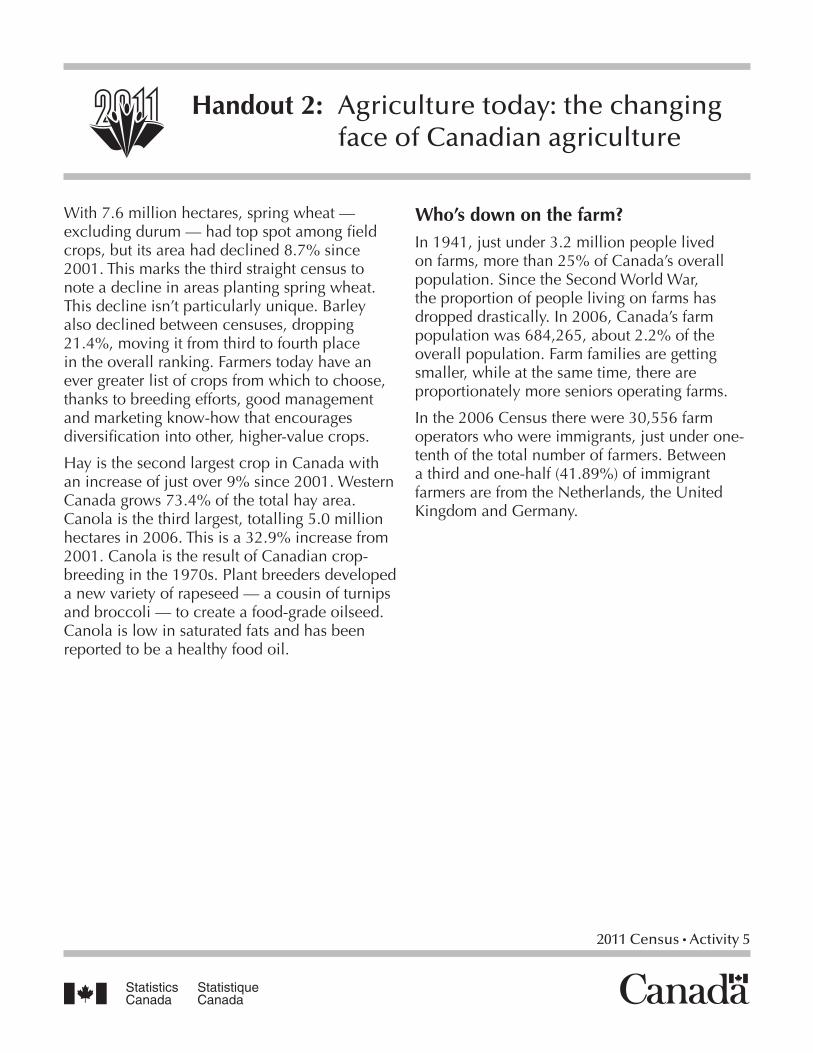
With 7.6 million hectares, spring wheat — excluding durum — had top spot among field crops, but its area had declined 8.7% since 2001. This marks the third straight census to note a decline in areas planting spring wheat. This decline isn’t particularly unique. Barley also declined between censuses, dropping 21.4%, moving it from third to fourth place in the overall ranking. Farmers today have an ever greater list of crops from which to choose, thanks to breeding efforts, good management and marketing know-how that encourages diversification into other, higher-value crops.
Hay is the second largest crop in Canada with an increase of just over 9% since 2001. Western Canada grows 73.4% of the total hay area. Canola is the third largest, totalling 5.0 million hectares in 2006. This is a 32.9% increase from 2001. Canola is the result of Canadian crop-breeding in the 1970s. Plant breeders developed a new variety of rapeseed — a cousin of turnips and broccoli — to create a food-grade oilseed. Canola is low in saturated fats and has been reported to be a healthy food oil.
Who’s down on the farm?In 1941, just under 3.2 million people lived on farms, more than 25% of Canada’s overall population. Since the Second World War, the proportion of people living on farms has dropped drastically. In 2006, Canada’s farm population was 684,265, about 2.2% of the overall population. Farm families are getting smaller, while at the same time, there are proportionately more seniors operating farms.
In the 2006 Census there were 30,556 farm operators who were immigrants, just under one-tenth of the total number of farmers. Between a third and one-half (41.89%) of immigrant farmers are from the Netherlands, the United Kingdom and Germany.
2011 Census Activity 5
Handout 2: Agriculture today: the changing face of Canadian agriculture
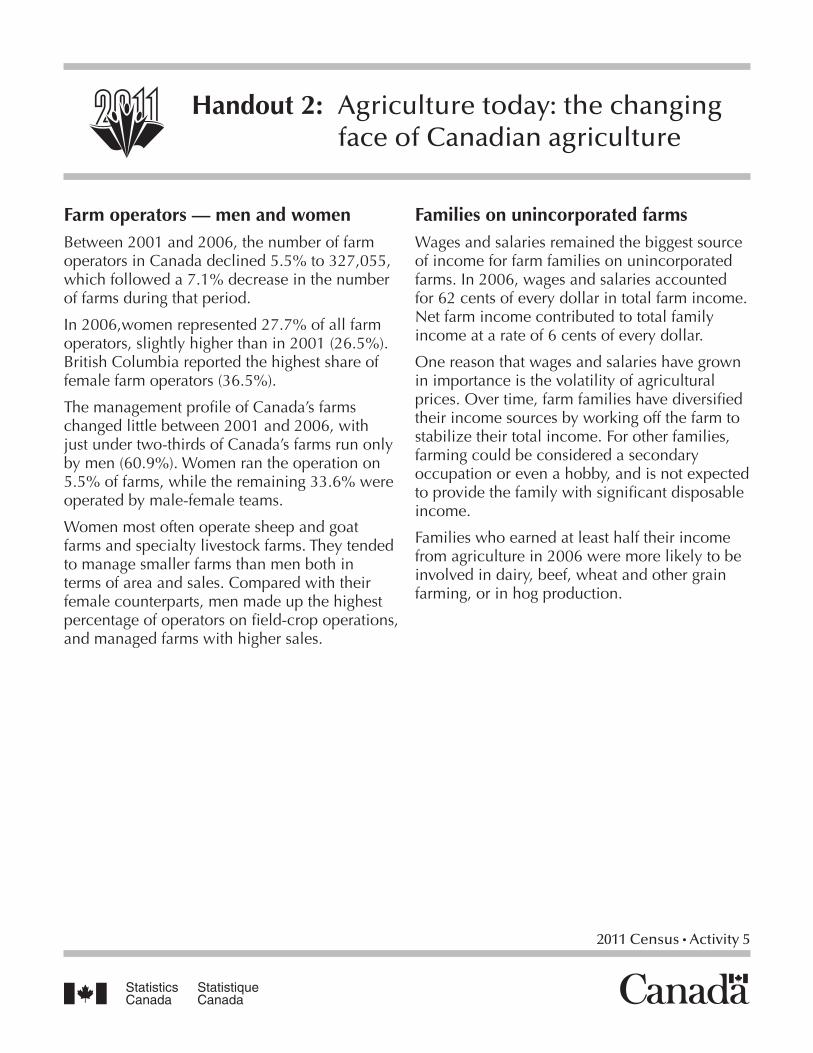
Farm operators — men and womenBetween 2001 and 2006, the number of farm operators in Canada declined 5.5% to 327,055, which followed a 7.1% decrease in the number of farms during that period.
In 2006,women represented 27.7% of all farm operators, slightly higher than in 2001 (26.5%). British Columbia reported the highest share of female farm operators (36.5%).
The management profile of Canada’s farms changed little between 2001 and 2006, with just under two-thirds of Canada’s farms run only by men (60.9%). Women ran the operation on 5.5% of farms, while the remaining 33.6% were operated by male-female teams.
Women most often operate sheep and goat farms and specialty livestock farms. They tended to manage smaller farms than men both in terms of area and sales. Compared with their female counterparts, men made up the highest percentage of operators on field-crop operations, and managed farms with higher sales.
Families on unincorporated farmsWages and salaries remained the biggest source of income for farm families on unincorporated farms. In 2006, wages and salaries accounted for 62 cents of every dollar in total farm income. Net farm income contributed to total family income at a rate of 6 cents of every dollar.
One reason that wages and salaries have grown in importance is the volatility of agricultural prices. Over time, farm families have diversified their income sources by working off the farm to stabilize their total income. For other families, farming could be considered a secondary occupation or even a hobby, and is not expected to provide the family with significant disposable income.
Families who earned at least half their income from agriculture in 2006 were more likely to be involved in dairy, beef, wheat and other grain farming, or in hog production.
2011 Census Activity 5
Table 1 – Agricultural profile of Canada
Number of farms reporting, classified by farm type, by province, 2006Total number of farms reporting
Dairy cattle and milk production
Beef cattle ranching and farming, including feedlots
Hog and pig farming
Poultry and egg production
Sheep and goat farming
Other animal production
Wheat Oilseed and grain farming (except wheat)
Vegetable and melon farming
Fruit and tree-nut farming
Greenhouse, nursery and floriculture production
Other crop farming
farms reportingCanada 229,373 14,651 60,947 6,040 4,578 3,815 26,779 12,137 49,530 5,239 8,329 8,754 28,574
N.L. 558 38 54 9 25 29 53 0 2 94 36 111 107
P.E.I. 1,700 221 381 71 29 17 171 10 65 384 153 34 164
N.S. 3,795 297 716 51 133 76 479 3 21 142 907 543 427
N.B. 2,776 270 548 50 45 33 309 6 35 307 372 267 534
Que. 30,675 6,945 4,683 1,932 710 780 1,895 79 3,353 1,131 1,273 1,478 6,416
Ont. 57,211 4,937 11,052 2,222 1,700 1,365 7,573 953 12,103 1,769 1,892 2,822 8,823
Man. 19,054 453 6,593 768 270 201 1,663 1,290 5,483 250 124 294 1,665
Sask. 44,329 220 12,249 211 139 225 2,722 6,938 18,484 134 149 268 2,590
Alta. 49,431 605 20,494 598 416 558 7,414 2,809 9,753 286 227 910 5,361
B.C. 19,844 665 4,177 128 1,111 531 4,500 49 231 742 3,196 2,027 2,487
Highlight the highest figure in each column. Circle the lowest figure in each column.
2011 Census Activity 5
Name: Date:
Handout 3: A farming tradition
InstructionsDevelop a short play, about five minutes long. The family members are having a discussion around the kitchen table after dinner about the future of their farm. Each group member should assume the role of one of the four characters: Jack, Joan, Michael or Laura.
ScenarioJack and Joan Green are third-generation farmers in this province. Farming has provided a reasonable standard of living for the family for over 100 years. They have always assumed that their eldest son, Michael, would want to continue the family tradition and that their daughter Laura would settle close to home. However, circumstances change and the time has come to make some decisions.
• Laura has returned from agricultural college and is marrying a local farmer, John. They want to merge their farm with the Green’s farm.
• Michael and Laura announce that neither of them is interested in taking over the family farm.
• Jack and Joan decide to retire and announce they will be selling the farm. Michael and/or Laura had been planning to take over the farm.
• Three years of poor harvests and an increasing debt load has forced the family to consider:
giving up the farm
diversifying into other farm products, or
getting non-farm jobs to supplement their income.
• The farm, at its current size, cannot provide the same standard of living as in the past. To keep the farm viable it will be necessary to expand considerably.
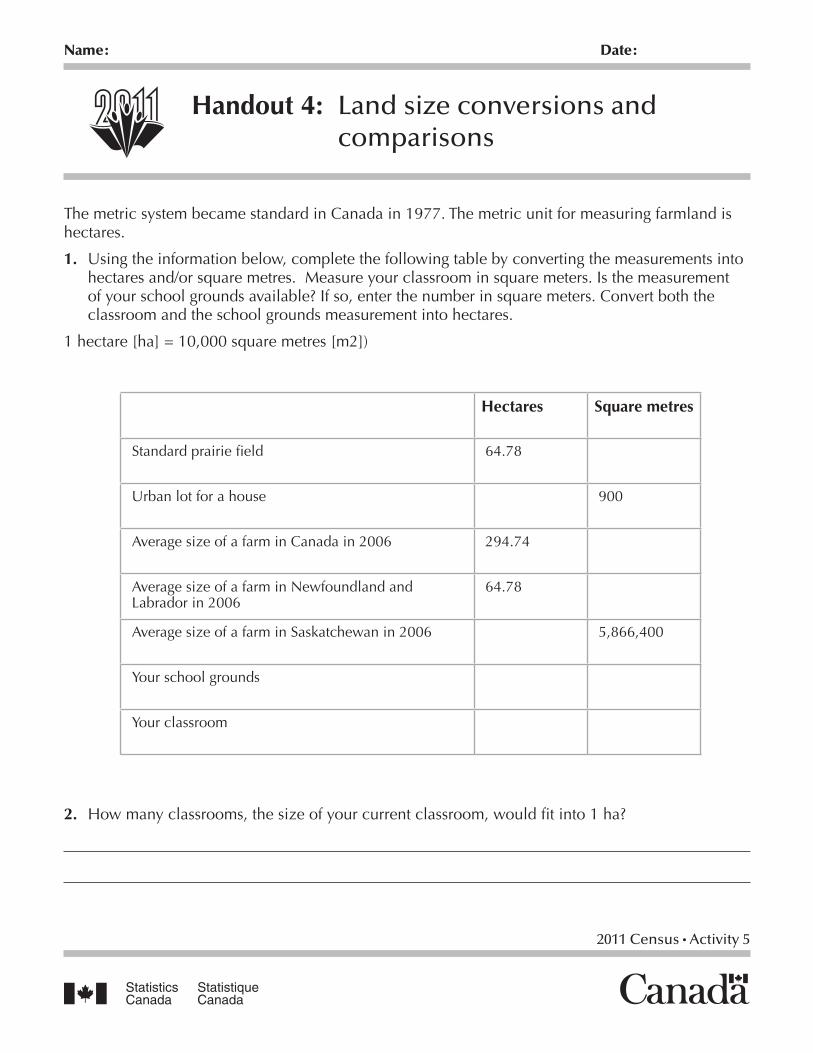
2011 Census Activity 5
Name: Date:
Handout 4: Land size conversions and comparisons
The metric system became standard in Canada in 1977. The metric unit for measuring farmland is hectares.
1. Using the information below, complete the following table by converting the measurements into hectares and/or square metres. Measure your classroom in square meters. Is the measurement of your school grounds available? If so, enter the number in square meters. Convert both the classroom and the school grounds measurement into hectares.
1 hectare [ha] = 10,000 square metres [m2])
Hectares Square metres
Standard prairie field 64.78
Urban lot for a house 900
Average size of a farm in Canada in 2006 294.74
Average size of a farm in Newfoundland and Labrador in 2006
64.78
Average size of a farm in Saskatchewan in 2006 5,866,400
Your school grounds
Your classroom
2. How many classrooms, the size of your current classroom, would fit into 1 ha?
OverviewStudents will colour a pie chart which indicates the place of birth of Canada’s immigrant population. Students will also colour a corresponding map of immigration source areas. Next, students will create a paper chain based on the pie chart and map. This would be an excellent visual display for a bulletin board.
Duration: 1-2 class periods.
Note: See the Teacher’s Guide for general background to the census and census vocabulary.
Learning objectives• Develop an awareness of the places of birth
of people who immigrate to Canada.
• Develop an awareness of Canadian immigration patterns.
Vocabularycensus, immigrant, immigration source areas, place of birth, period of immigration
Materials• Teacher’s Guide
• Handout 1: Immigration source areas
• Handout 2: Place of birth of the immigrant population of Canada
• Handout 3: Immigrant population of Canada, paper chain
Getting started1. Using the background information provided
in the Teacher’s Guide, tell students about the census and explain that the next one takes place in May 2011. Make sure students understand that in a census all the people in the country are counted, not just Canadian citizens. Discuss the importance of immigration information gathered in previous censuses. The data are used to provide services to immigrants. Immigrants are an important part of the population.
2. Do a mini-survey of the classroom asking the country of birth of each student. Make an overhead of Handout 1 and place dots on the immigration source areas which include these countries. One dot for each student’s place of birth. Which immigration source area (North America, Central America etc) contains the most dots?
Suggested level: elementary, intermediateSubjects: mathematics, geography, social studies, language arts
Activity 6: Immigration and citizenship
2 2011 Census Activity 6
Census activityScissors, glue and coloured markers, coloured pencils or crayons are required for this activity.
1. Distribute Handout 1. Discuss the map and the division lines. This map groups immigration source areas into broad categories indicated at the bottom of the handout. Corresponding numbers appear on the map itself. Students will begin by colouring in the map according to the colour key.
2. Distribute Handout 2 and discuss the pie chart presented. This pie chart is a graphic representation of the places of birth of the immigrant population in Canada from 2001–2006. Next, students will colour in the pie chart according to the colour key at the bottom of Handout 1.
Activity 6: Immigration and citizenship
3. Have the students make a three dimensional representation (a paper chain) of the immigrant population’s places of birth using the percentages presented in the pie chart. The paper chain activity may be done as a class, in smaller groups or individually. Copy and distribute Handout 3 accordingly.
Students will colour the links according to the colour key on the bottom of Handout 1 and then cut them apart so that they have individual links. Students will then glue together the links to represent the places of birth of the immigrant population from 2001–2006.
(Hint: 1% = 1 link. Therefore if the student is representing the Canadian immigrant place of birth as Africa, they should have 11 links, which is 11% as per the pie chart in Handout 2.)
3 2011 Census Activity 6
Activity 6: Enrichment
Invite a person, who immigrated to Canada, to visit your class. Have them bring personal photos of their place of birth and speak to the class about immigrating to Canada.
Students may choose one of the following writing activities:
a. write a short account of the guest speaker. In this account the student will highlight what they found to be the most interesting part of what your guest speaker has shared with them.
b. write a newspaper article reporting on the guest speaker’s journey to Canada and starting a life here.
c. write a diary entry about the day the guest speaker arrived in Canada. Write from the guest speaker’s perspective.
Note: For more detailed information on immigration, visit our website at www.statcan.gc.ca
• Click on the Census image on the right side of the page.
• Select Release topics under 2006 Census, on the left side of the page.
• Select Immigration and citizenship.
• Select Topic based tabulations.
• Select Period of immigration.
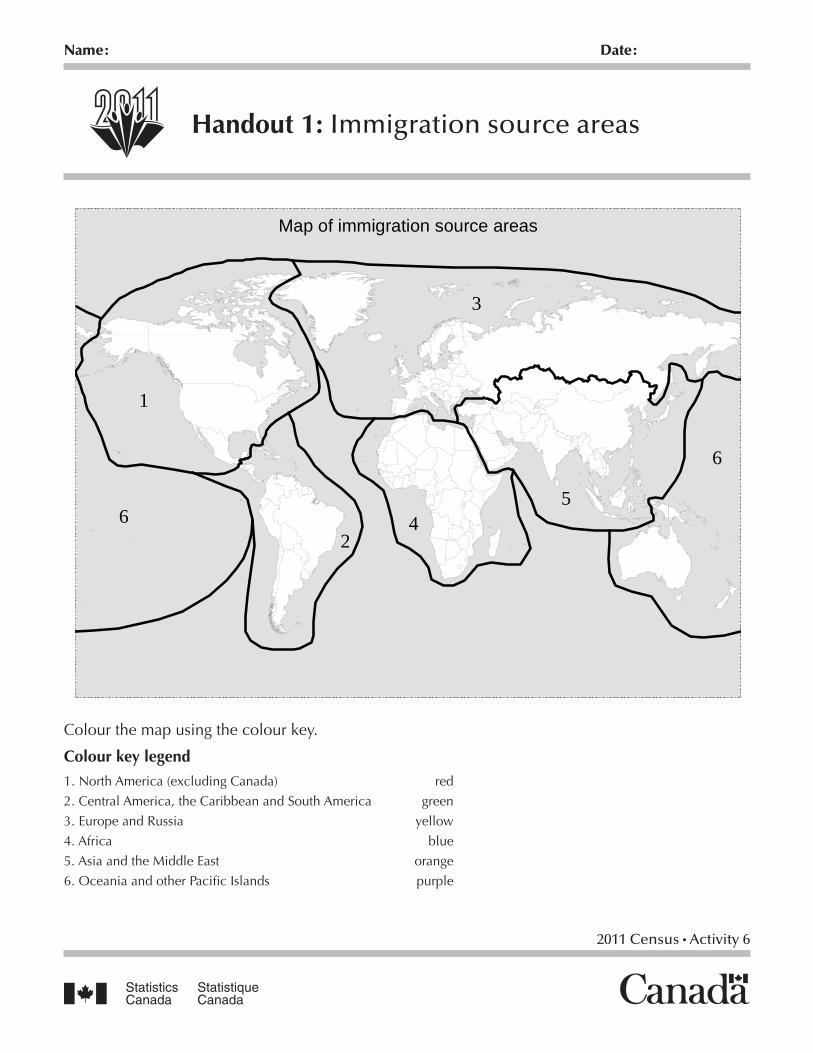
2011 Census Activity 6
Name: Date:
Handout 1: Immigration source areas
Map of immigration source areas
42
6
3
1
65
Colour key1. North America (excluding Canada). . . . . . . . . . . . . . . . . . . red2. Central America, the Caribbean and South America. . . .green3. Europe and Russia. . . . . .. . . . . . . . . . . . . . . . . . . . . . .yellow
1. Africa. . . . . . . . . . . . . . . . . . . . . . . . . blue2. Asia excluding Russia. . . . . . . . . . . . orange3. Oceania and other Pacific Islands. . . purple
Colour the map using the colour key.
Colour key legend
1. North America (excluding Canada) red
2. Central America, the Caribbean and South America green
3. Europe and Russia yellow
4. Africa blue
5. Asia and the Middle East orange
6. Oceania and other Pacific Islands purple
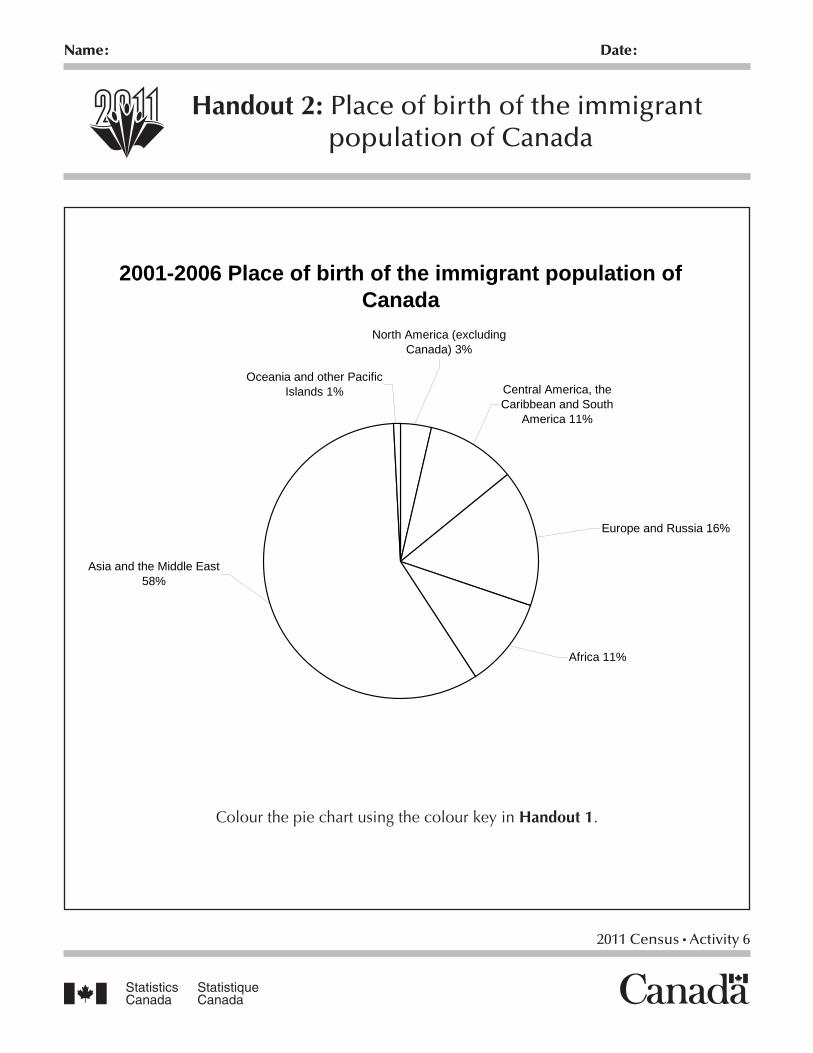
2011 Census Activity 6
Name: Date:
Handout 2: Place of birth of the immigrant population of Canada
Colour the pie chart using the colour key in Handout 1.
2001-2006 Place of birth of the immigrant population of Canada
Africa 11%
Asia and the Middle East 58%
Europe and Russia 16%
Central America, the Caribbean and South
America 11%
Oceania and other Pacific Islands 1%
North America (excluding Canada) 3%
Handout 3: Immigrant population of Canada, paper chain
North America (excluding Canada)
North America (excluding Canada)
North America (excluding Canada)
Central America, the Caribbean and South America
Central America, the Caribbean and South America
Central America, the Caribbean and South America
Central America, the Caribbean and South America
Central America, the Caribbean and South America
Central America, the Caribbean and South America
Central America, the Caribbean and South America
Central America, the Caribbean and South America
Central America, the Caribbean and South America
Central America, the Caribbean and South America
Central America, the Caribbean and South America
Europe and Russia
Europe and Russia
Europe and Russia
Europe and Russia
Europe and Russia
Europe and Russia
Europe and Russia
Europe and Russia
Europe and Russia
Europe and Russia
Europe and Russia
Europe and Russia
Europe and Russia
Europe and Russia
Europe and Russia
Europe and Russia
Africa
Africa
Africa
Africa
Africa
Africa
Africa
Africa
Africa
Africa
Africa
Oceania and other Pacific islands
Asia and the Middle East
Asia and the Middle East
Asia and the Middle East
Asia and the Middle East
Asia and the Middle East
Asia and the Middle East
Asia and the Middle East
Asia and the Middle East
Asia and the Middle East
Asia and the Middle East
Asia and the Middle East
Asia and the Middle East
Asia and the Middle East
Asia and the Middle East
Asia and the Middle East
Overview
This activity uses hands-on experience to demonstrate many aspects of planning, conducting and reporting the results of a survey.
Students will learn what goes into the production of statistical information, how individual responses on a questionnaire are merged to create summary data, and how the summarized information is used.
This activity could take the form of a full count of the student body. If this is too ambitious, a small survey or an opinion poll of a sample of the student population or specific class may be more appropriate. Use topics of interest to students and teachers.
Since the census takes place in May 2011, schedule the completion of this activity or parts of it (data collection) in May. If you intend to have the students conduct a survey or census, remember to allow yourself enough lead time.
DurationTwo or three class periods if students use the prepared questionnaire in Handout 2.
or
Four or five class periods if students create their own survey using the information provided in Handout 1. This would include:
• two class periods before conducting the survey;
•one period collecting the data; and
•one or two periods after collecting the data.
(Times will vary with the complexity of the questionnaire and the size of the group surveyed.)
Note: See the Teacher’s Guide for general background on the census and census vocabulary.
Learning objectives
•Understand the stages of designing, conducting and processing a survey.
•Learn how to design, conduct, process and report on a survey.
•Learn how to write a report analysing the results of a survey.
•Learn how to work as a team to reach mutually agreed decisions and to resolve issues.
Vocabulary
census, complete count, confidentiality, data, enumeration, questionnaire, sample, survey, undercount
Suggested level: seniorSubjects: mathematics, social studies, data management
Activity 7: That’s easy for you to say! — survey project
2 2011 Census Activity 7
Materials•Teacher’s Guide
•Handout 1: That’s easy for you to say!
•Handout 2: Student survey on future plans
Getting started
1. Ask your students to write down what they think the population of Canada was in 2006. Give them a moment to do so and then write the figure on the chalkboard. (Answer: In 2006, the population of Canada was 31,612,897.)
2. Ask several of the students to comment on how their estimates compared to the actual figure.
3. Ask students how they think the 2006 population figure for Canada was determined. (Answer: Every five years Statistics Canada conducts a census — a complete count of the country’s population.)
4. Ask the class to concentrate again on the 2006 population figure. Ask them to estimate the time it took to produce this figure. Now distribute Handout 1 for all to read.
Note: The 2006 Census took place in May 2006. The population counts were available in March 2007.
Census activity1. Discuss the stages of the survey process
listed on Handout 1. You may wish to show a flow chart such as the one below, listing the questions from the handout underneath each stage.
Define Design Collect Process Report
2. This is the point at which the class should decide whether they want to plan and conduct their own survey or use the questionnaire in Handout 2. If the class decides to use the prepared questionnaire in Handout 2, continue with the rest of item 2 and end the lesson. If the class decides to create their own survey, skip to item 3.
(a) Distribute Handout 2: Student survey on future plans.
(b) Before students answer the prepared questionnaire, have them discuss how they will tabulate their results and what they will want to report. Ask them to consider what summary information they would like to analyse and what their tables (columns, rows, etc.) will look like.
Ask students to identify interesting questions that summary data could answer. For example: “Do male and female students in the class have the same career goals?” To answer this question they must be able to cross-tabulate question 2 with question 7. This can be a long job if the tabulating is done by hand. Manual tallying may limit them to looking at the simple frequencies for single questions, such as “How many
Activity 7: That’s easy for you to say! — survey project
3 2011 Census Activity 7
hours did you spend last week working for pay.” Access to a computer will provide greater flexibility.
(c) Have the students answer the prepared questionnaire. Ask the class to follow through on their processing and reporting strategies for Handout 2.
(d) The class may wish to conduct the same survey with a larger group to learn how the data compare with the whole grade or the whole school. How students process the data, what they report, and how much time they have will dictate the response here.
3. (a) If the class is conducting their own survey, have them re-examine the full range of questions in Handout 1. Some key questions to consider are:
•How big will the project be?
•Who will be surveyed?
•What will they be surveyed about?
•How much time will the class invest in conducting, processing and analysing the survey?
•Will the results be shared?
•How will you protect confidentiality?
(b) Distribute Handout 2: Student survey on future plans. This prepared questionnaire may be used as a model for the survey form that the class will design.
Activity 7: That’s easy for you to say! — survey project
(c) Ask students to consider the merits of the prepared questionnaire by taking note of its concise questions, its multiple-choice format, and the low number of open-ended questions.
Teacher hints
If the students design their own survey, limit the number of questions to about 10.
Avoid fill-in-the-blank (open-ended) type questions in favour of questions where answers may be checked or circled.
Include several “demographic background” items so that students can correlate data and make statements such as “Female students are most likely to say...”
Try to focus the survey on student and school concerns.
Take time to test the questionnaire through role-playing or a small sample test to ensure that the questions make sense and provide useful answers.
Try to make the survey part of some larger event such as a display, special assembly or open house so students can see that other people are interested in the survey results.
Note: Be sure that the survey has beenapproved / registered in advance by your school’s administration.
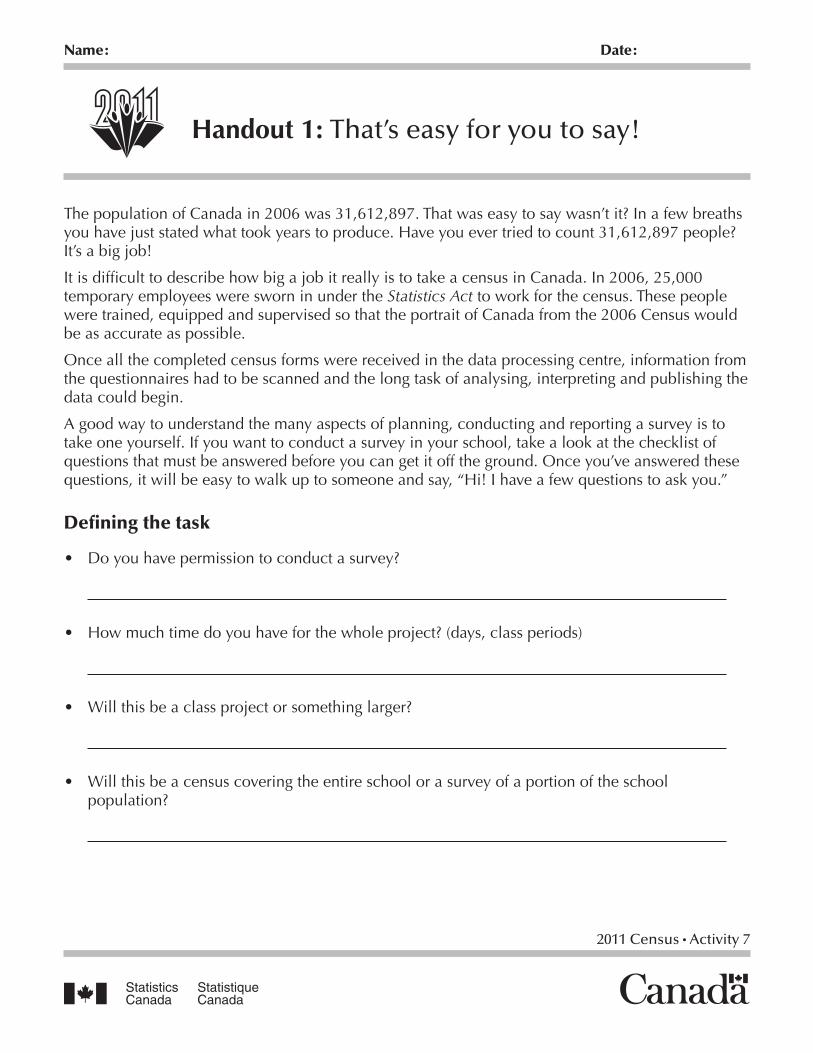
2011 Census Activity 7
Name: Date:
Handout 1: That’s easy for you to say!
The population of Canada in 2006 was 31,612,897. That was easy to say wasn’t it? In a few breaths you have just stated what took years to produce. Have you ever tried to count 31,612,897 people? It’s a big job!
It is difficult to describe how big a job it really is to take a census in Canada. In 2006, 25,000 temporary employees were sworn in under the Statistics Act to work for the census. These people were trained, equipped and supervised so that the portrait of Canada from the 2006 Census would be as accurate as possible.
Once all the completed census forms were received in the data processing centre, information from the questionnaires had to be scanned and the long task of analysing, interpreting and publishing the data could begin.
A good way to understand the many aspects of planning, conducting and reporting a survey is to take one yourself. If you want to conduct a survey in your school, take a look at the checklist of questions that must be answered before you can get it off the ground. Once you’ve answered these questions, it will be easy to walk up to someone and say, “Hi! I have a few questions to ask you.”
Defining the task
• Do you have permission to conduct a survey?
• How much time do you have for the whole project? (days, class periods)
• Will this be a class project or something larger?
• Will this be a census covering the entire school or a survey of a portion of the school population?
2011 Census Activity 7
Handout 1: That’s easy for you to say!
• Will you collect facts or is this an opinion poll?
• When and how will you collect the information?
• What are the major topics you will research and why? (for example, youth issues, school issues)
Designing the questionnaire
• What type of questions will you use? (for example, multiple choice, fill-in-the-blank)
• How many topics do you want to include?
• How many questions will you ask? (If two topics, how many questions per topic?)
• How many possible answers will there be for each question?
• Are the questions concise and easy to understand?
2011 Census Activity 7
Handout 1: That’s easy for you to say!
• Do you want to include background questions like name, age, sex, grade, or where the person lives?
• Will your questions provide the data you are seeking?
• How are the questions arranged on your form?
• How will your forms be printed? (Could the school newspaper / office print them?)
Collecting the data
• Who will answer the questions?
• Is this a personal interview or is it a self-completed survey?
• How will you deal with the privacy of the respondent’s information if you ask for their names?
• How will you get everyone to respond?
• Do you need publicity?
2011 Census Activity 7
Handout 1: That’s easy for you to say!
• What will you do if someone is away or does not answer?
• How will you make sure that everyone is counted only once?
• How will you know that all the forms were returned?
Processing the data
• How will you check the returned questionnaires for completeness?
• How will you summarize the data? (For example, will you use tables, graphs, or charts?)
• Is the questionnaire designed to make this easy?
• Will you be using a computer or tallying by hand?
• How does the use of one or the other affect the amount of time you need or how much you can ask?
2011 Census Activity 7
Handout 1: That’s easy for you to say!
• How will you check to make sure there are no errors in the processing?
• If processing is done on a computer, how will you construct the database?
• If it is done by hand, how will you record the data (on a form, on the chalkboard, something else)?
Reporting the data
• How will you report the data?
• What tables do you want to make?
• Do you want to include graphics, like a bar or pie chart?
• Would percentages help you communicate the data better?
• Do you want to write a report about the findings?
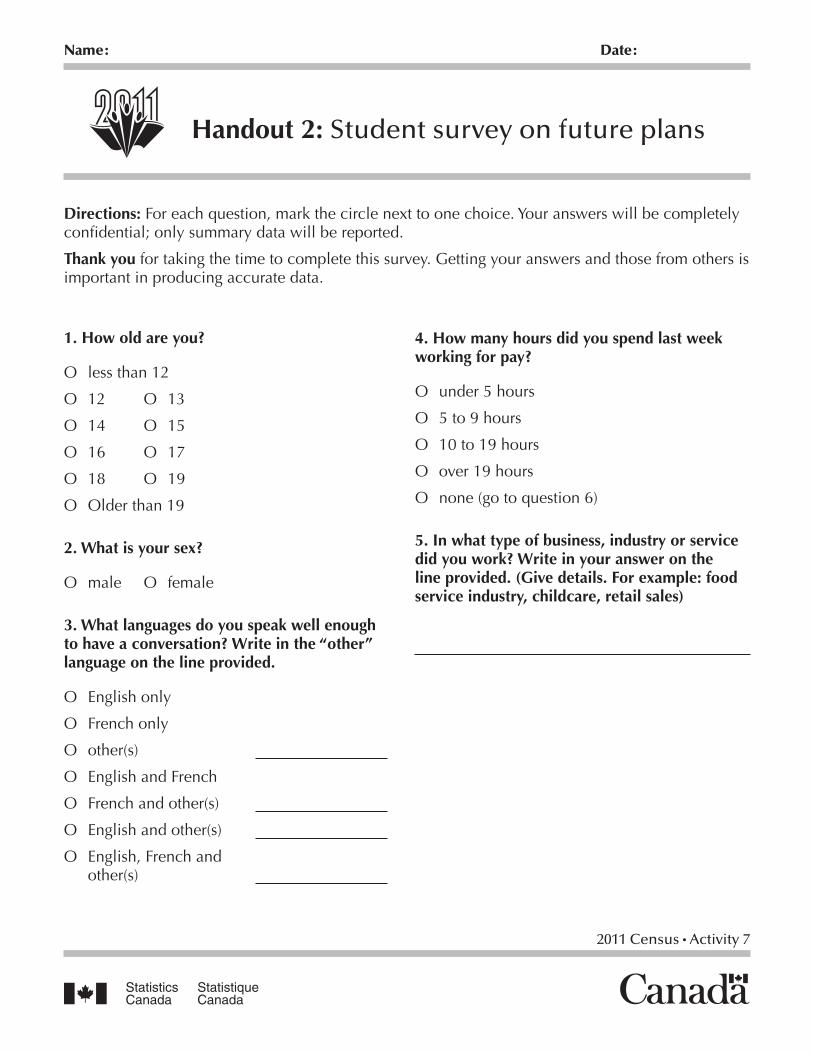
2011 Census Activity 7
Name: Date:
Handout 2: Student survey on future plans
1. How old are you?
O less than 12
O 12 O 13
O 14 O 15
O 16 O 17
O 18 O 19
O Older than 19
2. What is your sex?
O male O female
3. What languages do you speak well enough to have a conversation? Write in the “other” language on the line provided.
O English only
O French only
O other(s)
O English and French
O French and other(s)
O English and other(s)
O English, French and other(s)
Directions: For each question, mark the circle next to one choice. Your answers will be completely confidential; only summary data will be reported.
Thank you for taking the time to complete this survey. Getting your answers and those from others is important in producing accurate data.
4. How many hours did you spend last week working for pay?
O under 5 hours
O 5 to 9 hours
O 10 to 19 hours
O over 19 hours
O none (go to question 6)
5. In what type of business, industry or service did you work? Write in your answer on the line provided. (Give details. For example: food service industry, childcare, retail sales)
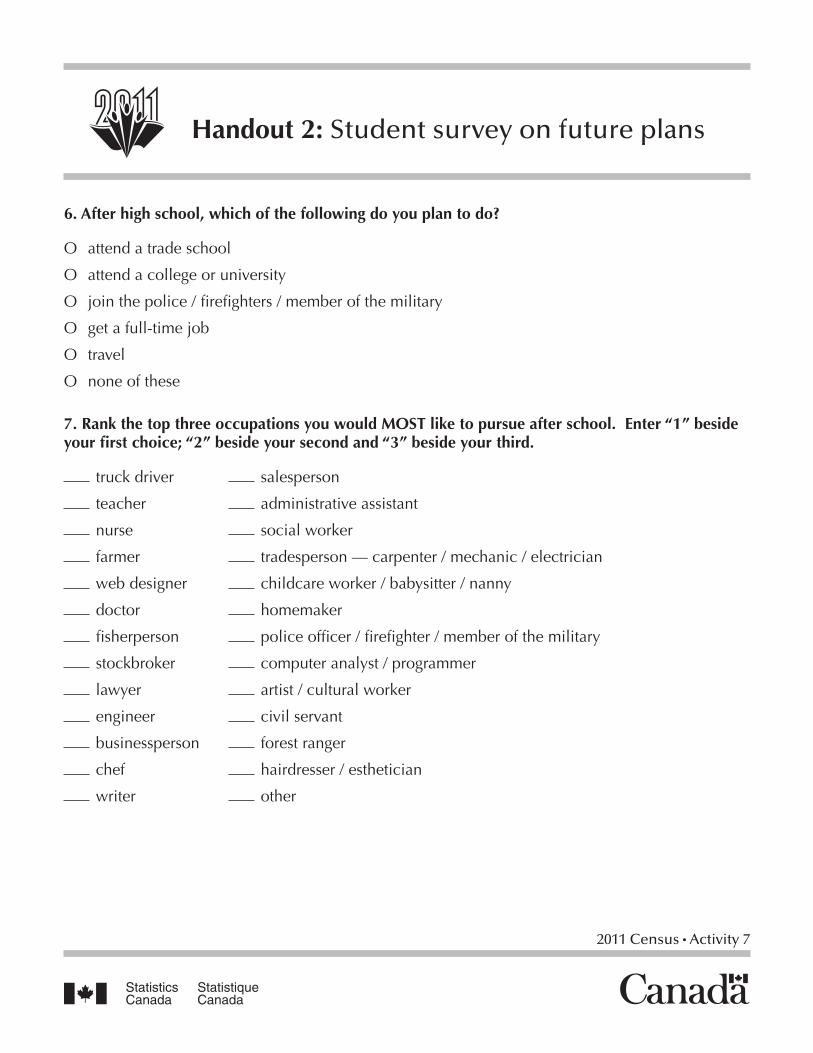
2011 Census Activity 7
6. After high school, which of the following do you plan to do?
O attend a trade school
O attend a college or university
O join the police / firefighters / member of the military
O get a full-time job
O travel
O none of these
7. Rank the top three occupations you would MOST like to pursue after school. Enter “1” beside your first choice; “2” beside your second and “3” beside your third.
truck driver salesperson
teacher administrative assistant
nurse social worker
farmer tradesperson — carpenter / mechanic / electrician
web designer childcare worker / babysitter / nanny
doctor homemaker
fisherperson police officer / firefighter / member of the military
stockbroker computer analyst / programmer
lawyer artist / cultural worker
engineer civil servant
businessperson forest ranger
chef hairdresser / esthetician
writer other
Handout 2: Student survey on future plans
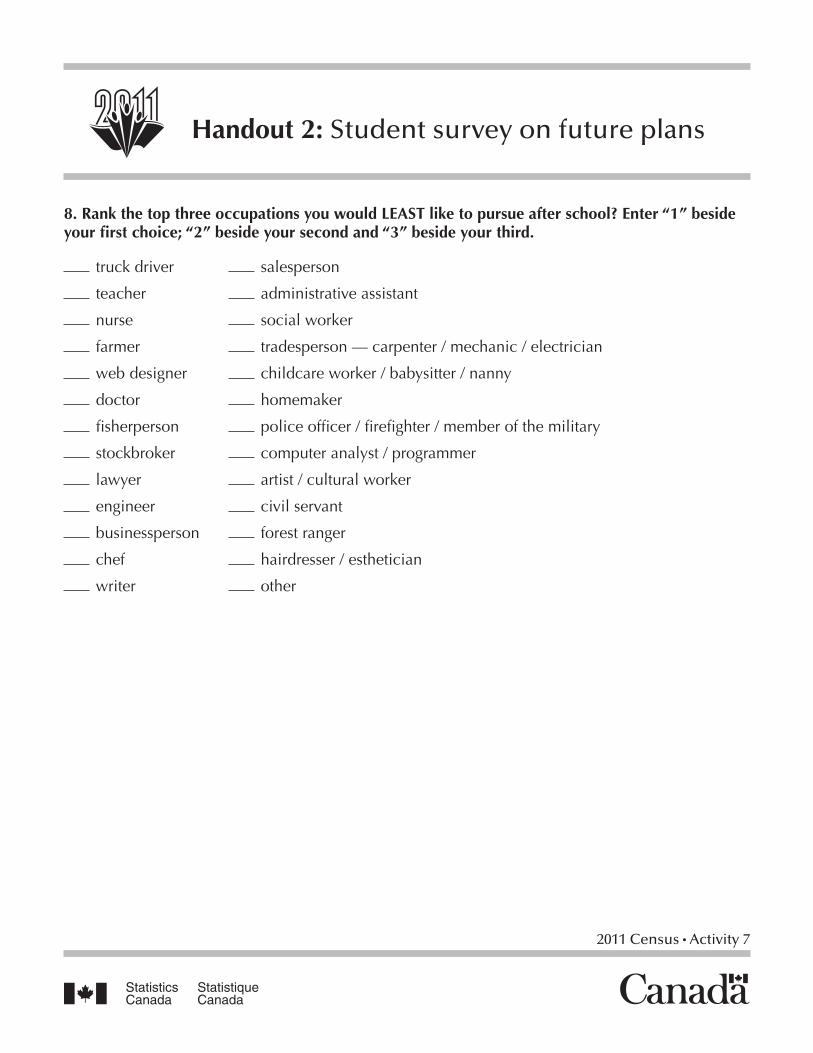
2011 Census Activity 7
8. Rank the top three occupations you would LEAST like to pursue after school? Enter “1” beside your first choice; “2” beside your second and “3” beside your third.
truck driver salesperson
teacher administrative assistant
nurse social worker
farmer tradesperson — carpenter / mechanic / electrician
web designer childcare worker / babysitter / nanny
doctor homemaker
fisherperson police officer / firefighter / member of the military
stockbroker computer analyst / programmer
lawyer artist / cultural worker
engineer civil servant
businessperson forest ranger
chef hairdresser / esthetician
writer other
Handout 2: Student survey on future plans
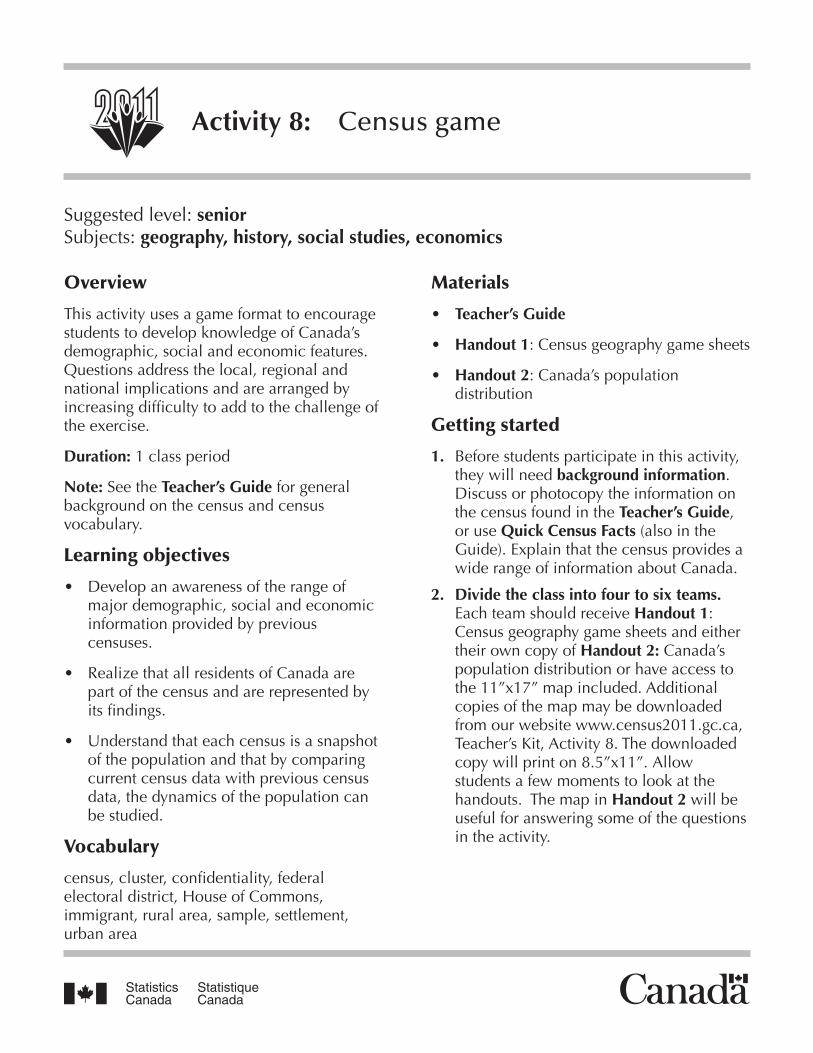
Overview
This activity uses a game format to encourage students to develop knowledge of Canada’s demographic, social and economic features. Questions address the local, regional and national implications and are arranged by increasing difficulty to add to the challenge of the exercise.
Duration: 1 class period
Note: See the Teacher’s Guide for general background on the census and census vocabulary.
Learning objectives
• Develop an awareness of the range of major demographic, social and economic information provided by previous censuses.
• Realize that all residents of Canada are part of the census and are represented by its findings.
• Understand that each census is a snapshot of the population and that by comparing current census data with previous census data, the dynamics of the population can be studied.
Vocabulary
census, cluster, confidentiality, federal electoral district, House of Commons, immigrant, rural area, sample, settlement, urban area
Materials
• Teacher’s Guide
• Handout 1: Census geography game sheets
• Handout 2: Canada’s population distribution
Getting started
1. Before students participate in this activity, they will need background information. Discuss or photocopy the information on the census found in the Teacher’s Guide, or use Quick Census Facts (also in the Guide). Explain that the census provides a wide range of information about Canada.
2. Divide the class into four to six teams. Each team should receive Handout 1: Census geography game sheets and either their own copy of Handout 2: Canada’s population distribution or have access to the 11”x17” map included. Additional copies of the map may be downloaded from our website www.census2011.gc.ca, Teacher’s Kit, Activity 8. The downloaded copy will print on 8.5”x11”. Allow students a few moments to look at the handouts. The map in Handout 2 will be useful for answering some of the questions in the activity.
Suggested level: seniorSubjects: geography, history, social studies, economics
Activity 8: Census game
2 2011 Census Activity 8
Census activity
1. Each team in turn has the opportunity to select a topic listed under one of the categories on the game sheet (Handout 1). From the Answers and questions beginning on page 4, the teacher reads the appropriate answer to the team. Time is then allowed for the team to confer, reach a consensus and respond with the question (about one minute).
2. If the question is acceptable to the teacher, the team is awarded the number of points shown for the topic on the game sheet. The team’s score is increased on the blackboard and the topic is eliminated. Incorrect questions reduce the team’s score by the value of the topic and this topic remains in play. Any answer completes a turn and the play moves on to the next team. Eight topics have double points (bonus questions). These can be changed by the teacher.
3. The game is over when all the topics have been used or when time has run out. Leave time to tabulate the final score and announce the winning team.
3. Teams could suggest team names. Since each team begins with a score of zero (0), write one large zero for each team below the team names on the blackboard. Decide the order of play (e.g., alphabetical order of team names). You may want to limit the number of categories in play depending on the time available.
4. Describe how to play the game as detailed in the following “Census activity” section. In brief, a team picks any topic from the six categories on the game sheet, the teacher reads the “answer” and the team provides the “question.”
Points are awarded or removed depending on whether an acceptable response is given. The point values for the topics increase to reflect their difficulty. Do a practice round using the sample in Handout 1.
Activity 8: Census game
3 2011 Census Activity 8
1. Any of the rules can be altered to suit the circumstances. The number of categories and topics in play can be changed as well as the value of the questions.
2. Encourage students to create their own answers and questions.
3. Suggest that students take the materials home and play the game with their families.
4. Consider the possibility of a challenge match between classes using either the topics provided or those created by the students. Perhaps a team of teachers could challenge the students!
Activity 8: Enrichment
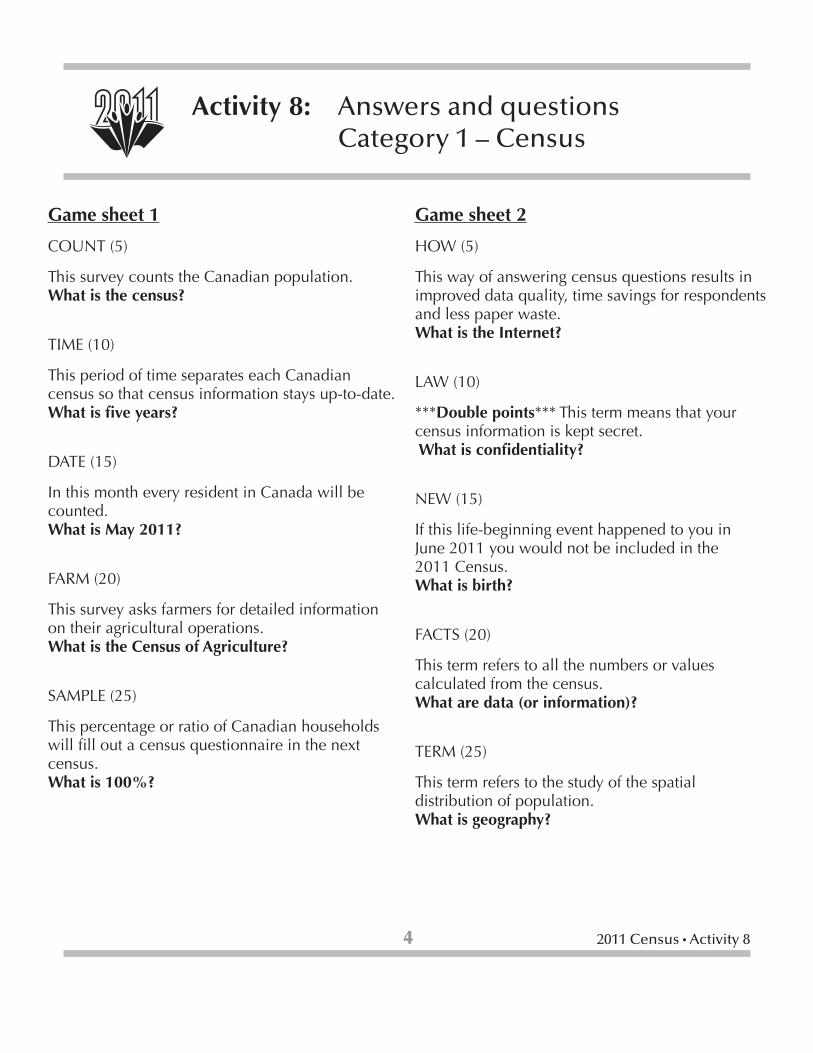
4 2011 Census Activity 8
Activity 8: Answers and questions Category 1 – Census
Game sheet 1
COUNT (5)
This survey counts the Canadian population. What is the census?
TIME (10)
This period of time separates each Canadian census so that census information stays up-to-date. What is five years?
DATE (15)
In this month every resident in Canada will be counted. What is May 2011?
FARM (20)
This survey asks farmers for detailed information on their agricultural operations. What is the Census of Agriculture?
SAMPLE (25)
This percentage or ratio of Canadian households will fill out a census questionnaire in the next census. What is 100%?
Game sheet 2
HOW (5)
This way of answering census questions results in improved data quality, time savings for respondents and less paper waste. What is the Internet?
LAW (10)
***Double points*** This term means that your census information is kept secret. What is confidentiality?
NEW (15)
If this life-beginning event happened to you in June 2011 you would not be included in the 2011 Census. What is birth?
FACTS (20)
This term refers to all the numbers or values calculated from the census. What are data (or information)?
TERM (25)
This term refers to the study of the spatial distribution of population. What is geography?
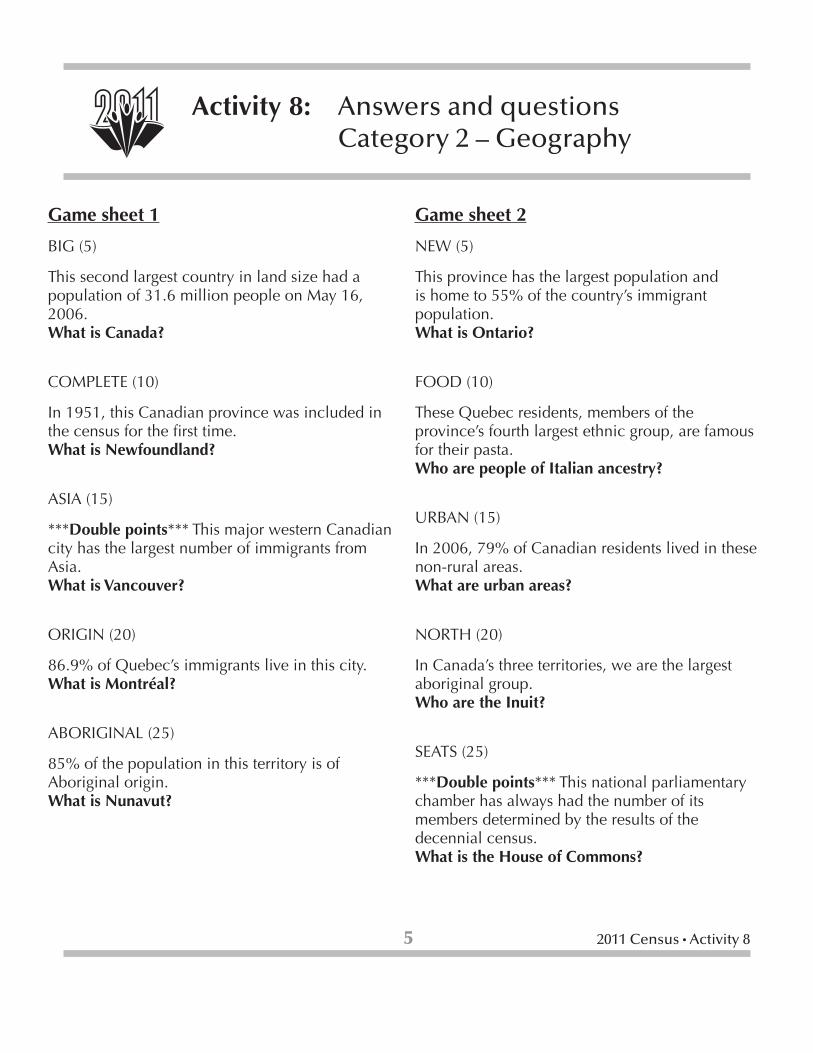
5 2011 Census Activity 8
Game sheet 1
BIG (5)
This second largest country in land size had a population of 31.6 million people on May 16, 2006. What is Canada?
COMPLETE (10)
In 1951, this Canadian province was included in the census for the first time. What is Newfoundland?
ASIA (15)
***Double points*** This major western Canadian city has the largest number of immigrants from Asia. What is Vancouver?
ORIGIN (20)
86.9% of Quebec’s immigrants live in this city.What is Montréal?
ABORIGINAL (25)
85% of the population in this territory is of Aboriginal origin. What is Nunavut?
Game sheet 2
NEW (5)
This province has the largest population and is home to 55% of the country’s immigrant population. What is Ontario?
FOOD (10)
These Quebec residents, members of the province’s fourth largest ethnic group, are famous for their pasta. Who are people of Italian ancestry?
URBAN (15)
In 2006, 79% of Canadian residents lived in these non-rural areas. What are urban areas?
NORTH (20)
In Canada’s three territories, we are the largest aboriginal group. Who are the Inuit?
SEATS (25)
***Double points*** This national parliamentary chamber has always had the number of its members determined by the results of the decennial census. What is the House of Commons?
Activity 8: Answers and questions Category 2 – Geography
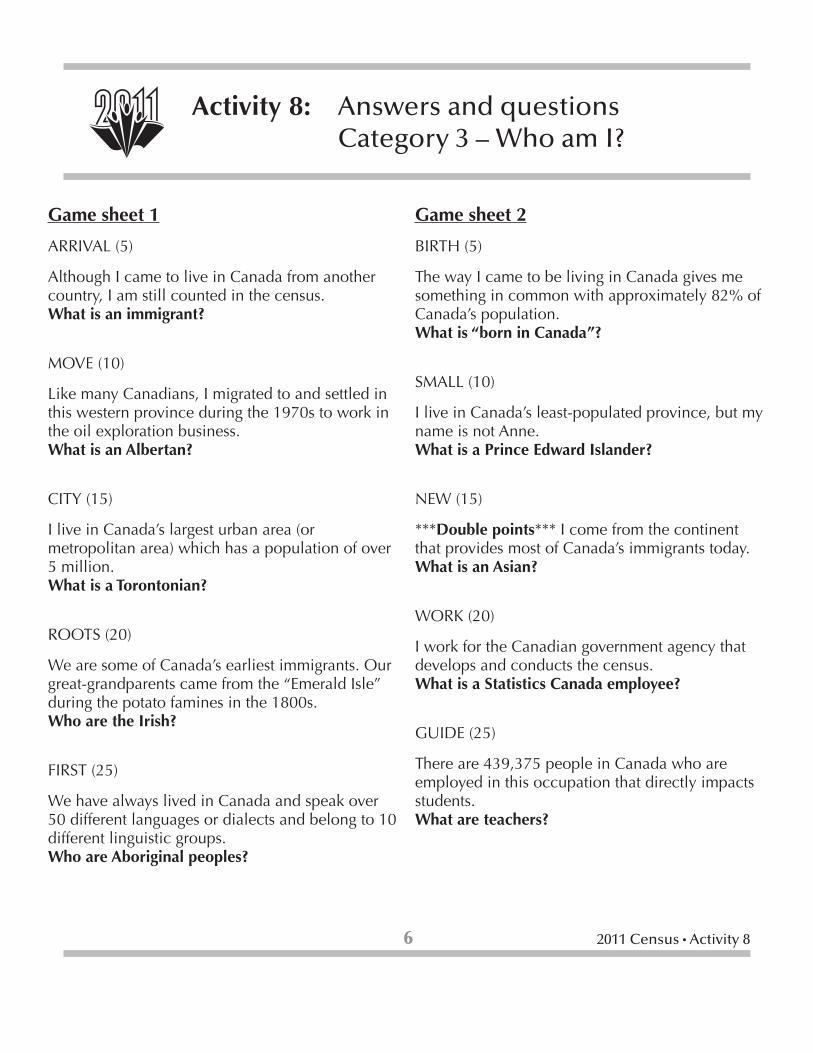
6 2011 Census Activity 8
Game sheet 1
ARRIVAL (5)
Although I came to live in Canada from another country, I am still counted in the census. What is an immigrant?
MOVE (10)
Like many Canadians, I migrated to and settled in this western province during the 1970s to work in the oil exploration business. What is an Albertan?
CITY (15)
I live in Canada’s largest urban area (or metropolitan area) which has a population of over 5 million. What is a Torontonian?
ROOTS (20)
We are some of Canada’s earliest immigrants. Our great-grandparents came from the “Emerald Isle” during the potato famines in the 1800s. Who are the Irish?
FIRST (25)
We have always lived in Canada and speak over 50 different languages or dialects and belong to 10 different linguistic groups. Who are Aboriginal peoples?
Game sheet 2
BIRTH (5)
The way I came to be living in Canada gives me something in common with approximately 82% of Canada’s population. What is “born in Canada”?
SMALL (10)
I live in Canada’s least-populated province, but my name is not Anne. What is a Prince Edward Islander?
NEW (15)
***Double points*** I come from the continent that provides most of Canada’s immigrants today. What is an Asian?
WORK (20)
I work for the Canadian government agency that develops and conducts the census. What is a Statistics Canada employee?
GUIDE (25)
There are 439,375 people in Canada who are employed in this occupation that directly impacts students. What are teachers?
Activity 8: Answers and questions Category 3 – Who am I?

7 2011 Census Activity 8
Game sheet 1
AREA (5)
They are 13 political divisions shown on the map of Canada. What are the provinces and territories?
DOT (10)
This is the number of people with whom I share a dot on Canada’s 2006 population distribution map. What are 999 people?
CLUSTER (15)
***Double points*** This area in Ontario is home to 1/4 of the population of Canada. What is the Extended Greater Golden Horseshoe Region?
DOUGHNUT (20)
This eastern province’s population distribution map has its population clustered around its exterior. What is New Brunswick?
GATEWAY (25)
This western capital city’s population appears on the population distribution map as a cluster of dots and is the gateway to Canada’s western Arctic. What is Edmonton?
Game sheet 2
FEW (5)
This territory had 0.1% of Canada’s population in 2006 and shares most of its southern border with British Columbia. What is the Yukon Territory?
CLUSTERS (10)
This broad and fairly flat region features a settlement pattern of scattered clusters of dots. What are the Prairies?
ISLAND (15)
This west coast island features a population pattern that is concentrated along its eastern side. What is Vancouver Island?
WATER (20)
Quebec features settlements concentrated along this major river. What is the St. Lawrence River?
COASTAL (25)
These four provinces in Atlantic Canada feature settlement along their coastal borders. What are Nova Scotia; New Brunswick; Newfoundland and Labrador; and Prince Edward Island?
Activity 8: Answers and questions Category 4 – Settlement
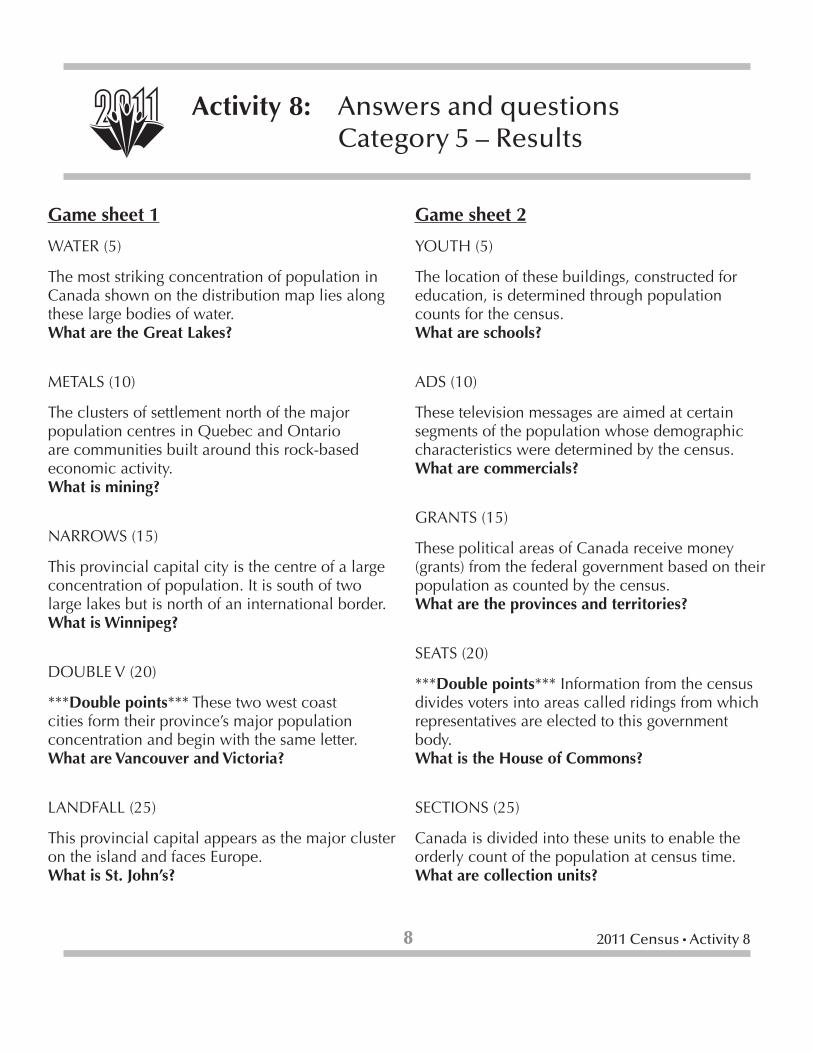
8 2011 Census Activity 8
Game sheet 1
WATER (5)
The most striking concentration of population in Canada shown on the distribution map lies along these large bodies of water. What are the Great Lakes?
METALS (10)
The clusters of settlement north of the major population centres in Quebec and Ontario are communities built around this rock-based economic activity. What is mining?
NARROWS (15)
This provincial capital city is the centre of a large concentration of population. It is south of two large lakes but is north of an international border. What is Winnipeg?
DOUBLE V (20)
***Double points*** These two west coast cities form their province’s major population concentration and begin with the same letter. What are Vancouver and Victoria?
LANDFALL (25)
This provincial capital appears as the major cluster on the island and faces Europe. What is St. John’s?
Game sheet 2
YOUTH (5)
The location of these buildings, constructed for education, is determined through population counts for the census. What are schools?
ADS (10)
These television messages are aimed at certain segments of the population whose demographic characteristics were determined by the census. What are commercials?
GRANTS (15)
These political areas of Canada receive money (grants) from the federal government based on their population as counted by the census. What are the provinces and territories?
SEATS (20)
***Double points*** Information from the census divides voters into areas called ridings from which representatives are elected to this government body. What is the House of Commons?
SECTIONS (25)
Canada is divided into these units to enable the orderly count of the population at census time.What are collection units?
Activity 8: Answers and questions Category 5 – Results
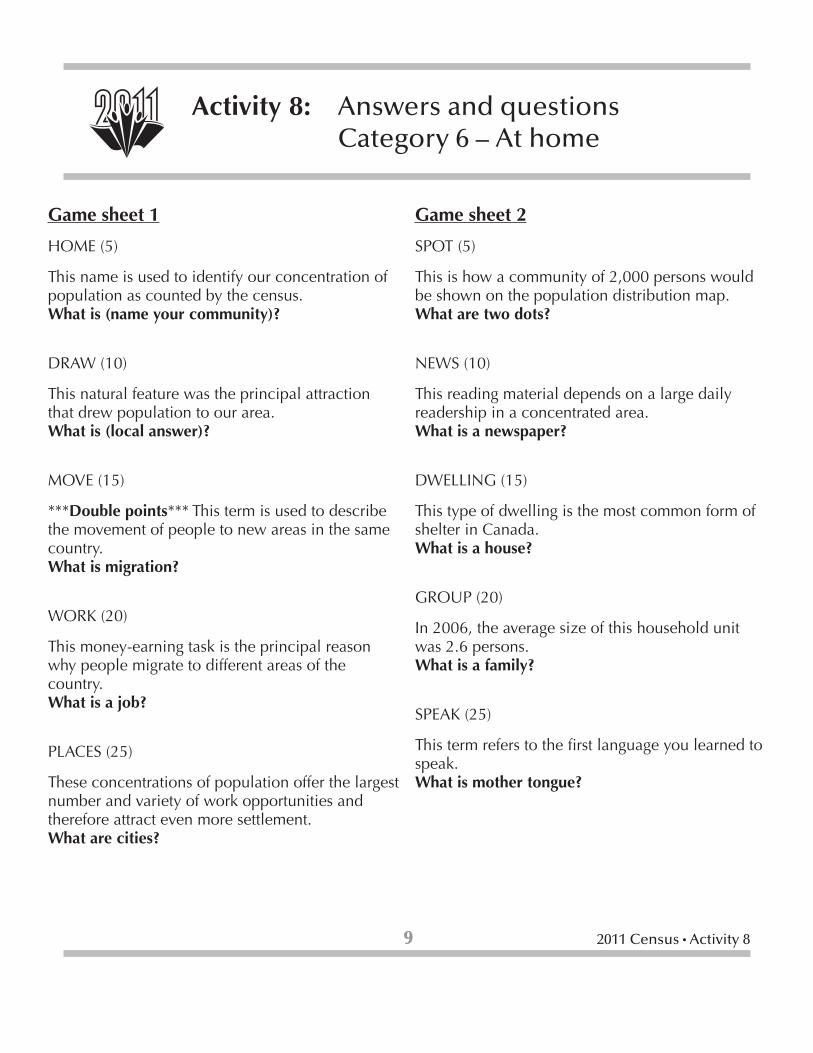
9 2011 Census Activity 8
Game sheet 1
HOME (5)
This name is used to identify our concentration of population as counted by the census. What is (name your community)?
DRAW (10)
This natural feature was the principal attraction that drew population to our area. What is (local answer)?
MOVE (15)
***Double points*** This term is used to describe the movement of people to new areas in the same country. What is migration?
WORK (20)
This money-earning task is the principal reason why people migrate to different areas of the country. What is a job?
PLACES (25)
These concentrations of population offer the largest number and variety of work opportunities and therefore attract even more settlement. What are cities?
Game sheet 2
SPOT (5)
This is how a community of 2,000 persons would be shown on the population distribution map.What are two dots?
NEWS (10)
This reading material depends on a large daily readership in a concentrated area. What is a newspaper?
DWELLING (15)
This type of dwelling is the most common form of shelter in Canada. What is a house?
GROUP (20)
In 2006, the average size of this household unit was 2.6 persons. What is a family?
SPEAK (25)
This term refers to the first language you learned to speak. What is mother tongue?
Activity 8: Answers and questions Category 6 – At home
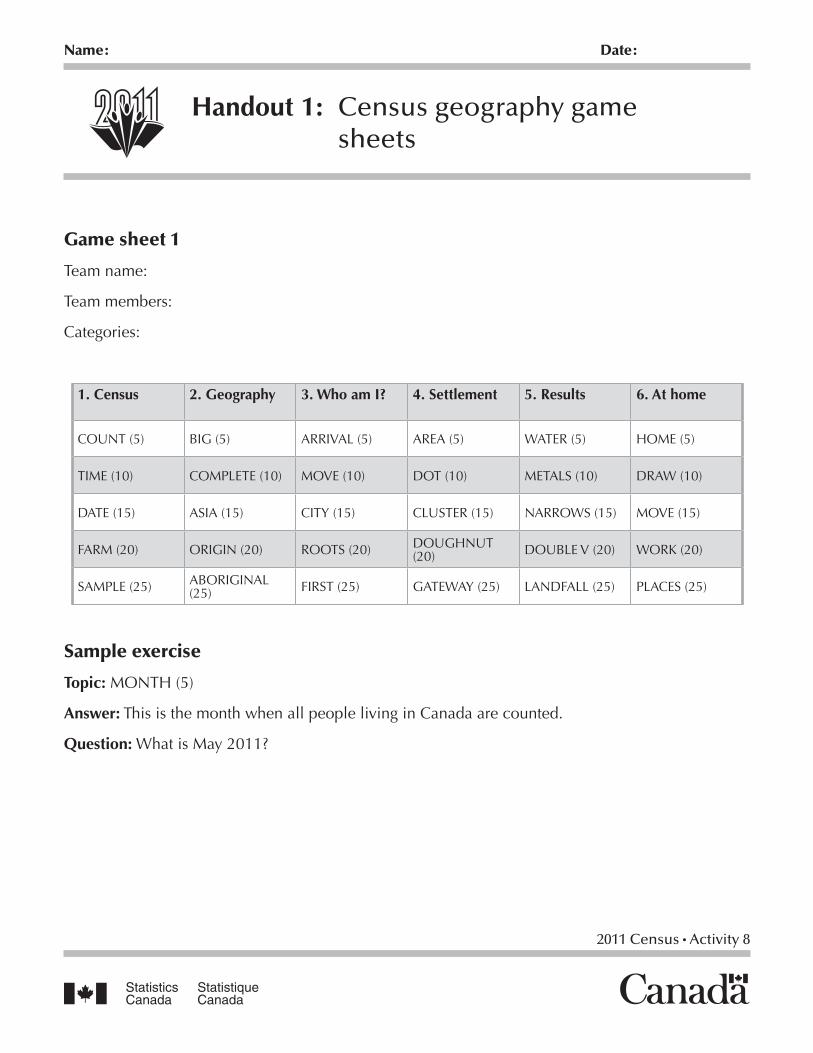
2011 Census Activity 8
Name: Date:
Handout 1: Census geography gamesheets
Game sheet 1
Team name:
Team members:
Categories:
1. Census 2. Geography 3. Who am I? 4. Settlement 5. Results 6. At home
COUNT (5) BIG (5) ARRIVAL (5) AREA (5) WATER (5) HOME (5)
TIME (10) COMPLETE (10) MOVE (10) DOT (10) METALS (10) DRAW (10)
DATE (15) ASIA (15) CITY (15) CLUSTER (15) NARROWS (15) MOVE (15)
FARM (20) ORIGIN (20) ROOTS (20) DOUGHNUT (20) DOUBLE V (20) WORK (20)
SAMPLE (25) ABORIGINAL (25) FIRST (25) GATEWAY (25) LANDFALL (25) PLACES (25)
Sample exercise
Topic: MONTH (5)
Answer: This is the month when all people living in Canada are counted.
Question: What is May 2011?

2011 Census Activity 8
Handout 1: Census geography gamesheets
Game sheet 2
Team name:
Team members:
Categories:
1. Census 2. Geography 3. Who am I? 4. Settlement 5. Results 6. At home
HOW (5) NEW (5) BIRTH (5) FEW (5) YOUTH (5) SPOT (5)
LAW (10) FOOD (10) SMALL (10) CLUSTERS (10) ADS (10) NEWS (10)
NEW (15) URBAN (15) NEW (15) ISLAND (15) GRANTS (15) DWELLING (15)
FACTS (20) NORTH (20) WORK (20) WATER (20) SEATS (20) GROUP (20)
TERM (25) SEATS (25) GUIDE (25) COASTAL (25) SECTIONS (25) SPEAK (25)
Sample exercise
Topic: MONTH (5)
Answer: This is the month when all people living in Canada are counted.
Question: What is May 2011?
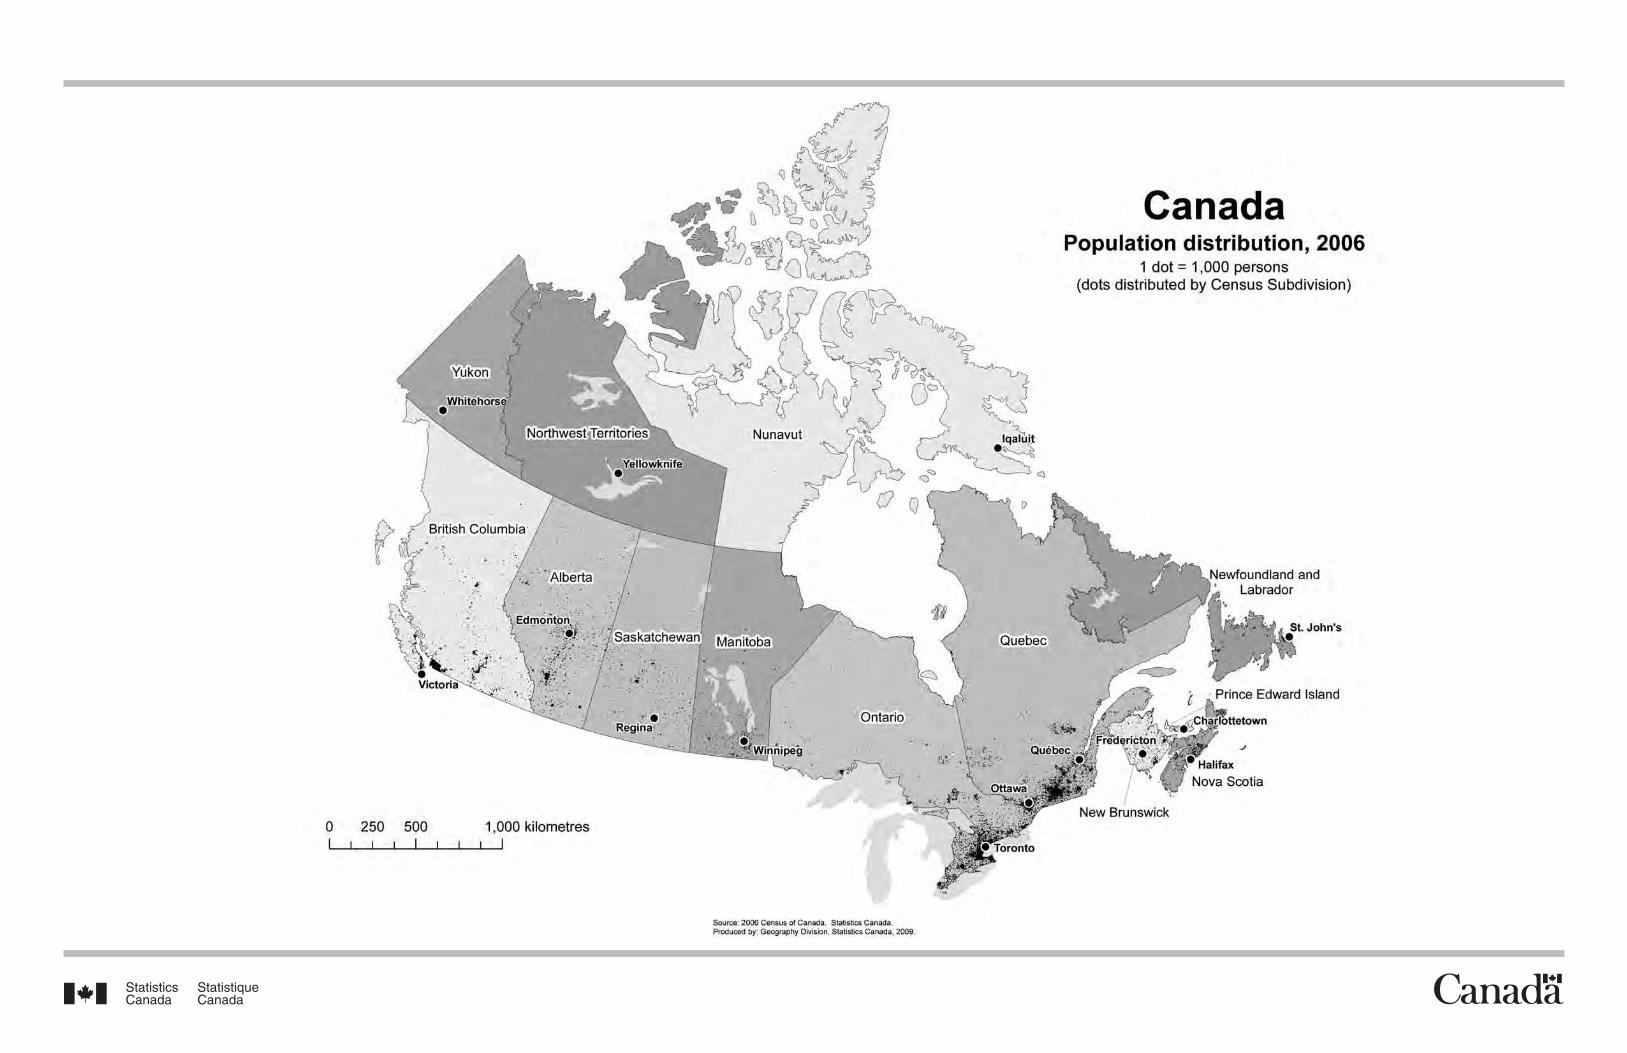
Please check the box next to the type of kit you are evaluating.
2011 Census Teacher’s Kit Adult Education Kit
Evaluation form
Census Communications is asking for your feedback. We would like to know if the 2011 Census Teacher’s Kit or Adult Education Kit met your needs and expectations. Please take a few moments to fill out this evaluation. Our goal is to produce the best products possible for teachers and instructors.
School / organization:
Grade(s) & subject taught: Province/Territory:
Please return this evaluation form by fax or regular mail, using the contact information below.
Statistics CanadaCensus Communications100 Tunney’s Pasture Driveway, 10th FloorOttawa, Ontario K1A 0T6Fax: 613-951-0930 or toll-free 1-877-256-2370E-mail: [email protected]
1. I used this kit in the classroom.
yes no
2. This kit met my provincial curriculum standards.
yes no
3. Did you use the Teacher’s / Instructor’s Guide?
yes no
4. The students found the material interesting and they were engaged.
strongly disagree neither agree strongly disagree disagree agree
or agree
5. Comments? Suggestions?
2011 Census Teacher’s Kit: Additional materials
To send this form by faxStatistics Canada1-877-256-2370 toll-free613-951-0930
To send this form by mailStatistics Canada2011 Census Teacher’s Kit100 Tunney’s Pasture Driveway, 10th FloorOttawa, ON K1A 0T6
Order informationEducator name
School / Organization name
Address
City
Province / Territory
Postal code
Phone (optional)
Fax (optional)
E-mail (optional)
Please send me
Teacher’s Kit
Colouring book (English) – package of 15
Colouring book (French) – package of 15
Activity sheet (English) – package of 30
Activity sheet (French) – package of 30
Adult Education Kit
Student workbook (English) – package of 15
Student workbook (French) – package of 15
Privacy notice: The information provided on this form will be used to fulfill this order only and will not be retained for any other purpose.
Number of packages
1 2
1 2
1 2
1 2 Number of packages
1 2
1 2