PRETREATMENT OF CASSAVA STARCH USING TRONA …
74
PRETREATMENT OF CASSAVA STARCH USING TRONA (AKANWU) FOR ENZYMATIC HYDROLYSIS AND BIOETHANOL PRODUCTION BY ANIAMALU BLESSING OBIANUJU PG/M.Sc./07/43602. PROJECT REPORT SUBMITTED IN PARTIAL FULFILMENT OF THE REQUIREMENTS FOR THE AWARD OF MASTER OF SCIENCE (M.Sc.) DEGREE IN INDUSTRIAL MICROBIOLOGY DEPARTMENT OF MICROBIOLOGY FACULTY OF BIOLOGICAL SCIENCES UNIVERSITY OF NIGERIA, NSUKKA SUPERVISOR: PROF. JAMES C. OGBONNA. SEPTEMBER, 2018
Transcript of PRETREATMENT OF CASSAVA STARCH USING TRONA …
PRETREATMENT OF CASSAVA STARCH USING TRONA
(AKANWU) FOR ENZYMATIC HYDROLYSIS AND
BIOETHANOL PRODUCTION
BY
ANIAMALU BLESSING OBIANUJU
PG/M.Sc./07/43602.
PROJECT REPORT SUBMITTED IN PARTIAL
FULFILMENT OF THE REQUIREMENTS FOR THE AWARD
OF MASTER OF SCIENCE (M.Sc.) DEGREE IN INDUSTRIAL
MICROBIOLOGY
DEPARTMENT OF MICROBIOLOGY
FACULTY OF BIOLOGICAL SCIENCES
UNIVERSITY OF NIGERIA, NSUKKA
SUPERVISOR: PROF. JAMES C. OGBONNA.
SEPTEMBER, 2018

i
TITLE PAGE
PRETREATMENT OF CASSAVA STARCH USING TRONA
(AKANWU) FOR ENZYMATIC HYDROLYSIS AND
BIOETHANOL PRODUCTION

ii
CERTIFICATION
Aniamalu Blessing O., a postgraduate student in the Department of Microbiology,
majoring in Industrial Microbiology has satisfactorily completed the requirements
of course work and research for the degree of Master of Science (M.Sc.) in
Microbiology. The work embodied in this dissertation is original, has not been
submitted in part or full for other diploma or degree of this or any other University.
------------------------------ ---------------------------
Prof. J. C. Ogbonna Prof. L. I. Ezeogu
(Supervisor) (Head of Department)
Date: ……………………… Date: ………………………

iii
DEDICATION
I dedicate this research work to the Most Blessed Trinity: Father, Son and Holy
Spirit, and also to the Blessed Virgin Mary, whose intercession helped for the
accomplishment of my desire.

iv
ACKNOWLEDGEMENT
First and foremost, I am highly indebted to Almighty God whom in His infinite
mercy and love had given me the courage to finish this programme despite all
odds. To Him be all glory and thanksgiving for ever more. I am particularly
indebted to my amiable and dedicated supervisors, Prof. J.C. Ogbonna and
Dr.C.O. Nwuche for competence and astute contributions in the area of
biotechnology. Words are too little to express what they have done in making my
educational career a reality. Your assistance, direction and supervision cannot be
over emphasized. Thanks a lot.
I heartily express my profound gratitude to my husband Engr. Frank Bernard
Nwoye, who had worked tirelessly through his advice, encouragement, persuasion
and financial support to see that this research became a reality. May the Almighty
God reward him abundantly.
I sincerely express my gratitude to my ever caring parent chief and Mrs F. C.
Aniamalu, my mentor Prof and Prof (Mrs) C. O. Okafor who motivated and
supported me all through the course of this research. I also want to acknowledge
the efforts and prayers of my siblings; Rev. Sr. Besy, Olivia, Charity and Joy. My
regards equally go to my friends and class mates, some of whom are Ngozi,
Ogechi, Florence, Peace and Uchechi. May the good Lord grant you all your heart
desires.

v
ABSTRACT
Alkaline pre-treatment is one of the major chemical pretreatment technologies
receiving studies. Pretreatment of cellulose and other fermentable substrates is
important because it reduces acetyl and removes uronic acid substitution on
hemicelluloses that reduce the accessibility of hemicellulase and cellulase
enzymes. The mechanism of action is believed to be the speciation of the
intermolecular ester bond, cross linking the xylanhemicelullose and other
components e.g. lignin. Cassava waste can be utilised to produce ethanol due to
its high cellulose and hemicellulose contents. In this study, cassava pretreatment
using potash and enzymatic hydrolysis to convert starch into fermentable sugars
was investigated. Optimization of the fermentation conditions for the production
of bioethanol from cassava was carried out by simultaneous hydrolysis and
fermentation using Aspergillus nigerand Saccharomyces cerevisiae respectively.
The starch content of the cassava, starch concentration, glucose and ethanol
concentration were 32%, 62g/l, 0.5g/l and 37.32% respectively. The results
showed that the variation of the following parameters: potash concentration,
duration of gelatinization, pHand inoculum sizes of yeast cell has significant
effects on bioethanol production. Under optimized conditions, the maximum
yield of bioethanol was 37.32% obtained from 10% starch at pH 4, 10 minutes of
gelatinization, while the control experiment gave 12.7% of bioethanol. The
implication of this result therefore, is that a relative measure of potash is required
to enhance the maximum production of ethanol. Pretreatment of cassava starch
using potash for enzymatic hydrolysis and bioethanol is a preferable alternative
to acidic pretreatment because potash is relatively cheap, readily available and
environmental friendly.

vi
TABLE OF CONTENTS
Title Page - - - - - - - - - - i
Certification - - - - - - - - - ii
Dedication - - - - - - - - - - iii
Acknowledgement - - - - - - - - iv
Abstract - - - - - - - - - - v
Table of Contents - - - - - - - - vi
List of Figures - - - - - - - - - xi
List of Tables - - - - - - - - - x
CHAPTER ONE
1.0 INTRODUCTION - - - - - - - 1
1.1 Statement of Problems - - - - - - 2
1.2 Aim of study - - - - - - - 2
1.3 Research objectives - - - - - 2
CHAPTER TWO
2.0 LITERATURE REVIEW - - - - - 3
2.1 Cassava as a bio-fuel Crop - - - - - 3
2.2 Starch and Uses - - - - - - - 4
2.3 The Importance of Amylase - - - - - - 7
2.4 Pre-treatment - - - - - - - 7
2.4.1 Effective Parameters in Pre-treatment of Lignocelluloses - 8
2.4.1.1 Crystallinity - - - - - - - - 8
2.4.1.2 Effect of accessible surface area - - - - 9
2.4.1.3 Effect of Lignin - - - - - - - 10
2.4.1.4 Effect of hemicellulose - - - - - 12
2.4.2 Pre-treatment Methods for Lignocellulosic Waste - - 12
2.4.2.1 Physical Pre-treatment - - - - - 12
vii
2.4.3 Chemical Pre-treatment - - - - - - 13
2.4.3.1 Acid Pre-treatment - - - - - - 13
2.4.3.2 Alkaline pre-treatment - - - - - - 13
2.4.3.3 Ammonia Fiber /Freeze Explosion (AFEX) Pre-treatment - 14
2.4.3.4 pH Controlled Liquid Hot Water Pretreatment - - - 14
2.4.3.5 Organosolv Pre-treatment - - - - - 15
2.4.3.6 Biological Method - - - - - - 15
2.5 Trona (Potash): Occurrence and Composition - - - 15
2.6 Hydrolysis - - - - - - - - 16
2.6.1 Chemical Hydrolysis - - - - - - - 17
2.6.2 Enzymatic Hydrolysis - - - - - - 17
2.7 Classification of Starch Hydrolysate - - - - - 18
2.8 Bioethanol Production - - - - - - 21
2.9 Myths and Realities about Biofuels - - - - - 22
CHAPTER THREE
3.0 MATERIALS AND METHODS - - - - 24
3.1 Preparation of Cassava Starch - - - - - 24
3.2 Microorganisms - - - - - - - 24
3.3 Preparation of enzyme for hydrolysis - - - 25
3.4 Preparation of Yeast Cells - - - - - 25
3.5 Determination of Starch Content - - - - 25
3.6 Gelatinization of the Starch - - - - - 26
3.7 Pre-treatment of Cassava starch with potash - - - 26
3.8 Hydrolysis - - - - - - - - 26
3.9 Fermentation - - - - - - 27
3.10 Determination of Starch Concentration - - - 27
3.11 Determination of Glucose Concentration - - - 27
3.12 Determination of Ethanol Concentration - - - 27
3.13 Enzyme Assay - - - - - - - 28
viii
2.14 Statistical Analysis - - - - - - - 28
CHAPTER FOUR
4.0 RESULTS - - - - - - - 30
4.1 Starch Content - - - - - - - 31
4.2 Simultaneous hydrolysis and fermentation of cassava flour
using 5% Potash, 2.58x10⁶ cells of Saccharomyces cerevisiae cells
at pH 3 gelatinized for 10 minutes - - - - - 30
4.3 Simultaneous hydrolysis and fermentation of cassava flour
using 7.5% Potash, 2.58x10⁶ cells of Saccharomyces cerevisiae
cells at pH 3 gelatinized for 10 minutes- - - - - 31
4.4 Simultaneous hydrolysis and fermentation of cassava flour
using 10.0% Potash, 2.58x10⁶ cells of Saccharomyces cerevisiae
cells, pH 3 and gelatinized for 10 minutes- - - - - 32
4.5 Simultaneous hydrolysis and fermentation of cassava flour
using 12.5% Potash, 2.58x10⁶ cells of Saccharomyces cerevisiae
cells, pH 3 and gelatinized for 10 minutes. - - - 33
4.6 Simultaneous hydrolysis and fermentation of cassava flour
using 15% Potash, 2.58x10⁶ cells of Saccharomyces cerevisiae,
pH3 and gelatinized for 10 minutes - - - - - 34
4.7 Simultaneous hydrolysis and fermentation of cassava flour
using 12.5% Potash, 5.16 x10⁶ cell of Saccharomyces cerevisiae,
pH 4 and gelatinized for 10 minutes. - - - - - 35
4.8 Simultaneous hydrolysis and fermentation of cassava flour using
12.5% potash, 3.87 x10⁶ cells of Saccharomyces cerevisiae,
pH 4 and gelatinized for 10 minutes - - - - - 36
4.9 Simultaneous hydrolysis and fermentation of cassava flour using
12.5% Potash, 2.58 x10⁶ cells of Saccharomyces cerevisiae,
pH4 and gelatinized for 10 minutes - - - - - 37
4.10 Simultaneous hydrolysis and fermentation of cassava flour using
12.5% Potash, 1.29 x10⁶ cells of Saccharomyces Cerevisiae,
pH 4 and gelatinized for 10 minutes - - - - 38

ix
4.11 Simultaneous hydrolysis and fermentation of cassava flour
using no Potash, 2.58 x10⁶ cells of Saccharomyces Cerevisiae,
pH4 and gelatinized for 10 minutes (control) - - - 39
4.12 Simultaneous hydrolysis and fermentation of cassava flour using
12.5% Potash, 3.87x10⁶ cells of Saccharomyces cerevisiae,
pH 4 and gelatinized for 20 minutes - - - - - 40
4.13 Simultaneous hydrolysis and fermentation of cassava flour using
12.5% Potash, 3.87x10⁶ cells of Saccharomyces cerevisiae,
pH 4 and gelatinized for 0 minute - - - - - 41
4.14 Simultaneous hydrolysis and fermentation of cassava flour using
12.5% Potash, 3.87x10⁶ cells of Saccharomyces cerevisiae,
pH 4 and gelatinized for 15 minutes - - - - - 42
4.15 Simultaneous hydrolysis and fermentation of cassava flour using
12.5% Potash, 3.87x10⁶ cells of Saccharomyces cerevisiae,
pH 4 and gelatinized for 5 minutes - - - - - 43
4. The rate of Gluco-amylase activity on starch during
Fermentation - - - - - - - - 44
4.17 The rate of alpha-amylase activity on starch during fermentation 45
4.18 Determination of cell concentration - - - - - 46
CHAPTER FIVE
5.1 Discussion - - - - - - - - - 47
5.2 Conclusion - - - - - - - - 49
REFERENCES - - - - - - - 50
APPENDIX
Reagents and Media Composition - - - - - 54
Effect of Potash Concentration - - - - - - 55
Effect of cell Concentration - - - - - - 56
Effect of Duration of Gelatinization - - - - - 57

x
LIST OF TABLES
Table 1: Determination of cell Concentration 46

xi
LIST OF FIGURES
Fig. 1: Simultaneous hydrolysis and fermentation of cassava
flour using 5% Potash, 2.58x10⁶ cells of Saccharomyces cerevisiae,
pH 3 and gelatinized for 10 minutes. - - - - 30
Fig. 2: Simultaneous hydrolysis and fermentation of cassava flour using
7.5% potash, 2.58x10⁶ cells of Saccharomyces cerevisiae,
pH3, and gelatinized for 10 minutes - - - - - 31
Fig. 3: Simultaneous hydrolysis and fermentation of cassava flour using
10.0% potash, 2.58 x10⁶ cells of Saccharomyces cerevisiae,
pH 3 and gelatinized for 10 minutes - - - - - 32
Fig. 4: Simultaneous hydrolysis and fermentation of cassava flour using
12.5% potash, 2.58 x10⁶ cells of Saccharomyces cerevisiae,
pH 3 and gelatinized for 10 minutes - - - - 33
Fig. 5: Simultaneous hydrolysis and fermentation of cassava flour using
15.0% potash, 2.58x10⁶ cells of Saccharomyces Cerevisiae,
pH 3 and gelatinized for 10 minutes - - - - 34
Fig. 6: Simultaneous hydrolysis and fermentation of cassava flour suing
12.5% potash, 5.16 x10⁶ cells of Saccharomyces cerevisiae,
pH 4 and gelatinized for 10 minutes - - - - 35
Fig. 7: Simultaneous hydrolysis and fermentation of cassava flour using
12.5% potash, 3.87x 10⁶ cells of Saccharomyces cerevisiae,
pH 4 and gelatinized for 10 minutes - - - - 36
Fig. 8: Simultaneous hydrolysis and fermentation of cassava flour using
12.5% potash, 2.58x 10⁶ cells of Saccharomyces cerevisiae,
pH 4 and gelatinized for 10 minutes - - - - 37
Fig 9: Simultaneous hydrolysis and fermentation of cassava flour using
12.5% potash, 1.29 x10⁶ cells of Saccharomyces cererisiae,
pH 4 and gelatinized for 10 minutes - - - - 38
Fig. 10: Simultaneous hydrolysis and fermentation of cassava flour
using no potash, 2.58x 10⁶ cells of Saccharomyces cervisiae,
pH 4 and gelatinized for 10 minutes (control) - - 39

xii
Fig. 11: Simultaneous hydrolysis and fermentation of cassava flour using
12.5% potash, 3.87x 10⁶ cells of Saccharomyces cerevisiae,
pH 4 and gelatinized for 20 minutes - - - - 40
Fig. 12: Simultaneous hydrolysis and fermentation of cassava flour using
12.5% potash, 3.87× 10⁶ cells of Saccharomyces cerevisia,
pH 4 and gelatinized for 0 minute - - - - - 41
Fig. 13 Simultaneous hydrolysis and fermentation of cassava flour using
12.5% potash, 3.87× 10⁶ cells of Saccharomyces cerevisiae,
pH 4 and gelatinized for 15 minutes - - - - 42
Fig. 14: Simultaneous hydrolysis and fermentation of cassava flour using
12.5% potash, 3.87× 10⁶ cells of Saccharomyces cerevisiae,
pH4 and gelatinized for 5 minutes - - - - 43
Fig. 15: The rate of gluco-amylase activities on starch during fermentation 44
Fig. 16: The rate of alpha-amylase enzyme activities on starch during
Fermentation - - - - - - - 45

13
CHAPTER ONE
1.0 INTRODUCTION
With increasing demand for energy, continuous depletion of the world fossil energy
reserves, instability in the global oil price, and various environmental problems such
as climate change, global warming, soil, water, and air pollution associated with the
use of fossil fuel, there is an increasing pressure for the development of renewable
and sustainable alternative sources of energy. Bio-energy (energy from biomass
materials) has very good potential as a substitute for the fossil fuels because they are
renewable, sustainable and environmental friendly. Bioethanol is a good alternative
to fossil fuel. It is now the most important renewable fuel in terms of volume and
market value (Lincht, 2006). The raw material used for the production of bio-
ethanoldepends on the region/country. One of the ways of producing ethanol is
through fermentation of crops which are rich in sugars or starch such as sugar cane,
sugar beet, sweet sorghum, corn and cassava (Abouzeid et al., 1983). Whether food
crops or non-food crops are used, the net result is that there will be competition for
farm land and agricultural input. It is widely acknowledged that the rate and extent
of bioconversion of substrates is influenced not only by the effectiveness of the
enzymes but also by the chemical, physical and morphological characteristics of the
heterogeneous lignocellulosic substrate. The initial characteristics of the woody
biomass and the effect of substrate pretreatment play a significant role in the
development of substrate properties, which in turn govern the efficacy of enzymatic
hydrolysis (Mohammed et al., 2008).
Lignocellulosic material pretreatment method is applied for improved production of
ethanol from cassava which has high fibre content. Enzymatic hydrolysis of cassava
fibre without pretreatment is usually not so effective because of high stability of the
material to enzymatic or bacterial attacks (Sewalt et al., 1997). Pretreatment refers

14
to the solubilisation and separation of one or more of the four major components of
biomass (hemicelluloses, cellulose, lignin and extractives) to make the remaining
solid biomass more accessible to further chemical or biological treatment (Demirbas,
2005). Pretreatment results in enrichment of the difficult biodegradable materials,
and improves the yield of ethanol and biogas from the wastes.
1.1 Statement of Problems
With the depletion of world energy reserves, instability of global oil prices and
environmental related issues, bioethanol is considered to be among the most
promising alternative to petroleum. Presently separating the carbohydrate and lignin
components of substrates as well as disrupting the plant cell wall barriers constitutes
a serious challenge to enzymatic hydrolysis during production of bioethanol.
1.2 Aim of Study
The aim of study is to determine the quantity of ethanol produced per unit time after
pretreating the cassava with trona.
1.3 Research objectives
The objectives of this study are:
1. To evaluate the use of traditionally processed potash in cassava hydrolysis as
a pre-step towards easy utilization for industrial scale production of bioethanol.
2. To study the effect of potash concentration, cassava starch concentration, pH,
duration of gelatinization and inoculums concentration on ethanol production.
15
CHAPTER TWO
2.0 LITERATURE REVIEW
Tubers are part of the rhizome thickened for use as a storage organ. They are equally
referred to as swollen region of an underground stem or root usually modified for
storing food (Onwueme, 1978). Thus tubers are grouped into two; the stem tubers
(e.g. potato) and root tubers (e.g. cassava). Cassava (Manihotesculanta) is a starch
containing root crops of worldwide importance as food, feed, and non-food product.
It is the shrubby, tropical, perennial plant that is not well known in temperate zone.
For most people, cassava is most commonly associated with tapioca. It is the second
most important staple. The edible parts are the tuberous root and leaves. The tuber
(root) is somewhat dark brown in colour and grows up to two feet long. Cassava is
a heat-loving plant that requires a minimum temperature of 26.67oC to grow
(Onwueme, 1978). Around the world, cassava is a vital staple for about 500 million
people. Cassava’s starchy roots produce more food energy per unit of land than any
other staple crop. Its leaves, commonly eaten as a vegetable in parts of Asia and
Africa, provide vitamins and proteins. Nutritionally, cassava is comparable to
potatoes, except that it has twice the fibre content and high level of potassium
(Hguyen et al., 2007). Cassava can be used as vegetables in dishes, grated to make
pancakes, dried and ground into tapioca flour, or sliced and made into snack chips.
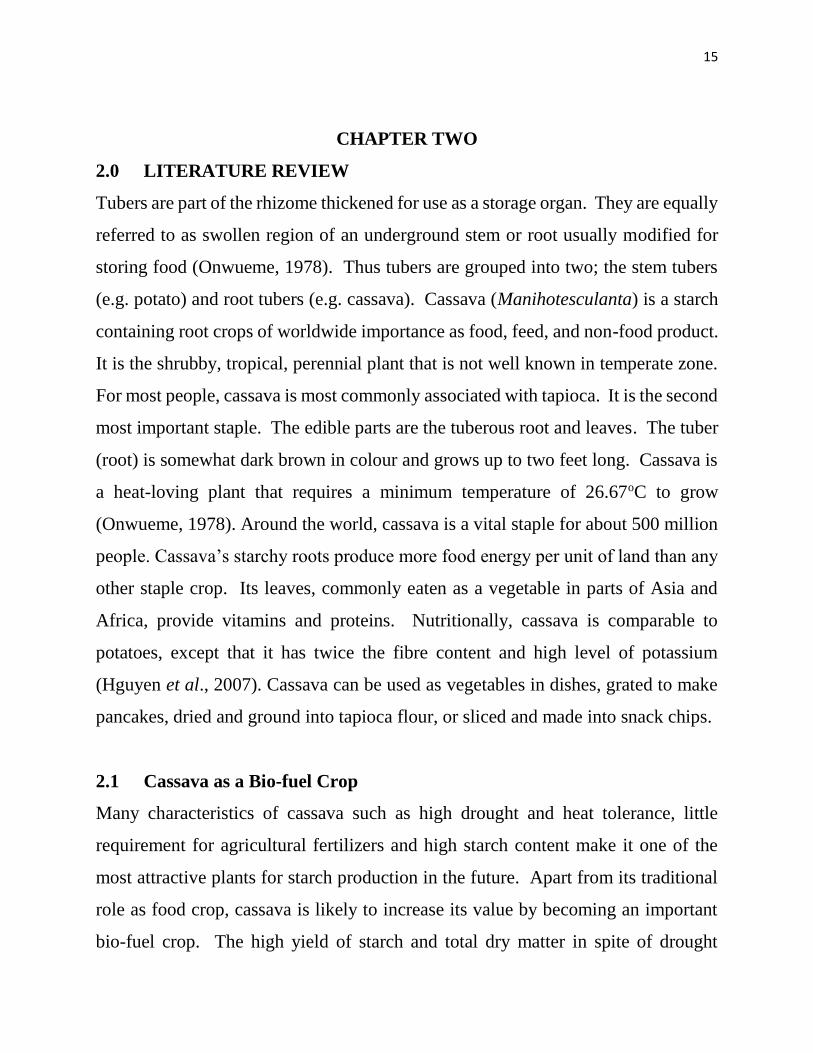
2.1 Cassava as a Bio-fuel Crop
Many characteristics of cassava such as high drought and heat tolerance, little
requirement for agricultural fertilizers and high starch content make it one of the
most attractive plants for starch production in the future. Apart from its traditional
role as food crop, cassava is likely to increase its value by becoming an important
bio-fuel crop. The high yield of starch and total dry matter in spite of drought
16
conditions and poor soil, together with low agro-chemical requirements, result in an
energy input that represents only 5-6% of the final energy content of the total cassava
biomass. This translates to an energy content in the total biomass (Hguyenet al.,
2007). A direct comparison of bio-ethanol production from different energy crops
was reviewed by (Wang, 2002). The conclusion was that cassava compared
favourably to other crops such as maize, sugar cane and sweet sorghum. The energy
conversion efficiency from cassava starch to bioethanol is still low. The average
content of starch in cassava fresh storage is 24% - 32%. With current technology
about 6.6 tonnes of fresh storage root may be converted into 1 tonne of ethanol (Song
et al., 2008).
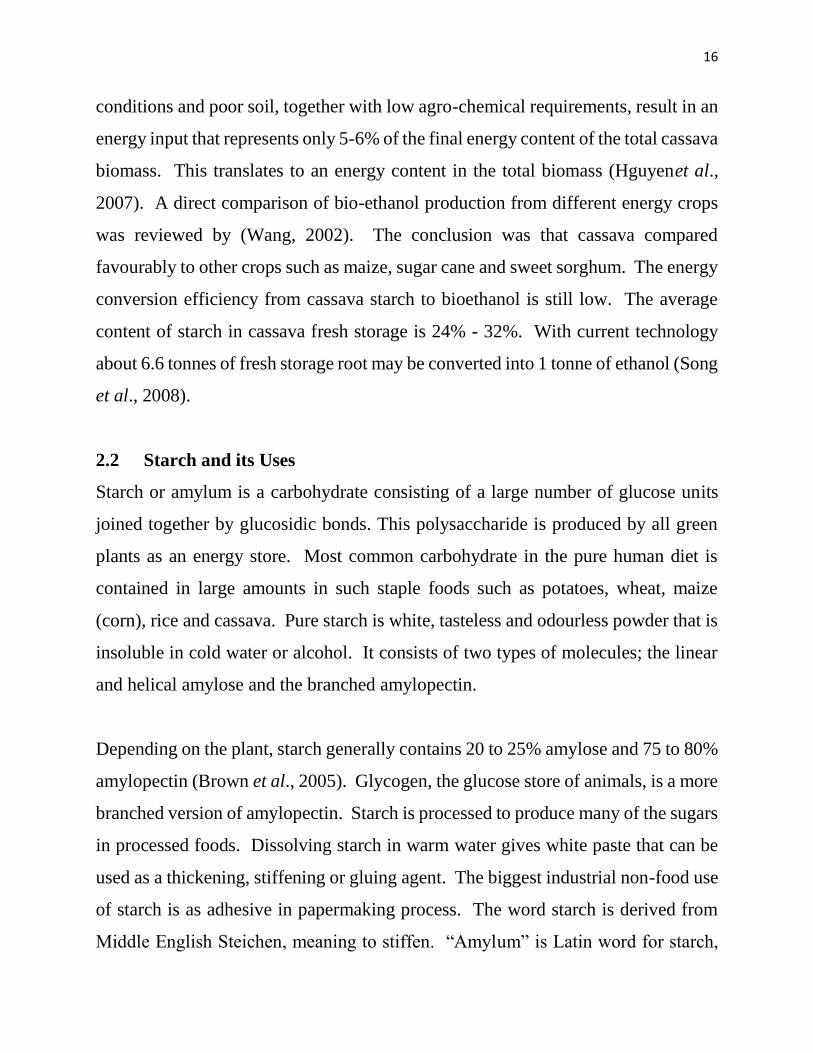
2.2 Starch and its Uses
Starch or amylum is a carbohydrate consisting of a large number of glucose units
joined together by glucosidic bonds. This polysaccharide is produced by all green
plants as an energy store. Most common carbohydrate in the pure human diet is
contained in large amounts in such staple foods such as potatoes, wheat, maize
(corn), rice and cassava. Pure starch is white, tasteless and odourless powder that is
insoluble in cold water or alcohol. It consists of two types of molecules; the linear
and helical amylose and the branched amylopectin.
Depending on the plant, starch generally contains 20 to 25% amylose and 75 to 80%
amylopectin (Brown et al., 2005). Glycogen, the glucose store of animals, is a more
branched version of amylopectin. Starch is processed to produce many of the sugars
in processed foods. Dissolving starch in warm water gives white paste that can be
used as a thickening, stiffening or gluing agent. The biggest industrial non-food use
of starch is as adhesive in papermaking process. The word starch is derived from
Middle English Steichen, meaning to stiffen. “Amylum” is Latin word for starch,

17
from the Greek word “amylon” which means not ground at a mill. The word amyl
is used in biochemistry for several compounds related to starch (Brown, and Poon,
2005).
Starch molecules arrange themselves in the plant in semi crystalline granules. Each
plant species has a unique starch granular size: rice starch is relatively small (about
2µm) while potato starches have larger granules (up to 100µm). Although in
absolute mass only about one quarter of the starch granules in plants consists of
amylose, there are about 150 times more amylose molecules than amylopectin
molecules. Amylose is a much smaller molecule than amylopectin molecules
(Anne- Charlotte, 2004). Starch becomes soluble in water when heated. The
granules swell and burst, the semi-crystalline structure is lost and the smaller
amylose molecules leaching out of the granules, forming a network that holds water
and increasing the mixture viscosity. This process is called starch gelatinization.
During cooking, the starch becomes a paste and increases further in viscosity.
During cooling or prolonged storage of the paste, the semi-crystalline structure
partially recovers and the starch paste thickens, expelling water. This is mainly
caused by the retro gradation of the amylose. This process is responsible for the
hardening of bread or staling, and form the water layer on top of a starch gel
(syneresis). Some cultivated plant varieties have pure amylopectin starch without
amylose, known as waxy starches. The most used is waxy maize; others are
glutinous rice and waxy potato starch. Waxy starches have less retro gradation,
resulting in a more stable paste. High amylose starch, amylomaize, is cultivated for
the use of its gel strength. If starch is subjected to dry heat, it breaks down to form
pyrodextrins, a process known as dextrinization. Pyrodextrins are brown in colour.
This is partially responsible for the browning of toasted bread.

18
Paper making is the largest non-food application of starches globally, consuming
millions of metric tonnes annually (Codex Alimentarius, 2001). In a typical sheet
of copy paper for instance, the starch content may be as high as 8%. Both chemically
modified and unmodified starches are used in paper making. In the wet part of the
paper making process, generally called the “wet end”,the starches used are cationic
and have a positive charge bound to the starch polymer. These starch derivatives
associate with the anionic or negative charged paper fibres/cellulose and inorganic
fillers. Cationic starches together with other retention internal sizing agents help to
give the necessary strength properties for the paper web to be formed in the paper
making process (wet strength), and to provide strength to the final paper sheet (dry
strength) (Chen et al., 2008). In the dry end of the paper making process, the paper
web is rewetted with a starch base solution. The process is called surface sizing.
Starch used has been chemically or enzymatically depolymerised at the paper mill
or by the starch industry. Starch is also used in paper coating as one of the binders
for the coating formulation, a mixture of pigments, binders and thickeners. Coated
paper has improved smoothness, hardness, whiteness and gloss, and thus improves
printing characteristics. Clothing or laundry starch is a liquid that is prepared by
mixing a vegetable starch in hot water, and is used in the laundering of clothes.
Starch was widely used in Europe in the 16th – 17th centuries to stiffen the wide
collars and ruffs of fine linen which surrounded the neck of the well-todo.
Another large non-food starch application is in the construction industry, where
starch is used in the gypsum wall board manufacturing process; chemically modified
or unmodified starches are added to the stucco containing primarily gypsum. The
starches act as glue for the cured gypsum rock with the paper covering, and also
provide rigidity to the board. Starch is used in the manufacturing of various
adhesives or glues for bookbinding, wall paper adhesives, school glues and bottle
19
labelling. Starch derivatives, such as yellow dextrin can be modified by addition of
some chemicals to form hard glue for paper work; some use borax or soda ash, which
are mixed with the starch solution at 50oC – 70oC to create a very good adhesive.
Sodium silicate can be added to reinforce those formulae.
2.3 The Importance of Amylase.
Amylase refers to a group of enzymes whose catalytic function is to hydrolyze
(breakdown) sugars and starch. Amylasedigests carbohydrates (poly-
saccharides)into smaller disaccharide units, eventually converting them into
monosaccharide such as glucose. People who are fat intolerant (can’t digest fats)
often eat sugar and carbohydrates to make up for the lack of fat in their diet. All
amylases are glycoside hydrolases and act on α-1,4- glucosidic bonds. Amylase
enzyme is used in bread making, breaking down complex sugars such as starch
(found in flour) into simple sugars. Yeast then feeds on these simple sugars and
converts it into the waste product of alcohol and carbon dioxide. This imparts
flavour and causes bread to rise. While amylase enzymes are found naturally in
yeast cells, it takes time for the yeast to produce enough of these enzymes to break
down significant quantities of starch in the bread. This is the reason for long
fermented dough such as sour dough.
2.4 Pretreatment
Pretreatment refers to the solubilisation and separation of one or more of the four
major components of biomass (hemicelluloses, cellulose, lignin and extractives) to
make the remaining solid biomass more accessible to further chemical or biological
treatment (Demirbas, 2005). According to Hu et al., 2008,pretreatment constitutes
the means to separate the carbohydrate and lignin and, disrupt the crystalline region
of these materials. Pretreatment is required for delignification, because lignin in

20
plant cell walls form a barrier against enzymatic attack (Sewaltet al., 1997).An ideal
pretreatment would reduce the lignin content and crystallinity of the cellulose and
increase the surface area (Krishna and Chowdary, 2000). Lignin is degraded in
nature by various organisms but the mechanism of natural degradation is not known.
2.4.1 Effective parameters in pretreatment of lignocelluloses
The inherent properties of native lignocellulosic materials make them resistant to
enzymatic attack. The aim of pretreatment is to change these properties in order to
prepare the materials for enzymatic degradation. Since lignocellulosic materials are
very complicated, their pretreatment is not simple either. The best method and
conditions of pretreatment depend greatly on the type of lignocellulose. For instance,
pretreatment of bark from poplar trees or corn leaf with a dilute-acid process seems
to be promising, but this method is not effective for treating the bark from sweet
gum or corn stalk. The crystallinity of cellulose, its accessible surface area and
protection by lignin and hemicellulose, degree of cellulose polymerization, and
degree of acetylation of hemicelluloses are the main factors considered as affecting
the rate of biological degradation of lignocelluloses by the enzymes. These factors
will be discussed briefly below.
2.4.1.1 Crystallinity
The cellulose micro fibrils have both crystalline and amorphous regions, and the
crystallinity is given by the relative amounts of these two regions. The major part of
cellulose (around 2/3 of the total cellulose) is in the crystalline form. It was shown
that cellulase readily hydrolyzes the more accessible amorphous portion of cellulose,
while the enzyme is not so effective in degrading the less accessible crystalline
portion. It is therefore expected that high-crystallinity cellulose will be more
21
resistant to enzymatic hydrolysis, and it is widely accepted that decreasing the
crystallinity increases the digestibility of lignocelluloses.
On contrary, there are some studies that show more digestibilities of more crystalline
lignocelluloses. This conflict in the reports might appear, while the effects of other
factors are ignored. Grethlein (1984) pretreated hard-and softwoods by mild acid
hydrolysis and determined their pore size distribution. Regardless of the substrate,
the initial rate of hydrolysis was shown to be linearly correlated with the pore volume
of the substrate accessible to the size of the cellulase. However, it was also shown
that the crystallinity index has no relationship to the rate of hydrolysis. Kim and
Holtzapple (2006) found that the degree of crystallinity of corn stoves slightly
increased from 43% to 60% through delignification with calcium hydroxide, which
was related to removal of amorphous components (lignin, hemicellulose). However,
an increase in crystallinity of pretreated material did not negatively affect the yield
of enzymatic hydrolysis. Fan et al. (2001) studied the effect of ball milling on surface
area and crystallinity ofcellulose, and they observed an increase in crystallinity of
cellulose by reducing the size of cellulose by milling. It is believed that
recrystallization during water swelling may increase the crystallinity of highly ball-
milled cellulose.
This discussion may indicate that the crystallinity is an important factor in
digestibility of lignocelluloses. However, it is not the only factor in effective
enzymatic hydrolysis of these materials, due to the heterogeneous nature of
celluloses and the contribution of other components such as lignin and
hemicellulose.
2.4.1.2 Effect of accessible surface area
Several studies have shown a good correlation between the pore volume or
population (accessible surface area for cellulase) and the enzymatic digestibility of
lignocellulosic materials. The main reason for improvement in enzymatic hydrolysis

22
by removing lignin and hemicellulose is related to the cellulose accessible surface
area. The effect of this area may correlate with crystallinity or lignin protection or
hemicellulose presentation or all of them. Therefore, many researchers have not
considered the accessible surface area as an individual factor that affects the
enzymatic hydrolysis. The first part of enzymatic hydrolysis consists of: (I)
adsorption of cellulase enzymes from liquid phase onto the surface of cellulose
(solid), (II) biodegradation of cellulose to simple sugars, mainly cellobiose and
oligomers, and (III) desorption of cellulase to the liquid phase(Chang et al., 2000).
Thus, the reaction is a heterogeneous catalytic reaction and direct physical contact
between the cellulytic enzymes’ molecules and cellulose is a prerequisite for
enzymatic hydrolysis. As a result, the accessible surface area in lignocellulosic
material and its interaction with the enzymes can be limiting in enzymatic
hydrolysis.
Lignocellulosic materials have two different types of surface area: external and
internal. The external surface area is related to the size and shape of the particles,
while the internal surface area depends on the capillary structure of cellulosic fibers
(Hguyen et al., 2007). Typically, dry cellulosic fibers have small size, about 15 to
40 μm, and therefore they possess a considerable external specific surface area, e.g.
0.6–1.6 m2/g. However, the internal surface area of dried cellulosic fibers is smaller
than the external surface area. Swelling of lignocelluloses with water and polar
solvents creates a very large internal surface area. Drying of fibers can result in
irreversible collapse and shrinking of the capillary and thus reduce the accessible
surface area. Presence of water has a significant effect on the specific surface area
of natural cellulose. The specific surface area is known to increase with wetting.
Water is known to increase the crystallinity of cellulose, due to a re-crystallization
of highly amorphous cellulose.
23
The accessible surface area changes during enzymatic hydrolysis. The rate of
hydrolysis is usually very high at first, and then decreases in the later stages. The
specific surface area, or accessible surface area per gram of substrate (m2/g), sharply
increases during the initial stage (Abouzied et al., 1983). However, it was shown
that the cellulose surface area is not a major limiting factor for hydrolysis of pure
cellulose. In other words, the slowdown of hydrolysis in the later stages is not due
to a lack of associable surface area, but to the difficulty in hydrolysis of crystalline
part of cellulose. Therefore, one may expect a lower rate of hydrolysis after
hydrolysis of the amorphous cellulose.
2.4.1.3 Effect of lignin
The cellulose and hemicellulose are cemented together by lignin. Lignin is
responsible for integrity, structural rigidity, and prevention of swelling of
lignocelluloses. Thus, lignin content and distribution constitute the most recognized
factor which is responsible for recalcitrance of lignocellulosic materials to enzymatic
degradation by limiting the enzyme accessibility; therefore the delignification
processes can improve the rate and extent of enzymatic hydrolysis. However, in most
delignification methods, part of the hemicellulose is also hydrolyzed, and hence the
delignification does not show the sole effect of lignin. Dissolved lignin due to
pretreatment of lignocelluloses is also an inhibitor for cellulase, xylanase, and
glucosidase. Various cellulases differ in their inhibition by lignin, while the
xylanases and glucosidase are less affected by lignin.
The composition and distribution of lignin might also be as important as the
concentration of lignin. Some soft woods are more recalcitrant than hardwoods. This
might be related to the lignin type, since softwoods have mainly guaiacyl lignin
while hardwoods have a mix of guaiacyl and syringyl lignin. It has been suggested
24
that guaiacyl lignin restricts fibre swelling and enzyme accessibility more than
syringyl lignin (Sewalt et al., 1997).
In some investigations the inhibitory role of lignin has been related to its effect on
cellulose swelling. On the other hand, the swelling can be achieved without removal
of lignin, and it does not increase the pore size or the extent of hydrolysis. However,
it was shown that lignin still has a significant effect on enzymatic digestibility, even
in cases where it no longer prevents fibre swelling. The reason for improved rate of
hydrolysis by removal of lignin might be related to a better surface accessibility for
enzymes by increasing the population of pores after removing of lignin.
2.4.1.4 Effect of hemicellulose
Hemicellulose is a physical barrier which surrounds the cellulose fibres and can
protect the cellulose from enzymatic attack. Many pretreatment methods were
shown to be able to remove hemicelluloses and consequently improve the enzymatic
hydrolysis. But most of these processes partly remove the lignin as well, so the
improvement is not the result of removal of hemicellulose alone. The accessible
surface for enzymatic attack may be related to cellulose crystallinity, lignin, and
hemicellulose content. Hemicellulose can be hydrolyzed by enzymatic hydrolysis
by hemicellulase. However, a suitable pretreatment, e.g. dilute-acid treatment which
removes the hemicellulose, eliminates or reduces the need for use of hemicellulase
enzyme mixtures for degrading of biomass (Mosier et al., 2005).
2.4.2 Pretreatment Methods for Lignocellulosic Wastes.
2.4.2.1 Physical Pretreatment
Physical pretreatment includesuncatalyzed steam explosion, liquid hot water
pretreatment (LHW), mechanical and high energy radiation.

25
2.4.2.1.1 Uncatalyzed Steam Explosion.
This is also called autohydrolysis in which only steam is used. Extensive work has
been done on auto hydrolysis and it is one of the commonest pretreatment methods
for lignocellulosic biomass (Chandraet al., 2008). During steam pretreatment, the
biomass is put in a large vessel and steam with a high temperature (up to 24OC) and
pressure is applied for a few minutes. After a set time, the steam is released and
biomass is quickly cooled down. The objective of a steam explosion is to solubilise
the hemicelluloses to make the celluloses easily accessible for enzymatic hydrolysis
and to avoid the formation of inhibitors.
2.4.2.1.2 Liquid Hot Water (LHW) Pretreatment
Hence pressure is utilized to maintain water in the liquid state at elevated
temperatures (Rogalinsiki et al., 2008). The objective of the LHW is to solubilise
mainly the hemicelluloses to make the cellulose better accessible and to avoid the
formation of inhibitors. To avoid the formation of inhibitors, the pH is kept between
4 and 7 during the pretreatment. At this pH, formation of monosaccharide are
minimized and the formation of degradation products that can further catalyze
hydrolysis of the cellulose material during pretreatment (Mosier et al., 2005).
2.4.2.1.3 Mechanical pretreatment
The mode of action is by milling (cutting the lignocellulosic biomass into smaller
pieces). The objective of a mechanical pretreatment is primarily to disrupt cellulose
crystallinity, decrease the degree of polymerization and increase the specific enzyme
surface area of cellulosic biomass by breaking down the biomass into smaller
particles, rending the substrate more amenable to subsequent enzymatic hydrolysis
(Zheng et al., 2009).

26
2.4.3 Chemical pretreatment
Chemical pretreatment include catalyzed steam explosion, acid pretreatment,
alkaline pretreatment, Ammonia fibre/freeze explosion, (AFEX), organ solvent, pH-
chemical pretreatment that have been studied to date with the primary goal of
improving the biodegradability of cellulose, by removing the lining and/or
hemicelluloses, and to a lesser degree decreasing the degree of polymerization (DP)
and crystallinity of the cellulose component (Sewalt et al., 1997).
2.4.3.1 Acid pretreatment
The pretreatment can be done with dilute or strong acids. The main objective is to
solubilise the hemicelluloses and by this, making the cellulose better accessible. The
main reaction that occurs during acid pretreatment is the hydrolysis of
hemicelluloses especially xylan as glucomannan, is relatively acid stable (Hu et al.,
2008).
2.4.3.2 Alkaline pretreatment
This is one of the major chemical pretreatment technologies receiving studies. It
employs various bases including sodium hydroxide, calcium hydroxide (lime),
potassium hydroxide (KOH), ammonia (NH3(aq)) and ammonium hydroxide
(NH3OH) in combination with hydrogen perioxide (H2O2) or other bases (Saha and
Cotta, 2007). Alkaline pretreatment is basically a delignification process in which a
significant amount of hemicelluloses is solubilised as well. The mechanism of
action is believed to be specification of intermolecular ester bonds, cross linking
Xylan hemicelluloses and other components, e.g. lignin and other hemicelluloses.
Alkaline pretreatment also removes acetyl and reduce various uronic acid
substitutions on hemicelluloses that reduce the accessibility of hemicelluloses and
cellulose enzyme (Chang and Holtzapple, 2000).
27
2.4.3.3 Ammonic fibre/freeze explosion (AFEX)
AFEX was developed to pretreat biomass with concentrated ammonia. It makes the
breakdown of cellulose more efficient. Using enzyme alone, about 15 percent of
cellulose is broken down into simple sugars but when AFEX is used before adding
enzymes, more than 90 present of the cellulose is broken down. In Ammonia Fibre
explosion, the biomass is exposed to hot liquid ammonia under high pressure for a
period of time, before the pressure is suddenly released. The swift reduction of
pressure opens up the structure of lignocelluloses biomass leading to increased
digestibility of biomass. AFEX pretreatment simultaneously delignifies and
solubilises some hemicelluloses while decrystallizing cellulose but does not
significantly remove hemicelluloses and acid catalysed steam explosion
pretreatment (Mes – Harte et al., 1988). Both micro and macro accessibilities of
cellulose to the cellulose are affected.
2.4.3.4 pH controlled liquid hot water.
During liquid hot water pretreatment, the pH value of contents in the reactors can
usually drop to below it, leading to the inhibitor formation due to the carbohydrate
degradation. In order to control pH value of the LHW between 5 and 7, some bases
such as KOH are usually added into LHW pretreatment process with its role to
maintaining the pH value not as catalyst in alkaline pretreatment. In this method,
the base differs in function from chemicals added as catalysts with its role of
maintaining the pH value constant above 5 and below 7 in order to minimize
hydrolysis to monosaccharide (Zheng et al., 2009).
2.4.3.5 Organosolv pretreatment
28
This is a delignification process with varying simultaneous hemicelluloses
solubilisation. In this process, an organic or aqueous organic solvent mixture with
or without acid or alkali catalyst is used to break the internal lignin and
hemicelluloses bonds. The organic solvents include ethylene glycol, triethylene
glycol, tetrahydrofarfuryl alcohol, glycerol, aqueous phenol and aqueous n-butanol.
The usual operation temperature of organsolv is in the range of 150oC– 200oC
(Zheng et al., 2009).
2.4.3.6 Biological pretreatment
This involves wood degrading microorganism including white – brown – soft rot
fungi and bacteria to modify the chemical composition or structure of hydro-
cellulose biomass (Zheng et al., 2009).
2.5 Trona (Potash): Occurrence and Composition
Trona- a sesquicarbonate has the formulae: Na2CO3-NaHCO3.2H2O or
Na3H(CO3)2.2H2O.The major natural evaporate deposits containing the alkali are
found in Owens lake, New Searle Lake, Kenya Lake, Califonia, Magad, Texaco,
Mexico, and Laqunillas. In Nigeria, trona is deposited along some minor lakes in
Borno State, Kano State, and Plateau State. The main constituents of trona are Na2
CO3, NaHCO3 and H2O. Upon analysis, trona was shown to contain 95% sodium
sesquicarbonate and insolubles – mainly dolomite, shale and clays.

29
Table 1: Constituents of Trona
Constituent Percentage
Na2CO3 45.11
Na2HCO3 35.85
H2O 15.32
NaCl 0.03
Fe2SO4 0.11
Na2SO4 0.01
Insoluble 3.75
Source: Okoro U.C, (2004).
The decomposition of trona at temperature above 1500C yields soda.
2Na2CO3, Na2HCO3, 2H2O ∆ 3Na2CO3 + CO2 + 3H2O
(above1500C)
2.6 Hydrolysis
This is a chemical reaction of a compound with water usually resulting in the
formation of one or more new compounds. The most common hydrolysis occurs
when a salt of a weak acid or weak base (or both) is dissolved in water. Water
ionizes into negatively hydroxyl ions (OH) and positive hydrogen ion(H+), which
becomes hydrated to form positive hydronium ions (H3O+). The salt breaks up into
positive and negative ions. For example, when sodium acetate is dissolved in water,
it readily dissociates into sodium and acetate ions. Because sodium hydroxide is a
strong base, the Na+ ions react only slightly with the hydroxyl ions already present
in the water to form sodium hydroxide molecules. Acetic acid is a weak acid, so the
acetate ions react readily with the H+ ions present in the water to form neutral acetic
acid molecules. The net result of these reactions is the relative excess of OH ions,

30
causing an alkaline solution. The addition of strong acids or bases or the use of
steam will often bring about hydrolysis where ordinary water has no effect (US
patent). Some industrially important hydrolytic reactions are the synthesis of alcohol
from olefins e.g. ethanol (CH3COOH), from ethane (CH2CH2) in the presence of a
strong catalyst, the conversion of starches to sugars in the presence of a strong acid
catalyst, and the conversion of animal fats or vegetable oil to glycerol and fatty acids
by reacting with steam. Hydrolysis is an important reaction in plants and animals.
The catalytic action of certain enzymes allows the hydrolysis of proteins, fats, oil
and carbohydrates. Hydrolysis can be classified into two groups: Chemical and
enzymatic hydrolysis.
2.6.1 Chemical Hydrolysis
This involves the exposure or the use of acid (eg HCL or H2SO4) to hydrolyze the
glucosidic bond -(1,4) and -(1,6) linkage that are binding the glucose unit of the
starch polymers; first to dextrins, maltose and finally to glucose (Onwueme, 1978).
2.6.2 Enzymatic Hydrolysis
This involves the use of enzymes (hydrolytic enzymes) that are specific for -1,4
and -,6 – glucosidic linkages that bound the large polymers of starch. Disbranching
enzymes are usually useful for complete hydrolysis of starch polymers to glucose
(starch monomers) during enzymatic hydrolysis. Nevertheless, some of the
hydrolytic enzymes produced by some organisms are capable of hydrolysing -
(1,6) glucosidic linkage which poses a major problem in the use of enzymes in
hydrolysis during biotechnological processes. For example glucoamylase from
Aspergillus niger is capable of hydrolysing the -(1,4) and-(1,6) glucosidic
linkage of cassava starch and other starch from different sources of glucose (Saykaka
31
et al., 2002). Some hydrolytic enzymes produced by microorganisms and their site
of action on starch are shown in the table below.
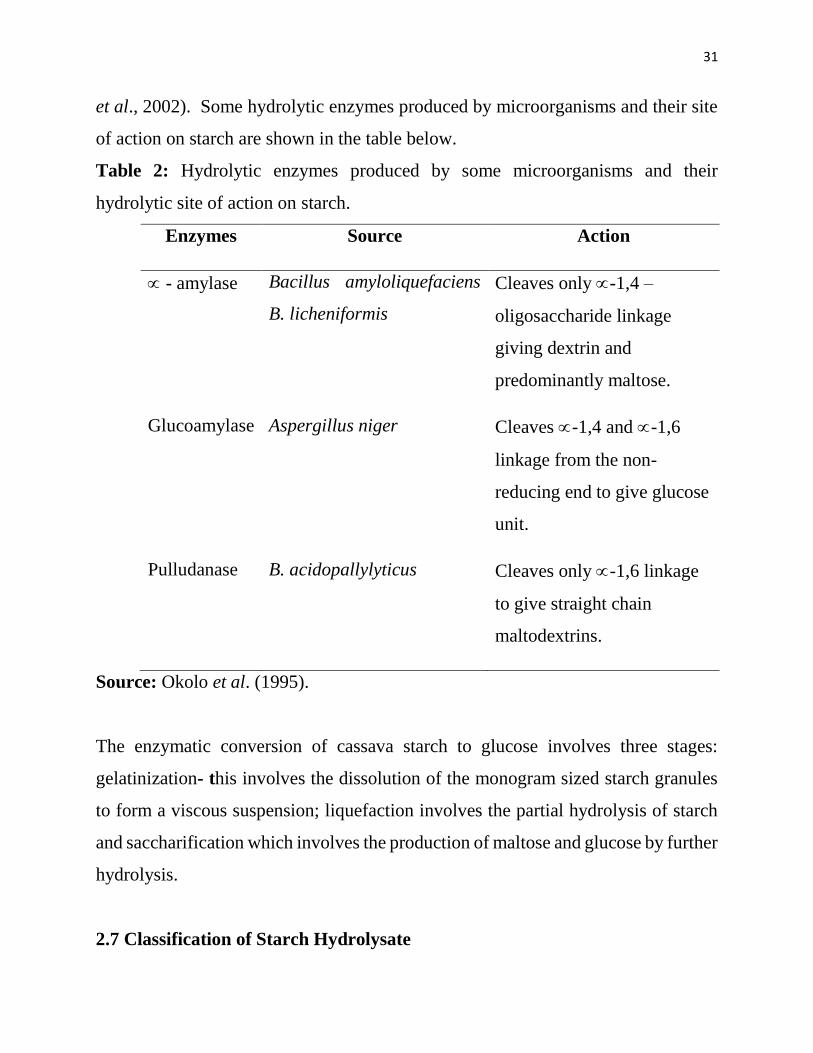
Table 2: Hydrolytic enzymes produced by some microorganisms and their
hydrolytic site of action on starch.
Enzymes Source Action
- amylase Bacillus amyloliquefaciens
B. licheniformis
Cleaves only -1,4 –
oligosaccharide linkage
giving dextrin and
predominantly maltose.
Glucoamylase Aspergillus niger Cleaves -1,4 and -1,6
linkage from the non-
reducing end to give glucose
unit.
Pulludanase B. acidopallylyticus Cleaves only -1,6 linkage
to give straight chain
maltodextrins.
Source: Okolo et al. (1995).
The enzymatic conversion of cassava starch to glucose involves three stages:
gelatinization- this involves the dissolution of the monogram sized starch granules
to form a viscous suspension; liquefaction involves the partial hydrolysis of starch
and saccharification which involves the production of maltose and glucose by further
hydrolysis.
2.7 Classification of Starch Hydrolysate

32
A very common method of classifying starch hydrolysate is to measure the degree
of hydrolysis in terms of Dextrose Equivalent (DE) which is a measure of the
reducing sugar content of the hydrolysate calculated as dextrose and expressed as a
percent of the total dry substance. The dextrose equivalent value a starch
hydrolysate is determined by the method of Smogyi, M described in the journal of
Biological chemistry (1945). Starch hydrolysis having a dextrose equivalent (DE)
value below 40 are generally considered low conversion products whereas those
having a DE value higher than 60 are considered high conversion products with
products having classified as regular or intermediate conversion products.
In addition to the above classification, starch hydrolysates are also characterized or
classified by the method used to accomplish the hydrolysis i.e. whether the
hydrolysates are converted by means of acids or enzymes. The acids and enzymes
which are satisfactory for this purpose are well known in the art. The properties or
characteristic of the starch hydrolysate depend upon the degree of conversion to
sugars as well as the means (acid or enzymes eat) employed for hydrolysis.
Generally speaking, high D.E starch hydrolysate products are preferred with respect
to fermentability, flavour enhancement, hydroscopicity and sweetening properties
whereas low D.E starch hydrolysate products exhibit higher viscosities and as are
preferred with respect to cohesive and foam stabilizing properties.
Low conversion starch hydrolysate products having dextrose equivalent values not
substantially above 18 are characterized by a unique polysaccharide composition,
good clarity and little tendency of retrogradation in solution. Methods for preparing
low conversion starch hydrolysate involve a two-stage hydrolysis; hydrolysis in the
first stage being carried out with acids or enzymes at elevated temperatures for short
periods to achieve liquefaction of the starch with very little dextrinization or
saccharification and the second stage of hydrolysis being carried out at the alkaline

33
pH with bacterial alpha-amylase to achieve a desired dextrose equivalent value
(Armbruster, 1971).
Starch is a naturally occurring polymer of α –D glucose connected by acetal linkages.
The acetal linkages are susceptible to both acid or enzyme hydrolysis and both
catalyst are employed in preparing starch hydrolysates.
The acid hydrolysis of starch has been shown to be a random process and at a given
time. An acid hydrolyzed starch product comprises a mixture of many different
molecular species which may range from the monomer glucose all the way up to
polymers approaching the size of starch. Because of the wide range of molecular
sizes obtained in acid hydrolysis, it is customary to conduct the conversion to an
extent that the long polymers will no longer react with iodine. Accordingly, acid
hydrolysis is not well suited for making low D.E products (Armbruster, 1971).
Although the degree of hydrolysis can be reduced to obtain low D.E products, the
long polymers present in such products result to rapid retrogradation with an
accompanying loss of solubility and clarity. Another disadvantage of hydrolyzing
starch with acid is that significant amounts of glucose are always present in the
products even when the degree of conversion is held to a low level. Because of the
presence of glucose and other low molecular weight saccharides, even low D.E acid-
hydrolyzed products tend to be hygroscopic, sticky, and provide a sweetening effect
which is desired for many applications.
The use of enzymes for hydrolyzing starch has gained widespread application in
recent years and enzymes are employed commercially for manufacturing certain
products. Enzymes have an advantage over acid catalysts in that they exhibit
specificity for certain linkage (Taherzadeh et al., 2007). One type of microbial
enzyme which is commonly employed is α -amylase. Alpha-amylase has the
property of splitting 1-4 linkages more or less at random throughout the starch
molecule with little effect on the 1-6 linkages. Moreover, α -amylase does not readily
34
hydrolyze or split the 1-4 linkage in maltose and maltotriose. Thus, it has been
reported that when substantially complete conversion of starch is effected with &-
amylase, maltose and small amounts of trisaccharides and other low molecular
weight polysaccharides especially those containing the 1-6 linkages, are present in
the final hydrolysate (Yu et al., 2004).
Another factor apart from acid or enzyme is the manner in which the starch is
gelatinized when heated in water. The molecules of native starch are closely bound
in the starch granule to a varying degree and those that are closely bound are not
particularly susceptible to the action of enzymes. It is not until the starch molecules
have been dispersed by swelling and gelatinization in water that significant
hydrolytic cleavage will take place (Armbruster, 1971). In a conversion procedure
where the starch is heated slowly the molecules which are closely bound are
dispersed or gelatinized more slowly and therefore are available for attack by the
acid or enzymes at a low rate. The result of this non-uniform rate of gelatinization is
that by the time that all of the resistant molecules have been made available for attack
the more easily dispersed molecules will already have been reduced to a relatively
small molecular range. However, when preparing a low D.E hydrolysate product,
the non-uniformity of gelatinization is particularly undesirable because a high
proportion of very large molecules including some intact starch molecules will still
be present when the desired low D.E. level is reached.
Another undesirable characteristic of low D.E. starch hydrolysate produced by
known methods, which is related to the non-uniformity of degradation, is the
tendency for certain of the large linear molecules to reassociate with other molecular
fragments of starch to form large relatively insoluble aggregates. The rate and extent
to which linear starch molecules reassociate into insoluble aggregates is a function
of chain length since below a certain length the aggregation tendency is not great.

35
The occurrence of reassociation in a liquid hydrolysate is evidenced by the
appearance of haze and or a change to a get or paste having poor solubility in cold
water. Although the reassociation or retro gradation of starch hydrolysis occurs
primarily in cooled hydrolysate where it is especially objectionable it may occur to
a slight extent during cooking process if the rate of heating is slow. When this
happens these molecular aggregates tend to remain intact during subsequent
processing and add to the difficulty of filtering the hydrolysate.
(United States patent 3663369. Hydrolysis of starch,www.freepatentsonline.
Com/3663369.html).
2.8 Bio-energy production
With increasing demand for energy, continuous depletion of the world fossil energy
reserves, instability in the global oil prices, and various environmental problems
such as climate change, global warming, soil, water and air pollution associated with
the use of fossil fuel, there is an increasing pressure, for development of renewable
and sustainable alternative sources of energies. The world fossil fuel reserves have
been estimated to last for less than 50 years from now and there is urgent need to
develop alternatives. The concept of “green development” vigorously pursued by
various countries and organization is promising. Bio energy (energy from biomass
materials) has very good potentials as a substitute for the fossil fuels because they
are renewable, sustainable and environmentally friendly. It was initially used as an
octane enhancer but since the oil-shock of the 1970s, bio-ethanol has been
commercially produced as liquid fuel for various engines. Most car engines can run
on gasohols (blends of gasoline and ethanol in various proportions) but some engines
that can run on 100% ethanol have been developed. The raw materials used for
production of bio-ethanol depend on the region/country. For example while most of
the bio-ethanol produced in Brazil is from sugar cane, in united states, most of the
36
bio-ethanol is produced from corn, India uses molasses, and sugar cane, some parts
of Europe use sugar beet, while china uses corn and cassava (Jansson et al., 2009).
There is a general concern that food crops should not be used for fuel production
because of its possible effects on food security. However, since the technology for
bio-ethanol production from non-food crops as the sub bio-ethanol production,
whether food crops or non-food crops are used, and the net results are that there will
be competition for farm land and agricultural input. Furthermore, the choice of the
crops will depend on the region and socio-economic conditions of the region. If our
fossil oil is exhausted, we will not have any alternative but to produce energy from
what we have.
2.9 Myths and Realities about Biofuels
The age of oil is ending. Even if we could afford to borrow over 51 billion per day
indefinitely to import oil, we just cannot afford the cost of our oil addiction in terms
of national security dangers, environmental damage and economic losses. Biofuels
are among a small handful of petroleum alternatives that can simultaneously provide
enhanced national security, environmental improvements and opportunities for
broad based economic growth.
Unfortunately, many myths and misconceptions exist about biofuels and these
include: (myth, 1) the “people are going to go hungry because of ethanol”,(myth, 2)
the “there is not enough land to produce enough ethanol anyway”,(myth, 3) the “it
takes more energy to make ethanol than you get from the ethanol”, (myth, 4) the
“ethanol will always be more costly than gasoline” myth.
All fuel ethanol is the same. It is made by fermentation of sugars. The sugars can
come from sugar cane (Brazil), or from corn grain (U.S.).“Second generation”
ethanol, called cellulosic ethanol, will be produced form the sugars in plant cell
walls. Cellulosic ethanol can be made from virtually anything that is or even was a
37
plant including: wood chips, urban waste, straw, crop wastes, hay and yard
trimmings, and on and on. We can even grow energy crops, trees (willow and
popular are promising species). Highly productive grasses such as switch grasses are
grown for their energy content and then converted to ethanol (Michigan State
University Alumni Magazine, winter 2008). Maybe a more picturesque and accurate
name for cellulosic ethanol is “grassoline”.

38
CHAPTER THREE
3.0 MATERIALS AND METHODS
3.1 Preparation of Cassava Starch
The cassava starch was prepared as shown in the flow diagram below:
Cassava root → peeled → washed well with clean water → cut into chips → sun
dried → milled into powder using GX200 Delmar machine. The powder was kept in
an air tighten container.
3.2 Microorganisms
The fungi isolate used (Aspergillus niger) was cultured for the production of amylase
enzyme. It was obtained from pure stock culture of Prof. J.C. Ogbonna, from the
department of microbiology, University of Nigeria, Nsukka. The Aspergillus niger
was used for starch hydrolysis while the yeast Saccharomyces cerevisiae used for
fermentation and for ethanol production was obtained from palm wine inoculated
into yeast peptone Glucose (YPG) agar slant prepared according to manufacturers
instruction. The yeast peptone Glucose agar suspension was then heated to get a
clear solution. This was followed by addition of 100mg of Chloramphenicol to the
medium shaked vigorously before dispensing into test tubes. Each test tube was
capped with cotton wool and covered with aluminium foils and autoclaved at one
hundred and twenty degree Celsius for 5 minutes. The content of each test tube was
poured into autoclavedpetri dishes which were then allowed to solidify. Afterwards
1ml of palm wine was introduced into 9 ml of distilled water and shaken vigorously
for proper mixing. The yeast cells formed from the agar slant were subcultured into
cooled agar broth. The mixture was incubated for 48 hours.
39
3.3 Preparation of Enzyme for Hydrolysis
A 223g of rice was steamed to cook and was allowed to cool. Then, 200g was
weighed out of the cooked rice and poured onto a sterile clean cloth. Then 10ml of
sterilized water was poured into the slant of Aspergillus niger and wire loop was
used to harvest (scup) the spores. The spore suspension was poured into the 200g
of cooked rice and mixed very well to ensure even distribution of spores in the rice.
The mixture was so wrapped and incubated for 24hours after which it was
thoroughly mixed again with a sterile spoon to ensure that the spores were well
distributed. It was wrapped again and left for another 24 hours.
Heavy production of black spores of Aspergillus niger was observed at the end of
3days. The wrapped clean cloth containing the production enzyme was then stored
in the refrigerator for hydrolysis.
3.4 Preparation of Yeast Cells
A broth of the Potato Dextrose Agar (3.9g of PDA in 100ml of distilled water)
containing 250mg of chloramphenicol was prepared in a 500ml conical flask and
autoclaved at 120oC for 15 minutes. The prepared broth was allowed to cool and
three loopful of the yeast from the slants that were subculture from the stock culture
of yeast cells were added using a wire loop and then incubated for 48 hours. The
medium was decanted, leaving the cells in the flask. The decantation was done only
when the cells are about to be used for fermentation.
3.5 Determination of Starch Content
A 1g of cassava flour was weighed, homogenized in 100ml of distilled water, boiled
for 30 minutes and allowed to cool. Then the volume was made up to 100ml with
40
distilled water and filtered. A 0.1ml of the filtrate was added in a test tube, mixed
with 0.5ml of K1-1, made up to 10ml with distilled water. The absorbance was taken
at 680nm. The percentage starch content was calculated by dividing the absorbance
value of 10g of starch solution with the slope from the standard curve.
3.6 Gelatinization of the Starch
Various quantities of cassava starch (5, 10, 15, 20, 25, 30g) were weighed into
different conical flasks and 100ml of distilled water added to each and mixed. These
flasks were allowed to stand in inside boiling water for the starch to form gel, the
flasks were vigorously shaken while heating The duration of heating was varied from
0 -20 minutes.
3.7 Pretreatment of Cassava Starch with potash.
Different grams of trona (akanwu) were added into five different flasks containing
10g of cassava starch each, mixed with 100ml of distilled water. The flasks were
shaked vigorously. The following measures (gram) of potash were used: 5.0, 7.5,
10.0, 12.5, and 15.0 and the treatment effects of potash on ethanol production were
noted.
3.8 Hydrolysis
A 10g of gelatinized starch was mixed with 40g of Koji (crude enzyme). The
pretreatment effect on cassava starch was checked during which the pH, duration of
gelatinization and inoculum size were varied. The variation was as followed:
10 grams of cassava starch was pretreated with the following quantities of potash:
5.0g, 7.5g, 10.0g, 12.5g, and 15g.
12.5g of potash was observed to be the best concentration. Then 12.5g of potash
mixed in 10g of starch was hydrolysed atpH of 3 and 4.

41
12.5g of potash in 10g of starch at pH 4 but with various durations of
gelatinization: 0, 5, 10, 15, 20.
12.5g of potash, 10g of starch, pH 4, 10 minutes gelatinization with various
inoculum sizes.
3.9 Fermentation
A 10g of the gelatinized starch (hydrolysate), potash and enzyme were incubated
with cells from the decantation of PDA broth prepared earlier. Samples were taken,
and the starch, glucose and ethanol concentrations determined at every 24 hours for
5 days at room temperature.
3.10 Determination of Starch Concentration
A 0.5ml of the sample was taken into test tube and then made up to 5ml with water.
0.5ml of iodine was added and finally made up to 10ml with water. The absorbance
was read at 680nm.
Concentration (%) = 1
100
slope
mean value
3.11 Determination of Glucose concentration
A 0.3 ml of the reaction sample was added to 0.3ml of dinitrosalicyclic acid (DNSA)
in a test tube. The test tube was allowed to stand in boiling water for 10 minutes. 3
ml of water was added, and the absorbance was read at 540nm.
Concentration (%) = 1
100
slope
mean value
3.12 Determination of Ethanol Concentration in Aqueous Solution

42
A 1ml of the sample from fermentation vessel was diluted with 1ml of distilled
water. Then, 10ml of acid dichromate solution was transferred into a 250ml conical
flask with matching rubber stopper and was stored overnight at 25-300C.
The flask was allowed to come to room temperature and the stopper was carefully
removed. The walls of the flask were rinsed with 100ml of distilled water, 1ml
potassium iodide solution added and mixed thoroughly. Three blank titrations were
prepared by adding 10ml of acid dichromate solution to conical flasks, 100ml of
water and 1ml of potassium iodide solution and swirled to mix. This served as
control. Sodium thiosulfate solution was filled into a burette for titration of each
flask. The titration continued until a colour change from brown to yellow was
observed. Then, 1ml of starch solution was added and titrated until the blue colour
disappeared. The volume of thiosulfate used to obtain the end point was recorded.
Concentration (%) = 1
100
slope
mean value
3.13 Determination of Enzyme Activities in Koji
3.13.1 Gluco-amylase Assay
The gluco-amylase assay was carried out by incubating a reaction mixture
containing 0.5ml of 1% soluble starch 0.2ml of 0.1M sodium acetate buffer (pH 5.6)
and 0.3 ml koji enzyme solution at room temperature for 30mins. This was done in
duplicate after which 1ml of DNSA was added to terminate the reaction, and the
mixture boiled for 10 minutes. After cooling, 4ml of distilled H2O was added and
absorbance taken at 540nm. Gluco-amylase activity is defined as the amount of
enzyme that releases one micromole of sugar in 1 minute under the assay condition.
3.13.2 Alpha () – Amylase Assay

43
This assay was carried out by incubating a reaction mixture containing 0.5ml of 1%
soluble starch, 0.2ml of 0.1M sodium acetate buffer (pH5.6) and 0.3ml koji enzyme
solution at room temperature for 30 minutes. This was done in duplicate. 1ml of
1M acetic acid was added to stop the reaction followed by addition of 8ml distilled
H2O and finally, 1 ml iodine solution and reading taken at 600nm. Alpha () –
amylase activity is defined as the amount of enzyme that degrades one micromole
of starch in 1 minute under the conditions of assay.
3.14 Statistical Analysis
The data in this study were subjected to one way analysis of variance
(ANOVA).Relationship between variables and comparison of the different
treatments were tested for level of significant difference at p<0.05 using Least
Significant Difference (LSD) and post hoc multiple comparison tests. The data
analysis was performed using software (Statistical Package for Social Science
(SPSS) version 20.0.

44
CHAPTER FOUR
4.0 RESULTS
4.1 Starch Content of Cassava Used in the Study.
The starch content obtained from the cassava starch used for the experiment was
32%. Theoretically the average content of starch in cassava fresh storage is 24% -
32% (Wang, 2002).The high yield of starch content in the experiment could result
to good yield of bioethanol and other end products.
4.2 Fermentation of Gelatinized Starch.
The ethanol yield was at its peak at 72 hours after incubation but declined
progressively. This was because about 70% of the substrate had been used up by the
enzymes, and in the production of inhibitors or by products. Maximum ethanol yield
obtained from fig 1 was 20.43%.
0
10
20
30
40
50
60
70
0 20 40 60 80 100 120 140
Star
ch,E
than
ol a
nd
Glu
cose
( %
)
Time(hrs)
Strach(g/L)
Ethanol(g/L)
Glucose(g/L)

45
Figure 1: Simultaneous hydrolysis and fermentation of cassava flour using
5% potash, 2.58x10⁶ cells of Saccharomyces cerevisiae, at pH 3 and
gelatinized for 10 minutes.
In fig 2, 7.5g of potash was used for the pretreatment of cassava starch prior to
enzymatic hydrolysis. This subsequently affected the energy conversion efficiency
of the starch by enzyme. From this graph, the ethanol concentration increased from
0.1% to 20% from the first day to the third day progressively attaining its peak on
the third day.
Figure 2: Simultaneous hydrolysis and fermentation of cassava flour using
7.5% potash, 2.58x10⁶ cells of Saccharomyces cerevisiae, at pH 3and gelatinized
for 10 minutes.
0
10
20
30
40
50
60
70
0 20 40 60 80 100 120 140
Star
ch,E
than
ol a
nd
Glu
cose
(%
)
Time (hrs)
Starch(g/l)
Ethanol(g/l)
Glucose(g/l)
46
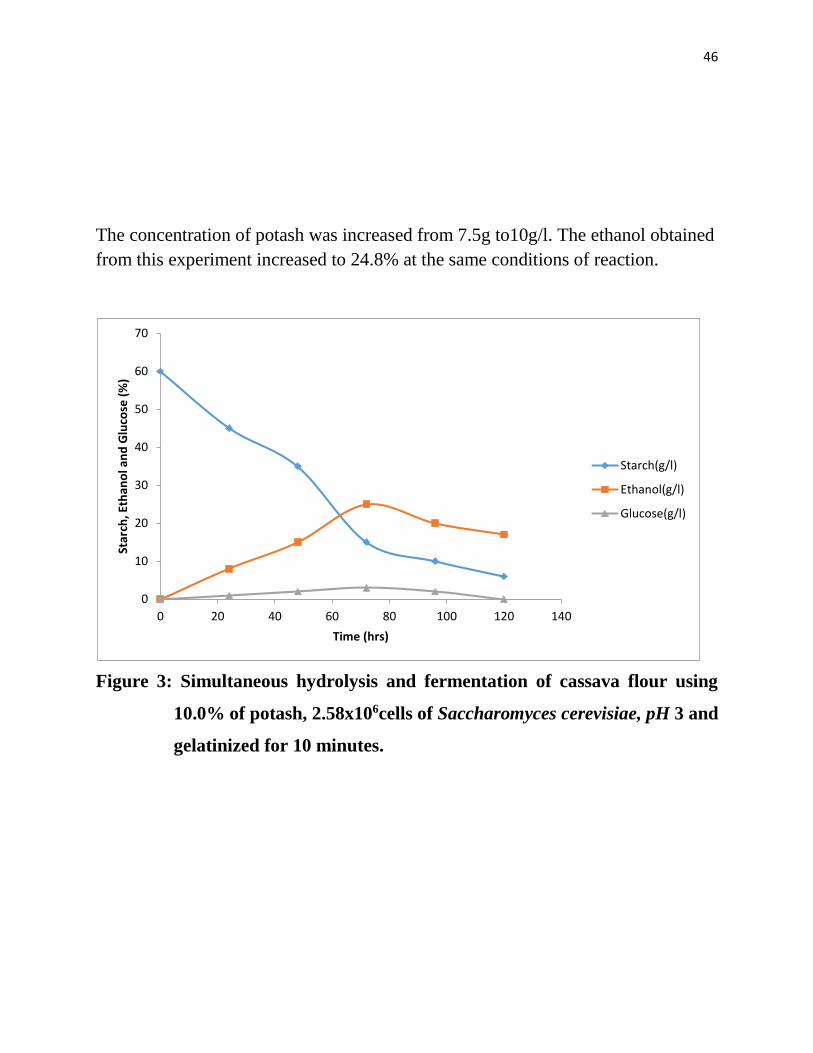
The concentration of potash was increased from 7.5g to10g/l. The ethanol obtained
from this experiment increased to 24.8% at the same conditions of reaction.
Figure 3: Simultaneous hydrolysis and fermentation of cassava flour using
10.0% of potash, 2.58x10⁶cells of Saccharomyces cerevisiae, pH 3 and
gelatinized for 10 minutes.
0
10
20
30
40
50
60
70
0 20 40 60 80 100 120 140
Star
ch, E
than
ol a
nd
Glu
cose
(%
)
Time (hrs)
Starch(g/l)
Ethanol(g/l)
Glucose(g/l)

47
As the starch concentration decreased, during the course of bioconversion of
substrate to product, the ethanol concentration increased, with the highest yield of
20.8% but decreased progressively with time.
Figure 4: Simultaneous hydrolysis and fermentation of cassava flour using
12.5% of potash with 2.58 x10⁶ cells of Saccharomyces cerevisiae, at
pH 3 and gelatinized for 10 minutes.
0
10
20
30
40
50
60
70
0 20 40 60 80 100 120 140
Star
ch, E
than
ol a
nd
Glu
cose
(%
)
Time (hrs)
Starch(g/l)
Ethanol(g/l)
Glucose(g/l)

48
During the fermentation process, it was observed that the ethanol yield increased
steadily, reaching its peak after 72 hours of fermentation and then declined
progressively as the residual sugar decreased with increase in time. The highest
ethanol obtained was 28.0% at the above mentioned reaction conditions.
Figure 5: Simultaneous hydrolysis and fermentation of cassava flour using 15%
of potash, 2.58x10⁶ cells of Saccharomyces cerevisiae, at pH 3 and
gelatinized for 10 minutes.
0
10
20
30
40
50
60
70
0 20 40 60 80 100 120 140
Star
ch,E
than
ol a
nd
Glu
cose
(%
)
Time(hrs)
Starch(g/l)
Ethanol(g/l)
Glucose(g/l)

49
During the simultaneous hydrolysis and fermentation of cassava flour, the quantity
ethanol increased with its peak of 28.0% at 96 hours instead of at 72 hours.
Figure 6: Simultaneous hydrolysis and fermentation of cassava flour using
12.5% of potash, 5.16 x10⁶ cells of Saccharomyces cerevisiae at pH 4
and gelatinized for 10 minutes.
0
10
20
30
40
50
60
0 20 40 60 80 100 120 140
Star
ch, E
than
ol a
nd
Glu
cose
(%)
Time(hrs)
Starch(g/l)
Ethanol(g/l)
Glucose(g/l)

50
As the fermentation process progressed, the highest ethanol concentration formed
ethanol concentration formed was 30.0% on the third day. On the fifth day, it
declined to the quantity close to that on the first day.
Figure 7: Simultaneous hydrolysis and fermentation of cassava flour suing
12.5% of potash, 3.87 x10⁶ cells of Saccharomyces cerevisiae, at pH 4
and gelatinized for 10 minutes.
0
10
20
30
40
50
60
0 20 40 60 80 100 120 140
Star
ch,E
than
ol a
nd
Glu
cose
(%)
Time(hrs)
Starch(g/l)
Ethanol(g/l)
Glucose(g/l)
51
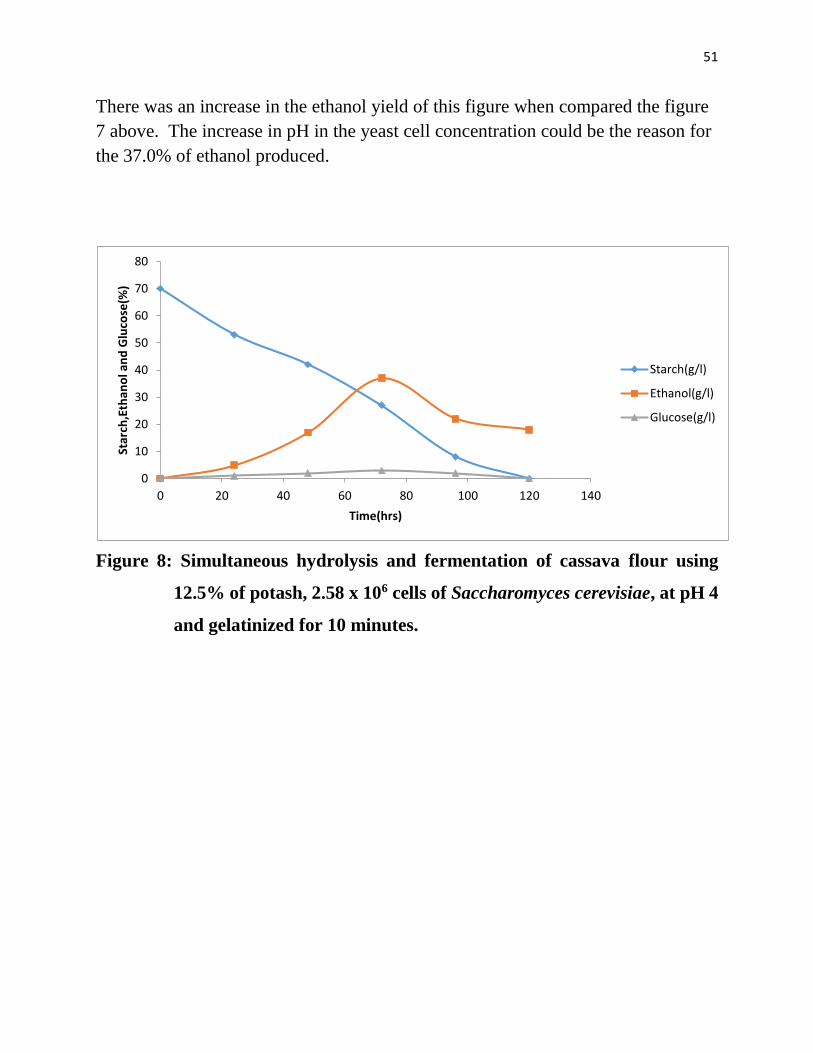
There was an increase in the ethanol yield of this figure when compared the figure
7 above. The increase in pH in the yeast cell concentration could be the reason for
the 37.0% of ethanol produced.
Figure 8: Simultaneous hydrolysis and fermentation of cassava flour using
12.5% of potash, 2.58 x 10⁶ cells of Saccharomyces cerevisiae, at pH 4
and gelatinized for 10 minutes.
0
10
20
30
40
50
60
70
80
0 20 40 60 80 100 120 140
Star
ch,E
than
ol a
nd
Glu
cose
(%)
Time(hrs)
Starch(g/l)
Ethanol(g/l)
Glucose(g/l)
52
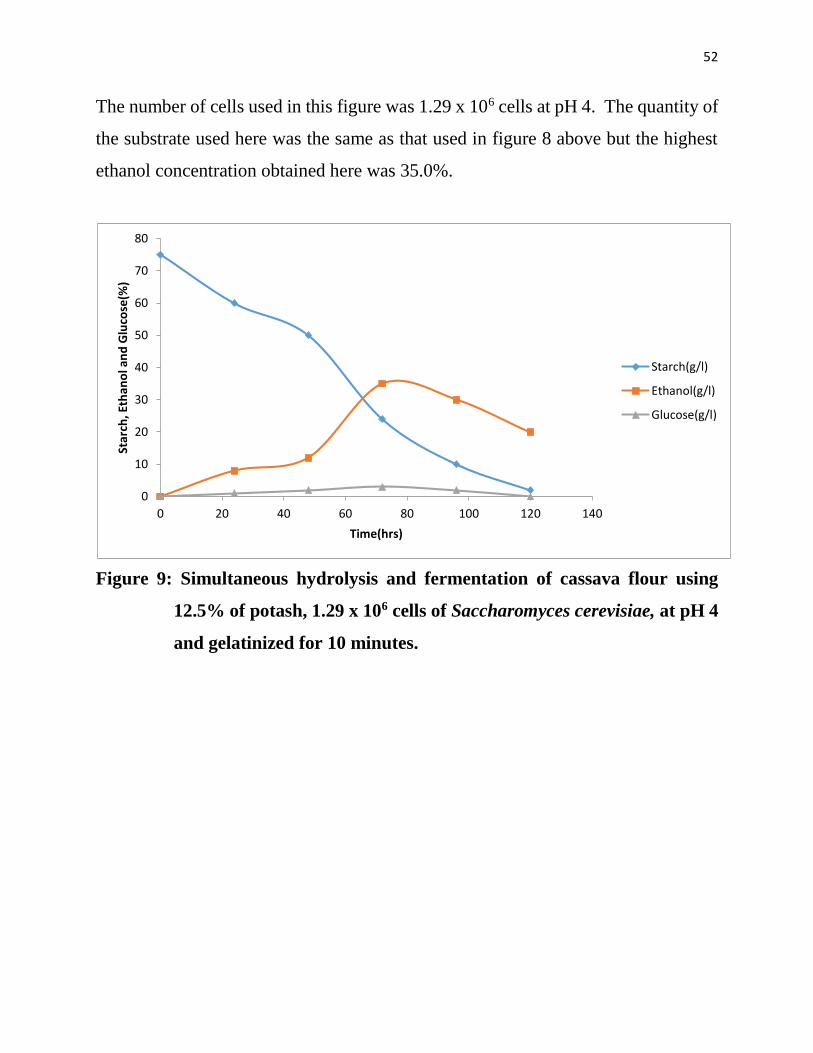
The number of cells used in this figure was 1.29 x 10⁶ cells at pH 4. The quantity of
the substrate used here was the same as that used in figure 8 above but the highest
ethanol concentration obtained here was 35.0%.
Figure 9: Simultaneous hydrolysis and fermentation of cassava flour using
12.5% of potash, 1.29 x 10⁶ cells of Saccharomyces cerevisiae, at pH 4
and gelatinized for 10 minutes.
0
10
20
30
40
50
60
70
80
0 20 40 60 80 100 120 140
Star
ch, E
than
ol a
nd
Glu
cose
(%)
Time(hrs)
Starch(g/l)
Ethanol(g/l)
Glucose(g/l)

53
In order to determine the pretreatment effect of potash and provide adequate sugar
release in fermentation broth, fig. 10 experiment was done in comparison with
fig.8. The maximum ethanol yield gotten from fig. 8 was 30.0% while in figure
10; 25.0 % of ethanol was formed.
Figure 10: Simultaneous hydrolysis and fermentation of cassava flour using no
potash, 2.58 x10⁶ cells of Saccharomyces cererisiaeat pH 4 and
gelatinized for 10 minutes (control).
0
10
20
30
40
50
60
70
0 20 40 60 80 100 120 140
Star
ch,E
than
ol a
nd
Glu
cose
(%
)
Time(g/l)
Starch(g/l)
Ethanol(g/l)
Glucose(g/l)

54
The increase of ethanol yield as the fermentation time increased was little with its
maximum of 12.0%. The residual sugar bioconversion to ethanol was not efficient.
Figure 11: Simultaneous hydrolysis and fermentation of cassava flour using
12.5% of potash, 3.87 x 10⁶ cells of Saccharomyces cervisiae, at pH 4
and gelatinized for 20 minutes.
0
10
20
30
40
50
60
70
80
0 20 40 60 80 100 120 140
Star
ch,E
than
ol a
nd
Glu
cose
(%)
Time(hrs)
Starch(g/l)
Ethanol(g/l)
Glucose(g/l)
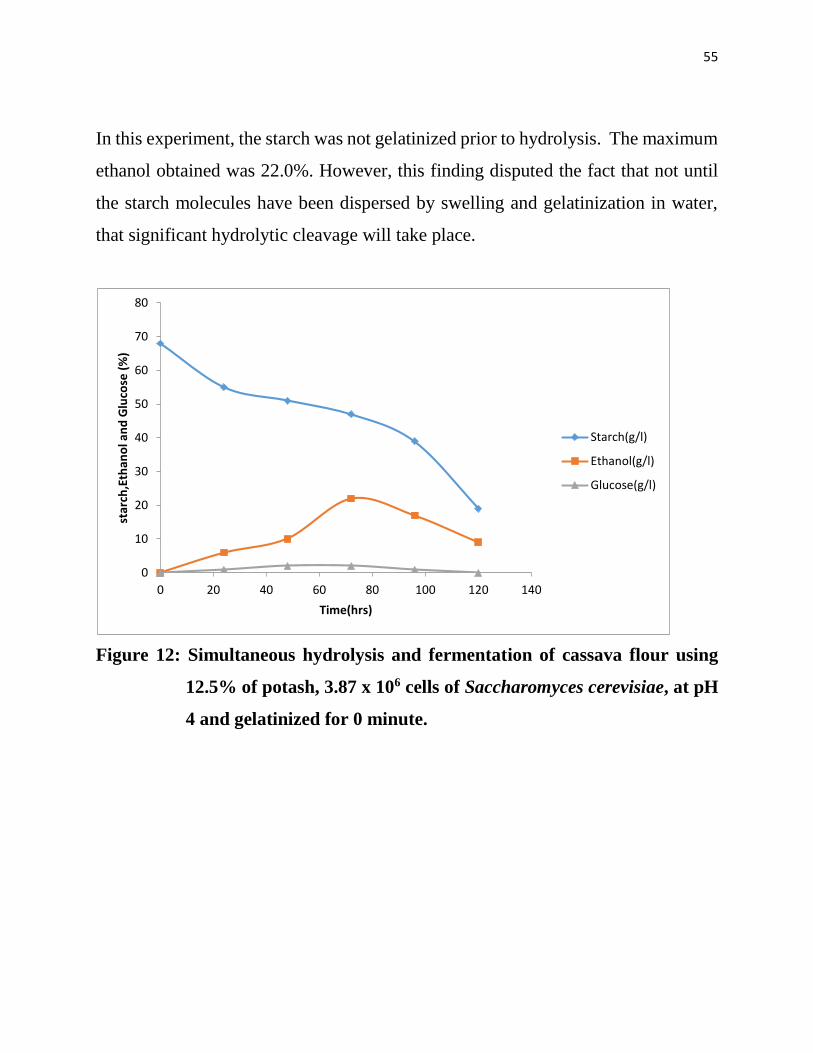
55
In this experiment, the starch was not gelatinized prior to hydrolysis. The maximum
ethanol obtained was 22.0%. However, this finding disputed the fact that not until
the starch molecules have been dispersed by swelling and gelatinization in water,
that significant hydrolytic cleavage will take place.
Figure 12: Simultaneous hydrolysis and fermentation of cassava flour using
12.5% of potash, 3.87 x 10⁶ cells of Saccharomyces cerevisiae, at pH
4 and gelatinized for 0 minute.
0
10
20
30
40
50
60
70
80
0 20 40 60 80 100 120 140
star
ch,E
than
ol a
nd
Glu
cose
(%
)
Time(hrs)
Starch(g/l)
Ethanol(g/l)
Glucose(g/l)
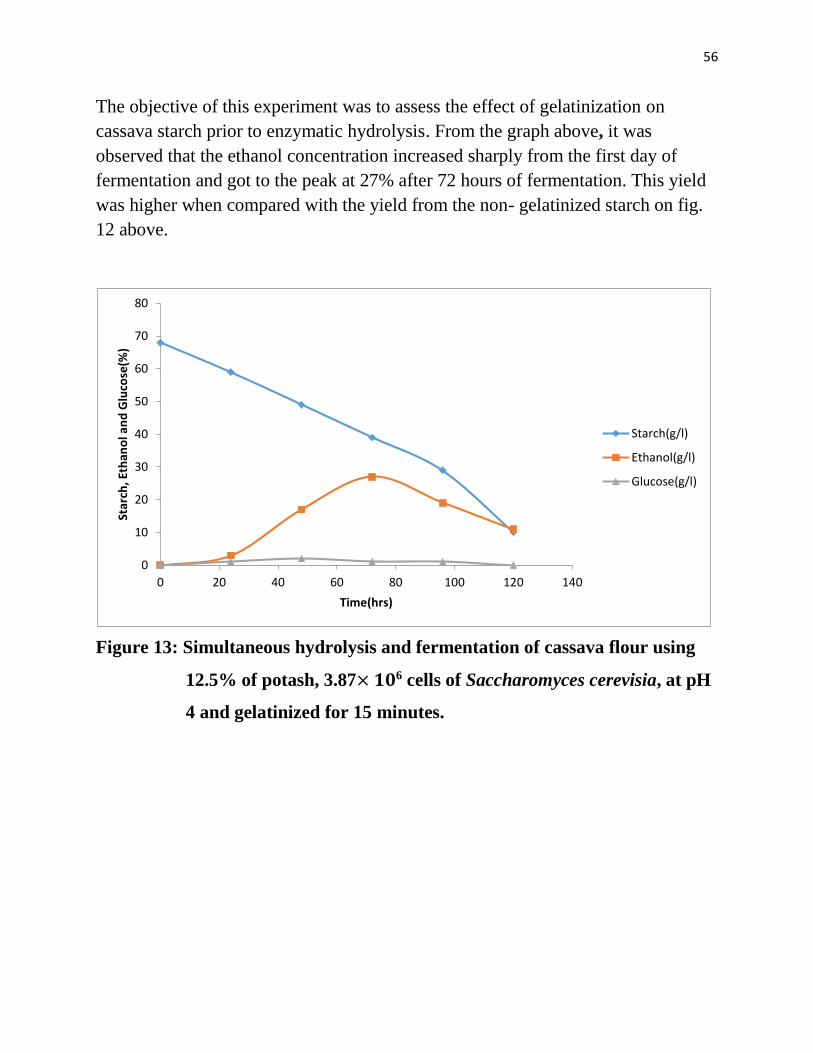
56
The objective of this experiment was to assess the effect of gelatinization on
cassava starch prior to enzymatic hydrolysis. From the graph above, it was
observed that the ethanol concentration increased sharply from the first day of
fermentation and got to the peak at 27% after 72 hours of fermentation. This yield
was higher when compared with the yield from the non- gelatinized starch on fig.
12 above.
Figure 13: Simultaneous hydrolysis and fermentation of cassava flour using
12.5% of potash, 3.87× 𝟏𝟎6 cells of Saccharomyces cerevisia, at pH
4 and gelatinized for 15 minutes.
0
10
20
30
40
50
60
70
80
0 20 40 60 80 100 120 140
Star
ch, E
than
ol a
nd
Glu
cose
(%)
Time(hrs)
Starch(g/l)
Ethanol(g/l)
Glucose(g/l)
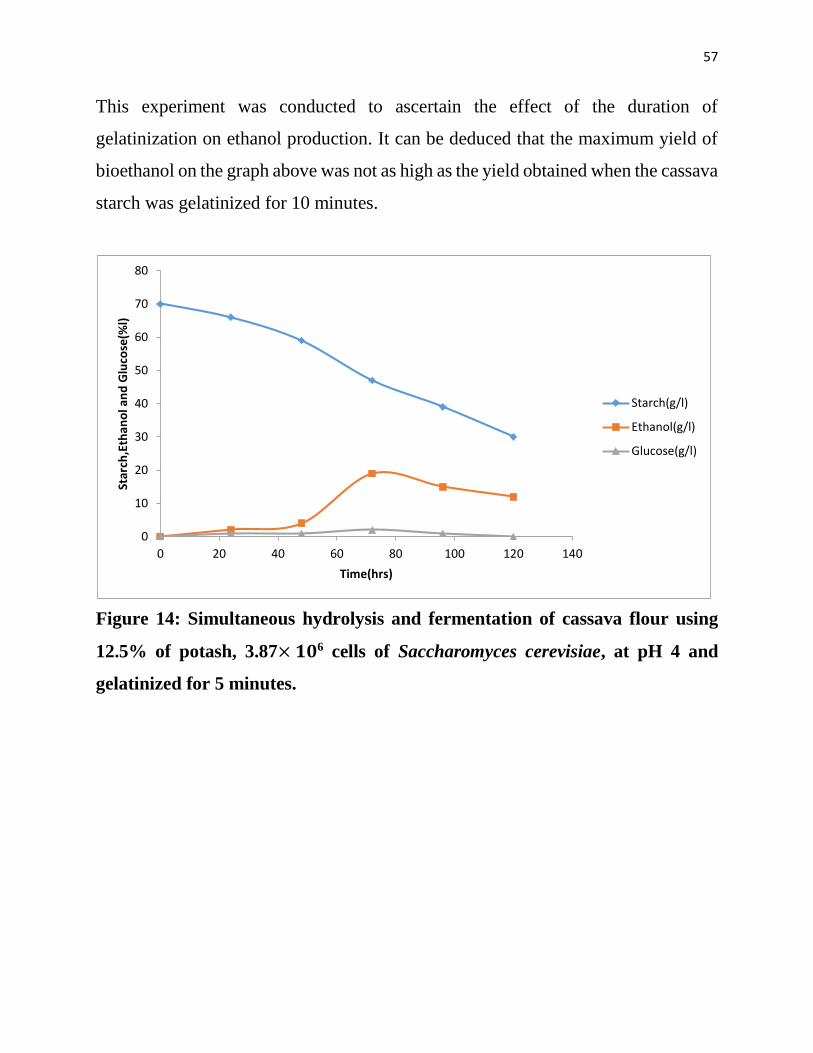
57
This experiment was conducted to ascertain the effect of the duration of
gelatinization on ethanol production. It can be deduced that the maximum yield of
bioethanol on the graph above was not as high as the yield obtained when the cassava
starch was gelatinized for 10 minutes.
Figure 14: Simultaneous hydrolysis and fermentation of cassava flour using
12.5% of potash, 3.87× 𝟏𝟎6 cells of Saccharomyces cerevisiae, at pH 4 and
gelatinized for 5 minutes.
0
10
20
30
40
50
60
70
80
0 20 40 60 80 100 120 140
Star
ch,E
than
ol a
nd
Glu
cose
(%l)
Time(hrs)
Starch(g/l)
Ethanol(g/l)
Glucose(g/l)

58
Gluco – amylase enzyme had its highest activity on the 4th day of the assay. The
gluco-amylase from Aspergillusniger was assayed for six days. This was to
determine the rate of its activity on hydrolysing the glucosidic linkage of cassava
starch to liberate glucose unit. The first day represented the zero hour of the
incubation of Aspergillus niger. The enzyme expressed was 109mg/ml/day. The rate
of the enzyme activity increased with time, with its peak of 800mg/ml/day obtained
on the fourth day of the assay.
Figure 15: The rate of gluco-amylase activities on starch during fermentation.
0
100
200
300
400
500
600
700
800
900
1 2 3 4 5 6
Days
Glu
co
-am
yla
se A
cti
vit
y(m
g/m
l/m
in
& u
g/m
l/m
in)
glucoe(mg/ml/min)
glucose(ug/ml/min)
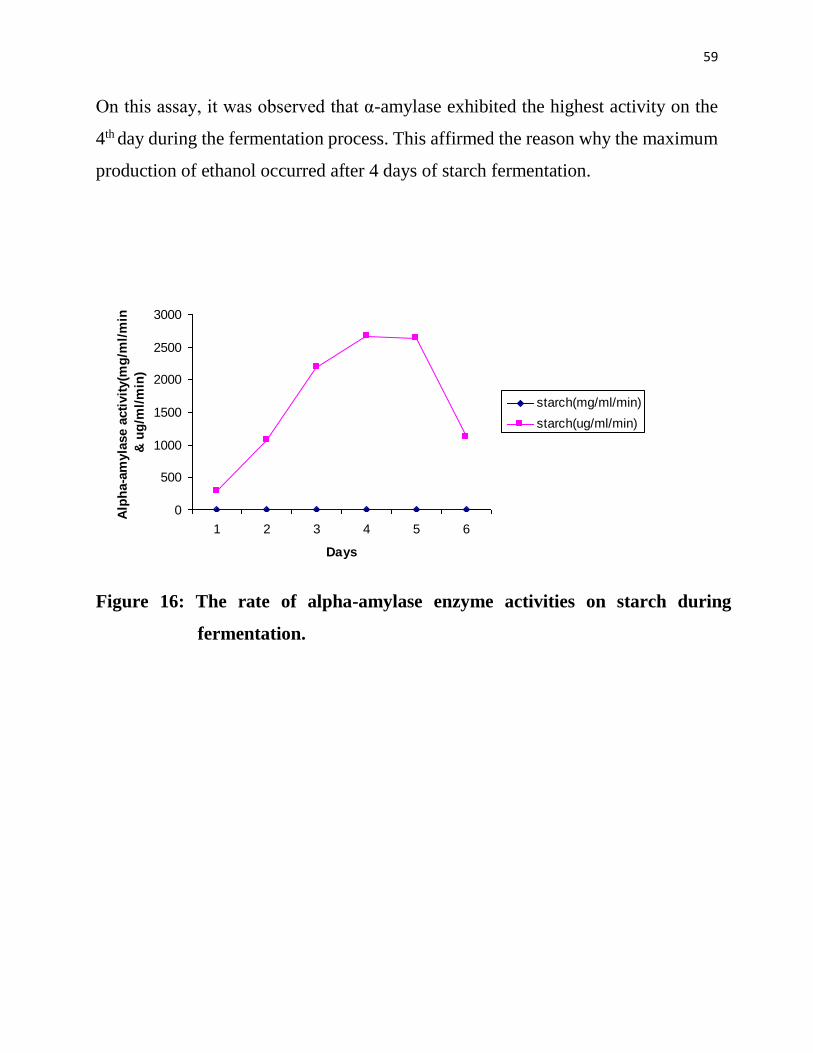
59
On this assay, it was observed that α-amylase exhibited the highest activity on the
4th day during the fermentation process. This affirmed the reason why the maximum
production of ethanol occurred after 4 days of starch fermentation.
Figure 16: The rate of alpha-amylase enzyme activities on starch during
fermentation.
0
500
1000
1500
2000
2500
3000
1 2 3 4 5 6
Days
Alp
ha-a
myla
se a
cti
vit
y(m
g/m
l/m
in
& u
g/m
l/m
in)
starch(mg/ml/min)
starch(ug/ml/min)

60
Table 1: Determination of cell concentration
Samples of palm wine were assed to determine cell population at different days. The
results were determined through cell count using haemocytometer. P1 – P4 are
different samples of palm wine. It can be noted that cell density of various sample
increased initially but decreased after some days. This experiment was done to
determine which sample of palm wine was to be used in fermenting glucose to
ethanol. Sample p4 of the palm wine was used to isolate the Saccharomycete
cerevisiae used for fermentation.
P 1 P 2 P 3 P 4
Day 1 1.48 × 10⁷ 1.48 × 10⁷ 1.48 1.48 × 10⁷
Day 2 1.58× 10⁷ 2.1 × 10⁷ 1.98 1.7× 10⁷
Day 3 1.85× 10⁷ 2.45× 10⁷ 2.1× 10⁷ 2.1× 10⁷
Day 4 1.64× 10⁷ 1.64× 10⁷ 1.3× 10⁷ 1.17× 10⁷
Day 5 1.35× 10⁶ 1.50× 10⁶ 0.4× 10⁶ 0.95× 10⁶
61
CHAPTER FIVE
5.1 DISCUSSION
Ethanol production from wastes and food crops can be enhanced by pretreatment of
substrate prior to hydrolysis and subsequent fermentation. During the course of this
research, it was observed that pH, potash concentration, enzyme concentration and
duration of gelatinization play important role in optimization of bioethanol yield.
The sugar that was produced at various time courses during starch hydrolysis by
fungal enzyme was used for growth by yeast cells and the rest was detected as
reducing sugar liberated(Bandaru et al., 2006). The volume of reducing sugar
detected was always small because of the short time lag between its liberation and
conversion to alcohol. The results showed that the highest alcohol was usually
obtained on day 3 of fermentation and it sharply declined until the ethanol yield
equals the yield on days 1 and 2 in the fermentation process. This could be because
enzymes fed initially on the substrate as their carbon source and as well had to adapt
to the reaction condition. This usually happened on the first 48 hours, before the
conversion of the residual sugar to ethanol. Ethanol yield tends to decline after 72
hours of fermentation as most of the simple sugars have been converted to bioethanol
and other by-products.
The enzymatic activities on starch at pH ranging from 1 to 5 were tested and the
best pH was 4. Deviation from this either left or right decreases the yield of ethanol.
This is because enzymes are protein in nature and are denatured and deactivated by
abnormal acidity or alkalinity of the reaction mixture. Various potash concentrations
used for the pretreatment of cassava starch were 5.0%, 7.5%, 10.0%, 12.5% and
15.0%. Pretreatment of cassava with alkaline substance before hydrolysis solubilizes
the starch, increases the surface area and as well makes the substrate easily
accessible by enzymes (Zheng et al., 2009).

62
The comparison of the quantity of ethanol produced when the cassava starch was
pretreated with 5.0g and 7.5g showed no significant difference.
When the potash concentration used to pretreat cassava starch was increase to 10g,
12.5g, 15.0g and 20.0g there were significant differences in bioethanol production.
The statistical analysis of the result showed significant difference
Upon analysis, it was observed that 12.5% of potash used gave a significant yield
of ethanol when compared with other concentrations of potash and the control
experiment. However, it was also observed that the pH equilibrium of the reaction
medium shifted to the right when potash was added but acetate buffer was added to
maintain a balance between enzymes activity and bioethanol production (Bandaru et
al., 2006). This discussion may indicate that alkaline pretreatment is an important
factor in digestibility of lignocellulosis. However, it is not the only factor in effective
enzymatic hydrolysis of biomass due to the heterogeneous nature of cellulose and
the contribution of other factors.
The molecules of native starch are closely bound in the starch granule to a varying
degree and those that are closely bound are not particularly susceptible to the action
of enzymes. Starch granules swell and burst, the semi-crystalline structure is lost and
the smaller amylase molecules leaching out of the granules, forming a network that
holds water and increasing the mixture viscosity. It is not until the starch molecules
have been dispersed by swelling and gelatinization in water that significant
hydrolytic cleavage will take place. The objective of steaming is to solubilize the
hemicelluloses, to make the cellulose easily accessible for enzymatic hydrolysis and
to avoid the formation of inhibitors (Chandra et al., 2006). In a conversion procedure
where the starch is heated slowly, the molecules which are closely bound are
dispersed or gelatinized more slowly and therefore are available for attack by acid
or enzyme at a low rate. The result of this non-uniform rate of gelatinization is that
by the time all of the resistant molecules have been made available for attack; the

63
more easily dispersed ones have already been reduced to a relatively small molecular
range. The duration of gelatinization was varied at 0-20 minutes. The values of
ethanol concentration produced were statistically tested. Among the intervals of time
of gelatination tested, there were significant difference at (p<0.05). The reason for
this could be that too much heating results in disorganization of the starch structure
and as well as the reduction of water activity required by enzymes. Enzymes used
for the experiment when assayed gave the activity of 2.413mg/ml/min which is
significantly high when compared with the theoretical enzyme assay. More also, the
effect of yeast cell concentration in optimizing the bioconversion of simple sugars
to alcohol was also determined. Enzyme concentration was varied. All these
parameters discussed were equally varied with different concentrations of cassava
starch and the best results from each testing factor are pulled together. The starch
content used for experiment is 32 percent. This result is in accordance with (Wang
et al., 2002).
Under these conditions of optimization of fermentation process for the production
of bioethanol from pretreated cassava starch, the maximum yield was 37.32%. Also
statistical analysis of the results obtained affirmed that there are significant
differences between the optimum conditions: pH 4, potash concentration of 12.5
percent, fermentation periods of 72h, duration of gelatinization of 10 minutes,
enzyme concentration of 2.58 x 10⁶ cells and others, with maximum ethanol
concentration occurring at the optimum conditions. In comparison, acid hydrolysis
of waste cotton using 0.2 mol H2SO4 produced 14.2g/l (Yu and Zang, 2004), which
is less efficient than alkaline hydrolysis.
5.2 Conclusion
In conclusion therefore, alkaline pretreatment of cassava or any other fermentable
starch for ethanol production is recommendable, since bioenergy has very good

64
potential as a sustainable source. It is relatively cheap, readily available and also
environmentally friendly. Bioethanol is now the most important renewable fuel in
terms of volume and market value (Lincht, 2006).
65
REFERENCES
Abouzeid, M and Steinkraus, K. H (1983). Some factors affecting rapid ethanol
production. Sound of Agricultural Research. 7: 245 – 249.
Abouzeid, M.M. and Reddy, A. (1986). Direct fermentation of potato starch to
ethanol by co-cultures of Aspergillus niger and Saccharmyces cerevisae.
Journal of Applied and Environmental Microbiology, 52: 1055-1059.
Adelekan, B.A. (2008). Investigation of ethanol productivity of cassava crop as a
sustainable source of biofuel in tropical countries. African journal of
Biotechnology, 9 No 35.
Adeniran, A.H. and Abiose, S. H. (2009). Amylolytic potentiality of fungi isolated
from some Nigerian Agricultural wastes. African Journal of Biotechnology,
8:667 – 672.
Adesanya, O. A. (2008). Ethanol production of Saccharomycetes Cerevisiae from
peels hydrolysate. The Internet Journal of Microbiology, 5, No 1.
Ado, S.A., Kachalla, G.U., Tijani, M.B and Aliju, M.S. (2009). Ethanol production
from corn cobs by co-cultures of Saccharomyces cerevisiae and Aspergillus
niger. Bayero Journal of Pure and Applied Science, 2 (2): 99-101.
Anne-Charlotte, E. (2004). Starch in food; structure, function and application. ISBN
978 – 0 – 8493 – 2555 – 7.
Bailey and Olis. (1986). Determination of starch content. www.nuffiedfoundaion.
Balat, M. and Cahide, O.Z. (2009). Journal of polymers and the environment, 259-
266.
Brown, W. H. and Poon,T. (2005). Introduction to organic Chemistry. (3rd Ed.).
Wiley 471 – 473.
Chang, V. and Holtzapple, M. (2000). Fundamental factors affecting biomass
enzymatic activity. Applied Biochemistry and Biotechnology. 84: 5 – 37.

66
Chandra, R. P., Mabee, W. E., Berlin, A. and Pan X. (2000). Stuck on starch: a new
wood adhesive. US department of Agriculture.
Chandra, R. P.,Bura, R., Mabee, W. E., Berlin, A. and Pan X. (2006). Substrate
pretreatment; the key to effective enzymatic hydrolysis of lignocellulosics.
Advanced Biochemistry/Biotechnology, 108: 67 – 93.
Chen, H.Y and Han, X.U. (2008). Simultaneous Saccharification and fermentation
of steam exploded wheat and straw pretreated with alkaline peroxide. 43:
1462 – 1466.
Codex Alimentarius (2001). Modifiedstarches. Volume 9.52.
Demirbas, A. (2005). Bioethanol from cellulosic materials: a renewable motor fuel
from Biomass, 27(4): 327-337.
Demoraes,L. M. P., Filho, S. A. and Uchoa, C. J. (1999). Purification and some
properties of α – amylase and glucoamylase fusion protein from
Saccharomyces. World Journal of Microbiology/Biotechnology, 561 – 564.
Ebrahim, F. Khanahmadi, M., Roodpeyma, S. and Taherzadeh, M. J. (2008). Ethanol
production from bread residues. Biomass Bioenergy, 32: 333- 337.
Hguyen, T. L., Gheewala, S.H. and Gravait, S. (2007). Fuel chain energy analysis of
fuel ethanol from cassava in Thailand. 41: 4135 – 4142.
Ezeonu, I.M., Okafor, S. I., and Ogbonna, J. C. (2011). Laboratory exercise in
Microbiology. 1st Edition Pg 35.
Grethlein, J.M, Fan, E.O. and freer, S.N. (1984). High efficiency ethanol production
from lignocellulosic residues pretreated with alkaline hydrogen peroxide.
Biotechnology and Bioenergy, 26: 628-631.
Gutshe, G. D.(1975). Fundamentals of organic chemistry. Prentice – Hall
international New York pg 1060.
Hu, G., Heitmann, J.A. and Rojas, O.J. (2008). Feed stock pretreatment strategies.
Journal of Bioresources, 3(1): 270-294.

67
Kim, D. and Holtzapple, M. (2006). Effect of various pretreatment on cellulose
hydrolysis. Bioresource Technology, 99(7): 2278.
Lincht, F. O. (2006). World ethanol Markets; the outlook to 2015. Agro Europe
Special Report. Tunbridge Wells, 2:1 -3.
Mes-Hartee, M., Dale, B.E. and Gaij, W.K. (1988). Comparison of stream and
Ammonia pretreatment of enzymatic hydrolysis of cellulose. Applied
Microbiology/Biotechnology, 29:462 – 468.
Miller, G.L. (1959). Use of dinitrosalicyclic acid reagent for determination of
reducing sugar. Analytical Chemistry, 31:426-428.
Mohammed, J., Taherzadoh, M.J. and Keikhosro, K. (2007). Enzymatic –based
hydrolysis processes for ethanol from lignocellulosic materials: A Review, 2:
707-738.
Mohammed, J., Taherzadoh, M.J. and Keikhosro, K. (2008). Pretreatment of
lignocellulosic waste to improve ethanol and biogas production.
Mosier, N., Nywan, C., Dale, B., Lee,Y., Holtzaple, M. and Ladisch, M. (2005).
Features of promising Technologies for pretreatment of lignocellulosic
biomass. Bioresources Technology, 96:673-686.
Ogbonna, J.C. andOgbonna,C.N.(2005). Lecture notes on Industrial Biotechnology:
Fundamentals of Microbial cell cultivation. p 26.
Okoro,B.N., Ezeogu, L.T, and Mba, C.N.(1995). Production of raw starch digesting
Amylases: Aspergillus niger and Bacillus alvei grown on native starch
sources. Food Agriculture, 69:109-105.
Okoro,U.C.(2004). Manual of Basic Chemistry Practical. UCO-Academic
Publishers, Nigeria Ltd. 5:23.
Onwueme,I.C. (1978).The tropical tuber crops: Yam, cassava, sweet potato and
cocoyam. Wiley New York. 210 -215.
Ophardt,C.(2008). Sweeteners-introduction. HFCS: How Sweet it is. 12-13.

68
Revedin, A.,Aranguren,B.Becattini,R., Longo,L. and Marconi, E. (2010). American
coalition for ethanol, ethanol facilities. 107: 18815-18819.
Rogalinsiki, T., Inyam, T. and Brunner,G.T. (2008). Hydrolysis of lignocellulosic
biomass in water under elevated temperatures and pressure. Journal of
supercritical fluids. 47:54-64.
Rusell-Web. (2007). Spray powder produced from starch. Internet material from
Wikipedia. 1-2.
Saha,B. C and Cotta, M.A. (2007). Enzymatic saccharification and fermentation of
alkaline peroxide pretreated rice hulls to ethanol. 41:528-532.
Sayikaya,E., Hagasa, T.,Adachi,M and Mikami, B.(2002). Comparison of
degradation abilities of α and β -amylase on raw starch granule. Journal of
Biochemistry, 35:711-715.
Sewalt, V.J., Glasses, W.G. and Beauchemin, K.A. (1997). Lignin impact on Sewalt,
V.J., Glasses, W.G. and Beauchemin, K.A. (1997). Lignin impact on
enzymatic hydrolysis by chemical modification of lignin and by additives.
Journal of Agricultural and Food Chemistry, 45: 1823-1828.
Song, A., Pei,G., Wang, F., Yan,D and Feng, C. (2008).Exploration on the
diversified materials for fuel ethanol production in China. Transaction of
Chinese Society of Agric Engineering, 24(3):302-307.
Taherzadeh, M.J. and Karimi, K.(2007).Enzymatic process for ethanol production
from lignocellulosic materials: A review. Journal of Bioresources. 2: 472-
499.
Wang,W.(2002).Cassava production for industrial utilization in China –present and
future perspective. Seventh regional cassava workshop, Bangkok, Thailand.
Vol. 1: 33-38. White, J. S. (2008). High fructose corn syrup (HFCS). How
sweet it is.
White, J. S. (2008). High fructose corn syrup (HFCS). How sweet it
is.(www.nuffieldfoundation.org). Determination of Glucose concentration.
(www.outreach.Canterbury.ac.nz). Determination of ethanol concentration in
aqueous solutions. Pg.1-3.

69
Yu,Z and Zhang,R.H.(2004).Ethanol Fermentation of acid hydrolyzed cellulosic
hydrolysate with Saccharomyces cerevisiae. Bioresources Technology,
93:199-204.
Zhang, R.H., Evans, B.R., Mielenz, J.R., Hopkins, R.C. and Adams,
M.W.(2007).Overview of biomass pretreatment for cellulosic ethanol
production. International Journal of Agric and Biological Engineering,
2(3):51-68.

70
APPENDIX
REAGENTS AND MEDIA COMPOSITION
Potato Dextrose Agar (PDA) medium.
Yeast Peptone Glucose (YPG).
Nutrient Broth.
Yeast peptone Glucose broth (YPG).
Dinitro salicylic acid (DNSA) reagent.
Sodium acetate buffer.
Acid dichromate solution (0.01mol L-1): Add 125ml of water to a 500ml conical
flask. Carefully add 70ml of concentrated sulphuric acid with constant swirling.
Cool flask under cold tap water and add 0.75g of potassium dichromate. Dilute to
250ml with distilled water.
Starch Indicator Solution(1.00/0 solute ion): Dissolve 1.0g of soluble starch in 100ml
of recently boiled water, Stir until it dissolves.
Sodium thiosulphate solution (0.03mol -1): Add 7.44g of Na2 S2O3.5H2O to a 1 litre
volumetric flask. Dissolve in distilled water and dilute up to the mark.
Potash Iodide Solution (1.2molL-1): Dissolve 5g of potassium iodide (KI) in 25ml of
water.
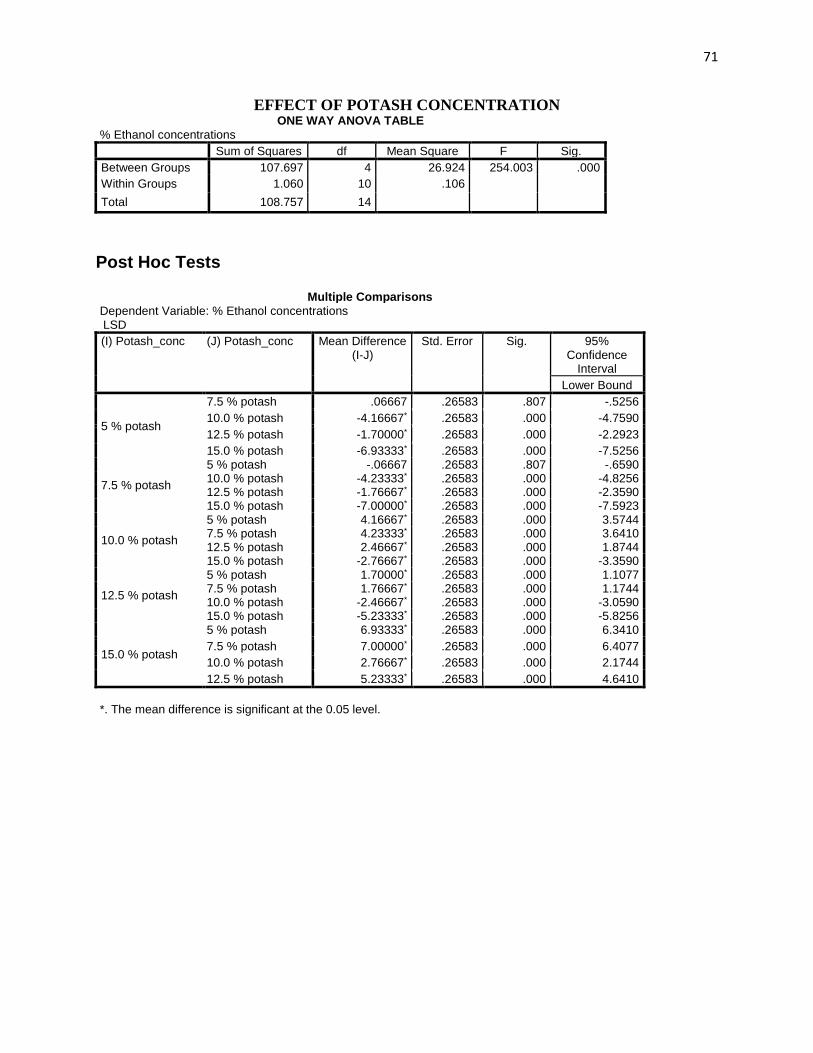
71
EFFECT OF POTASH CONCENTRATION ONE WAY ANOVA TABLE
% Ethanol concentrations
Sum of Squares df Mean Square F Sig.
Between Groups 107.697 4 26.924 254.003 .000
Within Groups 1.060 10 .106 Total 108.757 14
Post Hoc Tests
Multiple Comparisons
Dependent Variable: % Ethanol concentrations LSD
(I) Potash_conc (J) Potash_conc Mean Difference (I-J)
Std. Error Sig. 95% Confidence
Interval
Lower Bound
5 % potash
7.5 % potash .06667 .26583 .807 -.5256
10.0 % potash -4.16667* .26583 .000 -4.7590
12.5 % potash -1.70000* .26583 .000 -2.2923
15.0 % potash -6.93333* .26583 .000 -7.5256
7.5 % potash
5 % potash -.06667 .26583 .807 -.6590 10.0 % potash -4.23333* .26583 .000 -4.8256 12.5 % potash -1.76667* .26583 .000 -2.3590 15.0 % potash -7.00000* .26583 .000 -7.5923
10.0 % potash
5 % potash 4.16667* .26583 .000 3.5744 7.5 % potash 4.23333* .26583 .000 3.6410 12.5 % potash 2.46667* .26583 .000 1.8744 15.0 % potash -2.76667* .26583 .000 -3.3590
12.5 % potash
5 % potash 1.70000* .26583 .000 1.1077 7.5 % potash 1.76667* .26583 .000 1.1744 10.0 % potash -2.46667* .26583 .000 -3.0590 15.0 % potash -5.23333* .26583 .000 -5.8256
15.0 % potash
5 % potash 6.93333* .26583 .000 6.3410
7.5 % potash 7.00000* .26583 .000 6.4077
10.0 % potash 2.76667* .26583 .000 2.1744
12.5 % potash 5.23333* .26583 .000 4.6410
*. The mean difference is significant at the 0.05 level.

72
EFFECT OF CELL CONCENTRATION ONE WAY ANOVA TABLE
% Ethanol concentrations
Sum of Squares df Mean Square F Sig.
Between Groups 152.383 3 50.794 136.360 .000
Within Groups 2.980 8 .372 Total 155.363 11
Post Hoc Test Multiple Comparisons
Dependent Variable: % Ethanol concentrations LSD
(I) Cell_conc (J) Cell_conc Mean Difference (I-J)
Std. Error Sig. 95% Confidence Interval
Lower Bound Upper Bound
5.16 x 10
3.87 x 10 -1.63333* .49833 .011 -2.7825 -.4842
2.58 x 10 -8.63333* .49833 .000 -9.7825 -7.4842
1.29 x 10 -6.83333* .49833 .000 -7.9825 -5.6842
3.87 x 10 5.16 x 10 1.63333* .49833 .011 .4842 2.7825 2.58 x 10 -7.00000* .49833 .000 -8.1492 -5.8508 1.29 x 10 -5.20000* .49833 .000 -6.3492 -4.0508
2.58 x 10 5.16 x 10 8.63333* .49833 .000 7.4842 9.7825 3.87 x 10 7.00000* .49833 .000 5.8508 8.1492 1.29 x 10 1.80000* .49833 .007 .6508 2.9492
1.29 x 10
5.16 x 10 6.83333* .49833 .000 5.6842 7.9825
3.87 x 10 5.20000* .49833 .000 4.0508 6.3492
2.58 x 10 -1.80000* .49833 .007 -2.9492 -.6508
*. The mean difference is significant at the 0.05 level.
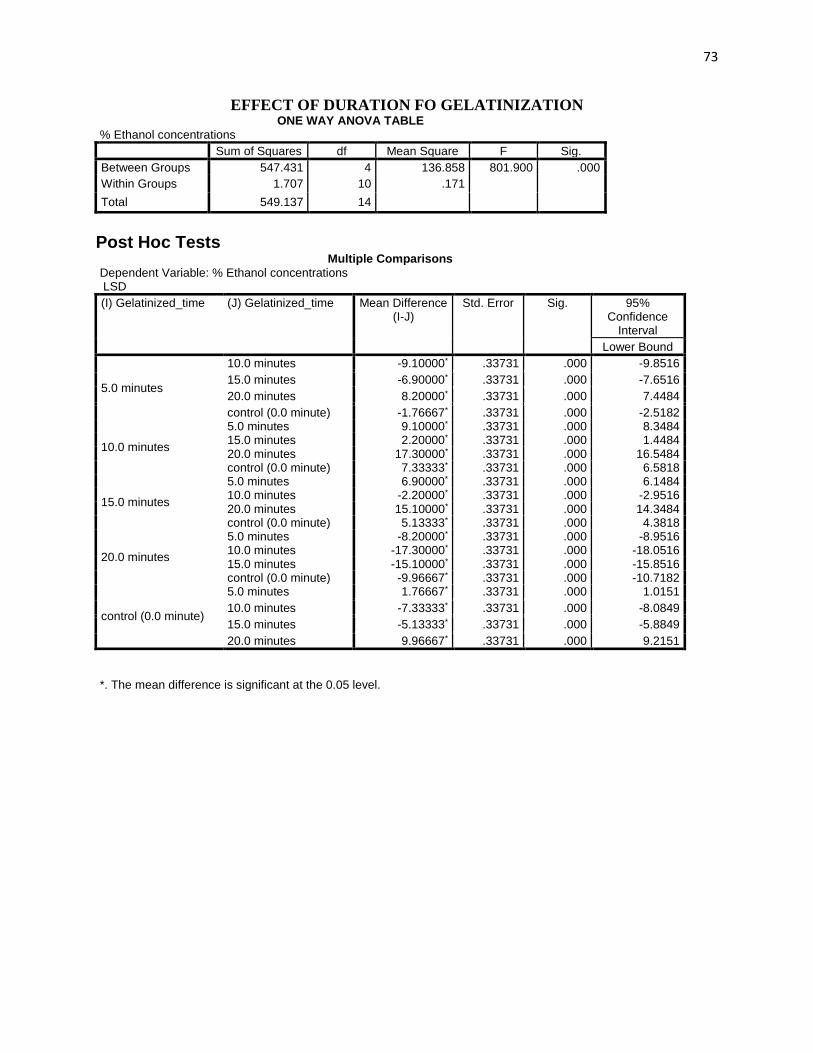
73
EFFECT OF DURATION FO GELATINIZATION ONE WAY ANOVA TABLE
% Ethanol concentrations
Sum of Squares df Mean Square F Sig.
Between Groups 547.431 4 136.858 801.900 .000
Within Groups 1.707 10 .171 Total 549.137 14
Post Hoc Tests Multiple Comparisons
Dependent Variable: % Ethanol concentrations LSD
(I) Gelatinized_time (J) Gelatinized_time Mean Difference (I-J)
Std. Error Sig. 95% Confidence
Interval
Lower Bound
5.0 minutes
10.0 minutes -9.10000* .33731 .000 -9.8516
15.0 minutes -6.90000* .33731 .000 -7.6516
20.0 minutes 8.20000* .33731 .000 7.4484
control (0.0 minute) -1.76667* .33731 .000 -2.5182
10.0 minutes
5.0 minutes 9.10000* .33731 .000 8.3484 15.0 minutes 2.20000* .33731 .000 1.4484 20.0 minutes 17.30000* .33731 .000 16.5484 control (0.0 minute) 7.33333* .33731 .000 6.5818
15.0 minutes
5.0 minutes 6.90000* .33731 .000 6.1484 10.0 minutes -2.20000* .33731 .000 -2.9516 20.0 minutes 15.10000* .33731 .000 14.3484 control (0.0 minute) 5.13333* .33731 .000 4.3818
20.0 minutes
5.0 minutes -8.20000* .33731 .000 -8.9516 10.0 minutes -17.30000* .33731 .000 -18.0516 15.0 minutes -15.10000* .33731 .000 -15.8516 control (0.0 minute) -9.96667* .33731 .000 -10.7182
control (0.0 minute)
5.0 minutes 1.76667* .33731 .000 1.0151
10.0 minutes -7.33333* .33731 .000 -8.0849
15.0 minutes -5.13333* .33731 .000 -5.8849
20.0 minutes 9.96667* .33731 .000 9.2151
*. The mean difference is significant at the 0.05 level.