
Preserving Envelope Efficiency in Performance Based … · Preserving Envelope Efficiency . ... May...
72
PNNL-24359 Preserving Envelope Efficiency in Performance Based Code Compliance BA Thornton GP Sullivan MI Rosenberg MC Baechler, Project Manager May 2015
Transcript of Preserving Envelope Efficiency in Performance Based … · Preserving Envelope Efficiency . ... May...

PNNL-24359
Preserving Envelope Efficiency in Performance Based Code Compliance BA Thornton GP Sullivan MI Rosenberg MC Baechler, Project Manager May 2015

PNNL-24359
Preserving Envelope Efficiency in Performance Based Code Compliance BA Thornton1 GP Sullivan2 MI Rosenberg MC Baechler, Project Manager May 2015 Prepared for the U.S. Department of Energy under Contract DE-AC05-76RL01830 Pacific Northwest National Laboratory Richland, Washington 99352
1 Thornton Energy Consulting 2 Efficiency Solutions


iii
Summary
The City of Seattle 2012 Energy Code (Seattle 2014), one of the most progressive in the country, is under revision for its 2015 edition. Additionally, city personnel participate in the development of the next generation of the Washington State Energy Code and the International Energy Code. Seattle has pledged carbon neutrality by 2050 including buildings, transportation and other sectors. The United States Department of Energy (DOE), through Pacific Northwest National Laboratory (PNNL) provided technical assistance to Seattle in order to understand the implications of one potential direction for its code development, limiting trade-offs of long-lived building envelope components less stringent than the prescriptive code envelope requirements by using better-than-code but shorter-lived lighting and heating, ventilation, and air-conditioning (HVAC) components through the total building performance modeled energy compliance path. Weaker building envelopes can permanently limit building energy performance even as lighting and HVAC components are upgraded over time, because retrofitting the envelope is less likely and more expensive. Weaker building envelopes may also increase the required size, cost and complexity of HVAC systems and may adversely affect occupant comfort. This report presents the results of this technical assistance. The use of modeled energy code compliance to trade-off envelope components with shorter-lived building components is not unique to Seattle and the lessons and possible solutions described in this report have implications for other jurisdictions and energy codes.
Sixteen example projects from 2013 to the present that submitted total building performance reports for Seattle building permit applications are reviewed. Ten of these are high-rise or mid-rise primarily multi-family buildings. The other six are high-rise or mid-rise primarily office buildings including some laboratory or retail space. The average modeled annual energy usage index (EUI) of the standard reference building energy models is 49.0 kBtu/ft2-yr and for the proposed buildings is 41.3 kBtu/ft2-yr or 15.7% savings from the standard reference buildings, significantly above the 7% minimum savings required. This 7% savings is required in the Seattle code to reflect that buildings which comply with the prescriptive code actually exceed many of the prescriptive requirements unlike the standard reference building model which exactly meets the prescriptive code. This 7% margin also helps to mitigate the effect of modeling uncertainty.
The most common components not complying with the code for which trade-offs were sought in multi-family buildings include window area relative to total exterior wall area (window to wall ratio, WWR) above the prescriptive code allowance (30%), missing economizers, wall details and areas with higher than prescriptive U-values. Savings were primarily from improved HVAC system efficiency especially fan operations associated with ventilation, the use of condensing service water heating equipment and condensing boilers for space heating for some of the high-rise buildings. The fan energy savings were particularly significant. The office buildings are more variable both in terms of the reasons for using the total building performance method, and in how they provide energy efficiency improvements to offset the features that don’t comply with the prescriptive code. However, WWR and window performance are part of the trade-offs for five of the six office projects.
This study identifies some weaknesses in the 2012 Seattle Energy Code including what could be considered a loophole for modeling the baseline fan energy usage in ways that allow the proposed design to show large fan energy savings. This study helped identify targets for code change proposals and helped lead to modifications to ongoing code change proposals for the 2015 Washington Energy Code. Other code changes were already being proposed for the 2015 Washington State Energy Code, such as reduced

iv
interior lighting power allowances, and required dedicated outdoor air systems for some building types that will limit the ability to show energy savings under the total building performance method. The 2015 Seattle Energy Code will likely incorporate changes that are adopted for the 2015 Washington Energy Code, and may include other additions and revisions informed by this work.
In this study, energy modeling is used to demonstrate the limits of major envelope variance from prescriptive code that is possible within the constraint of achieving 7% savings for the proposed building relative to the standard reference building. Medium office, large office, mid-rise apartment and high-rise apartment building prototype models developed by PNNL to support development of ASHRAE/ANSI/IES Standard 90.1 (Thornton, et. al. 2011) were modified to approximate similar buildings meeting the prescriptive requirements of the 2012 Seattle Energy Code, and act as the standard reference buildings for this analysis. Window area, exterior wall overall R-value, and window U-factor are varied in steps across a wide range. Lighting power density, HVAC energy usage, and service water heating energy usage are reduced in steps. A matrix is provided showing how much variance from prescriptive code is possible with given reductions in the several targeted savings categories. Graphs showing the results of all of the model runs are included.
This analysis shows that increases in window area above those in the Seattle examples are certainly possible up to the maximum value modeled, 70% window-to-wall ratio (WWR), with similar variation possible for wall and window thermal performance. This analysis also shows that once enough energy savings are achieved to reach a threshold, a narrow range of better-than-code improvements can lead to a wide range of worse-than-code envelope changes and potentially very weak building envelopes. This reinforces the need for some limit to envelope trade-offs other than just the 7% energy savings within the total building performance method.
One potential type of limit that could be added to the total building performance path is a limit on total building thermal envelope specific heat transfer calculated as the sum of the U-value times the area for each building envelope component, known as the UA. This UA limit would be separate from the UA envelope trade-off compliance path which only allows envelope trade-offs. This proposed limit would add a requirement to the total building performance path to calculate two UA values, one for the proposed building as designed, and one for that same building, but using prescriptive code envelope values, including window area limits. With this proposed limit, the UA of the proposed design could not exceed the UA of the proposed building with prescriptive code values by more than some percentage value. The impact on energy, building loads and other factors for different levels of this percentage value limit are presented in Section 3 of this report. Setting a value for a UA limit depends on the desired outcome. A limit of 25% greater calculated value of the UA for the design compared to the design with prescriptive envelope components appears to keep the envelope from being any weaker under the total building performance path than the levels in the example Seattle projects reviewed in this report. Section 3 describes phasing such a limit over time and options for setting different values for the limit.
One of the primary issues with allowing trade-off of long-lived envelope components that don’t meet code prescriptive requirements with shorter-lived lighting, HVAC or other components is that the building is left with a permanent energy weakness that is unlikely to ever be retrofit. Even as other components such as lighting and HVAC are replaced in the future, with presumably higher efficiency components, the weaker envelope limits the potential energy performance of the building. Even though initially the building which complies through the total building performance method can demonstrate similar modeled annual energy performance, over the life of the building, it will use more energy than a
v
building that starts out with a prescriptive code compliant envelope. A potential approach is discussed which would weight the building energy usage impact of envelope components at twice the level of the building energy use impact of shorter-lived building components such as lighting and HVAC. This weighting is based on an assumed life of 40 years for envelope components compared to an assumed life of 20 years for other building components.
The implications of this study are:
• The total building performance method has the potential to allow very weak building envelopes that compromise the long term energy usage of buildings and add substantially to peak heating and cooling capacity requirements and potentially the complexity of HVAC systems to handle greater perimeter comfort issues. Buildings in Seattle have not fully taken advantage of the flexibility this method offers to vary from the prescriptive code envelope values.
• Code changes should be (and some changes are being) made that will limit the potential to comply with code while including weak building envelopes. Particular code change targets include prescriptive and total building performance fan power and fan operations, HVAC and service water heating equipment choices, and lighting power allowances.
• Direct limits on the envelope variance allowed under the total performance method should be considered. Setting these limits depends on the level of envelope flexibility desired by the code program. This study provides information on two potential limits, which are not exclusive: (1) a limit on the overall building envelope thermal performance (the UA value) and (2) an envelope energy impact adjustment to the proposed design building energy usage reflecting the longer life of building envelope components relative to other building components.


vii
Acknowledgments
This document was prepared by Pacific Northwest National Laboratory (PNNL) for the U.S. Department of Energy’s (DOE’s) Office of Sustainability and Environment. The authors would like to thank Duane Jonlin, Energy Code and Energy Conservation Advisor, City of Seattle, whose proposal began this project, and who provided guidance, technical input and support. The authors also thank Ray Jacobson, Philip Man, Marsha Poon and Shailesh Desai with the City of Seattle for assistance in reviewing permit documents. The authors greatly appreciate the technical input and report review of Reid Hart, PNNL and the editorial review of Megan Peters, PNNL.

ix
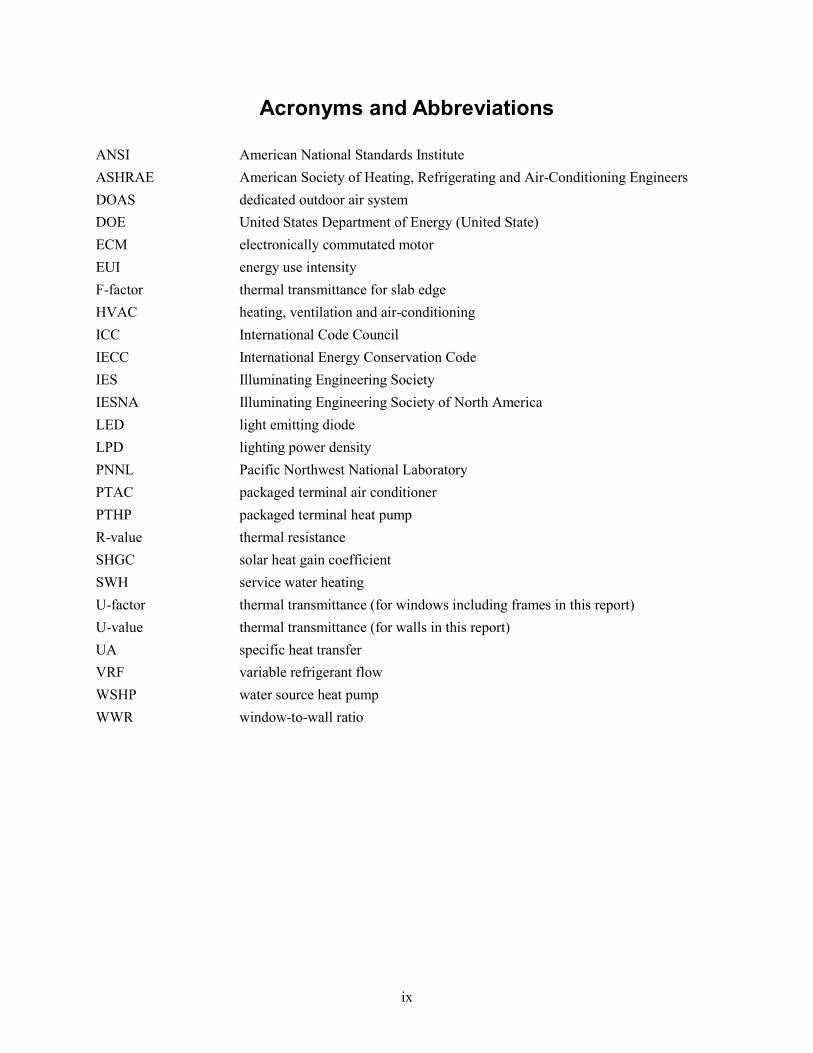
Acronyms and Abbreviations
ANSI American National Standards Institute ASHRAE American Society of Heating, Refrigerating and Air-Conditioning Engineers DOAS dedicated outdoor air system DOE United States Department of Energy (United State) ECM electronically commutated motor EUI energy use intensity F-factor thermal transmittance for slab edge HVAC heating, ventilation and air-conditioning ICC International Code Council IECC International Energy Conservation Code IES Illuminating Engineering Society IESNA Illuminating Engineering Society of North America LED light emitting diode LPD lighting power density PNNL Pacific Northwest National Laboratory PTAC packaged terminal air conditioner PTHP packaged terminal heat pump R-value thermal resistance SHGC solar heat gain coefficient SWH service water heating U-factor thermal transmittance (for windows including frames in this report) U-value thermal transmittance (for walls in this report) UA specific heat transfer VRF variable refrigerant flow WSHP water source heat pump WWR window-to-wall ratio

xi
Contents
Summary ........................................................................................................................................... iii Acknowledgments .............................................................................................................................vii Acronyms and Abbreviations ............................................................................................................ ix 1.0 Introduction ............................................................................................................................. 1.1 2.0 Total Building Performance Examples .................................................................................... 2.1
2.1 Multi-family Buildings .................................................................................................... 2.2 2.2 Office/Mixed-Use Buildings ........................................................................................... 2.4 2.3 Potential Code Changes that Could Limit Trade-offs ..................................................... 2.5
3.0 Total Building Performance Envelope Trade-Offs .................................................................. 3.1 3.1 Modeling Methodology ................................................................................................... 3.1 3.2 Modeling Results Observations ...................................................................................... 3.4
3.2.1 Better-than-Code Improvements to Allow Worse-than-Code Envelope .............. 3.5 3.2.2 Range of Better-than-Code Features to Allow Large Envelope Variances .......... 3.6
3.3 Impact of Proposed Changes to the Seattle Energy Code in 2015 .................................. 3.8 4.0 Setting an Envelope Thermal Performance Limit ................................................................... 4.1
4.1 Building Envelope Thermal Performance and UA Values ............................................. 4.2 4.2 UA Impacts on Energy, HVAC Capacity and Electricity Demand ................................. 4.4 4.3 Setting a UA Limit .......................................................................................................... 4.6
5.0 Lifetime Building Energy Usage ............................................................................................. 5.1 6.0 Conclusions ............................................................................................................................. 6.1 7.0 References ............................................................................................................................... 7.1

xii
Figures Figure 3.1 Example Medium Office Graph ............................................................................................... 3.4
Figure 3.2 Medium Office WWR Graph with Area for 2015 Code Proposals .......................................... 3.8
Figure 3.3 Medium Office WWR with HVAC and LPD Reductions Beyond 2015 Code Proposals ....... 3.9
Figure 3.5 Medium Office with WWR Trade-off .................................................................................... 3.10
Figure 3.6 Large Office with WWR Trade-off ........................................................................................ 3.11
Figure 3.7 Mid-rise Apartment with WWR Trade-off ............................................................................. 3.12
Figure 3.8 High-rise Apartment with WWR Trade-off ........................................................................... 3.13
Figure 3.9 Medium Office with Wall Overall R-value Trade-off ............................................................ 3.14
Figure 3.10 Large Office with Wall Overall R-value Trade-off .............................................................. 3.15
Figure 3.11 Mid-rise Apartment with Wall Overall R-value Trade-off ................................................... 3.16
Figure 3.12 High-rise Apartment with Wall Overall R-value Trade-off ................................................. 3.17
Figure 3.13 Medium Office with Window U-factor Trade-off ................................................................ 3.18
Figure 3.14 Large Office with Window U-factor Trade-off .................................................................... 3.19
Figure 3.15 Mid-rise Apartment with Window U-factor Trade-off ......................................................... 3.20
Figure 3.16 High-rise Apartment with Window U-factor Trade-off ....................................................... 3.21
Figure 4.1 Changes in UA Value with Varying Envelope Parameters ...................................................... 4.3
Figure 4.2 Medium Office UA and Model Results with Varying WWR .................................................. 4.4
Figure 4.3 Changes in UA and EUI Results .............................................................................................. 4.5
Figure 4.4 Effect on Cooling Capacity and EUI as UA Increases with WWR .......................................... 4.6
Tables
Table 2.1 Summary of Total Performance Building Projects .................................................................... 2.1
Table 2.2 Proposed Building Characteristics and Savings Relative to Code and Standard Reference ...... 2.3
Table 2.3 Proposed Standard Reference Building WWR Limits ............................................................... 2.7
Table 3.1 Summary of Worse-than-Code Envelope Component Model Inputs ........................................ 3.2
Table 3.2 Summary of Better-than-Code Improvements ......................................................................... 3.3
Table 3.3 Better-than-Code Improvements to Allow Worse-than-Code Envelope ................................... 3.5
Table 3.4 Better-than-Code Improvements to Allow Range of Worse-than-Code Envelope Elements .... 3.7
Table 4.1 UA Values with Varying Envelope Component Values ............................................................ 4.2
Table 4.1 Medium Office UA Values and Corresponding Energy Model Outputs ................................... 4.3
Table 4.2 Medium Office UA Interpolation with Varying WWR ............................................................. 4.7

xiii
Table 4.3 Potential UA Limit Values and Corresponding Maximum Envelope Trade-off ....................... 4.8
Table 4.4 Medium Office UA Values and Corresponding Energy Model Results .................................. 4.10
Table 4.5 Mid-rise Apartment UA Values and Corresponding Energy Model Results ........................... 4.11
Table 4.6 High-rise Apartment UA Values and Corresponding Energy Model Results ......................... 4.12
Table 5.1 Example of Envelope Impact Adjustment on Compliance ........................................................ 5.2
Table 5.2 Envelope Impact Varies with Source of Energy Savings in Proposed Design .......................... 5.3


1.1
1.0 Introduction
Seattle, Washington has one of the most progressive building energy codes currently adopted by a local jurisdiction in the United States. Their 2012 commercial building energy code, 2012 Seattle Energy Code, amends the 2012 Washington State Energy Code which is built on the 2012 International Energy Code (2012 IECC) (Seattle 2014, Washington State 2014, ICC 2012). The 2012 International Energy Code is closely related to the ASHRAE/ANSI/IESNA1 Standard 90.1-2010 referred to as Standard 90.1-2010 (ASHRAE/ANSI/IESNA 2010). The 2012 Seattle Energy Code is estimated to be 11.3% more stringent than Standard 90.1-2010 (Kennedy 2014). This puts it on a par with ASHRAE/ANSI/IES 90.1-2013 and 2015 International Energy Code (2015 IECC), the most current national energy standard and energy code respectively (ASHRAE/ANSI/IES1 2013, ICC1 2015). Standard 90.1-2013 is estimated to reduce site energy 7.6% relative to Standard 90.1-2010 (Halverson 2014). Only Vermont and Maryland have adopted 2015 IECC or Standard 90.1-2013 equivalent or more efficient codes (DOE 2015). Seattle is developing a new version of its energy code, the 2015 Seattle Energy Code, which is expected to be released in 2016. Seattle has committed to achieve carbon-neutral operations of all its non-industrial functions by the year 2050, including not only buildings, but also transportation, street lighting and waste handling (Seattle 2013). This goal is supported by a targeted 10% decrease in the energy use of the commercial building sector and a 20% reduction in the energy use of the residential building sector by 2030, compared to a 2008 baseline. Note that these targets are not for building energy use intensity (EUI), but for the energy use of the entire (existing and new) Seattle building stock including the rapid growth currently happening. This effectively mandates aggressive building energy code requirements for new construction, retrofits and tenant improvements.
The U.S. Department of Energy provided technical assistance to Seattle, through the Pacific Northwest National Laboratory, to investigate and provide potential solutions regarding a specific issue of concern by the Seattle energy code development team. The problem being investigated in this study is the need to reduce the potential for projects which seek compliance through total building energy performance, using energy modeling, to utilize technologies that are becoming commonplace such as condensing boilers and light emitting diode (LED) lighting, to create buildings with long term energy weaknesses, in particular less efficient building envelopes. There is also a concern that new energy efficiency technologies may emerge during code cycles and that code will not stay current with these technologies, so they can be used to allow less efficient building envelopes through the performance path. Trade-offs are made between envelope components that don’t meet the prescriptive code and other features that exceed the prescriptive code such as lower lighting power density (LPD). Building envelope features such as window to wall ratio are unlikely to ever be retrofit even as shorter-lived components such as lighting and HVAC systems are upgraded as buildings head towards net zero energy, communities seek to reach carbon neutrality, and energy codes continue to evolve.
Major building envelope elements, including window area, window performance and opaque area thermal properties limit the potential energy efficiency of buildings even as other components may be upgraded. The following is an example looking at a building that meets the prescriptive code initially, versus the same building using a performance trade-off, considered over thirty years.
1 American Society of Heating, Refrigerating and Air-Conditioning Engineers (ASHRAE), American National Standards Institute (ANSI), Illuminating Engineering Society (IES) of North America (IESNA), International Code Council (ICC)

1.2
Case 1. No Trade-Off Year Zero Roof insulation = R-30* (code minimum) HVAC efficiency = 14 SEER* (code minimum)
*R-30 is thermal resistance, in h·ft2·̊F/Btu, SEER is seasonal energy efficiency ratio
Year 20 Roof insulation = R-30 (existing) HVAC efficiency = 17 SEER (potential new code minimum)
Case 2. With Trade-Off
Year Zero Roof insulation = R-20 (below code minimum) HVAC efficiency = 17 SEER (higher efficiency required for trade-off)
Year 20 Roof insulation = R-20 (existing) HVAC efficiency = 17 SEER (potential new code minimum)
The two cases are equal from an energy standpoint for the first 20 years. For the next 20 years they both have the same HVAC system efficiency, but the one that traded-off roof insulation still has less insulation and will use more energy. In addition, trading off building envelope features can result in higher cooling and heating loads despite the enhanced efficiency of other components. This creates an economic obstacle to upgrading HVAC systems when more efficient systems are available, as all of the components are larger than they would be with a more stringent building envelope. So, although the building energy performance compliance approach results in a building that initially uses similar annual energy as a building meeting the prescriptive code, over the life of the building, it may use significantly more energy. In the case of lower performance windows, or larger window areas, thermal comfort may also be affected due to higher radiant and convective heat loss at the perimeter. If HVAC systems need to be designed to provide additional comfort control on the perimeter then this will add a permanent design component that will impact the cost and flexibility for future energy efficiency upgrades of HVAC systems.
The total building energy performance compliance path allows building designers flexibility to more economically meet the code, and potentially utilize newer energy efficient technology that may otherwise be more expensive by reducing costs for other components. Compliance demonstrated through energy modeling also allows for an integrated design approach to optimize the energy performance of a particular building in ways that prescriptive approaches cannot match. Because of the value of this flexibility and potential optimization, eliminating the total building performance compliance option is not considered the appropriate way to address the concerns.
This study includes a review of the recent use of the total building performance compliance approach in Seattle. This reveals several opportunities to modify code requirements to limit envelope trade-offs. One area of particular focus is to address some weaknesses in how fan energy is modeled in the total building performance method. In addition, energy modeling is used to consider the range of envelope trade-offs that may be possible under the total building performance compliance approach for four prototype buildings, a medium office, large office, mid-rise apartment and high-rise apartment. One approach to limit the use of total building performance compliance to create weak building envelopes is to

1.3
set a limit on the total envelope thermal performance, the specific heat transfer, the UA value2. A sensitivity analysis is provided for the impact of changes in particular envelope elements on the building UA value and these are correlated with the results of the energy modeling. Potential values of a UA limit for buildings seeking compliance under the total performance method are provided. Finally, a method is explored within the total building performance path to weight the energy use impact of building components based on average useful life of 40 years for building envelope components and 20 years for all other components.
2 UA is described in Section 4 of this report. Specific heat transfer, UA, is the sum of component conductance, typically U-value in Btu/hr·ft2·̊F, times corresponding area, ft2 for a resulting unit of Btu/hr·F̊.

2.1
2.0 Total Building Performance Examples
The Seattle Energy Code allows buildings to comply in multiple ways including the total building performance method, a whole building energy model approach. A standard reference model is developed to represent the building meeting the mandatory and prescriptive requirements of the code. This is compared with the proposed building model that is developed to match the new design. This method allows trade-offs between some components that don’t meet the prescriptive code and other components that exceed the prescriptive code.
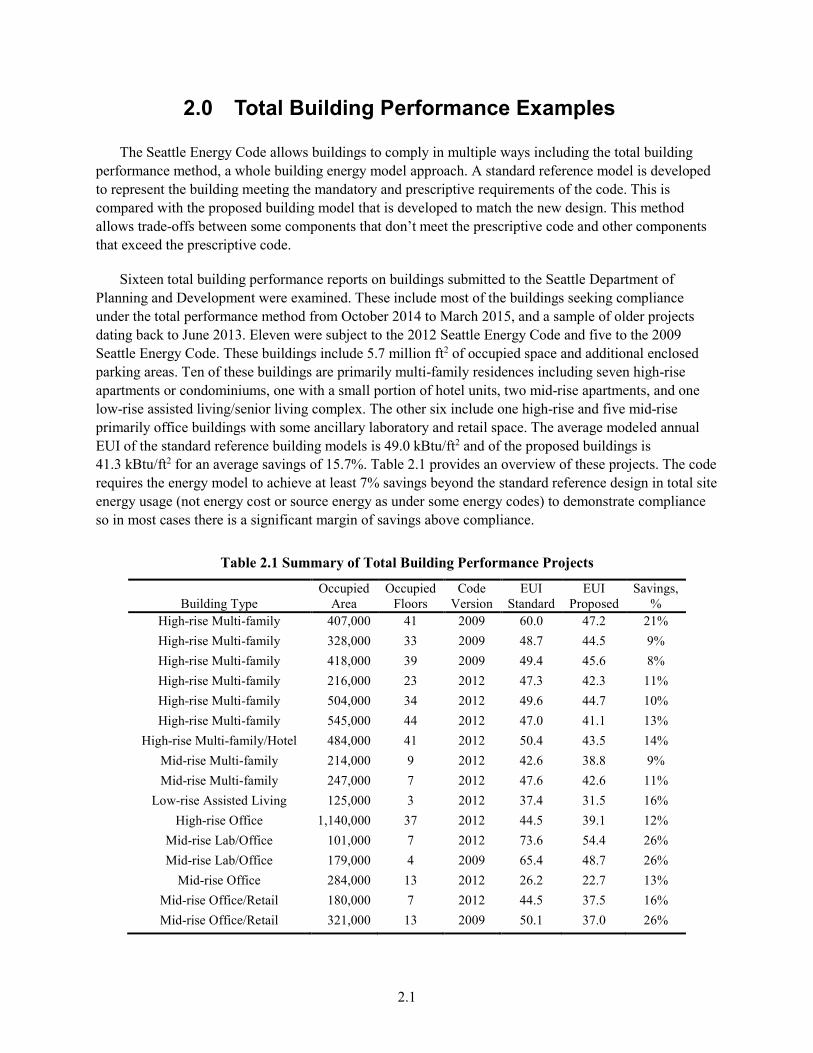
Sixteen total building performance reports on buildings submitted to the Seattle Department of Planning and Development were examined. These include most of the buildings seeking compliance under the total performance method from October 2014 to March 2015, and a sample of older projects dating back to June 2013. Eleven were subject to the 2012 Seattle Energy Code and five to the 2009 Seattle Energy Code. These buildings include 5.7 million ft2 of occupied space and additional enclosed parking areas. Ten of these buildings are primarily multi-family residences including seven high-rise apartments or condominiums, one with a small portion of hotel units, two mid-rise apartments, and one low-rise assisted living/senior living complex. The other six include one high-rise and five mid-rise primarily office buildings with some ancillary laboratory and retail space. The average modeled annual EUI of the standard reference building models is 49.0 kBtu/ft2 and of the proposed buildings is 41.3 kBtu/ft2 for an average savings of 15.7%. Table 2.1 provides an overview of these projects. The code requires the energy model to achieve at least 7% savings beyond the standard reference design in total site energy usage (not energy cost or source energy as under some energy codes) to demonstrate compliance so in most cases there is a significant margin of savings above compliance.
Table 2.1 Summary of Total Building Performance Projects
Building Type Occupied
Area Occupied
Floors Code
Version EUI
Standard EUI
Proposed Savings,
% High-rise Multi-family 407,000 41 2009 60.0 47.2 21% High-rise Multi-family 328,000 33 2009 48.7 44.5 9% High-rise Multi-family 418,000 39 2009 49.4 45.6 8% High-rise Multi-family 216,000 23 2012 47.3 42.3 11% High-rise Multi-family 504,000 34 2012 49.6 44.7 10% High-rise Multi-family 545,000 44 2012 47.0 41.1 13%
High-rise Multi-family/Hotel 484,000 41 2012 50.4 43.5 14% Mid-rise Multi-family 214,000 9 2012 42.6 38.8 9% Mid-rise Multi-family 247,000 7 2012 47.6 42.6 11%
Low-rise Assisted Living 125,000 3 2012 37.4 31.5 16% High-rise Office 1,140,000 37 2012 44.5 39.1 12%
Mid-rise Lab/Office 101,000 7 2012 73.6 54.4 26% Mid-rise Lab/Office 179,000 4 2009 65.4 48.7 26%
Mid-rise Office 284,000 13 2012 26.2 22.7 13% Mid-rise Office/Retail 180,000 7 2012 44.5 37.5 16% Mid-rise Office/Retail 321,000 13 2009 50.1 37.0 26%

2.2
The 7% savings margin is required because modeling compares the proposed building with a theoretical standard reference building in which all systems just meet code minimum, whereas actual buildings that comply prescriptively have components such as lighting, fan power, boiler efficiency, and window U-factors that are likely to be better than code, sometimes substantially better. If one were to create energy models for a selection of buildings designed to comply prescriptively, the proposed buildings would all exceed code minimum by varying degrees. The 7% margin is also included to address modeling uncertainty and variability of modeling approaches and tools.
Table 2.2 includes further information on all 16 projects. Three columns in particular provide information on how the projects varied from the code causing them to apply under the total building performance approach, how they go beyond the code in order to show savings relative to code, and the three primary energy use categories where the projects showed energy savings. Dividing the projects into multi-family and office/multi-use helps reveal certain trends. The assisted living/senior living project is included with the multi-family as it shares some common elements. In particular, the multi-family projects have some common characteristics. The office/multi-use buildings are more diverse.
2.1 Multi-family Buildings
The ten multi-family projects have many characteristics in common often including the variances from prescriptive code and the sources of energy savings to offset the worse-than-code components. Part of this commonality is due to the source of the reports, nine of which were submitted by the same engineering firm.
The ten multi-family projects share some common traits in how their designs vary from the prescriptive code. Nine of the ten projects identify having wall details such as balcony edges, slab edges and core wall areas that are uninsulated or under insulated relative to prescriptive code. Some also exceed required roof U-values. In most cases, the amount of variance in wall U-value was not included in the Appendix A summaries in the total building performance reports unlike other parameters such as window area that differ between the standard and proposed models. The omission of the variance in the wall U-value is in the Appendix A summaries is worth correcting in future submittals; in some cases, further detail was provided elsewhere in the report, but wall U-value should be included in the summary for completeness and ease of review. Wall U-value is in the report template provided by the City of Seattle for these reports. Nine of the ten projects identify as missing economizers for some or all HVAC cooling systems that would otherwise be required. Five of the ten projects identify window to wall ratios in excess of the standard allowed 30%. The average window to wall ratio of these five is 37% and ranges from 33% to 43%.
The second commonality is how the projects achieve energy savings. HVAC systems vary, with water source heat pumps (WSHP) being the most common for the tallest buildings, variable refrigerant flow (VRF) for the mid-rise buildings. In some cases, just ventilation air with a central fan system or space by space exhaust or supply fans is used with electric resistance heat (but modeled with cooling for comparison with the standard reference model). Despite these variations, nine of ten of these projects show savings by having the zone fan systems run at reduced speed, or ventilation airflow only for the proposed design when there is no space cooling or heating required, with constant volume fans running continuously at full flow and power for the standard design even when there is no space cooling or heating. In many of these cases, the efficiency of the proposed system fans is substantially better than the

2.3
Table 2.2 Proposed Building Characteristics and Savings Relative to Code and Standard Reference
Building Type
Occupied Area
Areas Worse than Code Areas Better than Code Top three energy
savings categories High-rise Multi-family
407,000 wall U-values, economizers
condensing boiler, WSHP heat/cool and fan efficiency, ventilation fan operation, condensing service water heating (SWH)
heating (gas), fans, SWH (gas)
High-rise Multi-family
328,000 wall U-values, economizers
ventilation fan operation, VRF heat/cool and fan efficiency, condensing SWH
fans, SWH (gas), cooling
High-rise Multi-family
418,000 wall U-values, economizers
ventilation fan operation, condensing SWH, parking lighting, stair lighting controls, efficient chillers, window SHGC
fans, SWH (gas), lighting
High-rise Multi-family
216,000 window area, economizers
condensing boiler (WSHP), condensing SWH, parking lighting
heating (gas), SWH (gas), lighting
High-rise Multi-family
504,000 window area, wall U-values, economizers
ventilation fan operation, condensing SWH, condensing boiler (WSHP), parking lighting
fans, SWH (gas), heating (gas)
High-rise Multi-family
545,000 window area, wall U-values, economizers
ventilation fan operation, condensing SWH, condensing boiler (WSHP), WSHP heat/cool efficiency, parking lighting
fans, SWH (gas), cooling
High-rise Multi-family /Hotel
484,000 wall and roof U-values
ventilation fan operation, condensing SWH, condensing boiler (WSHP), WSHP heat/cool efficiency, parking lighting
fans, SWH (gas), cooling
Mid-rise Multi-family
214,000 window area, wall U-values, economizers
ventilation fan operation, condensing SWH, parking and commons lighting, window U-value
fans, SWH (gas), lighting
Mid-rise Multi-family
247,000 window area, wall U-values, economizers
ventilation fan operation, VRF heat/cool and fan efficiency, condensing SWH, parking and commons lighting, window U-value
fans, SWH (gas), lighting
Low-rise Assisted Living
125,000 wall and roof U-values, economizers
ventilation fan operation, VRF and packaged terminal heat pump (PTHP) heat/cool and fan efficiency, condensing gas furnace for kitchen for ventilation, window SHGC
fans, SWH (gas) heating/cooling (electric)
High-rise Office
1,140,000 window area and U-values, economizers
waste heat from off-site, condensing boilers, efficient chillers
fans, heating (gas)
Mid-rise Lab/Office
101,000 missing economizers
dedicated outdoor air system (DOAS) with energy recovery, efficient chiller and boiler, VRF for space heating/cooling
heating (gas)
Mid-rise Lab/Office
179,000 window area chilled beams, lab lighting power, window, skylight, wall and roof U-values
heating (gas), fans, lighting
Mid-rise Office
284,000 window area WSHP heat/cool efficiency, variable air volume (VAV) chiller efficiency, VAV fan power, pumping control, window U-value
cooling, heating (gas and electric), pumping
Mid-rise Office/Retail
180,000 window area DOAS with energy recovery, VRF heating (gas and electric)
Mid-rise Office/Retail
321,000 window SHGC ventilation heat recovery, chilled beams, condensing boiler, interior lighting power, pumping control,
heating (gas), fans, lighting

2.4
efficiency of the fans in the standard models. Nine of ten projects use condensing gas service water heaters rather than code efficiency gas service water heaters for domestic hot water. Seven of the ten buildings have reduced lighting power density (LPD) in the parking garages and some also have reduced LPD for corridors and other common areas. The five WSHP projects have condensing boilers for the primary heat source and the assisted living project has condensing gas furnaces for the corridor and kitchen make-up air units.
As a result of these common elements, the top three energy savings categories are similar for all of these projects. For the nine projects that showed savings from operation of the fans for ventilation and in some cases fan efficiency, fan energy was the highest energy savings category for eight projects, and second highest for the remaining project. Fan savings for these nine projects averaged 46% relative to fan energy for the standard reference models. Fan savings were 61% of the total net savings for all usage categories (note that net savings includes some usage categories where the proposed building uses more energy than the standard reference building). Service water heating (SWH) savings were the second highest savings for nine of the projects, and third highest for the tenth. Heating with condensing boilers for the WSHP systems, cooling efficiency, and lighting were the other most common energy savings categories.
This information suggests that fan operations and efficiency are prime targets for improvements to the code requirements and modeling rules. Section 2.3 of this report expands on these and other potential improvements to the code.
2.2 Office/Mixed-Use Buildings
The six office/mixed-use buildings do not have as many common elements as the multi-family buildings. Increasing window area above the prescriptive limits was a reason for the modeled compliance approach for four of the six, and high window solar heat gain coefficient (SHGC) for one. One of the six has a tower and a podium structure. The podium structure is 100% glazed. The average WWR is 43% for the three more conventional office buildings with higher than the prescriptive allowed 30% WWR. Leaving out otherwise code required economizers on some systems was a reason to use the performance path for two of the six.
The design features that exceed code energy efficiency for these buildings are less consistent than for the multi-family buildings. Two of the projects have dedicated outdoor air systems (DOAS) with energy recovery. Two have chilled beams with condensing boilers for heating. Two have VRF systems. Two have reduced LPD. One uses waste heat from a central plant that serves a separate data center with heat recovery chillers; that project also has efficient chillers and condensing boilers for part of its heating and VAV systems. Table 2.2 shows the diversity in the type and source of energy savings. All of the projects show gas heating savings as one of the top three savings categories.
The common thread in trade-offs for these buildings is the higher than code window area relative to wall area. Setting a limit based on overall building envelope thermal performance, UA, as described in Section 4 of this report may be the most effective method of controlling this, given the variation in building systems and methods of achieving savings. Section 5 offers an additional or alternative strategy based on differences in the useful life of building envelope and other building components such as HVAC and lighting.
2.5
2.3 Potential Code Changes that Could Limit Trade-offs
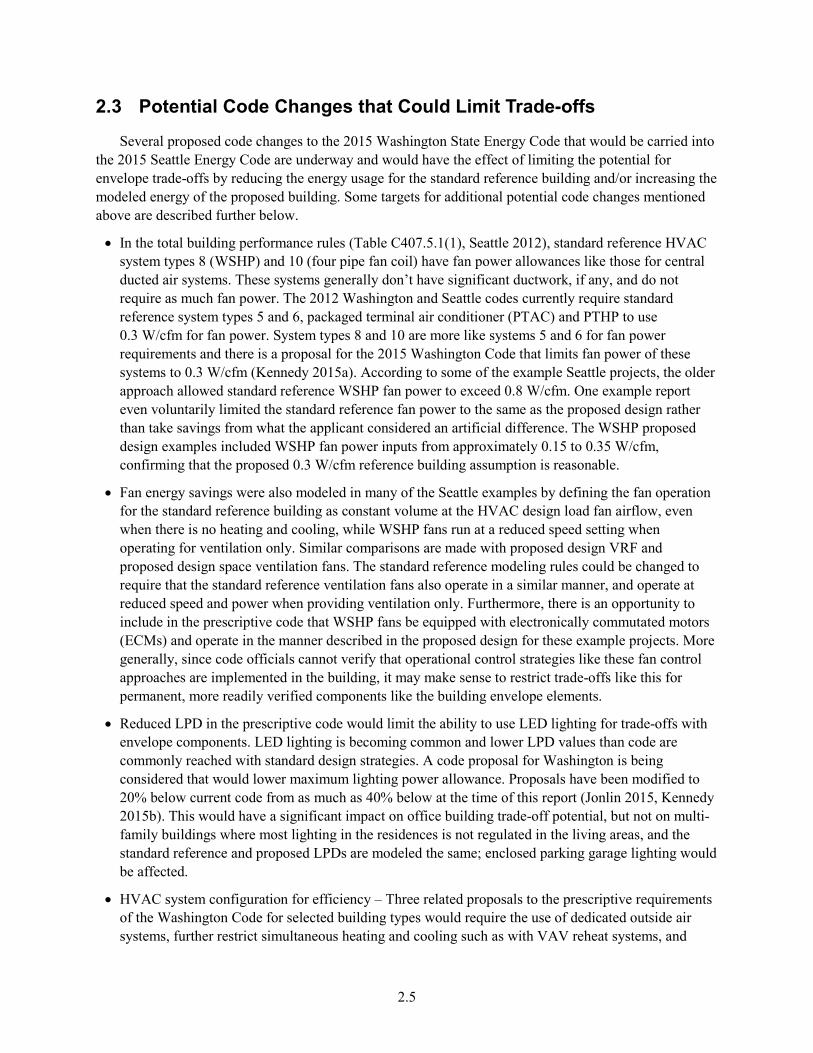
Several proposed code changes to the 2015 Washington State Energy Code that would be carried into the 2015 Seattle Energy Code are underway and would have the effect of limiting the potential for envelope trade-offs by reducing the energy usage for the standard reference building and/or increasing the modeled energy of the proposed building. Some targets for additional potential code changes mentioned above are described further below.
• In the total building performance rules (Table C407.5.1(1), Seattle 2012), standard reference HVAC system types 8 (WSHP) and 10 (four pipe fan coil) have fan power allowances like those for central ducted air systems. These systems generally don’t have significant ductwork, if any, and do not require as much fan power. The 2012 Washington and Seattle codes currently require standard reference system types 5 and 6, packaged terminal air conditioner (PTAC) and PTHP to use 0.3 W/cfm for fan power. System types 8 and 10 are more like systems 5 and 6 for fan power requirements and there is a proposal for the 2015 Washington Code that limits fan power of these systems to 0.3 W/cfm (Kennedy 2015a). According to some of the example Seattle projects, the older approach allowed standard reference WSHP fan power to exceed 0.8 W/cfm. One example report even voluntarily limited the standard reference fan power to the same as the proposed design rather than take savings from what the applicant considered an artificial difference. The WSHP proposed design examples included WSHP fan power inputs from approximately 0.15 to 0.35 W/cfm, confirming that the proposed 0.3 W/cfm reference building assumption is reasonable.
• Fan energy savings were also modeled in many of the Seattle examples by defining the fan operation for the standard reference building as constant volume at the HVAC design load fan airflow, even when there is no heating and cooling, while WSHP fans run at a reduced speed setting when operating for ventilation only. Similar comparisons are made with proposed design VRF and proposed design space ventilation fans. The standard reference modeling rules could be changed to require that the standard reference ventilation fans also operate in a similar manner, and operate at reduced speed and power when providing ventilation only. Furthermore, there is an opportunity to include in the prescriptive code that WSHP fans be equipped with electronically commutated motors (ECMs) and operate in the manner described in the proposed design for these example projects. More generally, since code officials cannot verify that operational control strategies like these fan control approaches are implemented in the building, it may make sense to restrict trade-offs like this for permanent, more readily verified components like the building envelope elements.
• Reduced LPD in the prescriptive code would limit the ability to use LED lighting for trade-offs with envelope components. LED lighting is becoming common and lower LPD values than code are commonly reached with standard design strategies. A code proposal for Washington is being considered that would lower maximum lighting power allowance. Proposals have been modified to 20% below current code from as much as 40% below at the time of this report (Jonlin 2015, Kennedy 2015b). This would have a significant impact on office building trade-off potential, but not on multi-family buildings where most lighting in the residences is not regulated in the living areas, and the standard reference and proposed LPDs are modeled the same; enclosed parking garage lighting would be affected.
• HVAC system configuration for efficiency – Three related proposals to the prescriptive requirements of the Washington Code for selected building types would require the use of dedicated outside air systems, further restrict simultaneous heating and cooling such as with VAV reheat systems, and

2.6
restrict outside air volumes (Heller 2015a, b and c). Some of these proposals include a requirement that fans for heating and cooling cycle on demand, further reducing fan energy use. If these are approved and also incorporated in the requirements for the standard reference building system type, the opportunity to show HVAC energy savings with the proposed design would be greatly reduced, therefore limiting envelope trade-offs. This proposal excludes multi-family buildings but includes office buildings.
• Condensing gas boilers and service water heaters are included in the proposed designs for many of the example Seattle projects and provide much of the energy savings used for envelope trade-offs. Condensing systems have around 90% and greater rated efficiency compared to code minimum of approximately 80% for conventional gas boilers and water heaters. Seattle is conducting a separate study with U.S. DOE support on the merit of and implementation of code changes to the total building performance method to require/encourage heat pumps for space heating. Heat pumps are an alternative to both natural gas and electric resistance heating. A code change could be made to require the use of air to water or water to water heat pumps for the standard reference building for the total building performance method for all SWH and for all space heating. This would limit opportunities for trade-off for offices, and to a greater extent for multi-family because of the large SWH usage in those types of buildings. Since Seattle uses site energy not energy cost or source energy for the total building performance energy savings comparison, this would have a very large impact on potential for trade-offs. Heat pumps use around a third of the site energy of electric resistance or natural gas heating equipment.
• Another option for addressing the use of condensing gas service water heaters for envelope trade-offs is a provision which is in the integrated draft 2015 Washington Energy Code (excerpt below with exceptions not shown) at the time of this report and originally appeared in Standard 90.1-2013. A similar provision for hydronic heating boilers could be proposed. Simply mandating condensing boilers in the prescriptive code or in the standard reference building is not possible because of national legal restrictions on pre-emption of federal equipment efficiency standards (10 CFR 431 2006).
C404.2.1 High input-rated service water-heating systems. Gas-fired water-heating equipment installed in new buildings shall be in compliance with this section. Where a singular piece of water-heating equipment serves the entire building and the input rating of the equipment is 1,000,000 Btu/h (293 kW) or greater, such equipment shall have a thermal efficiency, Et, of not less than 90 percent. Where multiple pieces of water-heating equipment serve the building and the combined input rating of the water-heating equipment is 1,000,000 Btu/h (293 kW) or greater, the combined input-capacity-weighted-average thermal efficiency, Et, shall be not less than 90 percent. (Washington 2015a)
• The modeling of the part load efficiency of condensing water heaters and boilers could be refined. With a recirculating system, during periods of low-load, the entering water temperature to a water heater or boiler can be high enough to preclude condensing, greatly reducing the efficiency. The distribution water temperature also affects the heating efficiency and temperatures used are higher than ideal for condensing equipment performance out of concern for legionella in some buildings. Continuous recirculation, used to maintain water temperature at the tap and also to control legionella, also degrades condensing equipment efficiency. Further investigation is needed to define and include in the building performance rules how to properly model part load efficiency of this type of equipment. Commonly, it is modeled with fixed percentage efficiency.

2.7
• Limiting window to wall ratio trade-offs for some building types not included in the example projects can be achieved by adopting the WWR maximums for the standard reference building from Standard 90.1-2013 Appendix G Table G3.1.1-1 Baseline Building Vertical Fenestration Percentage of Gross Above-Grade-Wall Area (ASHRAE/ANSI/IES 2013). Those values are modified for consistency with the Seattle code by limiting those that exceed 30% in the Standard 90.1-2013 table to 30%. Table 2.3 shows these WWR limits with strike-outs for the Standard 90.1-2013 values that exceed 30%. This approach would set an upper limit for baseline buildings, and also allow credit for reducing window area below these levels, encouraging reduced window areas. Seattle is not currently considering this approach, but it is an option for other jurisdictions.
Table 2.3 Proposed Standard Reference Building WWR Limits
Building Type WWR Grocery Store 7% Healthcare (outpatient) 21% Hospital 27% Hotel/motel (≤75 rooms) 24% Hotel/motel (> 75 rooms) 30% 34% Office (≤5000 ft2) 19% Office (5,000 to 50,000 ft2) 30% 31% Office (>50,000 ft2) 30% 40% Restaurant (quick service) 30% 34% Restaurant (full service) 24% Retail (standalone) 11% Retail (strip mall) 20% School (primary) 22% School (secondary and university) 22% Warehouse (non-refrigerated) 6%


3.1
3.0 Total Building Performance Envelope Trade-Offs
Review of the example total building performance cases in Section 2 of this report suggests that buildings could qualify for even larger variance from the prescriptive code than those described. The highest savings demonstrated for the proposed design relative to the standard reference building was 26%, and the average savings was 15.7% compared to the 7% minimum savings required. This section explores the range of potential for trade-offs using energy modeling with prototype building energy models. Models are run with different levels of worse-than-code envelope components and with different levels of better-than-code reductions in lighting, SWH and HVAC.
3.1 Modeling Methodology
Energy Plus (version 8.0) was used to model four prototype buildings (DOE 2013). These models were developed starting from prototypes that PNNL developed for analysis and support of the development of new versions of Standard 90.1 (Thornton et al. 2011, Halverson et al. 2014). Four of the 16 prototypes, the medium office, high-rise apartment, mid-rise apartment and large office prototypes modeled to meet Standard 90.1-2010 were adjusted to approximate standard reference models under the 2012 Seattle Energy Code utilizing information from a recent study comparing the 2012 Seattle Energy Code to Standard 90.1-2010 (Kennedy 2014). These four prototypes correspond approximately to the building types of the total building performance examples described in Section 2 of this report. The Kennedy study also utilized the Standard 90.1-2010 prototype models, although it did not include the high-rise apartment or mid-rise apartment, just the 14 non-residence commercial building models.
The Kennedy study identified the major differences between the 2012 Seattle Code and Standard 90.1-2010 that result in quantifiable energy savings. This study included building characteristics such as window performance requirements and lighting power and also operational savings such as for the Seattle commissioning requirements. The operational savings are not considered in this analysis, as the building prototype models are setup to operate consistent with code already. Not all of the prescriptive differences were incorporated but the resulting prototype models showed a similar reduction in energy usage from 90.1-2010 to Seattle 2012 as identified in the Kennedy study for the non-operational savings (Kennedy 2014). The modified prototypes provide a reasonable starting point to test the trade-off limits of the total performance path.
Using this approach, four prototype standard reference models were created. These models give EUI results comparable, while somewhat lower in most cases, than the standard reference models in the Seattle examples.
• Mid-rise apartment prototype EUI is 41.4 and the average for the 2012 code Seattle examples, two mid-rise and one low-rise multi-family, is 42.5.
• High-rise apartment prototype EUI is 41.6 and the average for the 2012 code Seattle examples, four high-rise multi-family is 48.6.
• Medium office prototype EUI is 28.7 and the average for the 2012 code Seattle examples, two mid-rise office buildings (the two without lab areas) EUI is 35.4 (from 26.2 and 44.5).

3.2
• Large office prototype EUI is 89.4 (this prototype includes a large data center) and the average for the related 2012 code Seattle examples, one high-rise office and two mid-rise offices with lab space (both of these are over 100,000 ft2) EUI is 61.2. There is not a truly similar building in the Seattle examples to the large office prototype, but results for this prototype are explored in parts of this analysis since there are similar buildings in the real world.
Some readers may notice that some of the prototype and the Seattle example modeled results are towards the low end of real world building performance for recently constructed high performance buildings that meet or exceed the most recent energy codes. Since this project is concerned with the total building performance code compliance method which is based on energy modeling, comparison with the Seattle example modeled projects is the relevant comparison. Energy models typically represent ideally operating buildings.
The simulations in this study vary primarily in building envelope characteristics that are worse than code in some of the total building performance compliance examples. These include window area as a percentage of wall area also known as window-to-wall ratio (WWR), wall overall U-value and corresponding R-value, and window U-factor. Each model includes a variation in only one envelope parameter at a time.
Table 3.1 provides a summary of the envelope component values modeled. Window area as a percentage of wall area is varied from the code maximum of 30% to 70% in increments of 10% without using a more stringent U-factor. Overall wall U-value is varied in steps based on the corresponding effective R-value, the reciprocal of the U-value. The code maximum wall U-value is 0.055 Btu/h·ft2·̊F, an effective R-value of 18.2 h·ft2·̊F/Btu. In addition to the code requirement, increments of 75%, 50% and 25% of this R-value are modeled. This R-value is for the total wall assembly, not just the insulation. Window U-factor is varied from the code maximum of 0.38 to 0.43, 0.55, 0.65 and 0.75 Btu/h·ft2·̊F. These window U-factors include the thermal impact of window frames. The window U-factor steps are not exactly even as a limited set of defined window objects built up from glazing materials that are available in the PNNL prototypes are used. These all have an SHGC value of 0.35. These defined windows are used because they give more accurate results for window solar heat gain and visible light transmittance (Arasteh 2009). The alternative would be window objects that are defined with just the U-value, SHGC and visible light transmittance.
Table 3.1 Summary of Worse-than-Code Envelope Component Model Inputs
Code Worse-than-Code Envelope Components Window Area, % 30% 40% 50% 60% 70% Wall R-value, h·ft2·̊F/Btu R-18.2 R-13.6 R-9.1 R-4.6 NA Window U-factor, Btu/h·ft2·̊F 0.38 0.43 0.55 0.65 0.75
Applied to these envelope characteristic model groups are better-than-code reductions to save energy at least partially offsetting the energy lost with the envelope characteristics that are worse than code. Three variations are considered in separate modeling groups including lighting power or SWH depending on the prototype modeled, and overall HVAC energy usage. In addition, combination saving are presented, lighting power and HVAC for the two office prototypes, and HVAC and SWH for the two

3.3
apartment prototypes. The most extreme end of these variations may be above what is readily achievable today, but may be possible with future technology. These variations are summarized in Table 3.2.
For the two office prototypes, LPD is reduced in 20% increments from the code maximum building area method value of 0.9 W/ft2. These lighting power increments are modeled to capture the interactive effects of lighting power changes on HVAC energy usage. These lighting power increments are not modeled for the two apartment prototypes, because most of the lighting energy in these prototypes is in the residences, and is not directly regulated in the commercial energy code. Most of the interior lighting is modeled the same in the standard reference model and the proposed design model and is not available for trade-off for these type of buildings.
For the two apartment building prototypes, SWH energy usage is adjusted in increments of 20% using post-processing of the energy model results in a spreadsheet. SWH is a substantial part of apartment building energy usage, but not of office buildings. As with the HVAC variations, the method to achieve SWH savings is not specified.
For all four prototypes, HVAC energy usage is adjusted in increments of 20% using post-processing of the energy model results in a spreadsheet. These increments include adjustment of heating, cooling, fan, pump and heat rejection energy. The increments do not specify how these changes can be achieved in the design but instead are used to show how much HVAC would need to be improved to save enough to offset a given level of envelope variance from code.
The two combination savings results are also provided. For the office prototypes, the results with varying LPD are modified so that their HVAC energy is reduced by the same percentage as the lighting. For the apartment prototypes, HVAC and SWH energy are reduced in tandem. Table 3.2 summarizes these variations which are described further below.
Table 3.2 Summary of Better-than-Code Improvements
Prototypes Type of Improvement Code Percentage Reduction
Medium and Large Office Interior Lighting LPD
0% 20% 40% 60% 80% HVAC Energy Use Lighting and HVAC
Mid-rise and High-rise Apartment
HVAC Energy Use 0% 20% 40% 60% 80% SWH Energy Use
SWH and HVAC
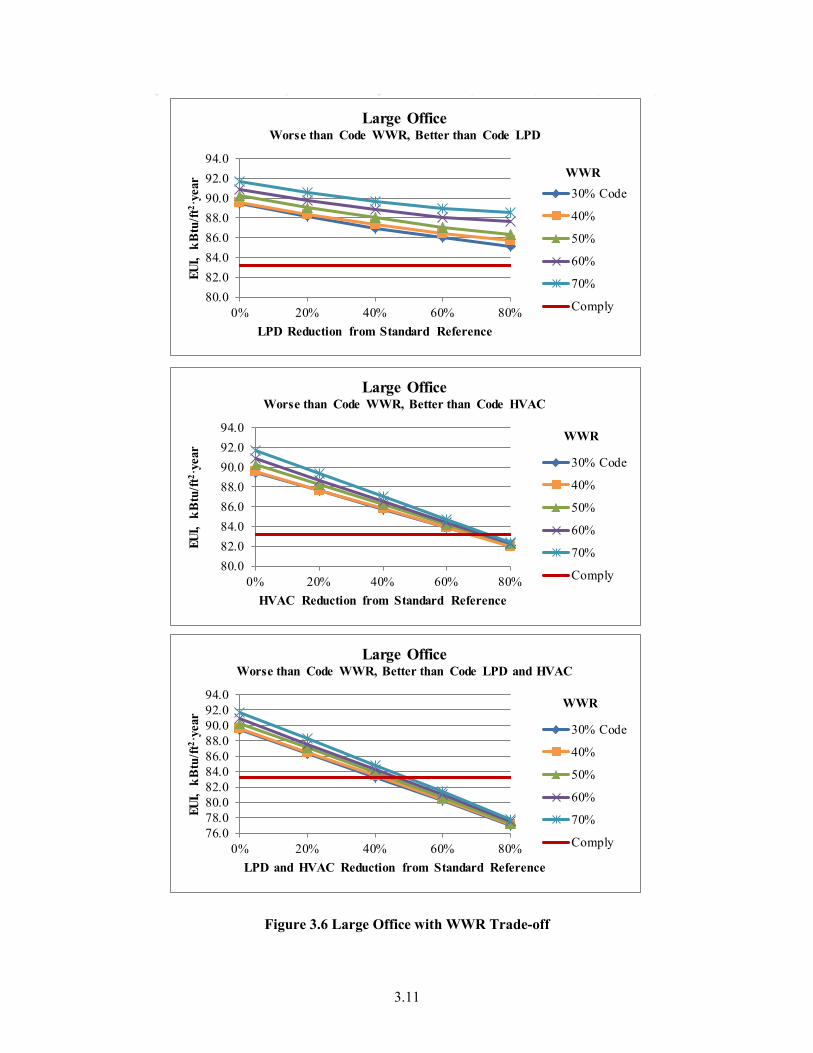
Figures 3.5 to 3.16 provide all of these modeling results. Each figure includes three graphs, which cover one prototype and one worse-than-code envelope component such as window area and each of the three variations in better-than-code provisions, either lighting, HVAC and their combination, or SWH, HVAC and their combination depending on the prototype. Figures 3.5 to 3.8 cover variations in window area. Figures 3.9 to 3.12 cover variations in wall R-value. Figures 3.13 to 3.16 cover variations in window U-factor. Each group of four is presented in the order medium office, large office, mid-rise apartment and high-rise apartment. Because of the quantity of these figures, they are presented at the end of this section of the report after the narrative and other tables and figures.

3.4
Figure 3.1 shows an example of one of these graphs and is an excerpt from Figure 3.5. The graph titles identify the prototype, the envelope parameter varied to be worse than code and the parameter or parameters that is/are varied to be better than code. The vertical axis identifies the EUI of each model result, the horizontal axis identifies the amount the selected better-than-code parameter is adjusted to produce offsetting savings. Each graphed line represents a different envelope value, with one envelope parameter—WWR, wall R-value, or window U-factor—being varied per graph. The envelope factor that meets prescriptive code is the blue line in all graphs and is identified in the data series labels as “Code.” Each of the other lines represents a variance of the envelope parameter value below code. There is also a red horizontal line identified as “Comply” in each graph, which shows the EUI 7% below a code standard reference building, the maximum energy usage allowed that achieves code compliance under the total building performance method. The point circled in red in Figure 3.1 shows the medium office result with WWR of 30% and LPD and HVAC with no reduction from code (0% on the horizontal axis); this point represents a prescriptive code compliant building.
Figure 3.1 Example Medium Office Graph
3.2 Modeling Results Observations
The modeling effort revealed some trends that carried across all of the prototypes and support the idea of limiting the ability to use the total building performance method to trade-off envelope components that are worse than code. The results show that it is challenging to overcome the 7% energy savings minimum to demonstrate compliance with modeling where only a single parameter is varied. Varying one parameter alone, such as just interior LPD, to be better than code may not result in sufficiency savings to achieve
18.0
20.0
22.0
24.0
26.0
28.0
30.0
32.0
34.0
0% 20% 40% 60% 80%
EU
I, kB
tu/ft
2 ·ye
ar
LPD and HVAC Reduction from Standard Reference
Medium Office Worse than Code WWR, Better than Code LPD and HVAC
30% Code
40%
50%
60%
70%
Comply
WWR
7%
The red line is the maximum total building performance allowed for code compliance including the 7% savings margin. EUI results at and below this line achieve code compliance.
This point and the dashed blue line represent prescriptive compliance at 30% WWR and code lighting and HVAC.
7%

3.5
substantial variance in building components to be worse than code. However varying multiple building components to be better than code such as lighting and HVAC together can allow envelope components to be significantly worse than code. In addition, the range in better-than-code changes needed to achieve the whole range of worse-than-code envelope changes modeled is narrow. Once a threshold of energy savings is reached, modest additional energy reductions allow substantial worse-than-code variation in building envelope components.
3.2.1 Better-than-Code Improvements to Allow Worse-than-Code Envelope
One characteristic that all of the graphs demonstrate, is that the 7% savings requirement to achieve compliance is theoretically an obstacle to designs varying from the prescriptive code. For example, in Figure 3.1 above, a 20% reduction in LPD and HVAC is needed to just offset the 7% savings even with at code 30% window area. Despite this obstacle, there is opportunity to use the total building performance method to create buildings with envelope components that are thermally weak with savings from shorter-lived lighting, HVAC and SWH components, particularly when more than one savings strategy is applied. Note that most of the Seattle projects studied far exceeded the 7% savings threshold despite this obstacle and generally applied more than one savings strategy. Table 3.3 summarizes the reduction needed in
Table 3.3 Better-than-Code Improvements to Allow Worse-than-Code Envelope
Medium Office and Large Office
Prototype Code Envelope Components
Worse-than-Code Envelope Components
Better-than-Code Improvements
Lighting Only
Reduction
HVAC Only
Reduction
Lighting and HVAC Reduction
Medium Office
30% Window Area 40% Window Area 71% 40% 25% 18.2 Wall R-Value 13.6 Wall R-Value 51% 37% 20% 0.38 Window U-factor 0.43 Window U-factor 51% 38% 21%
Large Office
30% Window Area 40% Window Area not enough
savings to allow
68% 42% 18.2 Wall R-Value 13.6 Wall R-Value 68% 41%
0.38 Window U-factor 0.43 Window U-factor 68% 41%
Mid-rise and High-rise Apartment
Prototype Code Envelope Components
Worse-than-Code Envelope Components
Better-than-Code Improvements
Lighting Only
Reduction
HVAC Only
Reduction
Lighting and HVAC Reduction
Mid-rise Apartment
30% Window Area 40% Window Area 42% 38% 20% 18.2 Wall R-Value 13.6 Wall R-Value 29% 30% 15% 0.38 Window U-factor 0.43 Window U-factor 32% 31% 16%
High-rise Apartment
30% Window Area 40% Window Area 37% 40% 19% 18.2 Wall R-Value 13.6 Wall R-Value 26% 32% 14% 0.38 Window U-factor 0.43 Window U-factor 29% 34% 16%

3.6
better-than-code components to allow the smallest variances modeled for worse-than-code envelope component thermal performance, 40% window area, 13.6 overall wall R-value and 0.43 window U-factor. The 40% window area is a 33% increase over the 30% prescriptive value; 13.6 wall R-value is a 25% reduction from the 18.2 prescriptive value, and 0.43 window U-factor is a 13% increase in window U-factor.
For the medium office, over a 50% reduction in interior lighting power is needed to allow all three types of envelope components modeled to be changed to the first worse-than-code step. About a 40% reduction in HVAC is needed to allow the first step in worse-than-code envelope components. However, when lighting and HVAC reductions are combined, a 20% to 25% reduction in both is sufficient to allow the first worse-than-code step in envelope components. For example, in Table 3.3, in the first row, for medium office prototype, achieving 25% reduction in both LPD and HVAC allows 40% window area, more than the 30% window area maximum allowed by code (without higher window U-factor).
The large office does not show much potential for trade-offs with individual lighting or HVAC savings strategies and even the maximum reduction in lighting modeled, 80%, does not provide enough savings by itself to allow the first worse-than-code step in envelope components. The lighting savings are small compared to the large data center energy usage and don’t generate the 7% savings on total building energy usage needed to allow an envelope trade-off and lighting reductions are also offset by increased heating. A 40% reduction in both interior lighting and HVAC does provide enough energy savings to allow trade-off with the first worse-than-code step of envelope components. Large office results are included in this table, and in the figures with all of the model results. However, because the large office prototype energy usage is dominated by the data center in its basement, the impact of changes in building envelope are proportionately small, and the graphs and results appear different than for the other three prototypes, with the lines grouped closely together, and larger percentage savings needed to overcome the large energy usage for the data center to reach 7% savings for compliance with variations in envelope parameters. It would be worthwhile to investigate a large office prototype without a substantial data center.
The apartment prototype results are similar for both mid-rise and high-rise, and demonstrate that achieving envelope trade-offs requires smaller better-than-code energy reduction for the apartment prototypes than for the office prototypes. With reductions of 26% to 42% in SWH or HVAC alone, the first worse-than-code step in envelope components could be allowed. Combined SWH and HVAC reductions of 14% to 20% would allow the first worse-than-code step in envelope components.
3.2.2 Range of Better-than-Code Features to Allow Large Envelope Variances
Examining the full range of envelope trade-offs modeled suggests a reason to consider a limit on envelope trade-offs outside of the percentage savings required with the total building performance method. The rapid pace of technological change and arrival of new energy savings technologies may allow substantial new savings relative to the standard reference models. The range of lighting, SWH, and HVAC reductions needed to go from the first worse-than-code step in envelope components to the largest worse-than-code step in envelope components is narrow. This means that once sufficient energy reductions are included in the design to allow the smallest worse-than-code variance in envelope components modeled in this study, only moderate additional reductions are needed to allow the largest worse-than-code variance in envelope components. For example, in Table 3.4, for the mid-rise apartment

3.7
in the first row of the lower sub-table, the first trade-off tier for WWR, 40% WWR, can be achieved with 20% reduction in both SWH and HVAC, and the highest tier, 70% WWR can be achieved with 34% savings in both SWH and HVAC.
The range of differences between better-than-code elements to allow the smallest to largest worse-than-code envelope components is similar for window area, wall R-value, and window U-factor, and can be considered as a group. For the medium office, the average reduction needed to reach the smallest envelope variance is 22% and to reach the largest variance is 33%, a difference of 11%. For large office, the corresponding values are 41% and 46%, a very narrow range. Mid-rise apartment corresponding range is 17% to 28%, a difference of 11% and high-rise apartment is 16% to 28%, a difference of 12%. Significant reductions in energy usage are needed to reach the smallest worse-than-code variance in envelope components, but once reached, moderate additional improvements in efficiency for the combined savings strategies results in large increases in the available envelope trade-offs.
Table 3.4 Better-than-Code Improvements to Allow Range of Worse-than-Code Envelope Elements
Medium Office and Large Office Smallest Variance From Code Envelope Largest Variance from Code Envelope
Prototype Worse Than Code
Envelope Components
Better Than Code
Lighting
and HVAC Reduction
Worse Than Code
Envelope Components
Better Than Code
Lighting
and HVAC Reduction
Spread
Difference in Better
Than Code Reduction
Medium Office
40% Window Area 25% 70% Window Area 38% 13% 13.6 Wall R-Value 20% 4.6 Wall R-Value 32% 12% 0.43 Window U-factor 21% 0.75 Window U-factor 29% 8%
Large Office
40% Window Area 42% 70% Window Area 50% 8% 13.6 Wall R-Value 41% 4.6 Wall R-Value 44% 3% 0.43 Window U-factor 41% 0.75 Window U-factor 43% 2%
Mid-rise Apartment and High-rise Apartment Smallest Variance From Code Envelope Largest Variance from Code Envelope
Prototype Worse Than Code
Envelope Components
Better Than Code
SWH and
HVAC Reduction
Worse Than Code
Envelope Components
Better Than Code
SWH and
HVAC Reduction
Spread
Difference in Better
Than Code Reduction
Mid-rise Apart-ment
40% Window Area 20% 70% Window Area 34% 14% 13.6 Wall R-Value 15% 4.6 Wall R-Value 28% 13% 0.43 Window U-factor 16% 0.75 Window U-factor 21% 5%
High-rise Apart-ment
40% Window Area 19% 70% Window Area 34% 15% 13.6 Wall R-Value 14% 4.6 Wall R-Value 27% 13% 0.43 Window U-factor 16% 0.75 Window U-factor 21% 5%

3.8
3.3 Impact of Proposed Changes to the Seattle Energy Code in 2015
At the time of this study, there are two proposed changes to the Washington State Energy Code (the base document for the Seattle Energy Code) which would have a major impact on the potential for envelope trade-offs described in this report, primarily for office buildings, not apartment buildings. These proposals which could lower the lighting power allowance by 20% for most interior lighting (not residential lighting in apartment units) from the levels in the 2012 Washington Code, and require DOAS in many building types are described in Section 2.3 of this report. The DOAS proposal would reduce HVAC energy usage substantially, potentially 30% to 60% compared to conventional systems according to the documentation provided with the code proposals (Heller 2015a). The original proposal would affect office, education, libraries, and police building types, not multi-family.
The modeling done for this report allows consideration of the impacts on these changes on potential for trade-offs if these code changes are implemented. Re-working the medium office results for WWR trade-offs, setting the standard reference case to the case with 20% LPD and 40% HVAC reduction, and recalculating the percentage LPD and HVAC reductions for the remaining data points with reductions beyond 20% (formerly 40%, 60% and 80%, now 25%, 50% and 75%), a new result chart with a new compliance target 7% below the new standard reference case is developed. Figure 3.2 shows the original medium office WWR chart with the area for this new chart outlined. Figure 3.3 is the revised chart with the new standard reference case. The revised results show that it may still be possible to achieve envelope trade-offs if additional reductions in both lighting and HVAC of 20%-40% beyond the 2015 code can be achieved corresponding to about 35% to 70% above the 2012 Seattle Code.
Figure 3.2 Medium Office WWR Graph with Area for 2015 Code Proposals
18.020.022.024.026.028.030.032.034.0
0% 20% 40% 60% 80%
EU
I, kB
tu/ft
2 ·ye
ar
LPD and HVAC Reduction from Standard Reference
Medium Office Worse than Code WWR, Better than Code LPD and HVAC
30% Code
40%
50%
60%
70%
Comply
WWRSub-area of original chart reflecting 2015 code proposals

3.9
Figure 3.3 Medium Office WWR with HVAC and LPD Reductions Beyond 2015 Code Proposals
Figures 3.5 to 3.16 that follow are the collected results of the original set of simulations for all prototypes as described in Section 3.1 of this report.
18.0
20.0
22.0
24.0
26.0
28.0
30.0
0% 25% 50% 75%
EU
I, kB
tu/ft
2 ·ye
ar
LPD and HVAC Reduction from Standard Reference
Medium Office - Modified with 2015 Code Proposals Worse than Code WWR, Better than Code LPD and HVAC
30% Code
40%
50%
60%
70%
Comply
WWR

3.10
Figure 3.5 Medium Office with WWR Trade-off
24.0
26.0
28.0
30.0
32.0
34.0
0% 20% 40% 60% 80%
EUI,
kBtu
/ft2 ·
year
LPD Reduction from Standard Reference
Medium Office Worse than Code WWR, Better than Code LPD
30% Code
40%
50%
60%
70%
Comply
WWR
18.020.022.024.026.028.030.032.034.0
0% 20% 40% 60% 80%
EUI,
kBtu
/ft2 ·
year
LPD and HVAC Reduction from Standard Reference
Medium Office Worse than Code WWR, Better than Code LPD and HVAC
30% Code
40%
50%
60%
70%
Comply
WWR
24.0
26.0
28.0
30.0
32.0
34.0
0% 20% 40% 60% 80%
EUI,
kBtu
/ft2 ·
year
HVAC Reduction from Standard Reference
Medium OfficeWorse than Code WWR, Better than Code HVAC
30% Code
40%
50%
60%
70%
Comply
WWR
3.11
Figure 3.6 Large Office with WWR Trade-off
80.082.084.086.088.090.092.094.0
0% 20% 40% 60% 80%
EUI,
kBtu
/ft2 ·
year
LPD Reduction from Standard Reference
Large Office Worse than Code WWR, Better than Code LPD
30% Code
40%
50%
60%
70%
Comply
WWR
76.078.080.082.084.086.088.090.092.094.0
0% 20% 40% 60% 80%
EUI,
kBtu
/ft2 ·
year
LPD and HVAC Reduction from Standard Reference
Large Office Worse than Code WWR, Better than Code LPD and HVAC
30% Code
40%
50%
60%
70%
Comply
WWR
80.082.084.086.088.090.092.094.0
0% 20% 40% 60% 80%
EUI,
kBtu
/ft2 ·
year
HVAC Reduction from Standard Reference
Large OfficeWorse than Code WWR, Better than Code HVAC
30% Code
40%
50%
60%
70%
Comply
WWR

3.12
Figure 3.7 Mid-rise Apartment with WWR Trade-off
30.032.034.036.038.040.042.044.046.048.050.0
0% 20% 40% 60% 80%
EUI,
kBtu
/ft2 ·
year
HVAC Reduction from Standard Reference
Mid-rise Apartment Worse than Code WWR, Better than Code HVAC
30% Code
40%
50%
60%
70%
Comply
WWR
20.024.028.032.036.040.044.048.052.0
0% 20% 40% 60% 80%
EUI,
kBtu
/ft2 ·
year
HVAC and SWH Reduction from Standard Reference
Mid-rise Apartment Worse than Code WWR, Better than Code SWH and HVAC
30% Code
40%
50%
60%
70%
Comply
WWR
30.032.034.036.038.040.042.044.046.048.050.0
0% 20% 40% 60% 80%
EUI,
kBtu
/ft2 ·
year
SWH Reduction from Standard Reference
Mid-rise Apartment Worse than Code WWR, Better than Code SWH
30% Code
40%
50%
60%
70%
Comply
WWR

3.13
Figure 3.8 High-rise Apartment with WWR Trade-off
28.030.032.034.036.038.040.042.044.046.048.050.052.0
0% 20% 40% 60% 80%
EUI,
kBtu
/ft2 ·
year
HVAC Reduction from Standard Reference
High-rise ApartmentWorse than Code WWR, Better than Code HVAC
30% Code
40%
50%
60%
70%
Comply
WWR
20.024.028.032.036.040.044.048.052.0
0% 20% 40% 60% 80%
EUI,
kBtu
/ft2 ·
year
HVAC and SWH Reduction from Standard Reference
High-rise Apartment Worse than Code WWR, Better than Code SWH and HVAC
30% Code
40%
50%
60%
70%
Comply
WWR
28.030.032.034.036.038.040.042.044.046.048.050.052.0
0% 20% 40% 60% 80%
EUI,
kBtu
/ft2 ·
year
SWH Reduction from Standard Reference
High-rise Apartment Worse than Code WWR, Better than Code SWH
30% Code
40%
50%
60%
70%
Comply
WWR

3.14
Figure 3.9 Medium Office with Wall Overall R-value Trade-off
24.025.026.027.028.029.030.031.0
0% 20% 40% 60% 80%
EUI,
kBtu
/ft2 ·
year
LPD Reduction from Standard Reference
Medium Office Worse than Code Wall R-value, Better than Code LPD
18.2 Code
13.6
9.1
4.6
Comply
Wall R-value
18.020.022.024.026.028.030.032.0
0% 20% 40% 60% 80%
EUI,
kBtu
/ft2 ·
year
LPD and HVAC Reduction from Standard Reference
Medium Office Worse than Code Wall R-value, Better than Code LPD and HVAC
18.2 Code
13.6
9.1
4.6
Comply
Wall R-value
24.025.026.027.028.029.030.031.0
0% 20% 40% 60% 80%
EUI,
kBtu
/ft2 ·
year
HVAC Reduction from Standard Reference
Medium Office Worse than Code Wall R-value, Better than Code HVAC
18.2 Code
13.6
9.1
4.6
Comply
Wall R-value

3.15
Figure 3.10 Large Office with Wall Overall R-value Trade-off
80.0
82.0
84.0
86.0
88.0
90.0
92.0
0% 20% 40% 60% 80%
EUI,
kBtu
/ft2 ·
year
LPD Reduction from Standard Reference
Large Office Worse than Code Wall R-value, Better than Code LPD
18.2 Code
13.6
9.1
4.6
Comply
Wall R-value
76.078.080.082.084.086.088.090.092.0
0% 20% 40% 60% 80%
EUI,
kBtu
/ft2 ·
year
LPD and HVAC Reduction from Standard Reference
Large Office Worse than Code Wall R-value, Better than Code LPD and HVAC
18.2 Code
13.6
9.1
4.6
Comply
Wall R-value
80.0
82.0
84.0
86.0
88.0
90.0
92.0
0% 20% 40% 60% 80%
EUI,
kBtu
/ft2 ·
year
HVAC Reduction from Standard Reference
Large Office Worse than Code Wall R-value, Better than Code HVAC
18.2 Code
13.6
9.1
4.6
Comply
Wall R-value

3.16
Figure 3.11 Mid-rise Apartment with Wall Overall R-value Trade-off
30.032.034.036.038.040.042.044.046.048.0
0% 20% 40% 60% 80%
EUI,
kBtu
/ft2 ·
year
HVAC Reduction from Standard Reference
Mid-rise Apartment Worse than Code Wall R-value and Better than Code HVAC
18.2 Code
13.6
9.1
4.6
Comply
Wall R-value
22.026.030.034.038.042.046.050.0
0% 20% 40% 60% 80%
EUI,
kBtu
/ft2 ·
year
HVAC and SWH Reduction from Standard Reference
Mid-rise Apartment Worse than Code Wall R-value, Better than Code SWH and HVAC
18.2 Code
13.6
9.1
4.6
Comply
Wall R-value
30.032.034.036.038.040.042.044.046.048.0
0% 20% 40% 60% 80%
EUI,
kBtu
/ft2 ·
year
SWH Reduction from Standard Reference
Mid-rise Apartment Worse than Code Wall R-value and Better than Code SWH
18.2 Code
13.6
9.1
4.6
Comply
Wall R-value

3.17
Figure 3.12 High-rise Apartment with Wall Overall R-value Trade-off
30.032.034.036.038.040.042.044.046.048.0
0% 20% 40% 60% 80%
EUI,
kBtu
/ft2 ·
year
HVAC Reduction from Standard Reference
High-rise Apartment Worse than Code Wall R-value, Better than Code HVAC
18.2 Code
13.6
9.1
4.6
Comply
Wall R-value
22.026.030.034.038.042.046.050.0
0% 20% 40% 60% 80%
EUI,
kBtu
/ft2 ·
year
HVAC and SWH Reduction from Standard Reference
High-rise Apartment Worse than Code Wall R-value, Better than Code SWH and HVAC
18.2 Code
13.6
9.1
4.6
Comply
Wall R-value
30.032.034.036.038.040.042.044.046.048.0
0% 20% 40% 60% 80%
EUI,
kBtu
/ft2 ·
year
SWH Reduction from Standard Reference
High-rise Apartment Worse than Code Wall R-value, Better than Code SWH
18.2 Code
13.6
9.1
4.6
Comply
Wall R-value

3.18
Figure 3.13 Medium Office with Window U-factor Trade-off
24.025.026.027.028.029.030.031.0
0% 20% 40% 60% 80%
EUI,
kBtu
/ft2 ·
year
LPD Reduction from Standard Reference
Medium Office Worse than Code Window U-factor, Better than Code LPD
0.38 Code
0.43
0.55
0.65
0.75
Comply
Window U-factor
18.020.022.024.026.028.030.032.0
0% 20% 40% 60% 80%
EUI,
kBtu
/ft2 ·
year
LPD and HVAC Reduction from Standard Reference
Medium Office Worse than Code Window U-factor, Better than Code LPD and HVAC
0.38 Code
0.43
0.55
0.65
0.75
Comply
Window U-factor
24.025.026.027.028.029.030.031.0
0% 20% 40% 60% 80%
EUI,
kBtu
/ft2 ·
year
HVAC Reduction from Standard Reference
Medium Office Worse than Code Window U-factor, Better than Code HVAC
0.38 Code
0.43
0.55
0.65
0.75
Comply
Window U-factor

3.19
Figure 3.14 Large Office with Window U-factor Trade-off
80.0
82.0
84.0
86.0
88.0
90.0
92.0
0% 20% 40% 60% 80%
EUI,
kBtu
/ft2 ·
year
LPD Reduction from Standard Reference
Large Office Worse than Code Window U-factor, Better than Code LPD
0.38 Code
0.43
0.55
0.65
0.75
Comply
Window U-factor
76.078.080.082.084.086.088.090.092.0
0% 20% 40% 60% 80%
EUI,
kBtu
/ft2 ·
year
LPD and HVAC Reduction from Standard Reference
Large Office Worse than Code Window U-factor, Better than Code LPD and HVAC
0.38 Code
0.43
0.55
0.65
0.75
Comply
Window U-factor
80.0
82.0
84.0
86.0
88.0
90.0
92.0
0% 20% 40% 60% 80%
EUI,
kBtu
/ft2 ·
year
HVAC Reduction from Standard Reference
Large Office Worse than Code Window U-factor, Better than Code HVAC
0.38 Code
0.43
0.55
0.65
0.75
Comply
Window U-factor

3.20
Figure 3.15 Mid-rise Apartment with Window U-factor Trade-off
30.032.034.036.038.040.042.044.046.0
0% 20% 40% 60% 80%
EUI,
kBtu
/ft2 ·
year
HVAC Reduction from Standard Reference
Mid-rise Apartment Worse than Code Window U-factor, Better than Code HVAC
0.38 Code
0.43
0.55
0.65
0.75
Comply
Window U-factor
20.024.028.032.036.040.044.048.0
0% 20% 40% 60% 80%
EUI,
kBtu
/ft2 ·
year
HVAC and SWH Reduction from Standard Reference
Mid-rise Apartment Worse than Code Window U-factor, Better than Code HVAC and SWH
0.38 Code
0.43
0.55
0.65
0.75
Comply
Window U-factor
30.032.034.036.038.040.042.044.046.0
0% 20% 40% 60% 80%
EUI,
kBtu
/ft2 ·
year
SWH Reduction from Standard Reference
Mid-rise Apartment Worse than Code Window U-factor, Better than Code SWH
0.38 Code
0.43
0.55
0.65
0.75
Comply
Window U-factor

3.21
Figure 3.16 High-rise Apartment with Window U-factor Trade-off
28.030.032.034.036.038.040.042.044.046.0
0% 20% 40% 60% 80%
EUI,
kBtu
/ft2 ·
year
HVAC Reduction from Standard Reference
High-rise Apartment Worse than Code Window U-factor, Better than Code HVAC
0.38 Code
0.43
0.55
0.65
0.75
Comply
Window U-factor
20.024.028.032.036.040.044.048.0
0% 20% 40% 60% 80%
EUI,
kBtu
/ft2 ·
year
HVAC and SWH Reduction from Standard Reference
High-rise Apartment Worse than Code Window U-factor, Better than Code HVAC and SWH
0.38 Code
0.43
0.55
0.65
0.75
Comply
Window U-factor
28.030.032.034.036.038.040.042.044.046.0
0% 20% 40% 60% 80%
EUI,
kBtu
/ft2 ·
year
SWH Reduction from Standard Reference
High-rise Apartment Worse than Code Window U-factor, Better than Code SWH
0.38 Code
0.43
0.55
0.65
0.75
Comply
Window U-factor


4.1
4.0 Setting an Envelope Thermal Performance Limit
One approach identified to limit trade-offs between building envelope and shorter-lived components such as lighting and HVAC using the total building performance method is to set a fixed limit on the variation of envelope parameters. For example, WWR could be limited to 45% regardless of energy savings that could be demonstrated in energy modeling from other changes to the design. A more flexible approach to this type of limit would be to set an overall building specific heat transfer, UA, limit which is the sum of the envelope component U-factors multiplied by their corresponding component areas (plus the F-factor times the perimeter length for any slab-on-grade edge). Envelope trade-offs could still be made to allow higher WWR or other components to reach particular design goals, but enhancements to other envelope components would be needed to achieve those values, in addition to lighting, HVAC or other energy reductions used to demonstrate compliance in the total building performance models.
The 2012 Seattle Energy Code (Section 402.1.3 component performance building envelope option) includes a robust methodology for calculating a UA trade-off for envelope components only as an alternative compliance path for building envelope sections of the code rather than using prescriptive envelope values. This approach is separate from the total building performance method. For this type of trade-off, a target UA, UAT, is calculated using prescriptive thermal assembly values, and a proposed UA, UAP, using the design thermal assembly values. A spreadsheet is available to support this calculation (Seattle 2015). This compliance path includes a separate similar check on SHGC for proposed and target cases.
In this study, since this analysis does not consider SHGC trade-offs, it is assumed that the SHGC is the same in the proposed and target case, and that is the case in all of the models used and in this alternative UA trade-off analysis for the total building performance path. Varying SHGC above the code maximum was not one of the common trade-offs found in the Seattle examples.
The difference with the new proposed UA limit is that the limit would be set at some percentage above the UAT, with the UAT calculated following the normal procedure in Section 402.1.3 based on the proposed design building with prescriptive code building envelope parameters used instead of the design parameters where different. This UA limit would be an addition to the total building performance compliance path. A new paragraph at Section 407.3 would be added after the requirement to achieve 93 percent of the annual energy consumption of the standard reference design. The 25% value shown underlined is described in section 4.3 of this report and other values could be used depending on the prescriptive envelope values in place and the desired outcome for a particular jurisdiction.
In addition, compliance based on total building performance requires that a proposed design building envelope component performance UAp not exceed a target building envelope component performance UAT by more than 25% calculated using the methodology in section 402.1.3. This UA calculation is separate from any UA calculation done for compliance under section 402.1.3 and only applies as part of the total building performance method.

4.2
4.1 Building Envelope Thermal Performance and UA Values
To support the setting of this percentage limit, this report section includes information on the UA for three prototypes, medium office, mid-rise and high-rise apartment analyzed in Section 3 of this report , with UA values, presented for each of the WWR, overall wall R-factor (in terms of the corresponding U-values), and window U-factor iterations considered in the energy simulations. Table 4.1 includes the UA values and the percentage change in UA with each change in an envelope parameter.
Table 4.1 UA Values with Varying Envelope Component Values
Envelope Trade-off Values
Medium Office Mid-rise Apartment High-rise Apartment
UA Btu/h·̊F
Change in UA
UA Btu/h·̊F
Change in UA
UA Btu/h·̊F
Change in UA
WW
R
30% 3,996 NA 2,966 NA 6,763 NA 40% 4,688 17.3% 3,506 18.2% 8,112 19.9% 50% 5,380 34.6% 4,045 36.4% 9,460 39.9% 60% 6,071 52.0% 4,585 54.6% 10,809 59.8% 70% 6,763 69.3% 5,124 72.7% 12,157 79.8%
Wal
l
R-v
alue
/
U-v
alue
18.18/0.055 3,996 NA 2,966 NA 6,763 NA 13.64/0.073 4,264 6.7% 3,175 7.1% 7,286 7.7% 9.09/0.110 4,815 20.5% 3,605 21.5% 8,361 23.6% 4.55/0.220 6,455 61.5% 4,883 64.6% 11,556 70.9%
Win
dow
U-f
acto
r
0.38 3,996 NA 2,966 NA 6,763 NA 0.43 4,315 8.0% 3,215 8.4% 7,386 9.2% 0.55 5,081 27.2% 3,813 28.5% 8,879 31.3% 0.65 5,720 43.2% 4,311 45.3% 10,124 49.7% 0.75 6,359 59.1% 4,809 62.1% 11,369 68.1%
Setting a single UA limit for all buildings requires some consistency between building types. There is some variability between the three prototypes considered as shown in Table 4.1. Figure 4.1, based on the percentage change UA for all of the steps in envelope trade-off for all three envelope characteristics and all three prototypes shows there is reasonable consistency. This figure shows that the high-rise apartment overall UA is more affected by these envelope step changes. For example, in the first graph in Figure 4.1, in the circled region, at the 40% UA limit shown on the vertical axis, the corresponding WWR is lower for the high-rise apartment, about 50% (at green triangle), then it is for mid-rise apartment and medium office which have a corresponding WWR of about 52% at the 40% UA limit. So a limit set based on the medium office impact will be a somewhat stricter limit for the high-rise apartment.

4.3
Abbreviations: MO medium office, MA mid-rise apartment, HA high-rise apartment, WWR window to wall ration, Win U window U-factor, Wall U overall wall U-value.
Figure 4.1 Changes in UA Value with Varying Envelope Parameters
Medium Office
Trade-off Values UA Change EUI Change
Peak Demand,
kW Change
Cooling Capacity
, tons Change
Heating Capacity, kBtu/hr
Change
MO WWR 30% 3,996 0.0% 28.7 0.0% 180 0.0% 62 0.0% 825 0.0%40% 4,688 17.3% 29.3 2.1% 197 9.4% 67 8.1% 874 5.9%50% 5,380 34.6% 30.3 5.6% 206 14.4% 72 16.1% 927 ###60% 6,071 52.0% 30.7 7.0% 219 21.7% 75 21.0% 949 ###70% 6,763 69.3% 32.2 12.2% 233 29.4% 81 30.6% 1025 ###
MO Win U 0.38 3,996 0.0% 28.7 0.0% 180 0.0% 62 0.0% 825 0.0%0.43 4,315 8.0% 29 1.0% 184 2.2% 65 4.8% 851 3.2%0.55 5,081 27.2% 29.4 2.4% 188 4.4% 64 3.2% 853 3.4%0.65 5,720 43.2% 29.9 4.2% 194 7.8% 65 4.8% 872 5.7%0.75 6,359 59.1% 30 4.5% 200 11.1% 65 4.8% 883 7.0%
MO Wall U 18.18/0.055 0.06 3,996 0.0% 28.7 0.0% 180 0.0% 62 0.0% 825 0.0%13.64/0.073 0.07 4,264 6.7% 28.9 0.7% 183 1.7% 62 0.0% 834 1.1%9.09/0.110 0.11 4,815 20.5% 29.4 2.4% 191 6.1% 63 1.6% 856 3.8%4.55/0.220 0.22 6,455 61.5% 30.5 6.3% 214 18.9% 66 6.5% 925 ###
Mid rise Apartment
WW
RW
indo
w
U
-fac
tor
Wal
l
R-v
alue
/
U-v
alue
0%
10%
20%
30%
40%
50%
60%
70%
80%
90%
30% 40% 50% 60% 70%
Cha
nge
in U
A,
%
Window to Wall Ratio
UA Varying with WWR
MO WWR MA WWR
HA WWR
0%
10%
20%
30%
40%
50%
60%
70%
80%
0.30 0.50 0.70
Cha
nge
in U
A,
%
Window U-factor, Btu/h·ft2·°F
UA Varying with Window U-factor
MO Win U MA Win U
HA Win U
0%
10%
20%
30%
40%
50%
60%
70%
80%
0.00 0.10 0.20 0.30C
hang
e in
UA
, %
Wall U-value, Btu/h·ft2·°F
UA Varying with Wall U-value
MO Wall U MA Wall U
HA Wall U

4.4
4.2 UA Impacts on Energy, HVAC Capacity and Electricity Demand
Envelope changes affect energy, HVAC capacity and electricity demand. This Section explores the correlation of the range of UA values described in section 4.1 with the energy modeling described in Section 3 of this report. Figure 4.2 shows this correlation for one example, medium office with changing WWR. The full set of results for all three prototypes and the range of envelope variations for WWR, wall R-value and window U-factor are listed in Tables 4.4 to 4.6 at the end of Section 4 of this report. This figure highlights that the EUI percentage change is substantially less that the change in UA value. This figure also shows that the envelope changes have a significant effect on peak HVAC capacity, which may increase the size and expense of HVAC systems making them more expensive to upgrade in the future. Note that lowering SHGC could offset some or all of the cooling load peak increase caused by increasing WWR.
Figure 4.2 Medium Office UA and Model Results with Varying WWR
Figure 4.2 shows a correlation between the increases in cooling capacity with increases in peak electricity demand. This correlation is not consistent between the prototypes. In some case peak demand rises very little with significant increases in cooling capacity. This variability in the impact of the envelope changes on peak demand, and the fact that in the case of the medium office the change in peak electricity demand is substantially greater than the change in energy usage (in the form of the EUI) suggests the total building performance method consider impacts on peak electricity demand. Currently, it considers only site energy usage. Peak demand affects the cost of power systems in buildings and the cost of plant capacity for the utility.
Figure 4.3 shows percentage changes in EUI compared to percentage changes in UA value (shown in Table 4.1) for each of the three prototypes and the three types of envelope changes. Using the % change in UA allows comparisons between EUIs with different envelope type variations. The impact of the envelope changes on EUI is greatest with WWR for each prototype, probably because the increased window area allows increased solar heat gains and has a major impact on both heating and cooling. The
0.0%
10.0%
20.0%
30.0%
40.0%
50.0%
60.0%
70.0%
80.0%
30% 40% 50% 60% 70%
Cha
nge
in R
esul
ts
WWR
Medium Office with Varying WWR
UA
EUI
Electricity, Demand
Cooling Capacity
Heating Capacity

4.5
discussion on setting a UA limit in Section 4.3 of this report focusses on WWR partly because of this greater impact on EUI compared to the other envelope changes considered. Wall R-value has the second biggest impact on EUI followed by window U-factor, when compared based on percentage change is UA value. The figure also shows that the mid-rise and high-rise building EUIs are more sensitive to changes in UA than the medium office.
Figure 4.3 Changes in UA and EUI Results
Figure 4.4 shows the percentage change in peak cooling capacity and EUI with changes in UA due to changes in WWR across the three prototypes. Cooling capacity increases by about the same percentage as UA percentage increases for the mid-rise and high-rise apartments and at about half the percentage change in UA for the medium office. This is substantially more than the corresponding EUI changes. The changes in UA from all of the three types of envelope changes correlate with substantial increases in both cooling and heating capacity in nearly all of the cases considered. The average change in cooling capacity is 2.7 times the change in EUI and the average change in heating capacity is 2.3 times the change in EUI.
0.0%
2.0%
4.0%
6.0%
8.0%
10.0%
12.0%
14.0%
16.0%
18.0%
20.0%
0.0% 20.0% 40.0% 60.0% 80.0% 100.0%
Cha
nge
in E
UI
Change in UA with Changes in Envelope Parameters
Effect of Changes in UA on EUI
MO WWR
MO Wall R-value
MO Window U-factor
MA WWR
MA Wall R-value
MA Window U-factor
HA WWR
HA Wall R-value
HA Window U-factor

4.6
Figure 4.4 Effect on Cooling Capacity and EUI as UA Increases with WWR
4.3 Setting a UA Limit
Part of the drive for considering the UA limit approach is that buildings with larger WWR are pursuing the total building performance path. As described in Section 2 of this report, most of the multi-family buildings following this path had WWR values above 30%. The largest value was 43%. There was also a trend over the period of time the examples were drawn from that the more recent multi-family buildings tended to have larger WWR ratios. One approach to setting a UA limit would be to restrict the ability to increase WWR substantially above the current maximum of the example projects. Focusing on WWR also makes sense as it appears to have a disproportionate impact on peak cooling and heating capacity as described in Section 4.2. Table 4.2 shows the medium office WWR values and associated modeling results from Table 4.4 with interpolated values in blue italics for UA values at 5% intervals.
WWR is a useful proxy for focusing the setting of a UA limit. However, it is important to recognize that both the area (A) and the component U-value (U) can be changed. The WWR target value could be exceeded if some other envelope characteristic is also improved beyond code. For example, if triple pane windows were included, the WWR could be higher. Setting a limit does not restrict how that limit is reached. Setting a UA limit restricts the combination of area and thermal performance.
0.0%
10.0%
20.0%
30.0%
40.0%
50.0%
60.0%
70.0%
80.0%
0.0% 20.0% 40.0% 60.0% 80.0% 100.0%
Cha
nge
in C
oolin
g C
apac
ity a
nd E
UI
Change in UA with Varying WWR
Cooling Capacity and EUI With Varying UA and WWR
MO Cooling Capacity
MO EUI
MA Cooling Capacity
MA EUI
HA Cooling Capacity
HA EUI

4.7
Table 4.2 Medium Office UA Interpolation with Varying WWR
WWR
UA Btu/ h·̊F
UA Change EUI
EUI Change
Peak Demand
kW
Peak Demand Change
Cooling Capacity
tons
Cooling Capacity Change
Heating Capacity kBtu/hr
Heating Capacity Change
30.0% 3,996 0.0% 28.7 0.0% 180 0.0% 62 0.0% 825 0.0%
35.8% 4,395 10.0% 29.0 1.2% 190 5.5% 65 4.7% 853 3.4%
38.7% 4,595 15.0% 29.2 1.8% 195 8.2% 66 7.0% 867 5.1%
40.0% 4,688 17.3% 29.3 2.1% 197 9.4% 67 8.1% 874 5.9%
41.5% 4,795 20.0% 29.5 2.6% 198 10.2% 68 9.3% 882 6.9%
44.4% 4,995 25.0% 29.7 3.6% 201 11.7% 69 11.6% 898 8.8%
47.3% 5,194 30.0% 30.0 4.6% 204 13.1% 71 14.0% 913 10.6%
50.0% 5,380 34.6% 30.3 5.6% 206 14.4% 72 16.1% 927 12.4%
50.2% 5,394 35.0% 30.3 5.6% 206 14.6% 72 16.2% 927 12.4%
53.1% 5,594 40.0% 30.4 6.0% 210 16.7% 73 17.6% 934 13.2%
60.0% 6,071 52.0% 30.7 7.0% 219 21.7% 75 21.0% 949 15.0%
70.0% 6,763 69.3% 32.2 12.2% 233 29.4% 81 30.6% 1025 24.2%
Table 4.3 shows the interpolated maximum envelope component values for all three envelope parameters and prototypes considered that would be possible if only one envelope component type at a time were varied outside the prescriptive values shown in 5% increments of UA values. The allowed values are similar across the three prototypes for a given UA limit value. This suggests that a common UA limit could be applied to all prototypes with similar impact. Further review of a larger variety of building types is warranted to validate this observation.
Picking a limit remains a judgement call based on desired outcome as there is not an obvious inflection point in the energy or other impacts of varying the UA. However, the impact of weak building envelopes described in this section, and the potential for allowing weak building envelopes described in Section 3 using the total performance method support setting a limit at some value. Section 3 of this report shows that buildings with 70% WWR (all other components at prescriptive code) might be possible under the total building performance method, which corresponds to a UA increase of nearly 70%. The Seattle code development team has suggested that the goal may be to limit the UA so that thermal envelopes cannot be any weaker than those currently going through the total building performance approach and still comply.
Before this project, a limit of 10% increase to UA value was proposed as a limit on the total building performance method. Table 4.3 shows that this 10% limit may be too small if the goal is to set an upper boundary on the total performance method similar to what has been allowed historically to prevent even weaker building envelopes. As shown in Section 2 of this report, total building performance projects have included up to a 43% WWR with window U-value and other envelope components close to code. A 10% limit would not allow WWR above about 35% without improvements to window performance or other thermal envelope components such as wall insulation. This 35% WWR value is for the most restrictive case, high-rise apartment; none of the prototypes could reach 40% WWR, the first tier in the modeling analysis and close to code 30%, without other envelope changes.

4.8
Table 4.3 Potential UA Limit Values and Corresponding Maximum Envelope Trade-offs
UA Increase
Limit
Maximum Envelope Values with Limit Medium Office
Mid-Rise Apartment
High-rise Apartment
WW
R
10.0% 35.8% 35.5% 35.0% 15.0% 38.7% 38.2% 37.5% 20.0% 41.5% 41.0% 40.0% 25.0% 44.4% 43.7% 42.5% 30.0% 47.3% 46.5% 45.0% 35.0% 50.2% 49.2% 47.6% 40.0% 53.1% 52.0% 50.1%
Wal
l R-v
alue
h·
ft2 ·̊F/B
tu
10.0% 12.22 12.42 12.77 15.0% 10.50 10.72 11.12 20.0% 9.21 9.43 9.85 25.0% 8.19 8.42 8.83 30.0% 7.38 7.60 8.01 35.0% 6.72 6.93 7.33 40.0% 6.16 6.36 6.75
Win
dow
U-f
acto
r B
tu/h
·ft2 ·̊F
10.0% 0.443 0.440 0.434 15.0% 0.474 0.469 0.461 20.0% 0.505 0.514 0.489 25.0% 0.536 0.529 0.516 30.0% 0.568 0.559 0.543 35.0% 0.599 0.589 0.570 40.0% 0.630 0.618 0.597
A UA limit value of 25% above the UAT appears to be a restriction that would place a boundary about where buildings recently complying under the total building performance method are at. This would limit WWR to 42.5% for the most restricted case, the high-rise apartment without other envelope changes, such as better windows, or more wall insulation. If all other envelope values were left at prescriptive code, window U-factor would be limited to 0.52 which will still require a thermal break for metal framed double-paned windows and probably some level of low-e coating. Wall overall R-value would be limited to R-8.8. This UA limit will still allow significant flexibility in designs which want to vary from the prescriptive code while restricting weaker envelopes that may be possible with current and future energy efficiency technology. Note that this would restrict a building from having both a 42.5% WWR and worse that code wall U-value elements such as uninsulated slab edges. Some of the buildings in the Seattle examples had both of these types of worse-than-code envelope components.
Setting a UA limit lower than 25% would restrict projects to lower than the WWR of the highest WWR buildings that have recently passed code under the total performance method. There would certainly be energy and carbon savings, and reduced HVAC equipment capacity benefits to doing that. Tables 4.2 and 4.3 can help inform a decision to set a more restrictive UA limit.

4.9
Starting with a value of greater than 25% and then lowering it in steps, perhaps every 18 months in a three year code cycle may help alleviate concern and resistance to implementing a UA limit of this type. For example, initially a value of 30% could be used, lowered to 25% half way through the first code cycle it is implemented. Potentially it could be lowered to 20% at the beginning of the next cycle and then be reduced even further if desired. The limit would also effectively be lowered if prescriptive code values become stricter because the baseline UA value would go down.
Although SHGC trade-offs were not included in this analysis, because such trade-offs were not seen in the total building performance project examples, lowering SHGC is a legitimate way to offset part or all of the peak cooling impact of increased WWR. Allowing credit to increase the UA limit for reductions in SHGC below code maximum values is worth considering. This may be particularly important for office buildings which tend to be cooling dominant. Further analysis would be needed to quantify this potential credit. The current envelope only trade-off option in the Seattle and Washington code treats UA and SHGC trade-offs separately and does not adjust the UA with improvements in SHGC.
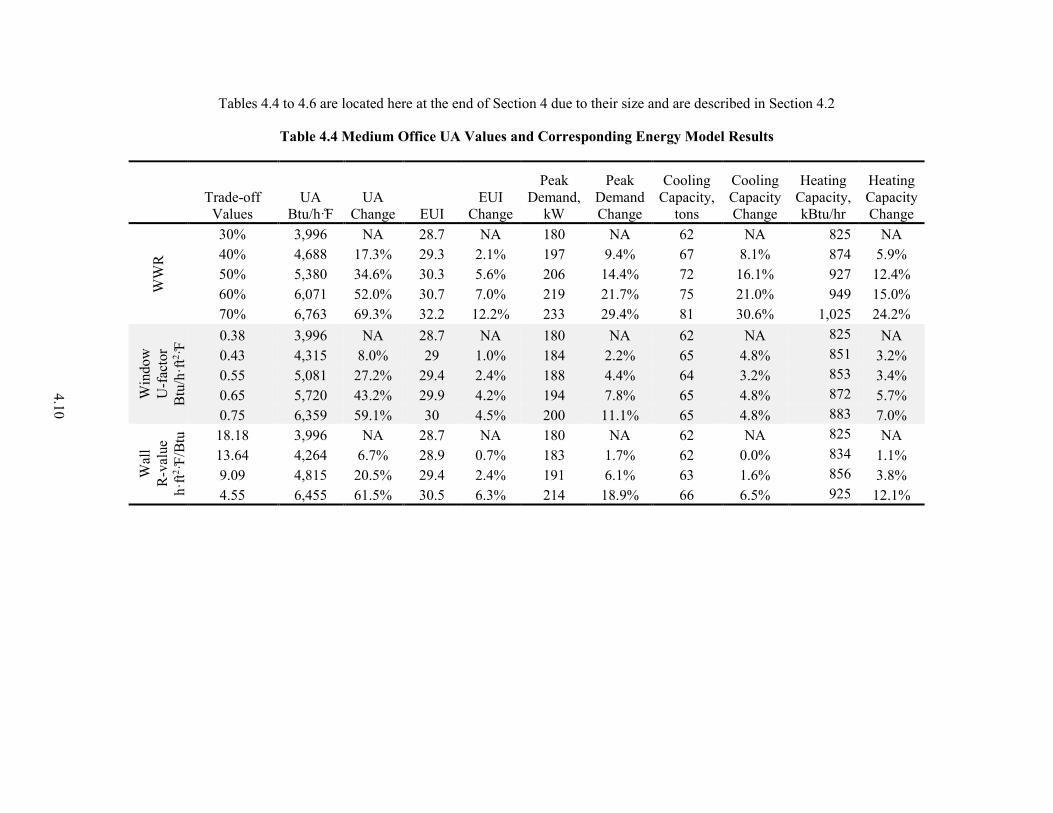
4.10
Tables 4.4 to 4.6 are located here at the end of Section 4 due to their size and are described in Section 4.2
Table 4.4 Medium Office UA Values and Corresponding Energy Model Results
Trade-off
Values UA
Btu/h·̊F UA
Change EUI EUI
Change
Peak Demand,
kW
Peak Demand Change
Cooling Capacity,
tons
Cooling Capacity Change
Heating Capacity, kBtu/hr
Heating Capacity Change
WW
R
30% 3,996 NA 28.7 NA 180 NA 62 NA 825 NA 40% 4,688 17.3% 29.3 2.1% 197 9.4% 67 8.1% 874 5.9% 50% 5,380 34.6% 30.3 5.6% 206 14.4% 72 16.1% 927 12.4% 60% 6,071 52.0% 30.7 7.0% 219 21.7% 75 21.0% 949 15.0% 70% 6,763 69.3% 32.2 12.2% 233 29.4% 81 30.6% 1,025 24.2%
Win
dow
U-f
acto
r B
tu/h
·ft2 ·̊F
0.38 3,996 NA 28.7 NA 180 NA 62 NA 825 NA 0.43 4,315 8.0% 29 1.0% 184 2.2% 65 4.8% 851 3.2% 0.55 5,081 27.2% 29.4 2.4% 188 4.4% 64 3.2% 853 3.4% 0.65 5,720 43.2% 29.9 4.2% 194 7.8% 65 4.8% 872 5.7% 0.75 6,359 59.1% 30 4.5% 200 11.1% 65 4.8% 883 7.0%
Wal
l
R-v
alue
h·
ft2 ·̊F/B
tu 18.18 3,996 NA 28.7 NA 180 NA 62 NA 825 NA
13.64 4,264 6.7% 28.9 0.7% 183 1.7% 62 0.0% 834 1.1% 9.09 4,815 20.5% 29.4 2.4% 191 6.1% 63 1.6% 856 3.8% 4.55 6,455 61.5% 30.5 6.3% 214 18.9% 66 6.5% 925 12.1%

4.11
Table 4.5 Mid-rise Apartment UA Values and Corresponding Energy Model Results
Trade-off
Values UA
Btu/h·̊F UA
Change EUI EUI
Change
Peak Demand,
kW
Peak Demand Change
Cooling Capacity,
tons
Cooling Capacity Change
Heating Capacity, kBtu/hr
Heating Capacity Change
WW
R
30% 2,966 NA 41.6 NA 82 NA 29 NA 214 NA 40% 3,506 18.2% 43.6 4.8% 86 4.9% 35 20.7% 233 8.9% 50% 4,045 36.4% 45.4 9.1% 90 9.8% 40 37.9% 251 17.3% 60% 4,585 54.6% 47.4 13.9% 94 14.6% 46 58.6% 276 29.0% 70% 5,124 72.7% 49.0 17.8% 94 14.6% 50 72.4% 296 38.3%
Win
dow
U-f
acto
r B
tu/h
·ft2 ·̊F
0.38 2,966 NA 41.6 NA 82 NA 29 NA 214 NA 0.43 3,215 8.4% 42.4 1.9% 84 2.4% 33 13.8% 216 0.9% 0.55 3,813 28.5% 42.7 2.6% 84 2.4% 31 6.9% 229 7.0% 0.65 4,311 45.3% 43.6 4.8% 83 1.2% 32 10.3% 241 12.6% 0.75 4,809 62.1% 44.1 6.0% 81 -1.2% 33 13.8% 248 15.9%
Wal
l
R-v
alue
h·ft2 ·̊F
/Btu
18.18 2,966 NA 41.6 NA 82 NA 29 NA 214 NA 13.64 3,175 7.1% 42.1 1.2% 82 0.0% 30 3.4% 222 3.7% 9.09 3,605 21.5% 43.1 3.6% 81 -1.2% 31 6.9% 237 10.7% 4.55 4,883 64.6% 46.3 11.3% 83 1.2% 35 20.7% 290 35.5%
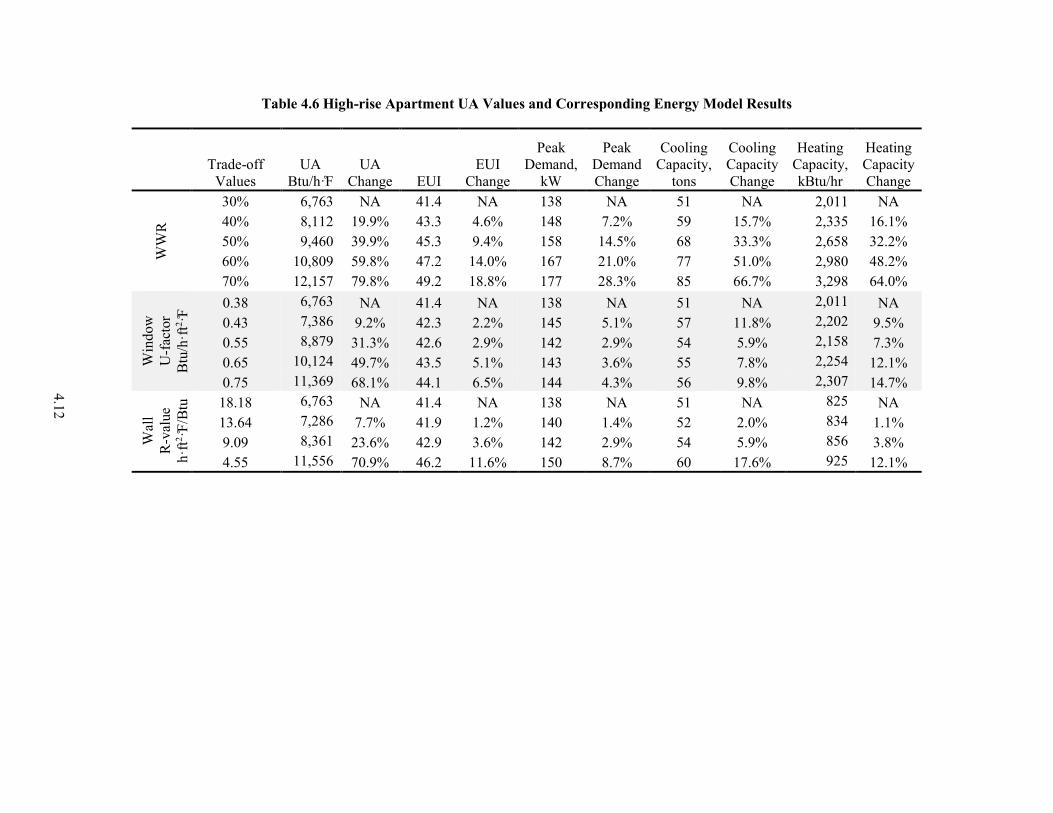
4.12
Table 4.6 High-rise Apartment UA Values and Corresponding Energy Model Results
Trade-off
Values UA
Btu/h·̊F UA
Change EUI EUI
Change
Peak Demand,
kW
Peak Demand Change
Cooling Capacity,
tons
Cooling Capacity Change
Heating Capacity, kBtu/hr
Heating Capacity Change
WW
R
30% 6,763 NA 41.4 NA 138 NA 51 NA 2,011 NA 40% 8,112 19.9% 43.3 4.6% 148 7.2% 59 15.7% 2,335 16.1% 50% 9,460 39.9% 45.3 9.4% 158 14.5% 68 33.3% 2,658 32.2% 60% 10,809 59.8% 47.2 14.0% 167 21.0% 77 51.0% 2,980 48.2% 70% 12,157 79.8% 49.2 18.8% 177 28.3% 85 66.7% 3,298 64.0%
Win
dow
U-f
acto
r B
tu/h
·ft2 ·̊F
0.38 6,763 NA 41.4 NA 138 NA 51 NA 2,011 NA 0.43 7,386 9.2% 42.3 2.2% 145 5.1% 57 11.8% 2,202 9.5% 0.55 8,879 31.3% 42.6 2.9% 142 2.9% 54 5.9% 2,158 7.3% 0.65 10,124 49.7% 43.5 5.1% 143 3.6% 55 7.8% 2,254 12.1% 0.75 11,369 68.1% 44.1 6.5% 144 4.3% 56 9.8% 2,307 14.7%
Wal
l
R-v
alue
h·ft2 ·̊F
/Btu
18.18 6,763 NA 41.4 NA 138 NA 51 NA 825 NA 13.64 7,286 7.7% 41.9 1.2% 140 1.4% 52 2.0% 834 1.1% 9.09 8,361 23.6% 42.9 3.6% 142 2.9% 54 5.9% 856 3.8% 4.55 11,556 70.9% 46.2 11.6% 150 8.7% 60 17.6% 925 12.1%

5.1
5.0 Lifetime Building Energy Usage
The most direct and potentially quantifiable impact of using the total building performance method to trade-off longer life building envelope components for shorter life more efficient lighting, HVAC and other building components is to increase building energy usage over the life of the building as described in the introduction to this report. The most robust way to quantify this would be to require total building performance applicants to develop a full life cycle analysis and demonstrate that life time energy usage is equivalent between the proposed building and the standard reference building. Washington State has multiple programs that require financial and energy life cycle cost analysis for some public building projects including the Energy Life Cycle Cost Analysis through the Department of Enterprise Services and the Life Cycle Cost Tool through the Office of Financial Management (Washington State 2015b and c). A simpler approach may be to group all building envelope components into one measure life and all other components into one measure life, and then weight the energy impacts of each group by the corresponding measure life.
This simpler approach involves treating the envelope as having an average 40 year useful life for all components, and combining all other building components including HVAC and lighting into a 20 year useful life. This is a gross simplification, but it reflects a general tendency of the building envelope components to last longer than the HVAC, lighting and other energy generating and using components in the building. The Internal Revenue Service (IRS) allows useful life values for component depreciation with new construction of 40 years for the building shell, 10 years for heating and air conditioning systems, and 15 years for plumbing, wiring and elevators (IRS, 2015). ASHRAE publishes a list of median service lives for HVAC systems and equipment which shows most components have 10 to 30 year lives (ASHRAE 2011). Fannie Mae, the property loan firm, offers a list targeted at multi-family buildings which support these ranges (Fannie Mae 2015). This provides a simplified basis for weighting the energy impact of the building envelope at two times the energy impact of the other components in the building.
This approach considers the energy usage impact of the alternatives consistent with the Seattle Energy Code, not energy cost and no time-value-of-money discount is applied to the value of energy in this simplified proposal. This approach assumes that the environmental impact of energy usage in future years is just as important as the environmental impact of energy usage in the near term. A full life cycle cost analysis based on energy cost would be more appropriate if a discount factor is considered necessary and properly account for the specific lives of all elements of the building discounted to the present. Washington’s Life Cycle Cost Tool noted above includes an assessment of societal impact in terms of carbon dioxide, and does apply a discount factor. In the current version, it uses a combined real discount rate of 2.07% incorporating inflation and a nominal discount rate (Washington 2015c). With this real discount rate, the last 20 years of a 40 year life would be discounted to 81% of its current value.
It may be appropriate to modify the analysis for certain high efficiency HVAC system types. For example, ground-coupled or geothermal heat pumps are an extremely efficient HVAC system, especially when coupled with DOAS. While the life of the individual heat pump units may be similar to other heat pumps, the major expense of that system, the bore field that is the heat sink or source may have piping warrantied to 25 to 50 years (DOE FEMP 2012). Even the individual heat pumps may be expected to last longer without the outdoor exposure of an air-source unit and sturdier design for wider geothermal loop temperature swings. So even though components of the system will be replaced on a shorter time span,

5.2
the inherent efficiency of the overall system will be maintained in line with envelope components, and it would be very difficult to switch to a lower efficiency system type after 20 years. A similar consideration may be made the choice of a water-cooled chiller system vs. an air cooled system. Once the system is in place, the components will be replaced with similar components to maintain the overall system efficiency improvement. The impact of these longer life specified system components could be included in a simplified envelope impact model and offset lost savings from worse-than-code envelope components but this would require assessing the energy impact of these components separately and weighting them appropriately which this proposed simplified approach does not include.
With the proposed simplified approach, the energy impact of the grouped envelope components can be calculated by separating them out from the proposed design model. A requirement would be added to the total building performance method to create an additional model, with all envelope components including thermal performance and window areas set at the prescriptive code values. The energy result of the original proposed design model is subtracted from the energy result of the proposed design model with prescriptive code envelope input. This difference is considered the envelope energy impact and will be a positive number for proposed design envelopes that are weaker than the prescriptive code.
The calculated envelope energy impact is added to the original proposed design result, referred to as the adjusted proposed design result. This doubles the effective energy impact of the envelope design since it is already incorporated into the original proposed design model once. Notice that if the envelope is better than code, the envelope impact will be a negative number. Code could be written to allow this as a reduction to the original proposed design result allowing other non-envelope components to be less efficient than might otherwise be required to demonstrate compliance, or could limit use of this approach only to proposed designs with envelopes that are weaker than the prescriptive code.
A mid-rise apartment example helps illustrate this approach.
• Mid-rise Apartment – 50% WWR, 60% reduction in SWH only (solar, efficient fixtures)
• Standard Reference Building – 30% WWR, no reduction in SWH and HVAC
Table 5.1 shows a calculation of the envelope impact and the adjusted proposed design for this example. In this case, the original proposed design demonstrates at least 7% savings from the standard reference building and complies. But when the envelope impact is added, the adjusted proposed design result no longer complies.
Table 5.1 Example of Envelope Impact Adjustment on Compliance
Envelope Impact Calculation Steps EUI kBtu/ft2·year
A. Standard Reference Design 41.6 B. Compliance Target (7% savings) 38.7 C. Proposed Design (complies) 38.3 D. Proposed Design with 30% WWR 34.6 E. Envelope Impact (C – D) 3.8 F. Adjusted Proposed Design (C + E) (doesn’t comply) 42.1
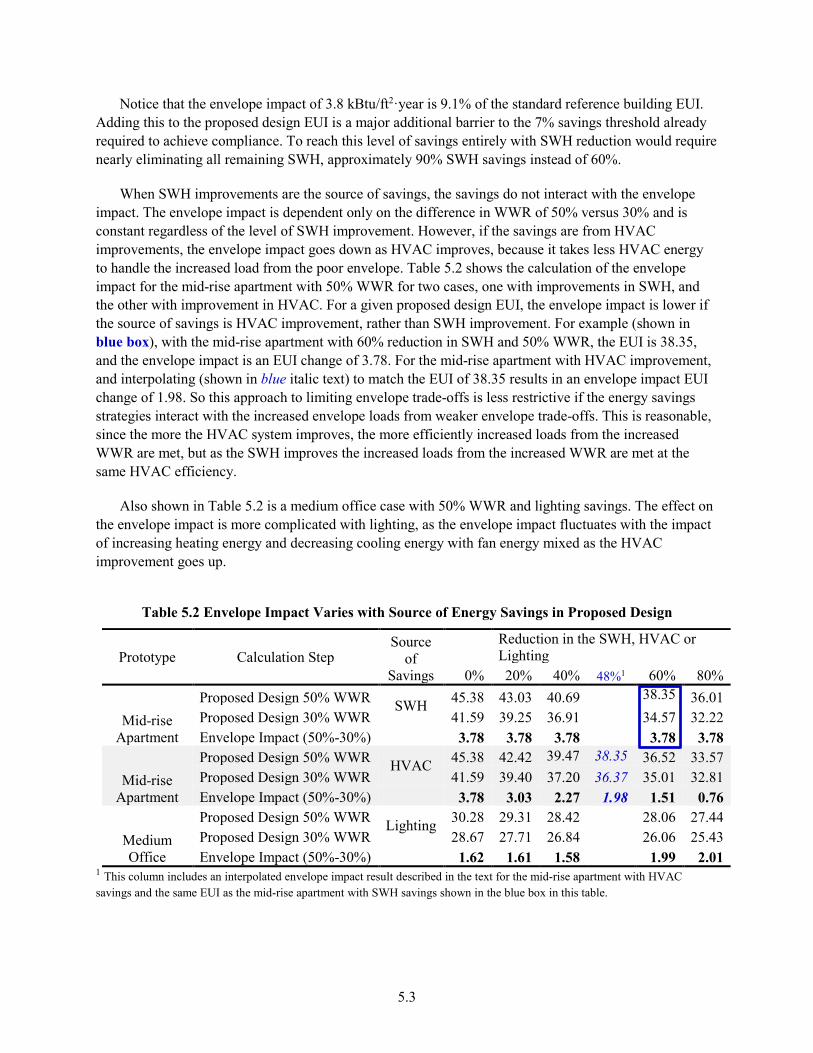
5.3
Notice that the envelope impact of 3.8 kBtu/ft2·year is 9.1% of the standard reference building EUI. Adding this to the proposed design EUI is a major additional barrier to the 7% savings threshold already required to achieve compliance. To reach this level of savings entirely with SWH reduction would require nearly eliminating all remaining SWH, approximately 90% SWH savings instead of 60%.
When SWH improvements are the source of savings, the savings do not interact with the envelope impact. The envelope impact is dependent only on the difference in WWR of 50% versus 30% and is constant regardless of the level of SWH improvement. However, if the savings are from HVAC improvements, the envelope impact goes down as HVAC improves, because it takes less HVAC energy to handle the increased load from the poor envelope. Table 5.2 shows the calculation of the envelope impact for the mid-rise apartment with 50% WWR for two cases, one with improvements in SWH, and the other with improvement in HVAC. For a given proposed design EUI, the envelope impact is lower if the source of savings is HVAC improvement, rather than SWH improvement. For example (shown in blue box), with the mid-rise apartment with 60% reduction in SWH and 50% WWR, the EUI is 38.35, and the envelope impact is an EUI change of 3.78. For the mid-rise apartment with HVAC improvement, and interpolating (shown in blue italic text) to match the EUI of 38.35 results in an envelope impact EUI change of 1.98. So this approach to limiting envelope trade-offs is less restrictive if the energy savings strategies interact with the increased envelope loads from weaker envelope trade-offs. This is reasonable, since the more the HVAC system improves, the more efficiently increased loads from the increased WWR are met, but as the SWH improves the increased loads from the increased WWR are met at the same HVAC efficiency.
Also shown in Table 5.2 is a medium office case with 50% WWR and lighting savings. The effect on the envelope impact is more complicated with lighting, as the envelope impact fluctuates with the impact of increasing heating energy and decreasing cooling energy with fan energy mixed as the HVAC improvement goes up.
Table 5.2 Envelope Impact Varies with Source of Energy Savings in Proposed Design
Prototype Calculation Step Source
of Savings
Reduction in the SWH, HVAC or Lighting
0% 20% 40% 48%1 60% 80%
Mid-rise Apartment
Proposed Design 50% WWR SWH 45.38 43.03 40.69 38.35 36.01 Proposed Design 30% WWR 41.59 39.25 36.91 34.57 32.22 Envelope Impact (50%-30%) 3.78 3.78 3.78 3.78 3.78
Mid-rise Apartment
Proposed Design 50% WWR HVAC 45.38 42.42 39.47 38.35 36.52 33.57 Proposed Design 30% WWR 41.59 39.40 37.20 36.37 35.01 32.81 Envelope Impact (50%-30%) 3.78 3.03 2.27 1.98 1.51 0.76
Medium Office
Proposed Design 50% WWR Lighting 30.28 29.31 28.42 28.06 27.44 Proposed Design 30% WWR 28.67 27.71 26.84 26.06 25.43 Envelope Impact (50%-30%) 1.62 1.61 1.58 1.99 2.01
1 This column includes an interpolated envelope impact result described in the text for the mid-rise apartment with HVAC savings and the same EUI as the mid-rise apartment with SWH savings shown in the blue box in this table.
5.4
The envelope impact adjustment approach to limiting envelope trade-offs has the advantage of adjusting to the actual impact of the weak envelope on the building with the energy savings strategies applied unlike the UA limit approach. The disadvantage is that with higher efficiency HVAC designs, it becomes a more modest barrier to weak envelopes. This strategy, unlike the UA limit approach, would create some incentive for more efficient HVAC systems, while preventing large variations from prescriptive code envelope components.

6.1
6.0 Conclusions
A number of Seattle building projects, primarily multi-family and office buildings, have used the total building performance path to vary building components from the prescriptive energy code requirements. Of particular interest to this study is the impact on this compliance path on building envelopes. The projects that have used this code compliance path have generally not gone to extremes and the largest variation in one envelope element is 43% WWR versus the prescriptive limit of 30% WWR (with the normal window U-factor limit). The average savings of the proposed designs compared to the standard reference buildings is 15.6% which is significantly higher than the 7% savings margin required for compliance. This study shows that this difference is enough that significantly more extreme variations from prescriptive envelope code values are possible with total performance savings of this magnitude and that even higher modeled savings and envelope variance are possible perhaps even as much as 70% WWR. Such variances could result in substantially compromised long term building energy performance, large increases in required HVAC system capacities, and potentially greater HVAC system design complexity to handle larger perimeter conditioning requirements.
Placing limits on the ability of the total building performance path to allow compromised building envelopes is recommended. The envelope components last longer than other building components generally, and are less likely to be retrofit over time as energy codes tighten, new energy savings technologies arise and society moves toward carbon-neutral buildings and cities.
There are multiple ways to place such limits including code changes to the prescriptive path and for the total building performance method that address loopholes in fan energy modeling, and opportunities to improve lighting, HVAC and SWH equipment. The proposed changes underway for the Washington Code and added to in Section 2 of this report include LPD reductions, requirements for DOAS for some building types and changes in the HVAC approach and fan modeling rules to reduce fan energy use, if adopted, would make it more difficult to achieve significantly worse-than-code envelope components. In addition, if research on actual performance of condensing water heaters was undertaken and proper modeling guidance provided, the savings from service water heating efficiency claimed would likely be reduced. Tightening these other modeling allowances that can produce relative easy savings has a direct impact on how much envelope tradeoff can be employed. In commercial buildings, the impact of SHGC on cooling should also be considered.
Direct limits on the amount of variance from prescriptive envelope requirements could also be considered for the total building performance path such as a limit on total building thermal envelope UA values, and adjusting the proposed design energy usage to place higher weight on the envelope energy impact since those components last longer than other components such as HVAC and lighting, perhaps twice as long on average.


7.1
7.0 References
10 CFR 431. 2015. Chapter 10, Code of Federal Regulations, Part 431. Energy Efficiency Program for Certain Commercial and Industrial Equipment. U.S. Department of Energy, Washington, D.C. Available at http://www.ecfr.gov/cgi-bin/text-idx?tpl=/ecfrbrowse/Title10/10cfr431_main_02.tpl.
ANSI/ASHRAE/IESNA. 2010. ANSI/ASHRAE/IESNA 90.1-2010, Energy Standard for Buildings Except Low-Rise Residential Buildings. American Society of Heating, Refrigerating and Air Conditioning Engineers, Atlanta, Georgia.
ANSI/ASHRAE/IES. 2013. ANSI/ASHRAE/IES 90.1-2013, Energy Standard for Buildings Except Low-Rise Residential Buildings. American Society of Heating, Refrigerating and Air Conditioning Engineers, Atlanta, Georgia.
Arasteh, D., C. Kohler and B. Griffith. 2009. Modeling Windows in Energy Plus with Simple Performance Indices. LBNL-2804E, Lawrence Berkeley National Laboratory, Berkeley, CA. Available at http://gaia.lbl.gov/btech/papers/2804.pdf
ASHRAE. 2011. Heating, Ventilating and Air-Conditioning Applications, 2011 ASHRAE Handbook Chapter 31 Table 4 Comparison of Service Life Estimates. American Society of Heating, Refrigerating and Air Conditioning Engineers, Atlanta, Georgia.
DOE FEMP (U.S. Department of Energy Federal Energy Management Program). 2012. “Geothermal Heat Pumps” on Whole Building Design Guide. National Institute of Building Sciences. Available at http://www.wbdg.org/resources/geothermalheatpumps.php
DOE. 2013. Energy Plus Energy Simulation Software, Version 8.0. U.S. Department of Energy, Washington, D.C. Available http://apps1.eere.energy.gov/buildings/EnergyPlus/.
DOE. 2015. “Building Energy Codes Program, Status of State Energy Code Adoption.” U.S. Department of Energy, Washington, D.C. Available at https://www.energycodes.gov/status-state-energy-code-adoption.
Fannie Mae. 2015. Instructions for Performing a Multifamily Property Conditions Assesment (Ver. 2.0), Appendix F Estimated Useful Life Tables. Fannie Mae, Washington D.C. Available at https://www.fanniemae.com/content/guide_form/4099f.pdf
Halverson, M. 2014. ANSI/ASHRAE/IES Standard 90.1-2013 Preliminary Determination: Quantitative Analysis. PNNL-23236, Pacific Northwest National Laboratory, Richland, Washington
Heller, J. 2015a. Washington Code Proposal 15-E070 – subject is dedicated outdoor air systems (DOAS). Washington State. Available at https://fortress.wa.gov/ga/apps/SBCC/File.ashx?cid=4909
Heller, J. 2015b. Washington Code Proposal 15-E069 – subject is ventilation limits, related to DOAS proposal. Washington State. https://fortress.wa.gov/ga/apps/SBCC/File.ashx?cid=4911

7.2
Heller, J. 2015b. Washington Code Proposal 15-E066 – subject is thermostatic control and zoning , related to DOAS proposal. Washington State. https://fortress.wa.gov/ga/apps/SBCC/File.ashx?cid=4912
ICC (International Code Council). 2012. 2012 International Energy Conservation Code. Washington, D.C.
ICC (International Code Council). 2015. 2015 International Energy Conservation Code. Washington, D.C
IRS (Internal Revenue Service). 2015. “Cost Segregation Audit Techniques Guide - Chapter 2 - Legal Framework.” Internal Revenue Service, Washington D.C. Available at http://www.irs.gov/Businesses/Cost-Segregation-Audit-Techniques-Guide---Chapter-2---Legal-Framework
Jonlin, D. 2015. Washington Code Proposal 15-E096 - subject is interior lighting power allowance. Washington State. Available at https://fortress.wa.gov/ga/apps/SBCC/File.ashx?cid=4904
Kennedy, MD. 2014. Comparison of the 2012 Seattle Energy Code with ASHRAE 90.1-2010. City of Seattle Office of Sustainability and Environment. Available at http://www.seattle.gov/Documents/Departments/OSE/SEC2012toASHRAE90-1-2010_20June2014.pdf.
Kennedy, MD. 2015a. Washington Code Proposal 15-E124 - subject is fan power in total building performance method. Washington State. Available at https://fortress.wa.gov/ga/apps/SBCC/File.ashx?cid=4986
Kennedy, MD. 2015b. Washington Code Proposal 15-E114 - subject is interior lighting power allowance Washington State. Available at https://fortress.wa.gov/ga/apps/SBCC/File.ashx?cid=4992
Rosenberg, M.I., Hart, R., Zhang J. and Athalye R. 2015. Roadmap for the Future of Commercial Energy Codes, PNNL-24009. Pacific Northwest National Laboratory, Richland, Washington.
Seattle. 2013. “Carbon Neutrality.” Seattle, Washington. Available at http://www.seattle.gov/council/issues/carbon_neutrality.htm.
Seattle. 2014. 2012 Seattle Energy Code. International Code Council, Washington, D.C.
Seattle. 2015. 2012 Seattle Energy Code Compliance Forms for Commercial Buildings Including R2&R3 Over 3 Stories and All R1, Revised April 2015 – Excel workbook. Seattle, Washington. Available at http://www.seattle.gov/dpd/codesrules/codes/energy/forms/default.htm. Thornton, B. A., Wang, W., Cho, H., Xie, Y., Mendon, V. V., Richman, E. E., Zhang, J., Athalye, R. A., Rosenberg, M. I., and Liu, B.. 2011. Achieving 30% Goal: Energy and Cost Saving Analysis of ASHRAE/IES Standard 90.1-2010. Pacific Northwest National Laboratory, Richland, Washington. Available at http://www.energycodes.gov/publications/research/documents/codes/PNNL-20405.pdf.
Washington State. 2014. 2012 Washington State Energy Code. International Code Council, Washington, D.C.

7.3
Washington State. 2015a, 2015 Washington State Energy Code Integrated Draft. Washington State. Accessed May 29, 2015 https://fortress.wa.gov/ga/apps/SBCC/File.ashx?cid=4613
Washington State. 2015b, “Energy Life Cycle Cost Analysis” Washington State Department of Enterprise Services. Available at http://www.des.wa.gov/services/facilities/energy/elcca/Pages/default.aspx
Washington State. 2015c, “Life Cycle Cost Tool” Washington State Office of Financial Management. Available at http://www.ofm.wa.gov/budget/capitalforms/lifecyclecosttool.xlsb


![GENERAL BUILDING ENVELOPE MECHANICAL SYSTEMS …GENERAL BUILDING ENVELOPE MECHANICAL SYSTEMS LIGHTING & ELECTRICAL POWER OTHER REQUIREMENTS [OR- 1] MANDATORY ADDITIONAL EFFICIENCY](https://static.fdocuments.us/doc/165x107/5f163e1090243225a122eb72/general-building-envelope-mechanical-systems-general-building-envelope-mechanical.jpg)


