Presented by. Gross Profit Inventory Turns Gross Margin Return on Investment (GMROI) You can...
23
presented by presented by
-
Upload
bertram-welch -
Category
Documents
-
view
230 -
download
6
Transcript of Presented by. Gross Profit Inventory Turns Gross Margin Return on Investment (GMROI) You can...

presented bypresented by

Gross ProfitInventory TurnsGross Margin Return on Investment (GMROI)
You can effectively manage your entire inventory by using 3 simple calculations:

Gross Profit
Sales $ 1,000,000 100%
Cost goods sold ( 650,000) 65% --------------- -------
Gross Profit $ 350,000 35%
========= ====

Inventory Turns
Cost of goods sold ($ 600,000) ------------------------Avg Inventory cost on hand ($ 300,000)
= Inventory turned “2 Times” …or, it took you 6 months to turn over
your entire inventory (in $$$)

GMROI Gross Profit ($ 400,000) --------------------Avg Inventory cost on hand ($ 300,000)
= GMROI of $1.33…or, your earned $1.33 for every $1.00
you invested in inventory

GMROI Goal:
Most retailing experts (across all industries)
suggest a GMROI target of
$1.50 or better

Let’s test our new calculations …
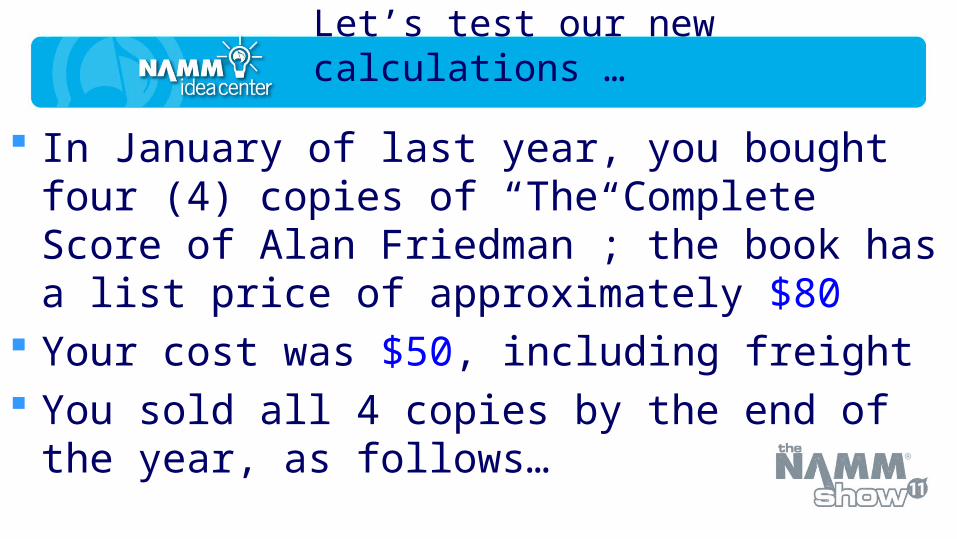
In January of last year, you bought four (4) copies of “The Complete Score of Alan Friedman”; the book has a list price of approximately $80
Your cost was $50, including freight You sold all 4 copies by the end of the
year, as follows…
Let’s test our new calculations …
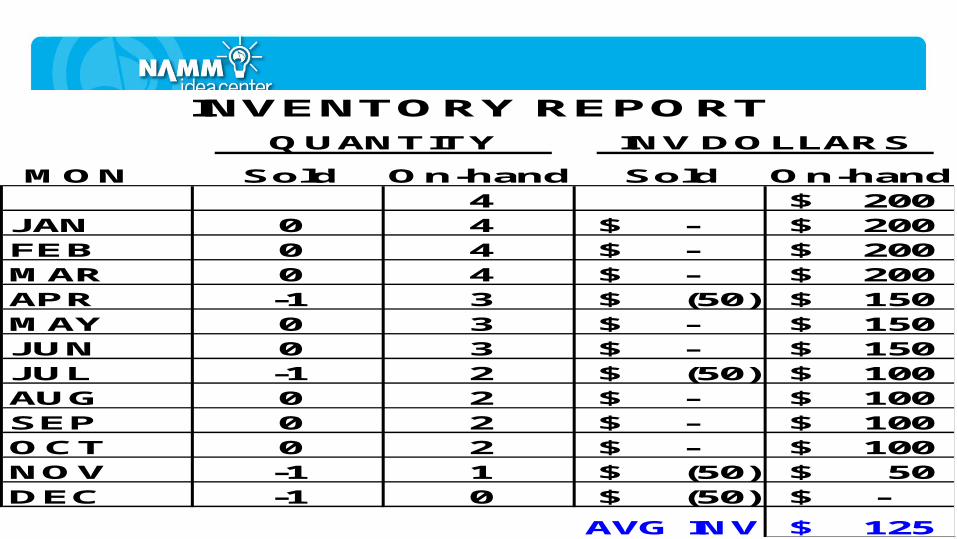
MON Sold On-hand Sold On-hand4 200$
JAN 0 4 -$ 200$ FEB 0 4 -$ 200$ MAR 0 4 -$ 200$ APR -1 3 (50)$ 150$ MAY 0 3 -$ 150$ JUN 0 3 -$ 150$ JUL -1 2 (50)$ 100$ AUG 0 2 -$ 100$ SEP 0 2 -$ 100$ OCT 0 2 -$ 100$ NOV -1 1 (50)$ 50$ DEC -1 0 (50)$ -$
AVG INV 125$
INV DOLLARSQUANTITY
INVENTORY REPORT
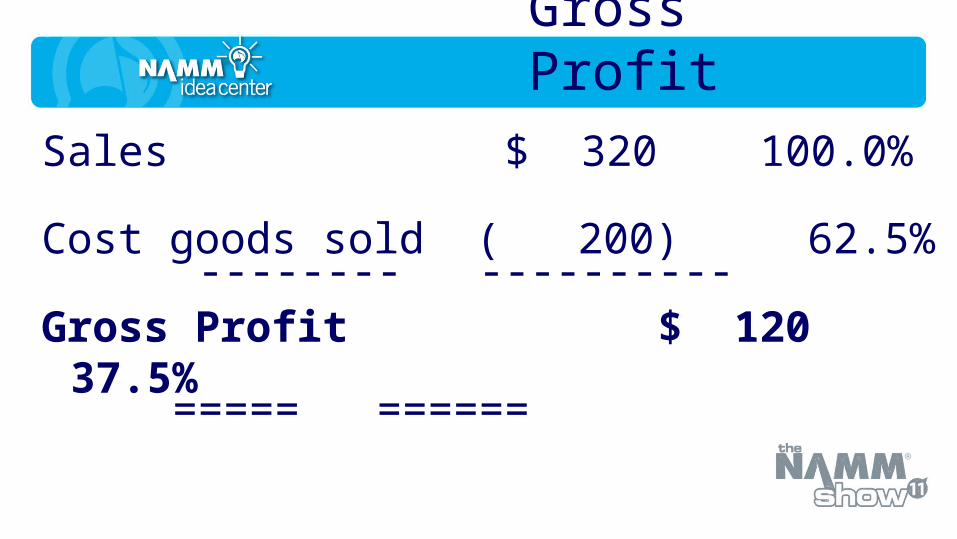
Gross Profit
Sales $ 320 100.0%
Cost goods sold ( 200) 62.5% -------- ----------
Gross Profit $ 120 37.5%
===== ======

Inventory Turns
Cost of goods sold ($ 200) -----------------------Avg Inventory cost on hand ($ 125)
= Inventory turns of 1.6 Turns…or it took you an average of 228 days (or 7.5 months)
to turn over the entire “Alan Friedman Score” inventory
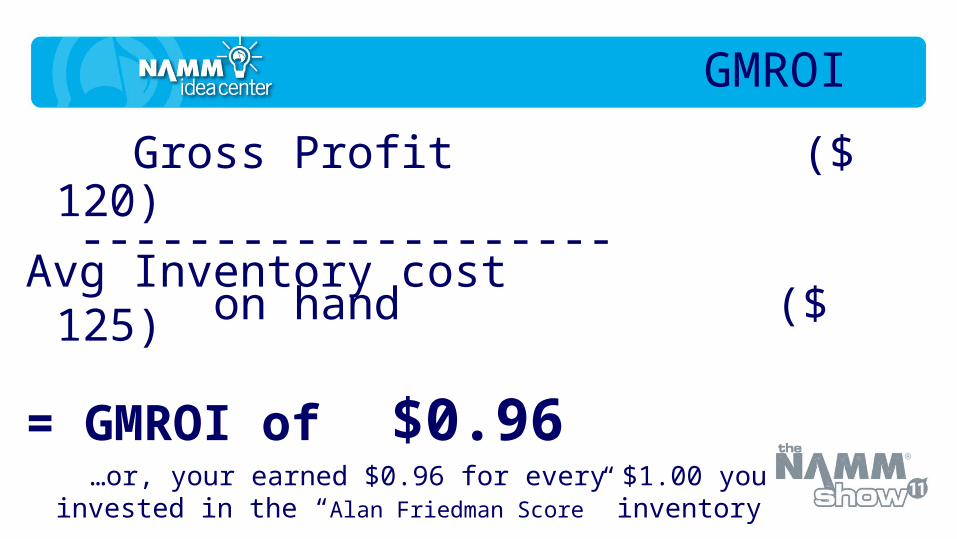
GMROI
Gross Profit ($ 120) --------------------Avg Inventory cost on hand ($ 125)
= GMROI of $0.96 …or, your earned $0.96 for every $1.00 you
invested in the “Alan Friedman Score” inventory
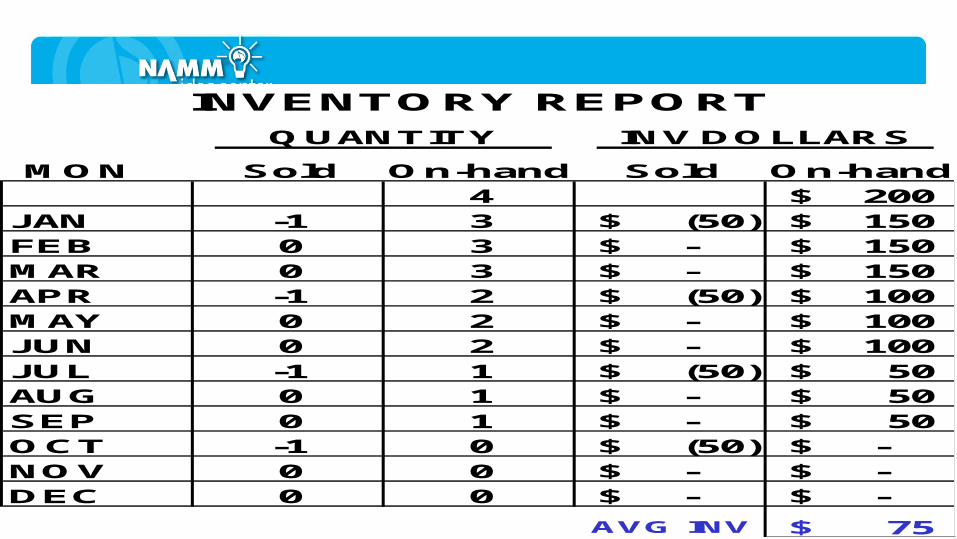
MON Sold On-hand Sold On-hand4 200$
JAN -1 3 (50)$ 150$ FEB 0 3 -$ 150$ MAR 0 3 -$ 150$ APR -1 2 (50)$ 100$ MAY 0 2 -$ 100$ JUN 0 2 -$ 100$ JUL -1 1 (50)$ 50$ AUG 0 1 -$ 50$ SEP 0 1 -$ 50$ OCT -1 0 (50)$ -$ NOV 0 0 -$ -$ DEC 0 0 -$ -$
AVG INV 75$
INV DOLLARSQUANTITY
INVENTORY REPORT

Gross Profit
Sales $ 320 100.0%
Cost goods sold ( 200) 62.5% --------- ----------
Gross Profit $ 120 37.5%
===== ======
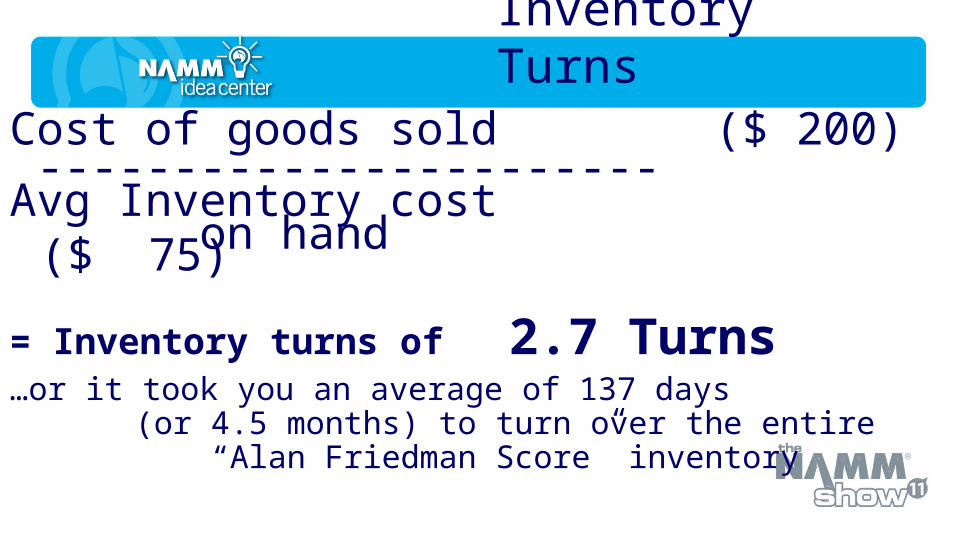
Inventory Turns
Cost of goods sold ($ 200) -----------------------Avg Inventory cost on hand ($ 75)
= Inventory turns of 2.7 Turns…or it took you an average of 137 days
(or 4.5 months) to turn over the entire “Alan Friedman Score” inventory
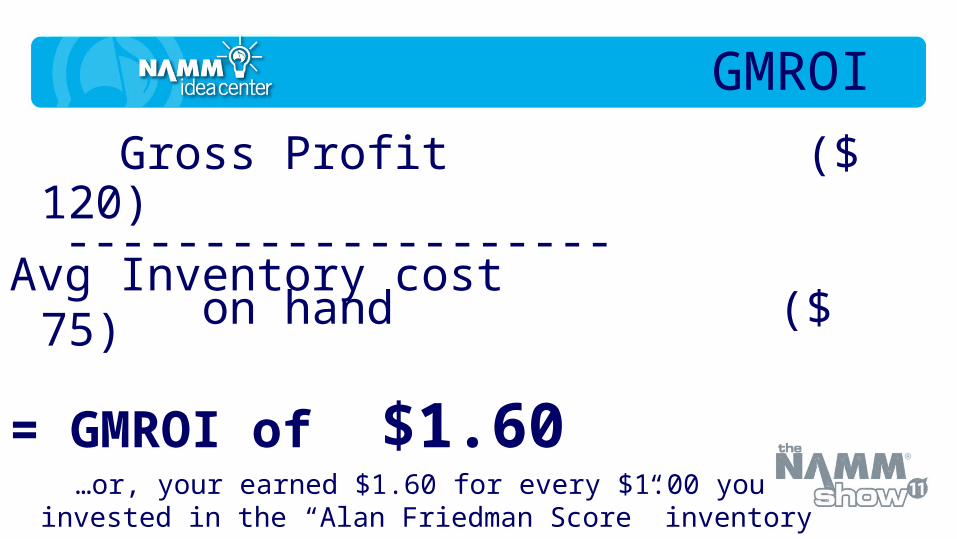
GMROI
Gross Profit ($ 120) --------------------Avg Inventory cost on hand ($ 75)
= GMROI of $1.60 …or, your earned $1.60 for every $1.00 you
invested in the “Alan Friedman Score” inventory

Alan’s Inv Mgt Goals:
•Gross profit = “it depends” on your inventory turns
•Inv turns = “it depends” on your gross profit percent
Most retailing experts (across all industries) suggest GMROI targets of…
$1.50 or better

The Secret Weapon:a “1-Page Solution”
to Managing Your Inventory

BIG AL'S HOUSE OF ROCK & SCHLOCKSALES and INVENTORY ANALYSISFOR THE YEAR ENDED DECEMBER 31, 2010
(A - B) (C / A) (B / E) (A/TotalA) (E/TotalE) (C / E)A B C D E F G H I
Sales Inventory (GMROI)Cost of Gross Gross Average Inv as % of as % of Gr Margin
Sales Goods Sold Profit ($) Profit (%) Inventory Turns Tot Sales Tot Inv. ret on inv
Guitars - electric 300,000$ 235,000$ 65,000$ 22% 330,000$ 0.71 12% 21% 0.20$
Guitars - acoustic 125,000 85,000 40,000 32% 40,000 2.13 5% 3% 1.00$
Basses 100,000 67,000 33,000 33% 40,000 1.68 4% 3% 0.83$
Amps 150,000 110,000 40,000 27% 105,000 1.05 6% 7% 0.38$
Drums and percussion 150,000 115,000 35,000 23% 110,000 1.05 6% 7% 0.32$
Keyboards 300,000 213,000 87,000 29% 190,000 1.12 12% 12% 0.46$
Pianos and organs 425,000 240,000 185,000 44% 440,000 0.55 17% 28% 0.42$
Band and orchestra instruments 100,000 75,000 25,000 25% 55,000 1.36 4% 4% 0.45$
Recording equipment 275,000 200,000 75,000 27% 105,000 1.90 11% 7% 0.71$
Microphones 50,000 35,000 15,000 30% 10,000 3.50 2% 1% 1.50$
Sound reinforcement 175,000 95,000 80,000 46% 15,000 6.33 7% 1% 5.33$
Effects 75,000 55,000 20,000 27% 25,000 2.20 3% 2% 0.80$
Print Music 110,000 65,000 45,000 41% 55,000 1.18 4% 4% 0.82$
Accessories 130,000 70,000 60,000 46% 30,000 2.33 5% 2% 2.00$
TOTALS 2,465,000$ 1,660,000$ 805,000$ 32.66% 1,550,000$ 1.07 0.52$
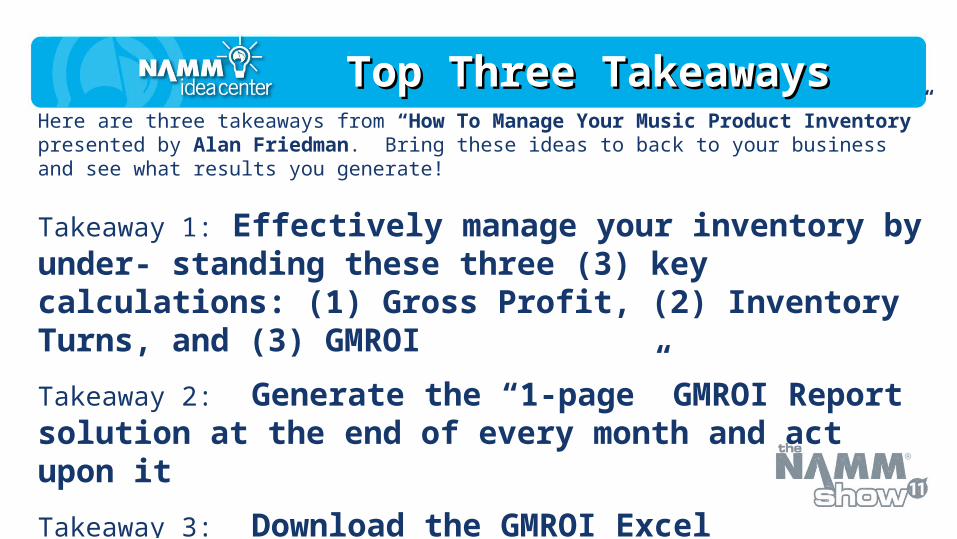
Here are three takeaways from “How To Manage Your Music Product Inventory” presented by Alan Friedman. Bring these ideas to back to your business and see what results you generate!
Takeaway 1: Effectively manage your inventory by under- standing these three (3) key calculations: (1) Gross Profit, (2) Inventory Turns, and (3) GMROI
Takeaway 2: Generate the “1-page” GMROI Report solution at the end of every month and act upon it
Takeaway 3: Download the GMROI Excel Spreadsheet from our website at: www.fkco.com
Top Three Top Three TakeawaysTakeaways

Any
Questions?
““Free” Consulting Free” Consulting MeetingsMeetings
Contact Jen Contact Jen outside the Idea Center outside the Idea Center entranceentrance
after this session to set up a meeting after this session to set up a meeting timetime

CatchCatch “ “Printz”Printz” Saturday night at the Hilton Saturday night at the Hilton LobbyLobby
““Enjoy Enjoy the the
Show!”Show!”