
PRESENTED BY Epoch’s Quarterly Capital Markets€™s Quarterly Capital Markets Outlook January...
32
David N. Pearl Executive Vice President and Co-CIO William W. Priest Chief Executive Officer and Co-CIO PRESENTED BY The information contained in this presentation is distributed for informational purposes only and should not be considered investment advice or a recommendation of any particular security, strategy or investment product. Information contained herein has been obtained from sources believed to be reliable, but not guaranteed. The information contained in this presentation is accurate as of the date submitted, but is subject to change. Any performance information referenced in this presentation represents past performance and is not indicative of future returns. Any projections, targets, or estimates in this presentation are forward looking statements and are based on Epoch’s research, analysis, and assumptions made by Epoch. There can be no assurances that such projections, targets, or estimates will occur and the actual results may be materially different. Other events which were not taken into account in formulating such projections, targets, or estimates may occur and may significantly affect the returns or performance of any accounts and/or funds managed by Epoch. To the extent this presentation contains information about specific companies or securities including whether they are profitable or not, they are being provided as a means of illustrating our investment thesis. Past references to specific companies or securities are not a complete list of securities selected for clients and not all securities selected for clients in the past year were profitable. Epoch’s Quarterly Capital Markets Outlook January 14, 2015 | The webinar replay will be available on our website: www.eipny.com John Reddan Senior Research Analyst
Transcript of PRESENTED BY Epoch’s Quarterly Capital Markets€™s Quarterly Capital Markets Outlook January...

David N. Pearl
Executive Vice President and Co-CIO
William W. Priest
Chief Executive Officer and Co-CIO
PRESENTED BY
The information contained in this presentation is distributed for informational purposes only and should not be considered investment advice or a recommendation of any particular security, strategy orinvestment product. Information contained herein has been obtained from sources believed to be reliable, but not guaranteed. The information contained in this presentation is accurate as of the datesubmitted, but is subject to change. Any performance information referenced in this presentation represents past performance and is not indicative of future returns. Any projections, targets, orestimates in this presentation are forward looking statements and are based on Epoch’s research, analysis, and assumptions made by Epoch. There can be no assurances that such projections,targets, or estimates will occur and the actual results may be materially different. Other events which were not taken into account in formulating such projections, targets, or estimates may occur andmay significantly affect the returns or performance of any accounts and/or funds managed by Epoch. To the extent this presentation contains information about specific companies or securitiesincluding whether they are profitable or not, they are being provided as a means of illustrating our investment thesis. Past references to specific companies or securities are not a complete list ofsecurities selected for clients and not all securities selected for clients in the past year were profitable.
Epoch’s Quarterly Capital Markets Outlook
January 14, 2015 | The webinar replay will be available on our website: www.eipny.com
JohnReddan
Senior Research Analyst

2
Global Monetary Policy Has Driven Markets
12.3% 17.4%
31.1%6.3%
56.7%
76.3%
Total Return72.6%
Total Return54.0%
0%
10%
20%
30%
40%
50%
60%
70%
80%
90%
100%
S&P 500 MSCI World
Cumulative Effects 2012 - 2014
P/E Expansion
EPS Growth
Dividends
Numbers may not total due to roundingSource: Standard and Poors; MSCI; Epoch Investment Partners; December 2014

If you wish to ask a question, please click on the question mark icon located on the top of the screen.
1.0
1.5
2.0
2.5
3.0
3.5
Aug
-12
Sep
-12
Oct
-12
Nov
-12
Dec
-12
Jan-
13
Feb-
13
Mar
-13
Apr
-13
May
-13
Jun-
13
Jul-1
3
Aug
-13
Sep
-13
Oct
-13
Nov
-13
Dec
-13
Jan-
14
Feb-
14
Mar
-14
Apr
-14
May
-14
Jun-
14
Jul-1
4
Aug
-14
Sep
-14
Oct
-14
Nov
-14
Dec
-14
Jan-
15
Feb-
15
%
U.S. 10-year Government Bond Yield
Source: Federal Reserve Economic Data; January 13, 2015
Yields Declined In the U.S. . . .
3
10-Year Treasury Constant Maturity Rate

If you wish to ask a question, please click on the question mark icon located on the top of the screen.
. . . And Throughout The World
Global 10-Year Bond Yields
0.0%
0.5%
1.0%
1.5%
2.0%
2.5%
3.0%
3.5%
4.0%
Jan-14 Feb-14 Mar-14 Apr-14 May-14 Jun-14 Jul-14 Aug-14 Sep-14 Oct-14 Nov-14 Dec-14 Jan-15
France Switzerland Germany Japan U.S. Spain Italy
Source: Strategas; January 9, 2015
%
Japan 0.28%
Germany 0.49%
France 0.78%
Spain 1.72%
Italy 1.88%
U.S. 1.94%
Switzerland 0.22%
4

0
100
200
300
400
500
600
2007 2008 2009 2010 2011 2012 2013 2014 2015 2016
Fed ECB BoJ BOE
Central Bank Policies Are Diverging
Central bank balance sheets
Source: Pavilion Global Markets; Indexed to 100 January 1, 2007; January 2015
Index Expectation
5

If you wish to ask a question, please click on the question mark icon located on the top of the screen. 6
95
100
105
110
115
120
7/1/2014 7/31/2014 8/30/2014 9/29/2014 10/29/2014 11/28/2014 12/28/2014
Euro/USD Yen/USD GBP/USD AUD/USD CAD/USD%
Source: Federal Reserve, Epoch Investment Partners; Indexed to 100 July 1, 2014; January 2015
Dollar Strengthened Against Major Currencies
Exchange Rates In USD Terms
If you wish to ask a question, please click on the question mark icon located on the top of the screen.
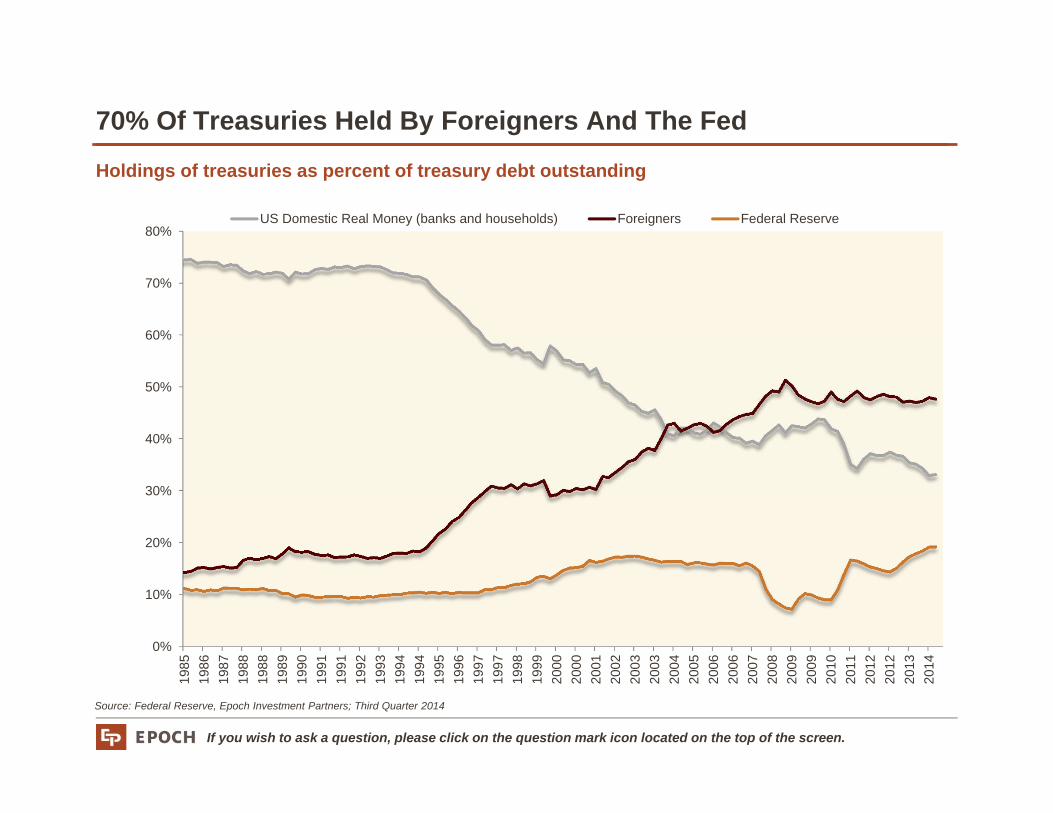
70% Of Treasuries Held By Foreigners And The Fed
0%
10%
20%
30%
40%
50%
60%
70%
80%
1985
1986
1987
1988
1988
1989
1990
1991
1991
1992
1993
1994
1994
1995
1996
1997
1997
1998
1999
2000
2000
2001
2002
2003
2003
2004
2005
2006
2006
2007
2008
2009
2009
2010
2011
2012
2012
2013
2014
US Domestic Real Money (banks and households) Foreigners Federal Reserve
Source: Federal Reserve, Epoch Investment Partners; Third Quarter 2014
Holdings of treasuries as percent of treasury debt outstanding

If you wish to ask a question, please click on the question mark icon located on the top of the screen.
2.5
3.0
3.5
4.0
4.5
5.0
5.5
2010 2011 2012 2013 2014 2015 2016 2017 2018 2019
2011 Est 2012 Est 2013 Est 2014 Est GDP
The Big Problem: Secular Stagnation
World real GDP growth continues to be revised down
Source: IMF World Economic Outlook; October 2014
%
8

If you wish to ask a question, please click on the question mark icon located on the top of the screen. 9
World More Highly Levered Than Before Financial Crisis
Source: Geneva Reports on the World Economy, Deleveraging? What Deleveraging? Authors’ calculation based on OECD, IMF and national accounts data; October 2014
%
160
165
170
175
180
185
190
195
200
205
210
215
2001 2002 2003 2004 2005 2006 2007 2008 2009 2010 2011 2012 2013 2014
World Total Debt ex-Financials
174%
World debt ex-financials percent of GDP
213%

If you wish to ask a question, please click on the question mark icon located on the top of the screen.
0.3%
-0.3%-0.4%
-0.9%
2.0%
0.6%
0.3%
1.0%
-0.6%
2.0%
-1.5%
-1.0%
-0.5%
0.0%
0.5%
1.0%
1.5%
2.0%
2.5%
Eurozone Germany France Italy Spain
2Q14 3Q14%
Growth Is Anemic In Most Of Europe
GDP growth quarter-over-quarter
Source: Strategas Research Partners; Third Quarter 2014
10

If you wish to ask a question, please click on the question mark icon located on the top of the screen.
-2
-1
0
1
2
3
4
5
6
Jan-06 Jan-07 Jan-08 Jan-09 Jan-10 Jan-11 Jan-12 Jan-13 Jan-14 Jan-15
Germany France Eurozone Spain Italy
Deflation A Real Threat
Harmonized index of consumer prices
Source: Pavilion Global Markets (Germany Federal Statistical Office and INSEE data via Bloomberg); December 2014
% Y/Y
11

If you wish to ask a question, please click on the question mark icon located on the top of the screen.
Monetary Policy
Fiscal Policy
Structural Reform
Abenomics: Shinzo Abe and the Three Arrows
Massive Quantitative Easing
Increased government spending alongside tax hike
Economic growth and inflation?
No significant actions except recent Cabinet shuffle
12

If you wish to ask a question, please click on the question mark icon located on the top of the screen.
Chinese Growth Continues To Weaken
6
7
8
9
10
11
12
5
7
9
11
13
15
17
19
Industrial Production (Left Scale) GDP (Right Scale)% Y/Y
Source: Pavilion Global Markets (NBS Data via Bloomberg); January 2015
Industrial Production and GDP Growth
% Y/Y
-4
-2
0
2
4
6
8
10
2011 2012 2013 2014 2015
Month / Month Year / Year
China Home Prices70 Medium and Large Cities
% Change
Source: Pavilion Global Markets (National Bureau of Statistics of China Data via Datastream); November 2014

If you wish to ask a question, please click on the question mark icon located on the top of the screen.
Chinese Investors Moving From Housing To Stock Market
14
1,800
2,000
2,200
2,400
2,600
2,800
3,000
3,200
3,400
0
100
200
300
400
500
600
700
800
900
1000New Accounts (Right Scale) Shanghai Composite (Left Scale)
Source: Pavilion Global Markets; January 2015
New Accounts, Thousands Index
Flow of funds fueling spike in Shanghai market

If you wish to ask a question, please click on the question mark icon located on the top of the screen.
60
70
80
90
100
110
120
2005 2006 2007 2008 2009 2010 2011 2012 2013 2014 2015
U.S. Eurozone Japan U.K.
U.S. Growth Outlook Remains Better Than Rest Of World
Eurozone, U.S., Japan and U.K. industrial production
Source: Pavilion Global Markets, Indexed to 100 in January 2005; December 2014
Index
15
If you wish to ask a question, please click on the question mark icon located on the top of the screen.
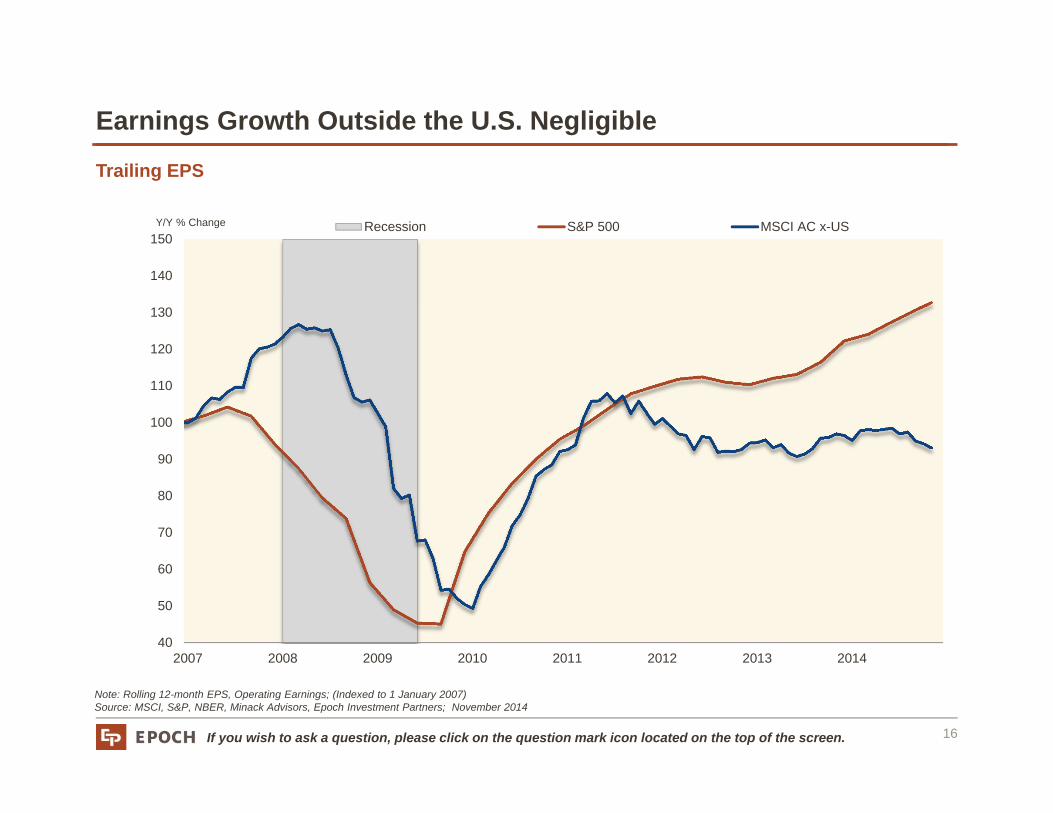
Earnings Growth Outside the U.S. Negligible
40
50
60
70
80
90
100
110
120
130
140
150
2007 2008 2009 2010 2011 2012 2013 2014
Recession S&P 500 MSCI AC x-USY/Y % Change
Trailing EPS
Note: Rolling 12-month EPS, Operating Earnings; (Indexed to 1 January 2007)Source: MSCI, S&P, NBER, Minack Advisors, Epoch Investment Partners; November 2014
16
If you wish to ask a question, please click on the question mark icon located on the top of the screen.
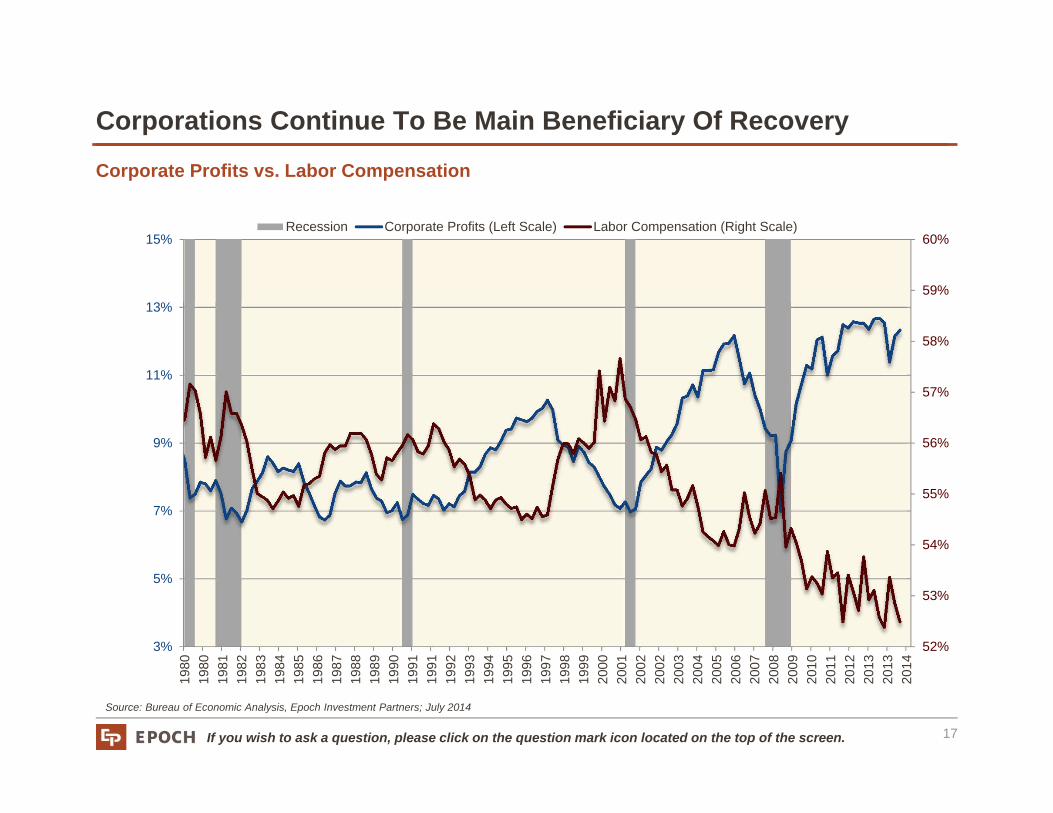
Corporations Continue To Be Main Beneficiary Of Recovery
52%
53%
54%
55%
56%
57%
58%
59%
60%
3%
5%
7%
9%
11%
13%
15%
1980
1980
1981
1982
1983
1984
1985
1986
1987
1988
1989
1990
1991
1991
1992
1993
1994
1995
1996
1997
1998
1999
2000
2001
2002
2002
2003
2004
2005
2006
2007
2008
2009
2010
2011
2012
2013
2013
2014
Recession Corporate Profits (Left Scale) Labor Compensation (Right Scale)
Source: Bureau of Economic Analysis, Epoch Investment Partners; July 2014
Corporate Profits vs. Labor Compensation
17

If you wish to ask a question, please click on the question mark icon located on the top of the screen.
-1000
-800
-600
-400
-200
0
200
400
105,000
107,000
109,000
111,000
113,000
115,000
117,000
119,000
Jan-08 Jul-08 Jan-09 Jul-09 Jan-10 Jul-10 Jan-11 Jul-11 Jan-12 Jul-12 Jan-13 Jul-13 Jan-14 Jul-14 Jan-15
Employment Finally Above Pre-Crisis Levels . . .
Change in employment, all private employees
Source: Bureau of Labor Statistics; December 2014
18
All Employees: Total Private Industries (Left Scale)Change In Total Private Employment (Right Scale)

If you wish to ask a question, please click on the question mark icon located on the top of the screen.
. . . But Wage Inflation Has Yet To Materialize
0
1
2
3
4
5
1985 1988 1991 1994 1997 2000 2003 2006 2009 2012 2015
1. Production and & Non-Supervisory: Total Private IndustrySource: Federal Reserve Economic Data; December 2014
Average Hourly Earnings1% Change Y/Y
19
Earnings growth elusive

If you wish to ask a question, please click on the question mark icon located on the top of the screen.
50
70
90
110
130
150
170
190
210
230
250S&P/Case-Shiller 20-City Composite Home Price Index
20
Source: Federal Reserve Economic Data; October 2014
Housing Prices Recovering Slowly
Wealth effect slow to rebound
If you wish to ask a question, please click on the question mark icon located on the top of the screen.
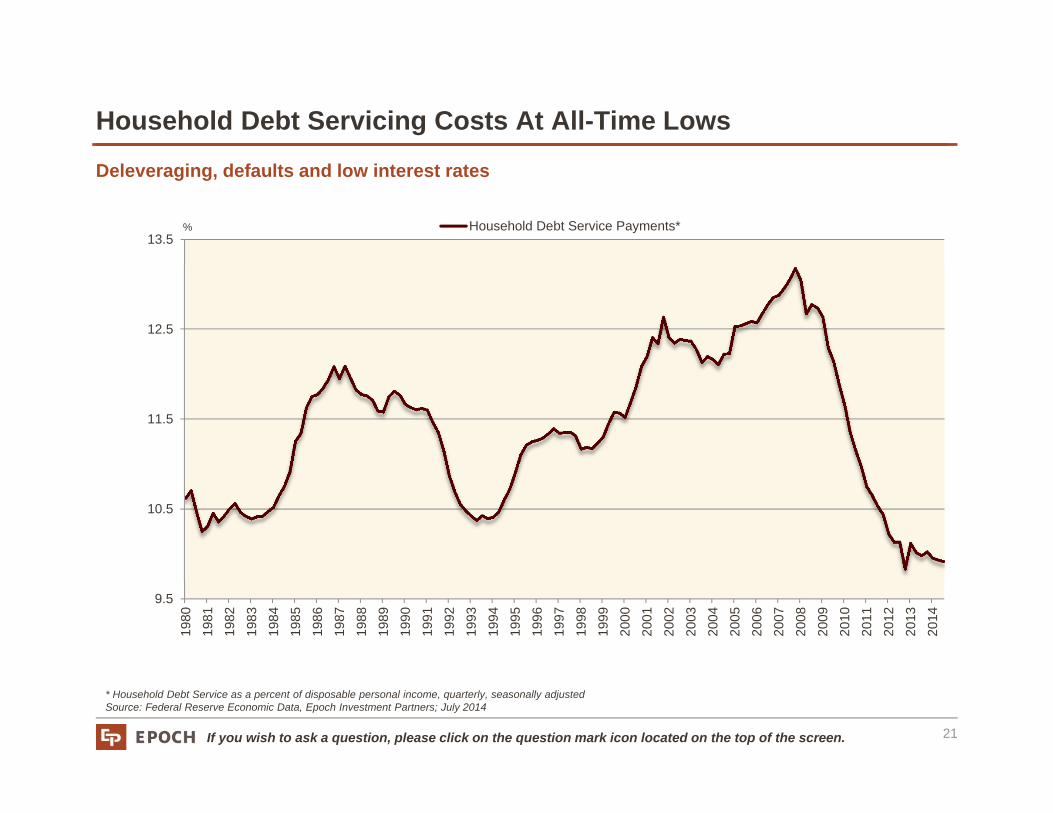
Household Debt Servicing Costs At All-Time Lows
9.5
10.5
11.5
12.5
13.5
1980
1981
1982
1983
1984
1985
1986
1987
1988
1989
1990
1991
1992
1993
1994
1995
1996
1997
1998
1999
2000
2001
2002
2003
2004
2005
2006
2007
2008
2009
2010
2011
2012
2013
2014
Household Debt Service Payments*
* Household Debt Service as a percent of disposable personal income, quarterly, seasonally adjustedSource: Federal Reserve Economic Data, Epoch Investment Partners; July 2014
%
21
Deleveraging, defaults and low interest rates

If you wish to ask a question, please click on the question mark icon located on the top of the screen.
Gasoline Prices Decline With Oil . . .
40
60
80
100
120
1.5
2.0
2.5
3.0
3.5
4.0
4.5
Dec
-09
Feb-
10
Apr
-10
Jun-
10
Aug
-10
Oct
-10
Dec
-10
Feb-
11
Apr
-11
Jun-
11
Aug
-11
Oct
-11
Dec
-11
Feb-
12
Apr
-12
Jun-
12
Aug
-12
Oct
-12
Dec
-12
Feb-
13
Apr
-13
Jun-
13
Aug
-13
Oct
-13
Dec
-13
Feb-
14
Apr
-14
Jun-
14
Aug
-14
Oct
-14
Dec
-14
Gasoline (Right Scale) Oil (Left Scale)
1. US Regular All Formulations Gas Price, Dollars per Gallon, Weekly, Not Seasonally Adjusted2. West Texas IntermediateSource: Federal Reserve Economic Data, Epoch Investment Partners; January 2015
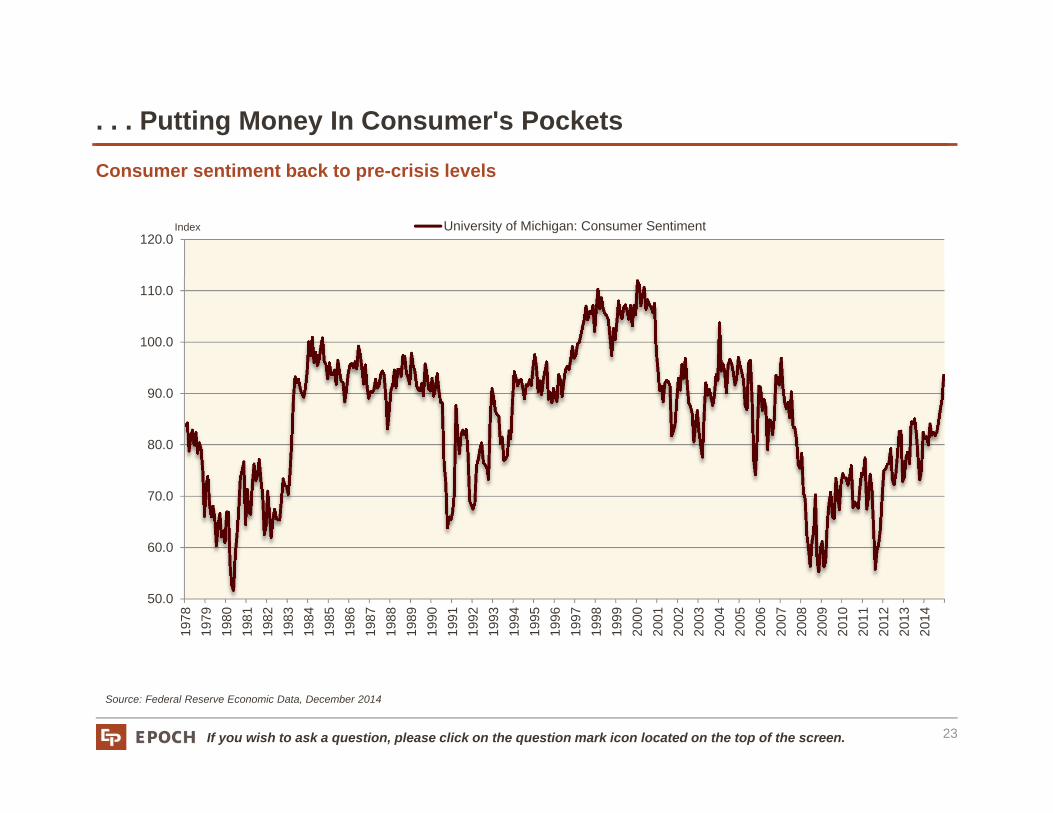
Producing a tailwind for consumers
1 2$/Gallon $/Barrel
22
If you wish to ask a question, please click on the question mark icon located on the top of the screen.
. . . Putting Money In Consumer's Pockets
50.0
60.0
70.0
80.0
90.0
100.0
110.0
120.0
1978
1979
1980
1981
1982
1983
1984
1985
1986
1987
1988
1989
1990
1991
1992
1993
1994
1995
1996
1997
1998
1999
2000
2001
2002
2003
2004
2005
2006
2007
2008
2009
2010
2011
2012
2013
2014
University of Michigan: Consumer Sentiment
Consumer sentiment back to pre-crisis levels
Source: Federal Reserve Economic Data, December 2014
Index
23

If you wish to ask a question, please click on the question mark icon located on the top of the screen.
Non-OPEC Supply Growth Is Expected To Outpace Demand Growth
The IEA's forecast for 2014 growth
Source: IEA, Bemstein analysis, 2014
24
1.43
0.170.04 0.02
0.15
-0.08-0.03
1.65
0.07
-0.19-0.26
-0.38
0.220.29
0.15 0.190.1 0.07 0.02
1.04
0.66
-0.50
-0.25
0.00
0.25
0.50
0.75
1.00
1.25
1.50
1.75
2.00
U.S
.
Can
ada
Rus
sia
Afric
a
Lat.
Am
Asia
OE
CD
ex-
U.S
.
Tota
l Non
-OP
EC
Iraq
Oth
er O
PE
C
Sau
di
Nig
eria
Iran
Liby
a
Tota
l OP
EC
Tota
l Sup
ply
U.S
.
Sur
ope
Oth
er O
EC
D
OEC
D D
eman
d
Chi
na
Asia
Lat.
Am
Mid
dle
Eas
t
Afric
a
FSU
Oth
er O
EC
D
Non
-OEC
D
Tota
l Dem
and
Supply Demand
No IEA Forecasts forOPEC Production
IEA
201
4 O
il Su
pply
& D
eman
d G
row
th (M
bpd)

If you wish to ask a question, please click on the question mark icon located on the top of the screen.
0
2
4
6
8
10
12
14
16
20
30
40
50
60
70
80
90
100
1975 1978 1981 1984 1987 1990 1993 1996 1999 2002 2005 2008 2011 2014
World Oil Demand (Left Scale) OPEC Excess Production Capacity (Right Scale)
OPEC Spare Capacity Not What It Used To Be
Source: Simmons & Company, 'Oil Macro: Oil Supply & Demand Balances', December 2014
OPEC spare capacity vs. global demand
Dem
and
(mb/
d)
25
Excess Capacity (m
b/d)

If you wish to ask a question, please click on the question mark icon located on the top of the screen.
Bond Proxies Trading At Premium To Market
0.0
5.0
10.0
15.0
20.0
25.0
S&P 500 Real Estate Investment Trusts Information Technology Utilities
Source: Standard & Poors, Epoch Investment Partners, January 2015
26
S&P 500 sector forward P/E
Multiple

If you wish to ask a question, please click on the question mark icon located on the top of the screen.
Jump In M&A Activity In Europe And North America
0
100
200
300
400
500
600
700
800
2002 2003 2004 2005 2006 2007 2008 2009 2010 2011 2012 2013 2014
North America Western Europe Asia Pacific (Developed)
Volume of announced M&A deals by region
$ Billions
Source: Pavilion Global Markets (Data via Bloomberg), 2Q 2014 at Pro-rata; December 2014
27

If you wish to ask a question, please click on the question mark icon located on the top of the screen.
0
50
100
150
200
250
Mar
-08
May
-08
Jul-0
8
Sep
-08
Nov
-08
Jan-
09
Mar
-09
May
-09
Jul-0
9
Sep
-09
Nov
-09
Jan-
10
Mar
-10
May
-10
Jul-1
0
Sep
-10
Nov
-10
Jan-
11
Mar
-11
May
-11
Jul-1
1
Sep
-11
Nov
-11
Jan-
12
Mar
-12
May
-12
Jul-1
2
Sep
-12
Nov
-12
Jan-
13
Mar
-13
May
-13
Jul-1
3
Sep
-13
Nov
-13
Jan-
14
Mar
-14
May
-14
Jul-1
4
Sep
-14
Dividends Buybacks
Buybacks And Dividends Continue To Be A Favored Use Of Cash
28
$ Billions
Source: Standard and Poors, Epoch Investment Partners; September 2014
S&P 500 quarterly buybacks and dividends
If you wish to ask a question, please click on the question mark icon located on the top of the screen.
-500
0
500
1,000
1,500
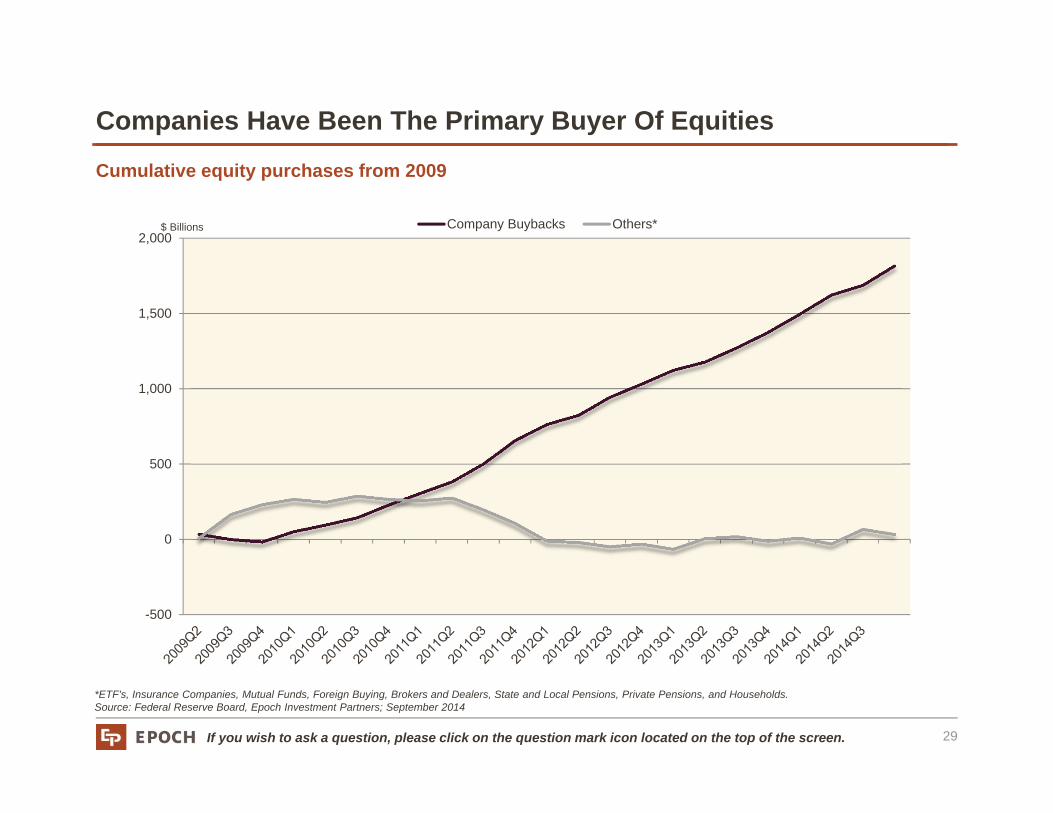
2,000Company Buybacks Others*
*ETF's, Insurance Companies, Mutual Funds, Foreign Buying, Brokers and Dealers, State and Local Pensions, Private Pensions, and Households.Source: Federal Reserve Board, Epoch Investment Partners; September 2014
$ Billions
Companies Have Been The Primary Buyer Of Equities
Cumulative equity purchases from 2009
29

White Paper
30
At Epoch, we invest in companies that are disciplined capital allocators.
We identify companies with track records of investing free cash flow for profitablegrowth AND returning excess free cash flow to investors. If management cannot earn above its cost of capital by investing in internal
projects or acquisitions, it should return the cash to shareholders. If the company decides to return excess free cash flow to investors, we see
dividends, share repurchases and debt paydowns as equivalent ways to achieve that objective.
31
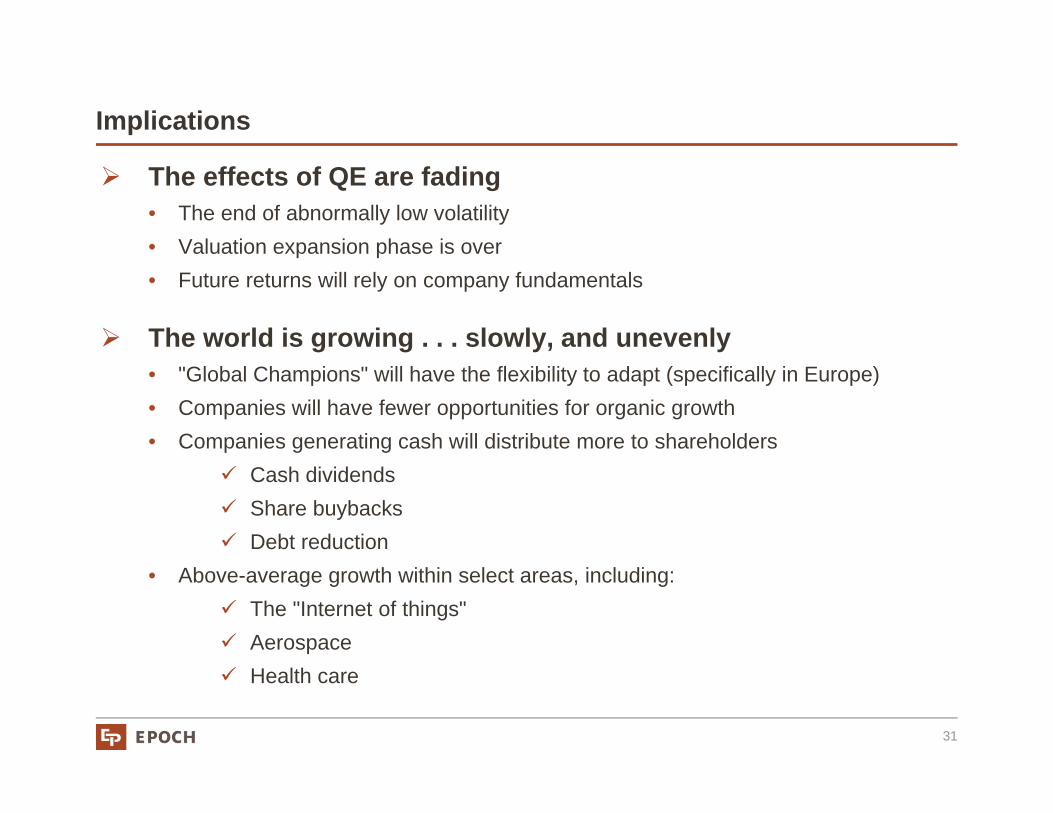
The effects of QE are fading • The end of abnormally low volatility • Valuation expansion phase is over• Future returns will rely on company fundamentals
The world is growing . . . slowly, and unevenly • "Global Champions" will have the flexibility to adapt (specifically in Europe)• Companies will have fewer opportunities for organic growth• Companies generating cash will distribute more to shareholders
Cash dividends Share buybacks Debt reduction
• Above-average growth within select areas, including: The "Internet of things" Aerospace Health care
Implications

If you wish to ask a question, please click on the question mark icon located on the top of the screen.
A replay of this presentation will be available shortly on our website www.eipny.com
Please feel free to contact us at 212-303-7200
Question & Answer Section
32