Presented by: Bob Vinson LMI Works April, 2013 Understanding The Labor Market: What’s Happening in...
37
Presented by: Bob Vinson LMI Works April, 2013 Understanding The Labor Market: What’s Happening in Massachusetts and Berkshire County 1
-
Upload
rose-gregory -
Category
Documents
-
view
215 -
download
0
Transcript of Presented by: Bob Vinson LMI Works April, 2013 Understanding The Labor Market: What’s Happening in...
Presented by: Bob Vinson
LMI Works
April, 2013
Understanding The Labor Market: What’s Happening in Massachusetts
and Berkshire County
1

Today’s Topics
Reviewing Popular Labor Force Measures and Misconceptions
Reviewing State and Local Labor Market Developments
Reviewing Structural Factors: How Different are the Berkshires?
STEM: what is the Impact on the Berkshires
2
Labor Force Measures
What do they really tell us?
Are they misunderstood? What are the common
misperceptions? Why does it matter?
3
The Unemployment Rate
Myth: the rate only includes people who are collecting unemployment
Reality: the rate is based on a monthly survey of 60,000 households
4
How Is It Measured?
Three mutually exclusive groups:EmployedUnemployedNot In the labor force
5
What Does It Measure?
Measures unutilized labor not underutilized labor
Does not measure income or job quality
UR= U/LF LF= E/E+U
6
Employed
Worked at least 1 hour during survey week Worked 15 hours or more unpaid in family
business Did not work during survey week due to
vacation, illness, industry dispute, weather Excludes, military, volunteers, under 16 Multiple job holders—count once
7

Unemployed
Not worked during the survey week Actively engaged in job search- attend job
fairs, contact employment and career centers,send out resumes- reading news adds alone does not count
Exempt from search if expecting recall Must be immediately available to take job
8
Out of the Labor Force
Those not employed or unemployed Reasons not in the labor force:
Child Care /Family Responsibilities School Illness/Disability Discouraged Retired
9

Who’s Unemployed?
Another perspective-- Categories New Entrants Re-Entrants Job Leavers Job Losers
Who among these 4 groups are collecting
Unemployment Insurance?
UI Claimants--about one half the unemployed
10
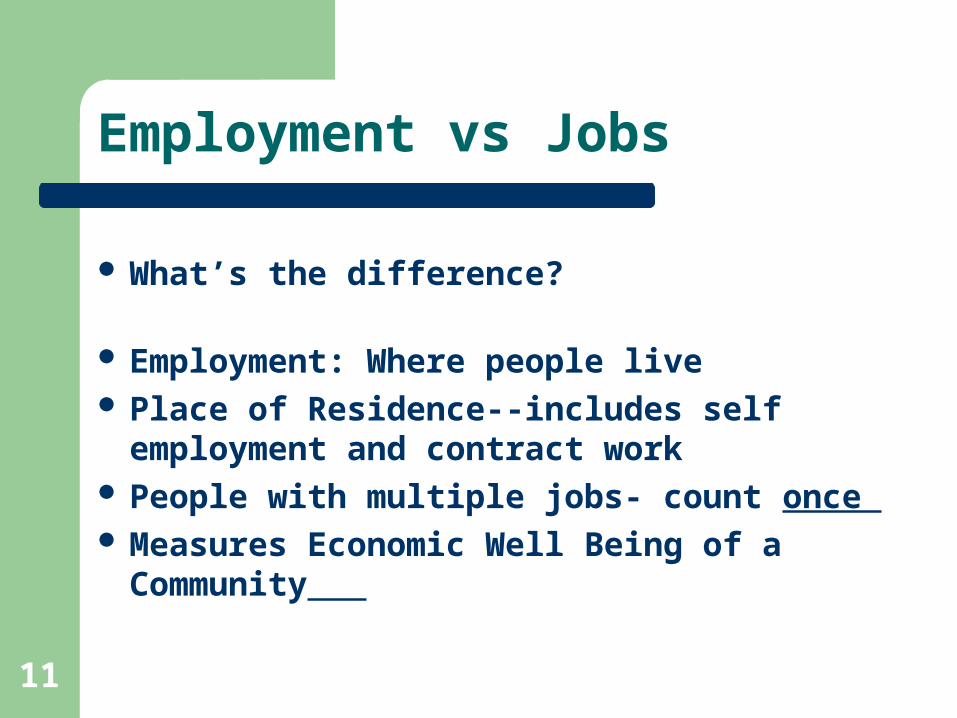
Employment vs Jobs
What’s the difference? Employment: Where people live Place of Residence--includes self
employment and contract work People with multiple jobs- count once Measures Economic Well Being of a
Community
11
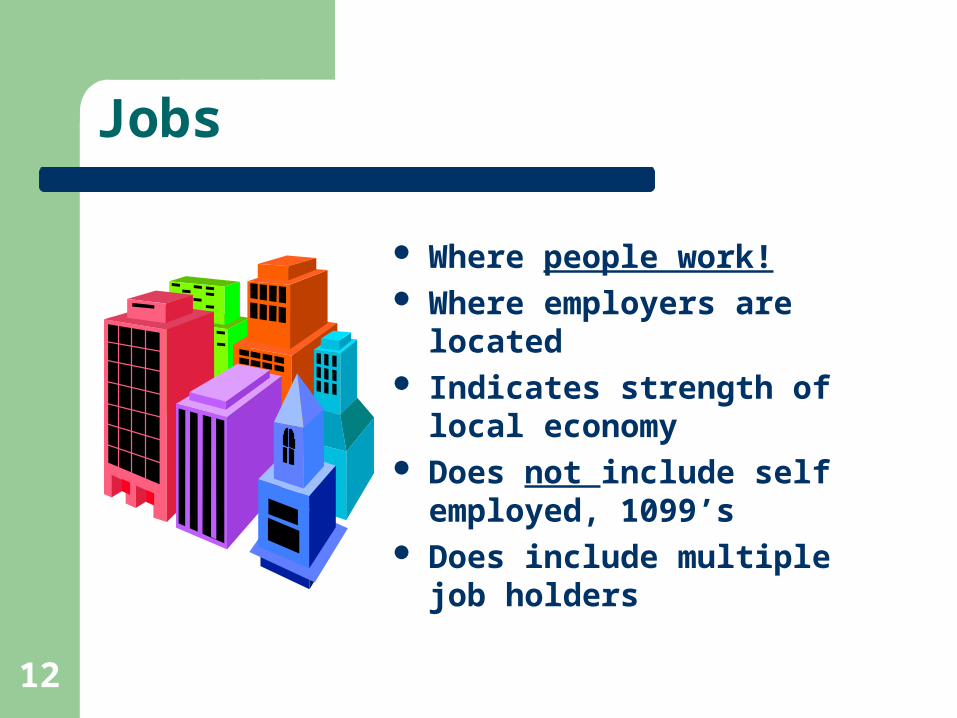
Jobs
Where people work! Where employers are located Indicates strength of local
economy Does not include self
employed, 1099’s Does include multiple job
holders
12
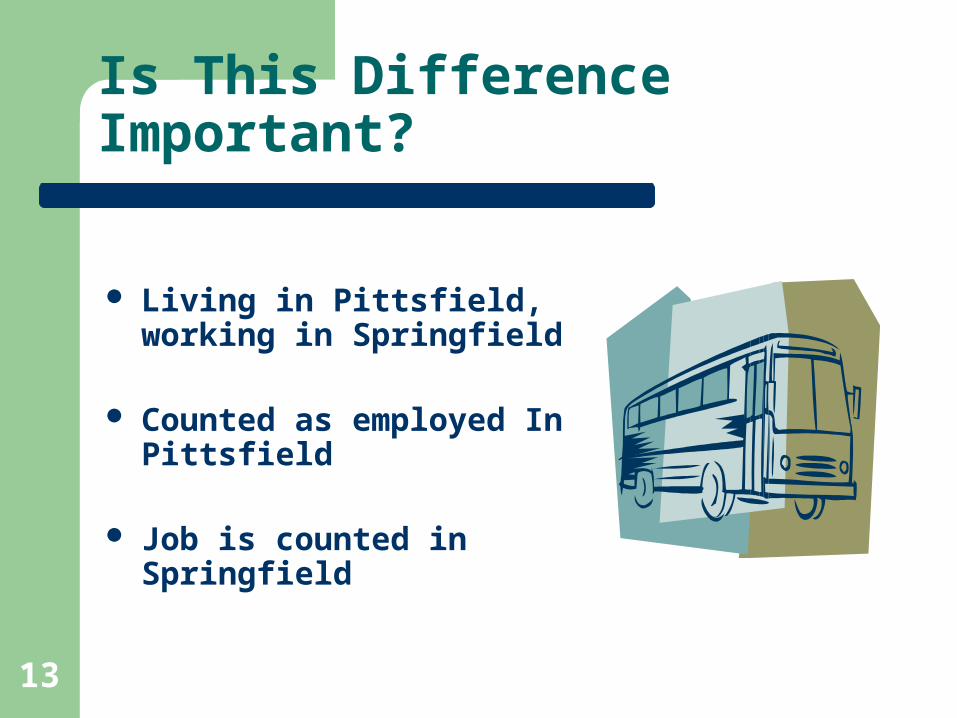
Is This Difference Important?
Living in Pittsfield, working in Springfield
Counted as employed In Pittsfield
Job is counted in Springfield
13
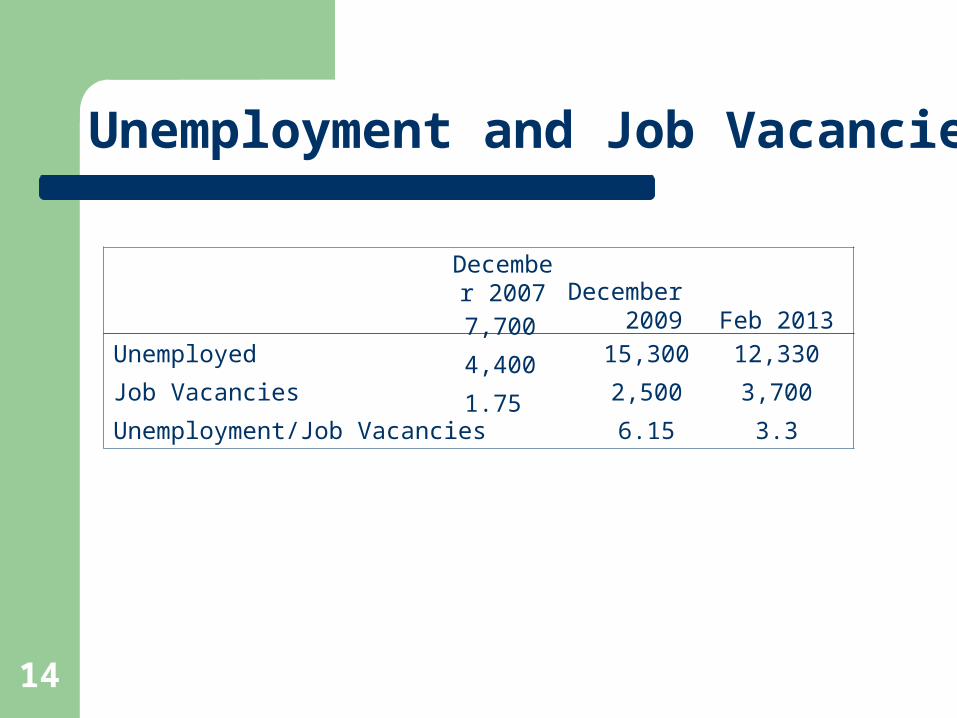
Unemployment and Job Vacancies
December
2009 Feb 2013Unemployed 15,300 12,330
Job Vacancies 2,500 3,700
Unemployment/Job Vacancies 6.15 3.3
December 20077,700
4,400
1.75
14

State and Local Labor Market Developments
15
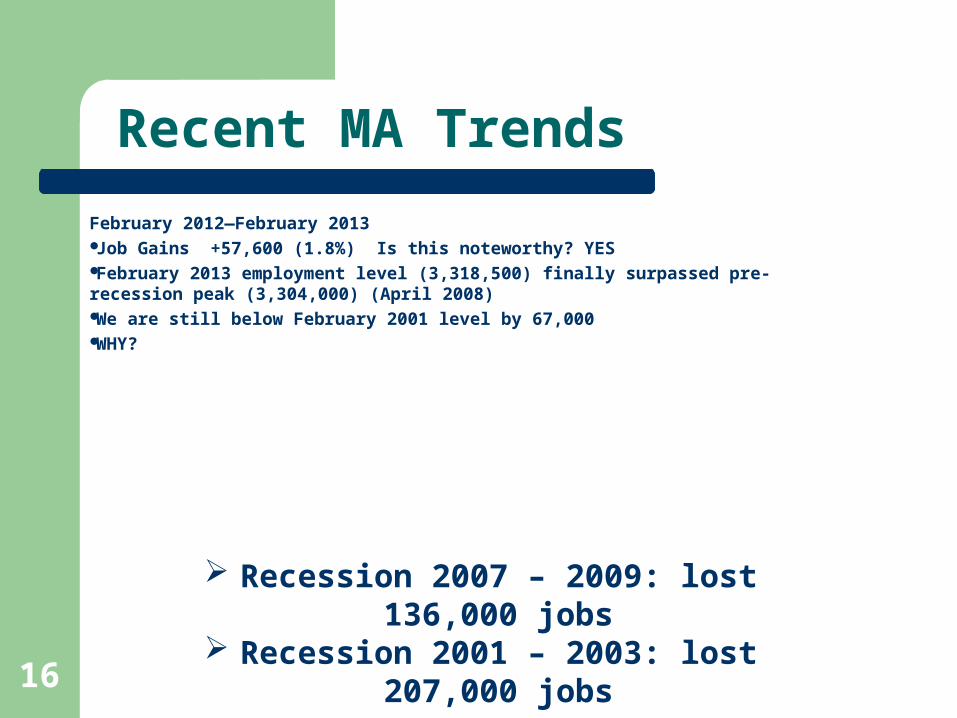
Recent MA Trends
February 2012—February 2013Job Gains +57,600 (1.8%) Is this noteworthy? YESFebruary 2013 employment level (3,318,500) finally surpassed pre-recession peak (3,304,000) (April 2008)We are still below February 2001 level by 67,000WHY?
Recession 2007 – 2009: lost 136,000 jobs Recession 2001 – 2003: lost 207,000 jobs
16

Recent MA Trends: Sector Changes
February 2012—February 2013Job Gains +57,600 (1.8%)Health and Social Assistance +4,900Accommodation and Food +11,500Professional and Technical +9,500Retail +4,100Temp Services- +7,900
17
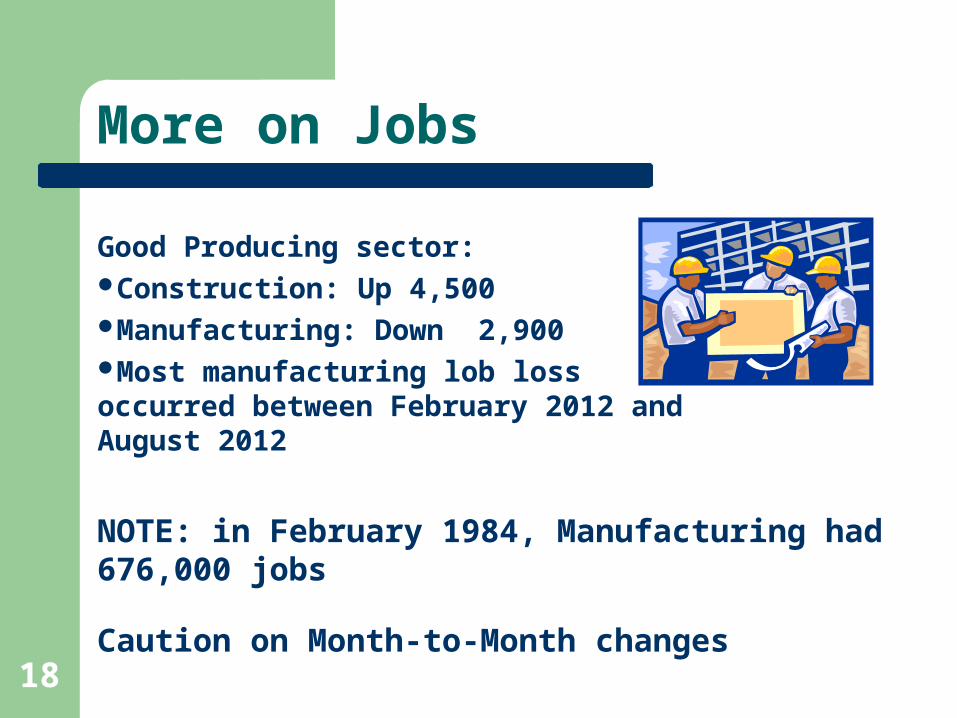
More on Jobs
Good Producing sector:Construction: Up 4,500Manufacturing: Down 2,900 Most manufacturing lob loss occurred between February 2012 and August 2012
Caution on Month-to-Month changes
NOTE: in February 1984, Manufacturing had 676,000 jobs
18
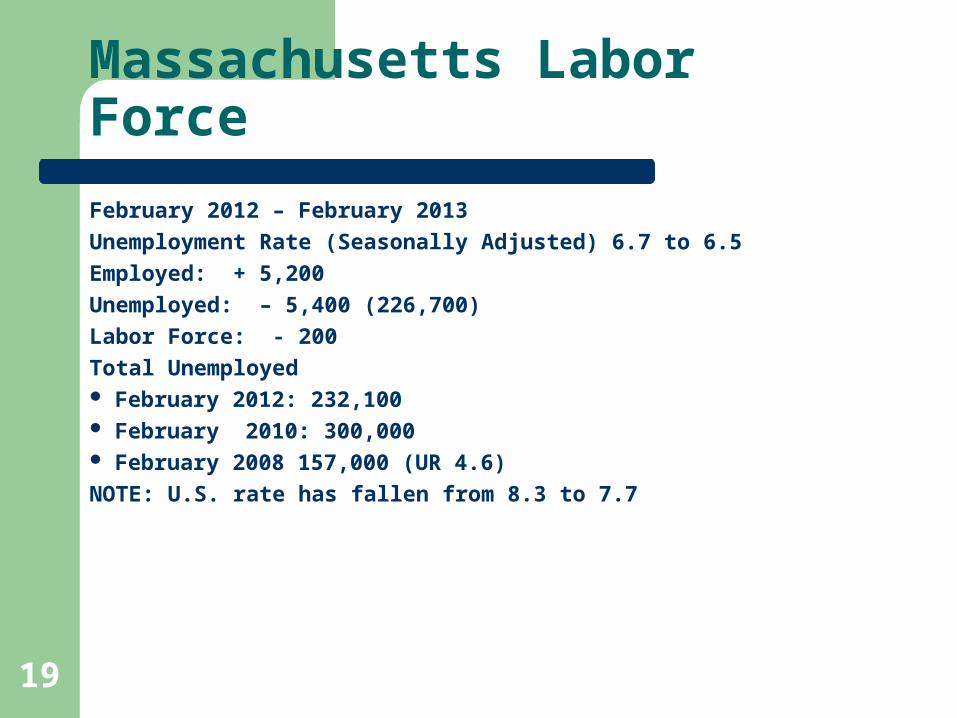
Massachusetts Labor Force
February 2012 – February 2013
Unemployment Rate (Seasonally Adjusted) 6.7 to 6.5
Employed: + 5,200
Unemployed: – 5,400 (226,700)
Labor Force: - 200
Total Unemployed February 2012: 232,100 February 2010: 300,000 February 2008 157,000 (UR 4.6)
NOTE: U.S. rate has fallen from 8.3 to 7.7
19
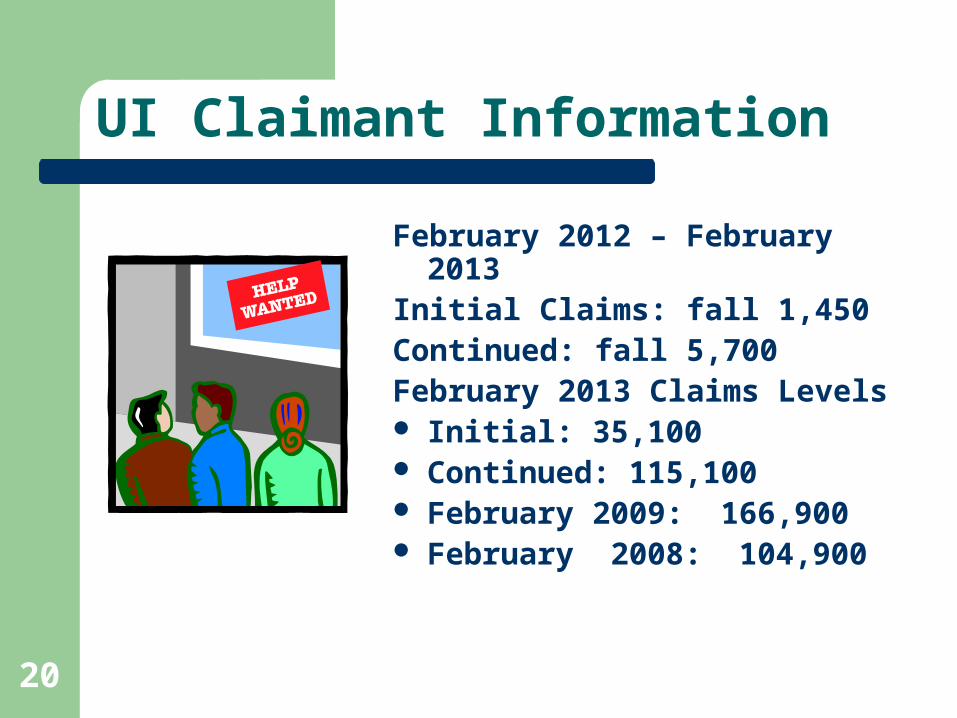
UI Claimant Information
February 2012 – February 2013Initial Claims: fall 1,450Continued: fall 5,700February 2013 Claims Levels Initial: 35,100 Continued: 115,100 February 2009: 166,900 February 2008: 104,900
20
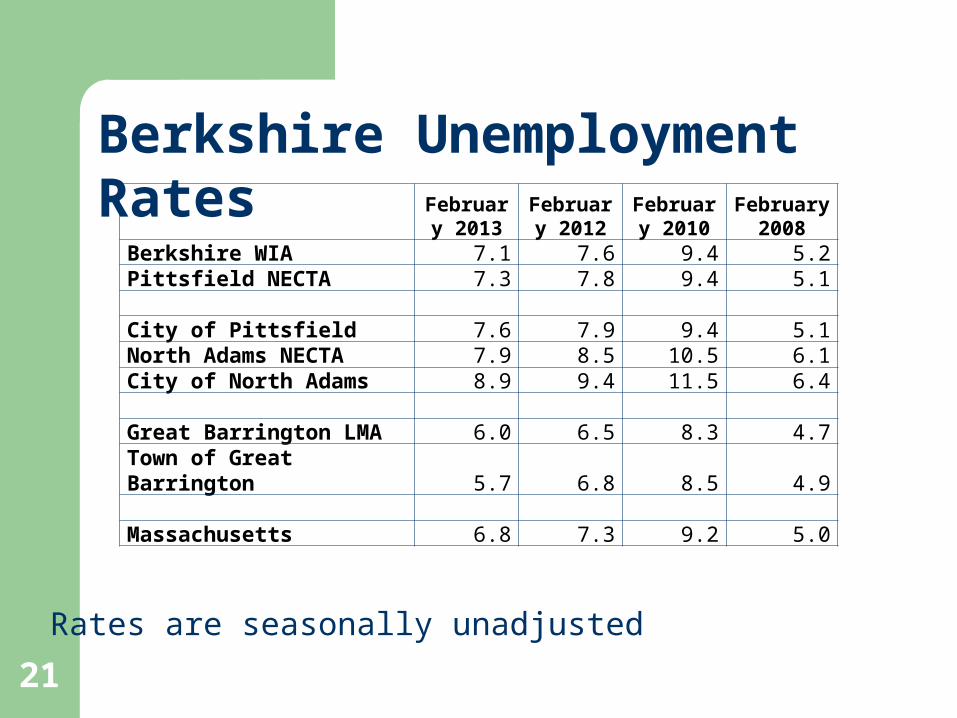
Berkshire Unemployment Rates
February
2013February
2012February
2010February
2008Berkshire WIA 7.1 7.6 9.4 5.2Pittsfield NECTA 7.3 7.8 9.4 5.1 City of Pittsfield 7.6 7.9 9.4 5.1North Adams NECTA 7.9 8.5 10.5 6.1City of North Adams 8.9 9.4 11.5 6.4 Great Barrington LMA 6.0 6.5 8.3 4.7Town of Great Barrington 5.7 6.8 8.5 4.9 Massachusetts 6.8 7.3 9.2 5.0
21
Rates are seasonally unadjusted

Berkshire Unemployed Persons
February
2013February
2012February
2010February
2008Berkshire WIA 4,976 5,479 6,763 3,744
Pittsfield NECTA 2,727 3,018 3,628 1,945 North Adams NECTA 1,309 1,445 1,831 1,060 Great Barrington LMA 972 1,064 1,368 780
22

Berkshire UI Claimants
February
2013February
2012February
2010February
2008Berkshire WIA
Initial Claims 572 725 821 634
Continued Claims 2,674 2,868 3,405 2,447
23
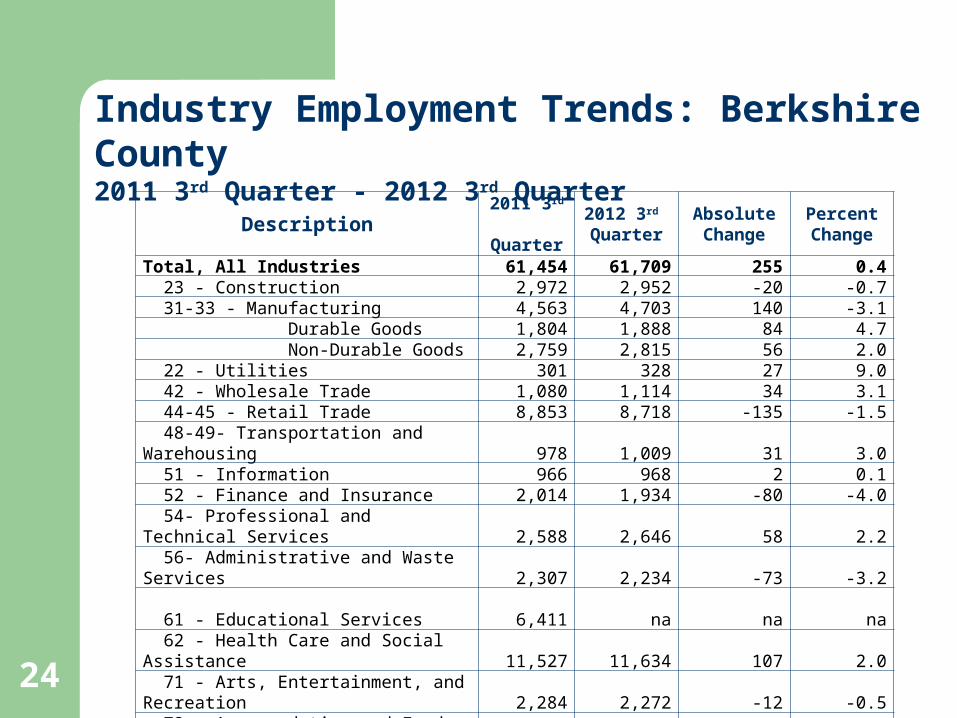
Industry Employment Trends: Berkshire County2011 3rd Quarter - 2012 3rd Quarter
Description 2011 3rd Quarter
2012 3rd Quarter
Absolute Change
Percent Change
Total, All Industries 61,454 61,709 255 0.4 23 - Construction 2,972 2,952 -20 -0.7 31-33 - Manufacturing 4,563 4,703 140 -3.1 Durable Goods 1,804 1,888 84 4.7 Non-Durable Goods 2,759 2,815 56 2.0 22 - Utilities 301 328 27 9.0 42 - Wholesale Trade 1,080 1,114 34 3.1 44-45 - Retail Trade 8,853 8,718 -135 -1.5 48-49- Transportation and Warehousing 978 1,009 31 3.0 51 - Information 966 968 2 0.1 52 - Finance and Insurance 2,014 1,934 -80 -4.0 54- Professional and Technical Services 2,588 2,646 58 2.2 56- Administrative and Waste Services 2,307 2,234 -73 -3.2 61 - Educational Services 6,411 na na na 62 - Health Care and Social Assistance 11,527 11,634 107 2.0 71 - Arts, Entertainment, and Recreation 2,284 2,272 -12 -0.5 72 - Accommodation and Food Services 7,601 7,867 266 3.5 92 - Public Administration 2,491 2,446 -45 -1.9
24

Job Structure of Massachusetts and The
Berkshires
25
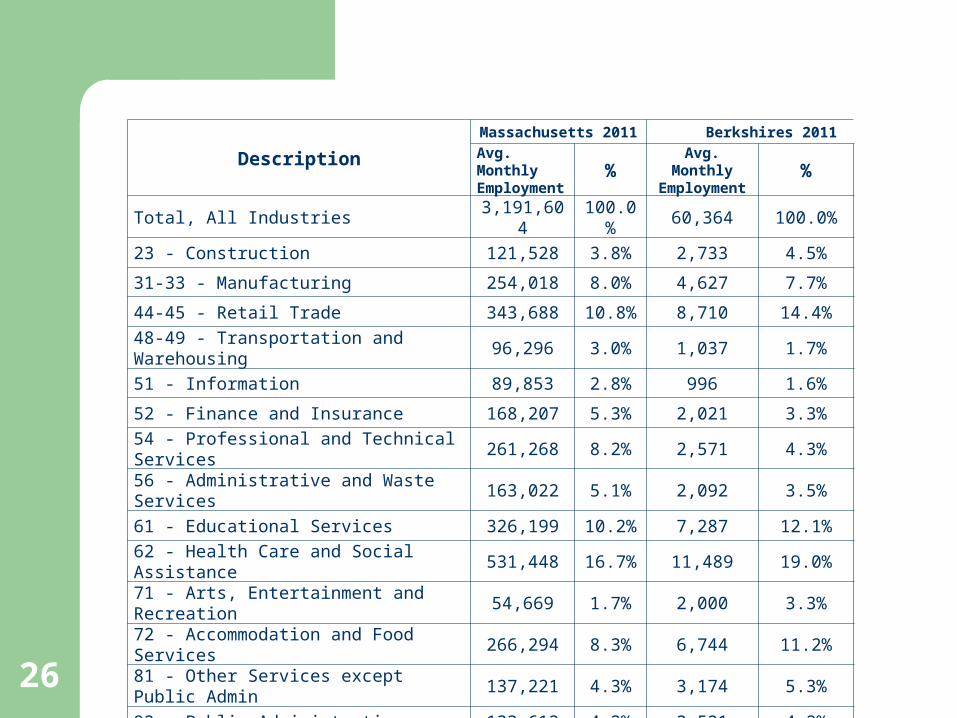
Description
Massachusetts 2011 Berkshires 2011
Avg. Monthly Employment
% Avg. Monthly Employment %
Total, All Industries 3,191,604 100.0% 60,364 100.0%
23 - Construction 121,528 3.8% 2,733 4.5%
31-33 - Manufacturing 254,018 8.0% 4,627 7.7%
44-45 - Retail Trade 343,688 10.8% 8,710 14.4%
48-49 - Transportation and Warehousing 96,296 3.0% 1,037 1.7%
51 - Information 89,853 2.8% 996 1.6%
52 - Finance and Insurance 168,207 5.3% 2,021 3.3%
54 - Professional and Technical Services 261,268 8.2% 2,571 4.3%
56 - Administrative and Waste Services 163,022 5.1% 2,092 3.5%
61 - Educational Services 326,199 10.2% 7,287 12.1%
62 - Health Care and Social Assistance 531,448 16.7% 11,489 19.0%
71 - Arts, Entertainment and Recreation 54,669 1.7% 2,000 3.3%
72 - Accommodation and Food Services 266,294 8.3% 6,744 11.2%
81 - Other Services except Public Admin 137,221 4.3% 3,174 5.3%
92 - Public Administration 133,612 4.2% 2,521 4.2%
26

Size Class Distribution: Massachusetts and The
Berkshires
27

Statewide Distribution of Establishments and Employment by Size Groups
March 2012
Number of EmployeesSize
Groups Units % Employment
%
Less than 20 0,1,2,3 200,336 88.1 736,201 23.1
20-99 4,5 21,877 9.6 881,331 27.7
100-249 6 3,490 1.5 520,940 16.4
250-499 7 898 0.39 308,204 9.9
500+ 8,9 587 0.26 734,686 23.1
Totals 227,188 100.0 3,181,362 100.0
28
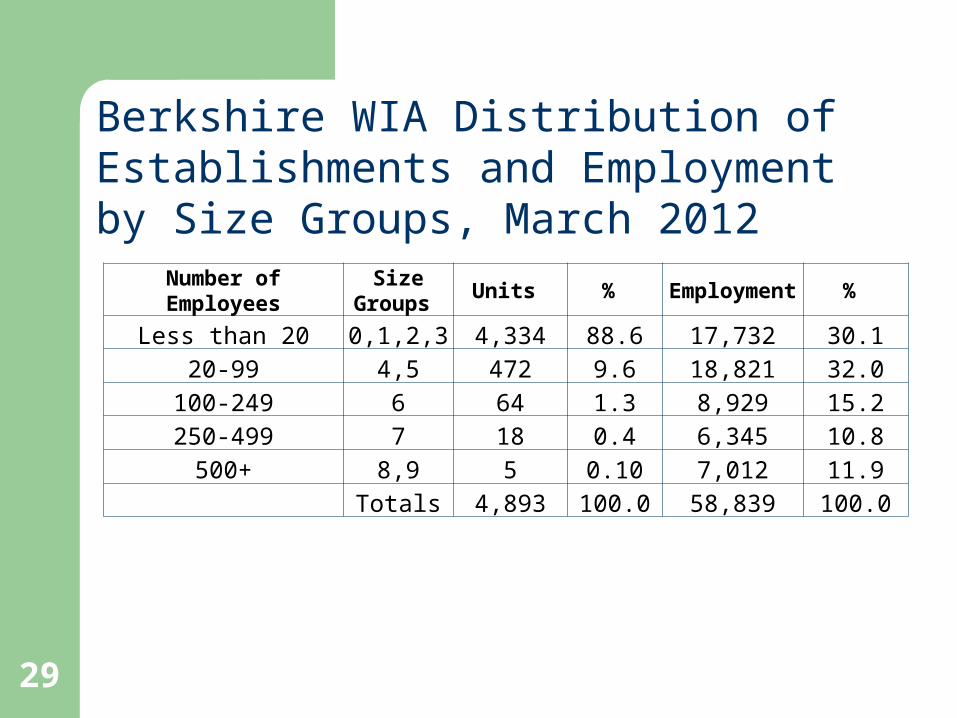
Berkshire WIA Distribution of Establishments and Employment by Size Groups, March 2012
Number of EmployeesSize
Groups Units % Employment %
Less than 20 0,1,2,3 4,334 88.6 17,732 30.120-99 4,5 472 9.6 18,821 32.0
100-249 6 64 1.3 8,929 15.2250-499 7 18 0.4 6,345 10.8
500+ 8,9 5 0.10 7,012 11.9 Totals 4,893 100.0 58,839 100.0
29
Commuting Patterns
30

Number %Total number of persons working in the Berkshires area: 65,694 100.0%Total who work in the Berkshires and who lived in:
Berkshire WIA 59,386 90.4%Franklin/Hampshire WIA 1,002 1.5%Hampden WIA 909 1.4%Other parts of Massachusetts 529 0.8%Other New England States 1,576 2.4%New York 2,557 3.9%
Total Berkshire residents who were employed: 64,058 100.0%Employed Berkshire residents who were working in:
Berkshire WIA 59,386 92.7%Franklin/Hampshire WIA 524 0.8%Hampden WIA 829 1.3%
Other parts of Massachusetts 362 0.6%
Other New England States 1,393 2.2%
New York 1,334 2.1%
Berkshire WIA
31
STEM Considerations
32
STEM Issues to Ponder
Defined as occupations but determined by industry structure
Why? Industries are where people work; occupations are what people do.
And, STEM occupations are concentrated in a subset of industries
33
What does this mean for The Berkshires?
Small employment in STEM-related industries Occupations requiring at least a Bachelor’s
Degree operate in Regional and National labor markets; not local markets
Very limited access to 4 year or graduate STEM programs in Berkshires. Will require partnerships and relationships that go beyond Berkshire
What are local STEM needs that do not require a Bachelor’s Degree?
34

Selected STEM-Related Industries in Berkshire WIA
Average Monthly
Employment%
Total Employment 54,058
54 Professional and Technical Services 2,571
5413 Architectural and Engineering Services 1,402 64.6%
5415 Computer Systems Design 188 8.7%
5416 Management and Technical Consulting 106 4.9%
5417 Scientific Research and Development 42 1.9%
5419 Other Professional and Technical Services 186 8.6%
5112 Software Publishers 10 0.5%
5191 Other Information Services 237 10.9%
Total STEM-Related Industries 2,171 100.0%
STEM Industry Review
35
Average Monthly
Employment%
Total Employment 54,058
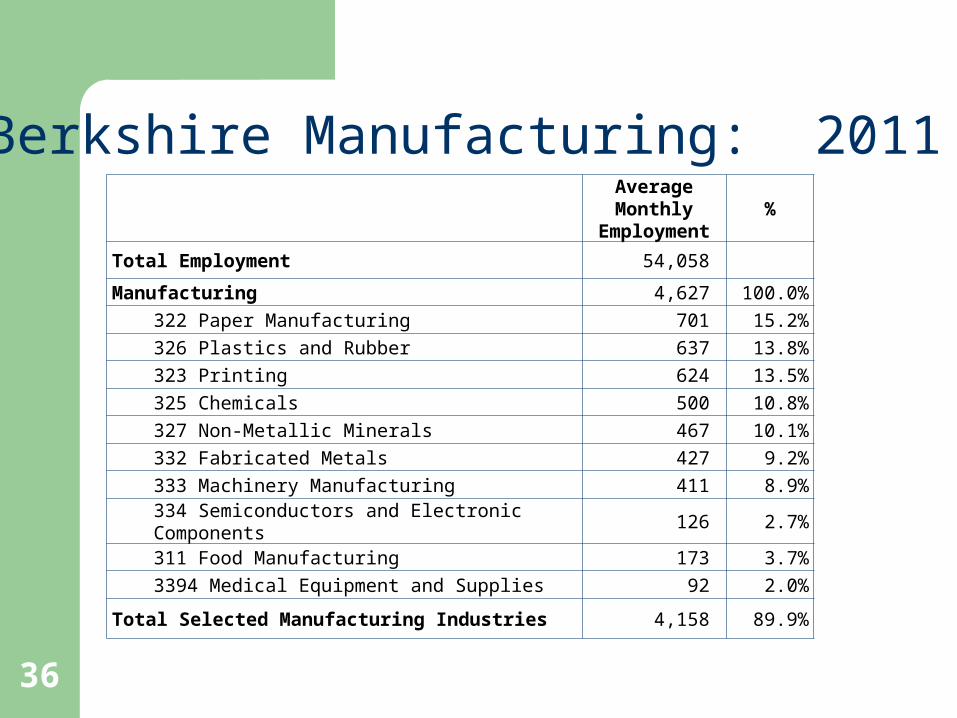
Manufacturing 4,627 100.0%322 Paper Manufacturing 701 15.2%326 Plastics and Rubber 637 13.8%323 Printing 624 13.5%325 Chemicals 500 10.8%327 Non-Metallic Minerals 467 10.1%332 Fabricated Metals 427 9.2%333 Machinery Manufacturing 411 8.9%334 Semiconductors and Electronic Components
126 2.7%
311 Food Manufacturing 173 3.7%3394 Medical Equipment and Supplies 92 2.0%
Total Selected Manufacturing Industries 4,158 89.9%
Berkshire Manufacturing: 2011
36

……………and…..
That’s
All
Folks!
37