PRESENTATION: PRICE AS A COST-PLUS STRATEGY … · PRESENTATION: PRICE AS A COST-PLUS STRATEGY AND...
13
PRESENTATION: PRICE AS A COST-PLUS STRATEGY AND ITS IMPLICATION Tamás Vámosi, Associate Professor Copenhagen Business School
-
Upload
nguyenkien -
Category
Documents
-
view
213 -
download
0
Transcript of PRESENTATION: PRICE AS A COST-PLUS STRATEGY … · PRESENTATION: PRICE AS A COST-PLUS STRATEGY AND...
PRESENTATION: PRICE AS A COST-PLUS STRATEGY AND ITS IMPLICATION Tamás Vámosi, Associate Professor Copenhagen Business School
2
Agenda:
• Challenges with a cost-plus pricing strategy regarding transfer prices and pricing implications in a Danish maritime company producing generators and power plants for ships.
• Difficulties in estimating costs exemplified by the cost-plus problem (Kaplan & Atkinson, 1998, p. 459).
• How to manage costs affecting pricing.

• Transfer pricing (TP); criteria and methods – Main criteria:
• ”The optimal transfer price for a product or service is its opportunity cost – it is the value forgone by not using the transferred product in its next best alternative use.” (Zimmerman, p. 178)
– But this criteria has to be balanced against (many) other criteria. The transfer price also has to be
• Congruent • Controllable • Manageable regarding to avoid manipulation/bias and • Cost effective to produce
– The choice of a transfer pricing method in companies is important, because
• “it does not merely reallocate total company profits among business units; it also affects the firm’s total profits.” (Zimmerman, p. 177)
3
4
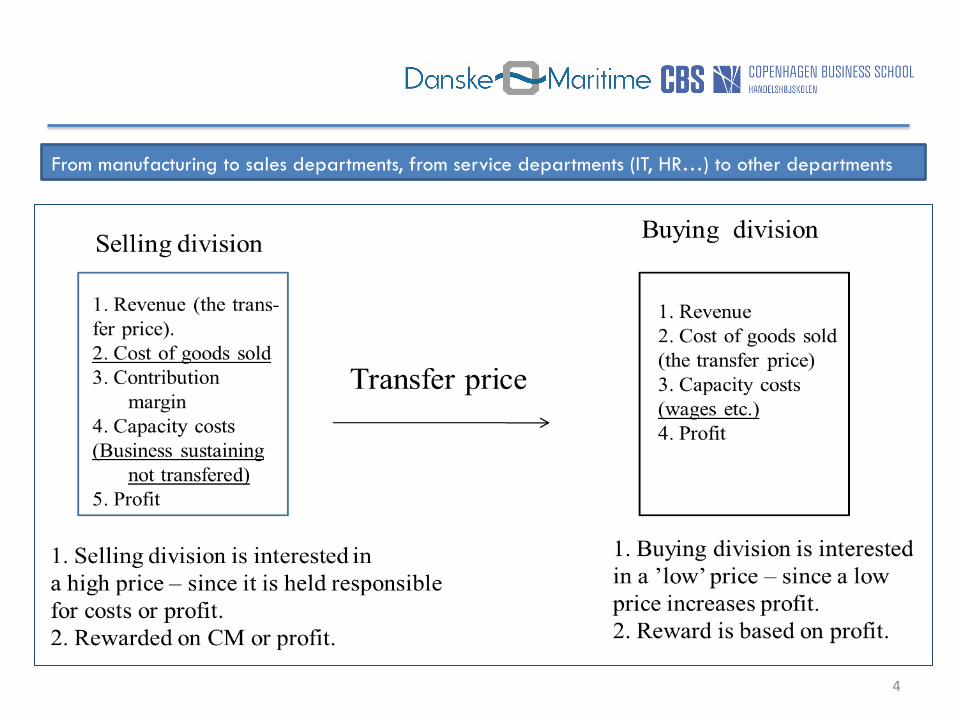
From manufacturing to sales departments, from service departments (IT, HR…) to other departments

5
TP methods and their advantages and disadvantages
Method Advantages Disadvantages
Market-based transfer prices Objective (?!) Less subject to manipulation Often leads to correct long-run make/buy decisions
Only exist for some products Might not capture interdependencies among divisions
Variable-cost transfer prices Can approximate the opportunity cost of transferring one more unit Gives the buying division incentive to purchase the correct number of units if selling division has excess capacity
Variable cost might vary with output Variable cost can be a poor approximation of opportunity cost Selling division has incentive to overuse variable cost
Full-cost transfer prices Avoids disputes over which costs are fixed and which are variable Can approximate opportunity costs
Selling division can export its inefficiencies to the buying division Death spiral
Poor estimation of opportunity costs Imprecise calculations
Negotiated transfer prices Both selling and buying divisions have incentives to transfer the number of units that maximize profits
Time consuming Depends on the relative negotiating skills of the two divisions (power)
Reorganize the buying and selling division
Eliminates costly disputes over transfer pricing
Reduces the benefits from having two decentralized responsibility centers

6
Power plant
7
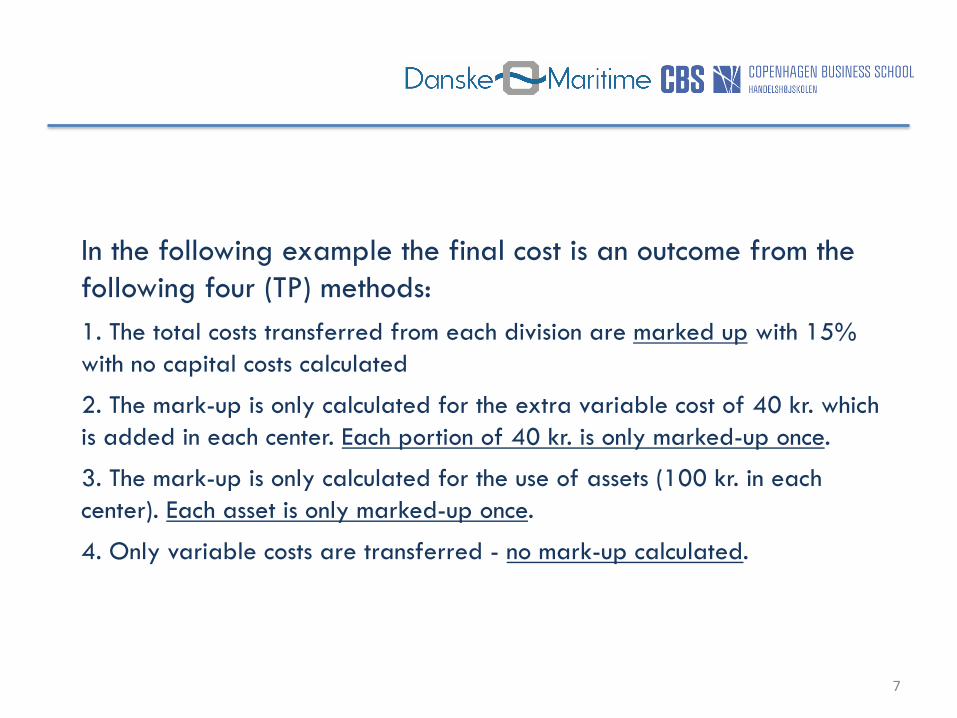
In the following example the final cost is an outcome from the following four (TP) methods: 1. The total costs transferred from each division are marked up with 15% with no capital costs calculated
2. The mark-up is only calculated for the extra variable cost of 40 kr. which is added in each center. Each portion of 40 kr. is only marked-up once.
3. The mark-up is only calculated for the use of assets (100 kr. in each center). Each asset is only marked-up once.
4. Only variable costs are transferred - no mark-up calculated.

The cost-plus problem - inspired by a case company in the Danish Maritime Industry
8
100 + 40 kr. 100 kr. (VO)
TP from division 2 + 40 kr.
TP from division 1 + 40 kr.
Assumptions: 1. Cost of capital 15% 2. The 40 kr. is the extra variable costs
incurred in each division. 3. Each division holds 100 kr. in assets
TP from division 3 + 40 kr.
TP from division 4 + 40 kr. Final cost
Division 1 Division 2 Division 3
Division 4 Division 5
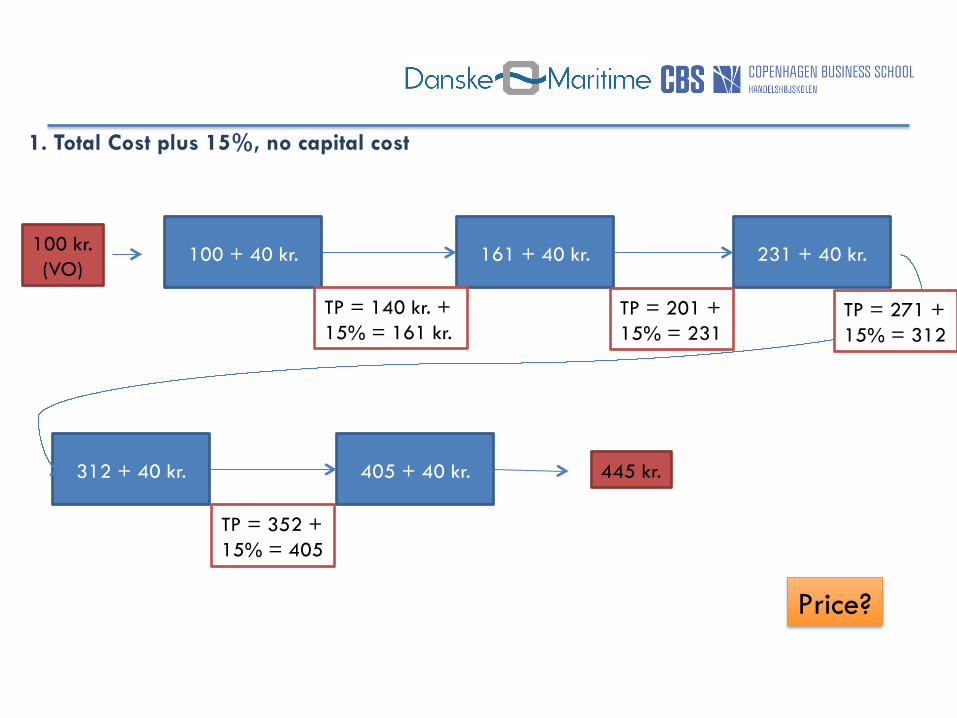
1. Total Cost plus 15%, no capital cost
9
100 + 40 kr. 100 kr. (VO)
231 + 40 kr. 161 + 40 kr.
TP = 140 kr. + 15% = 161 kr.
TP = 201 + 15% = 231
312 + 40 kr. 405 + 40 kr.
TP = 271 + 15% = 312
TP = 352 + 15% = 405
Price?
445 kr.
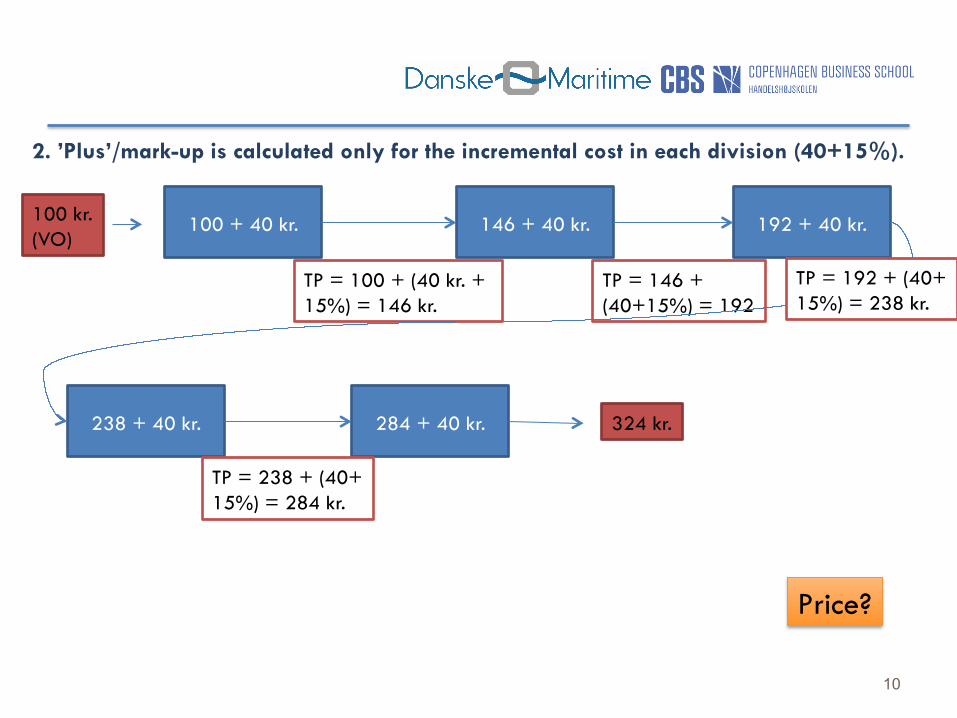
2. ’Plus’/mark-up is calculated only for the incremental cost in each division (40+15%).
10
100 + 40 kr. 100 kr. (VO)
192 + 40 kr. 146 + 40 kr.
TP = 100 + (40 kr. + 15%) = 146 kr.
TP = 146 + (40+15%) = 192
238 + 40 kr. 284 + 40 kr.
TP = 192 + (40+ 15%) = 238 kr.
TP = 238 + (40+ 15%) = 284 kr.
324 kr.
Price?
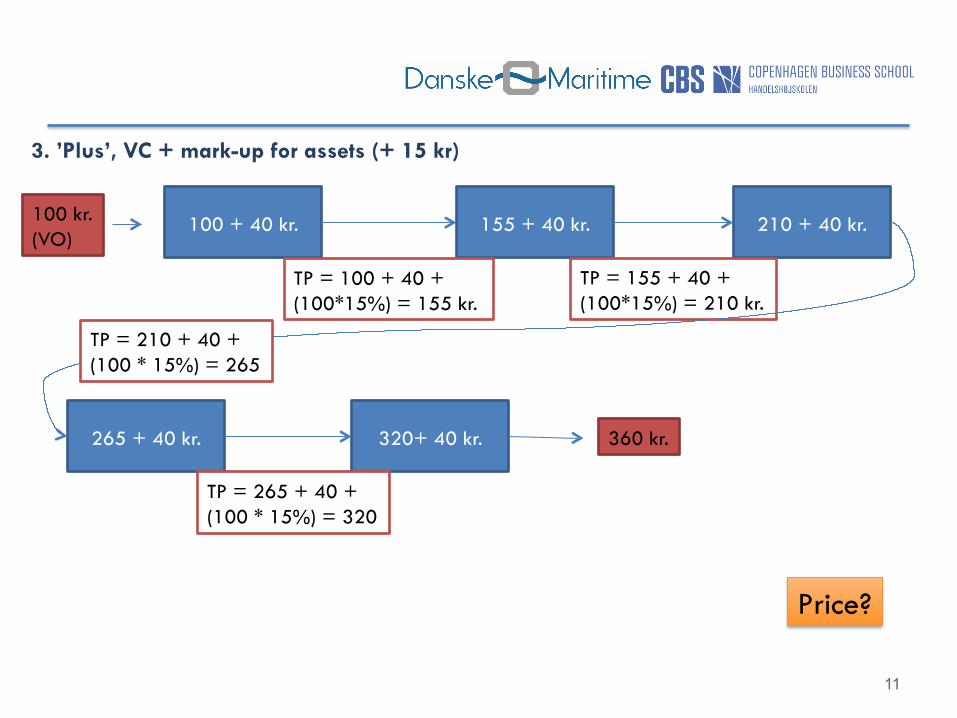
3. ’Plus’, VC + mark-up for assets (+ 15 kr)
11
100 + 40 kr. 100 kr. (VO)
210 + 40 kr. 155 + 40 kr.
TP = 100 + 40 + (100*15%) = 155 kr.
TP = 155 + 40 + (100*15%) = 210 kr.
265 + 40 kr. 320+ 40 kr.
TP = 210 + 40 + (100 * 15%) = 265
360 kr.
Price?
TP = 265 + 40 + (100 * 15%) = 320
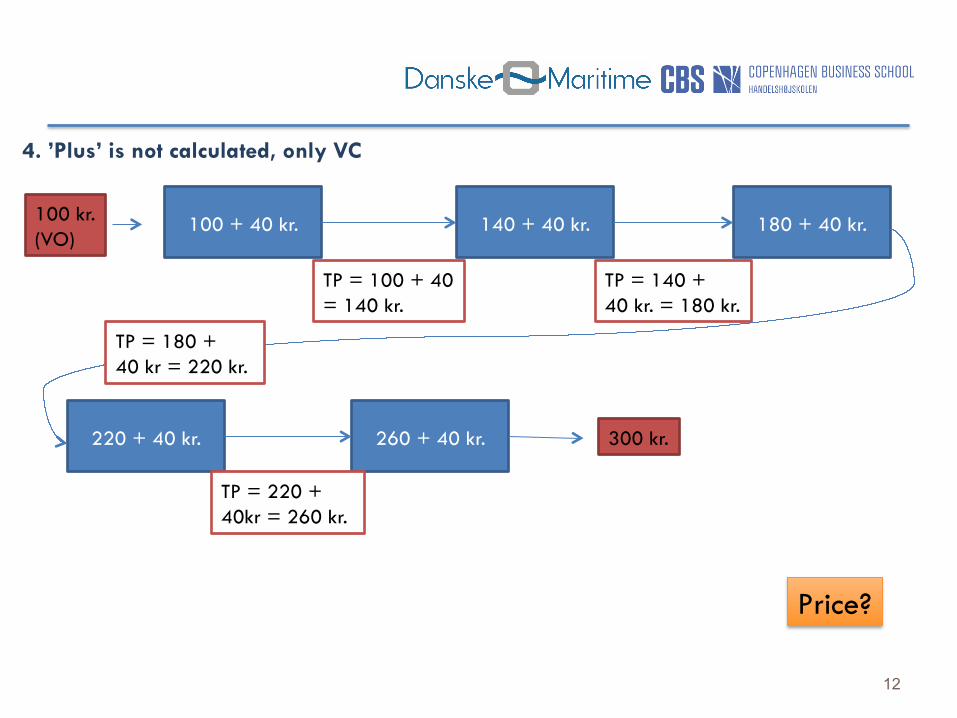
4. ’Plus’ is not calculated, only VC
12
100 + 40 kr. 100 kr. (VO)
180 + 40 kr. 140 + 40 kr.
TP = 100 + 40 = 140 kr.
TP = 140 + 40 kr. = 180 kr.
220 + 40 kr. 260 + 40 kr.
TP = 180 + 40 kr = 220 kr.
300 kr.
Price?
TP = 220 + 40kr = 260 kr.
Conclusions ¨ Criteria for ‘good performance measures’ are important
when analyzing transfer prices – these has to be taken into consideration due to effects on costs/CM/profit. Often ignored!
¨ ‘Final costs’ varies much (in the ex. between 300 – 445) with huge impact on final price. Double (triple ….) mark-up is a potential, dangerous trap. In case of 1) decentralized decision rights and 2) alternative, available market suppliers ‘death spirals’ might occur.
¨ Costing practices and choice of transfer price method influence the allocation of intra organizational/divisional ‘profit’ – and (also) through this process final prices and firm profit.
13