
Presentation for donor mission 2007 December
37
Formative Research Project for EFA 2004-09 Major Findings of the Major Findings of the Longitudinal Study on System Indicators (based on 62 sample schools from 16 districts
-
Upload
roshan-chitrakar -
Category
Documents
-
view
8 -
download
0
Transcript of Presentation for donor mission 2007 December

Formative Research Project for EFA 2004-09
Major Findings of the Major Findings of the Longitudinal Study on System
Indicators(based on 62 sample schools from
16 districts

Major Achievements
• Systematic primary education database of 62
sampled schools established.
• Computer software (MS Access) developed for data
management, analysis and reporting—can be
adapted by schools, RCs, ETCs and DEOs.
• 5-year cohort data of the individual student
available with 2002 as the base year.
• School-specific compilation of data made available
to each of the 62 sampled schools
• Critical issues of EFA diagnosed—areas of further
research for in-depth qualitative study identified

Key Outcomes
1. Cohort Analysis (student tracking of all grade-
one new-entrants except school leavers)—
complete primary cycle for 2002 cohort
2. Indicator specific trend analysis of school data
(overall data of students, teachers and
schools)

Promotion flow of first grade new enrollees by cohorts
Cohort Year
Students Grade 1 new intake
Grade 2 in year 2
Grade 3 in year 3
Grade 4 in year 4
Grade 5 in year 5
2002Total 2589 1327 (51.3) 819 (31.6) 657 (25.4) 544 (21.0)
Girls 1318 702 (53.3) 449 (34.1) 364 (27.6) 296 (22.5)
2003Total 2260 957 (42.3) 724 (32.0) 644 (28.8)
Girls 1136 481 (42.3) 364 (32.0) 327 (28.5)Girls 1136 481 (42.3) 364 (32.0) 327 (28.5)
2004Total 2702 1375 (50.9) 1116 (41.3)
Girls 1375 730 (53.1) 597 (43.4)
2005Total 3653 2341 (64.0)
Girls 1885 1221 (64.8)
2006Total 2674
Girls 1328
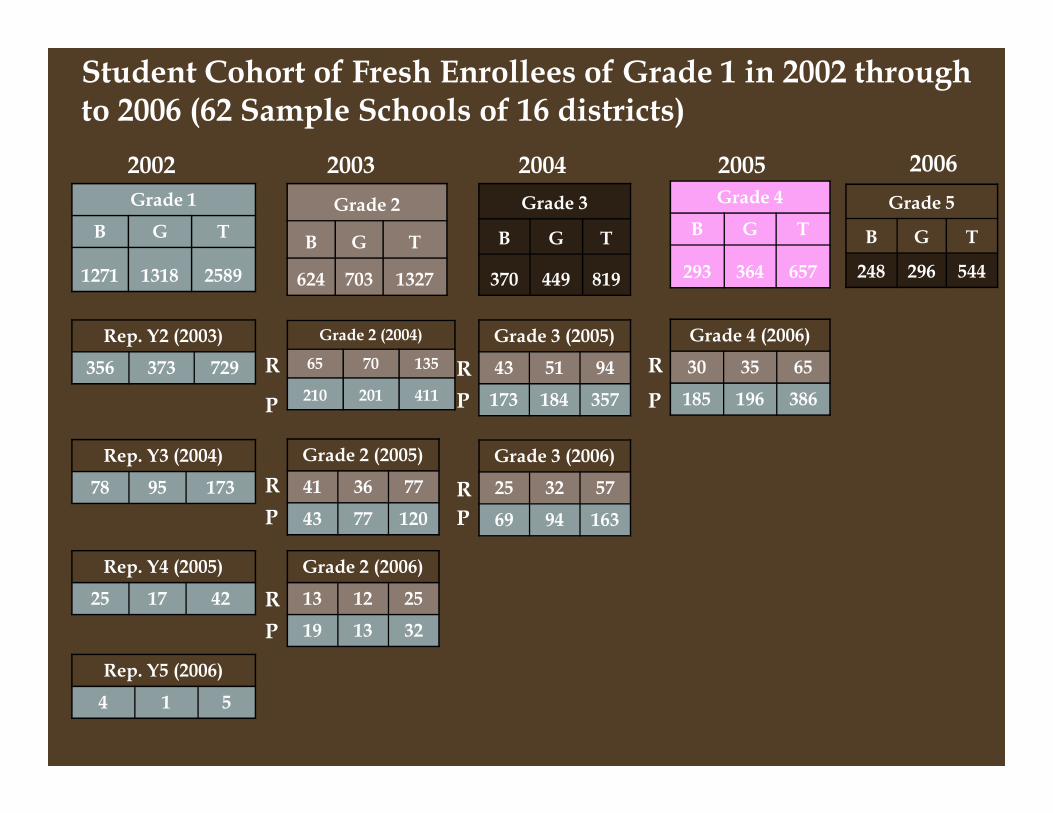
Grade 1
B G T
1271 1318 2589
Grade 2
B G T
624 703 1327
Grade 3
B G T
370 449 819
Grade 4
B G T
293 364 657
Grade 5
B G T
248 296 544
2002 2003 2004 2005 2006
Rep. Y2 (2003)
356 373 729
Grade 2 (2004)
65 70 135
210 201 411P
Grade 3 (2005)
43 51 94
173 184 357
Grade 4 (2006)
30 35 65
185 196 386P
RR R
P
Student Cohort of Fresh Enrollees of Grade 1 in 2002 through to 2006 (62 Sample Schools of 16 districts)
Rep. Y3 (2004)
78 95 173
Rep. Y4 (2005)
25 17 42
Rep. Y5 (2006)
4 1 5
P
Grade 2 (2005)
41 36 77
43 77 120
Grade 2 (2006)
13 12 25
19 13 32
173 184 357
Grade 3 (2006)
25 32 57
69 94 163
185 196 386P
P
R
P
R
R
P
P

G V
544
Where are the 2589 Grade One Fresh Enrollees of
2002 in 2006?
In School Total
1273(49%)G IV
447G III
220G II
57G I
5
G V
296Girls
682 (54%)G IV
231G III
126G II
25G I
4
G V
248Boys
591 (46%)G IV
216G III
94G II
32G I
1
School Leavers
1316
(51%)

2002 2003 2004 2005 2006
Cohort 2002-2006 of Students with ECD Background
(62 Schools from 16 sample districts)
Grade 1 Grade 2 Grade 3 Grade 4 Grade 5
Source: FRP Longitudinal Study on System Indicators
Grade 1
B G T
170 170 340
100% 100% 100%
Grade 2
B G T
108 115 223
64% 68% 65%
Grade 3
B G Tot
65 77 142
38% 45% 42%
Grade 4
B G T
55 66 121
32% 39% 35%
Grade 5
B G T
50 55 105
29% 32% 31%

2002 2003 2004 2005 2006
Cohort 2002-2006 of Students without ECD Background
(62 Schools from 16 sample districts)
Grade 1 Grade 2 Grade 3 Grade 4 Grade 5
Source: FRP Longitudinal Study on System Indicators
Grade 1
B G T
1101 1148 2249
100% 100% 100%
Grade 2
B G T
516 588 1104
47% 51% 49%
Grade 3
B G Tot
305 372 677
28% 32% 30%
Grade 4
B G T
238 298 536
22% 26% 24%
Grade 5
B G T
198 241 439
18% 21% 20%
2002 2003 2004 2005 2006
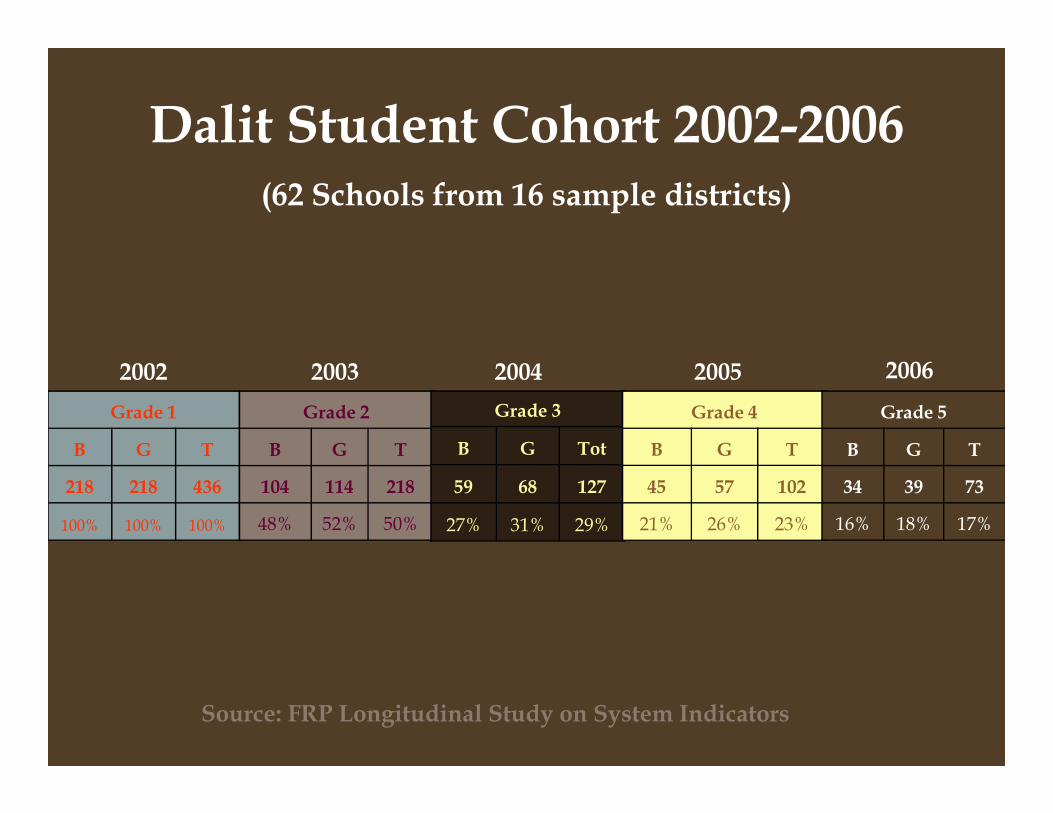
Dalit Student Cohort 2002-2006(62 Schools from 16 sample districts)
Grade 1 Grade 2 Grade 3 Grade 4 Grade 5
Source: FRP Longitudinal Study on System Indicators
Grade 1
B G T
218 218 436
100% 100% 100%
Grade 2
B G T
104 114 218
48% 52% 50%
Grade 3
B G Tot
59 68 127
27% 31% 29%
Grade 4
B G T
45 57 102
21% 26% 23%
Grade 5
B G T
34 39 73
16% 18% 17%

2002 2003 2004 2005 2006
Tharu Student Cohort 2002-2006(62 Schools from 16 sample districts)
Grade 1 Grade 2 Grade 3 Grade 4 Grade 5
Source: FRP Longitudinal Study on System Indicators
Grade 1
B G T
189 180 369
100% 100% 100%
Grade 2
B G T
87 95 182
46% 53% 49%
Grade 3
B G Tot
53 68 121
28% 38% 33%
Grade 4
B G T
38 52 90
20% 29% 24%
Grade 5
B G T
34 43 77
18% 24% 21%
2002 2003 2004 2005 2006
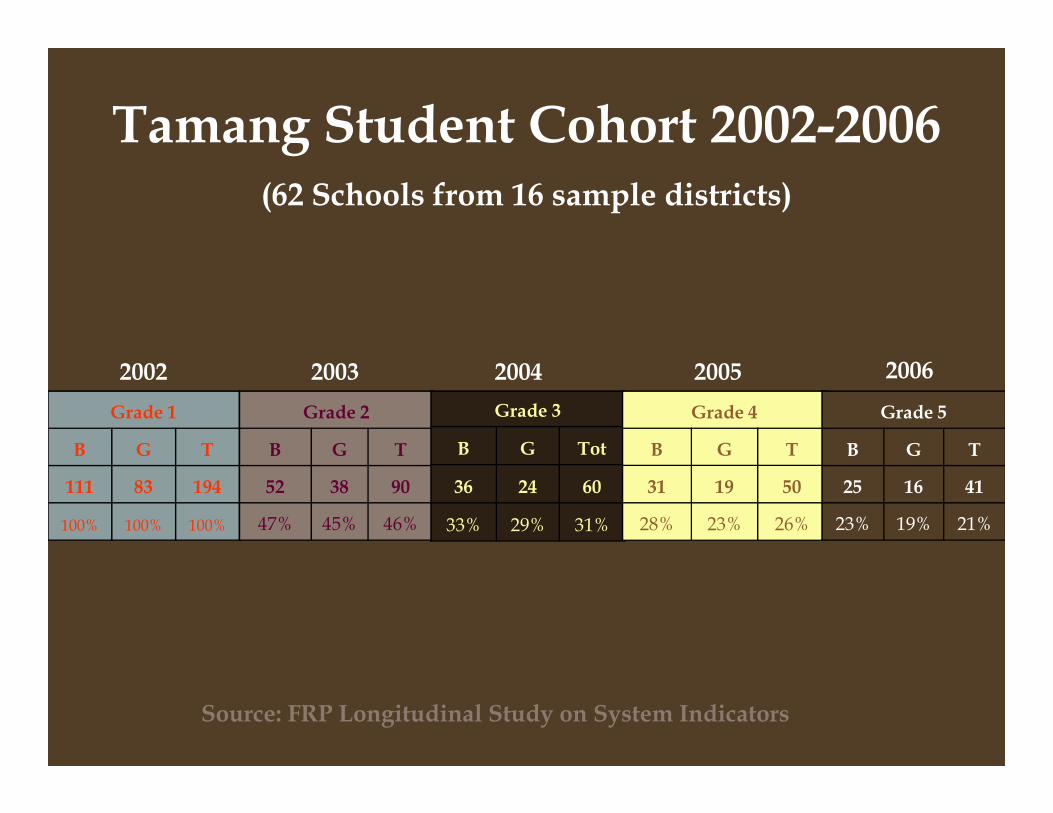
Tamang Student Cohort 2002-2006(62 Schools from 16 sample districts)
Grade 1 Grade 2 Grade 3 Grade 4 Grade 5
Source: FRP Longitudinal Study on System Indicators
Grade 1
B G T
111 83 194
100% 100% 100%
Grade 2
B G T
52 38 90
47% 45% 46%
Grade 3
B G Tot
36 24 60
33% 29% 31%
Grade 4
B G T
31 19 50
28% 23% 26%
Grade 5
B G T
25 16 41
23% 19% 21%

2002 2003 2004 2005 2006
Muslim Student Cohort 2002-2006(62 Schools from 16 sample districts)
Grade 1 Grade 2 Grade 3 Grade 4 Grade 5
Source: FRP Longitudinal Study on System Indicators
Grade 1
B G T
64 55 119
100% 100% 100%
Grade 2
B G T
28 20 48
44% 36% 40%
Grade 3
B G Tot
13 10 23
20% 18% 19%
Grade 4
B G T
9 8 17
14% 15% 14%
Grade 5
B G T
8 7 15
13% 13% 13%

Region Students Grade 1 Grade 2 Grade 3 Grade 4 Grade 5
Overall
Total 2589 1327(51.3)819(31.6)
657 (25.4) 544 (21.0)
Girls 1318 702 (53.3) 449 (34.1) 364 (27.6) 296 (22.5)
EasternTotal 718 329 (45.8) 201 (28.0) 180(25.1) 167 (23.3)
Girls 358 176 (49.2) 109 (30.4) 98 (27.4) 94(26.3)
Promotion flow of 2002 first grade new enrollees through the primary cycle by region
CentralTotal 532 223 (41.9) 157 (29.5) 125 (23.5) 103(19.4)
Girls 270 117 (43.3) 87 (32.2) 68 (25.2) 56 (20.7)
WesternTotal 397 203 (51.1) 134 (33.8) 113 (28.5) 84 (21.2)
Girls 212 116 (54.7) 72 (34.0) 61 (28.8) 44 (20.8)
Mid-westTotal 379 146 (38.5) 86(22.7) 66 (17.4) 52 (13.7)
Girls 191 71 (37.2) 44 (23.0) 34 (17.8) 30 (15.7)
Far-WestTotal 506 202 (39.9) 148 (29.2) 108 (21.5) 95 (18.8)
Girls 259 110 (42.5) 86 (33.2) 59 (22.8) 52 (20.1)

Year Students Grade 1 Grade 2 Grade 3 Grade 4 Total Repeater
2003Total 729 (28.2) 729 (28.2)
Girls 373 (28.3) 373 (28.3)
2004Total 135 (6.0) 173 (7.7) 308 (11.9)
Girls 70 (6.2) 95 (8.4) 165 (12.5)
Repetition flow of 2589 first grade new enrollees of 2002 through the first 5-year
2005Total 42 (1.6) 77 (2.8) 94 (3.5) 213 (8.2)
Girls 17 (1.2) 36 (2.6) 51 (3.7) 104 (7.9)
2006Total 5 (0.1) 25 (0.7) 57 (1.7) 65 (2.0) 152 (5.9)
Girls 1 (0.1) 12 (0.7) 32 (2.0) 35 (2.2) 80 (6.1)
Overall Total 911 (35.2) 275 (10.6) 151 (5.8) 65 (2.0) 1402(54.2)
Girls 461 (35.0) 143 (10.8) 83 (6.3) 35 (2.0) 722 (54.8)

Year Students Grade 1 Grades 1 & 2
Grades 1, 2 & 3
Grades 1, 2, 3 & 4
Total School Leavers
2003Total 533 (20.6) 533
Girls 242 (18.4) 242
2004Total 518 (25.2) 518
Girls 261 (24.3) 261
Flow of school-leavers from among the 2589
first grade new enrollees of 2002 through the first 5-year primary cycle
2005Total 191 (12.0) 191
Girls 86 (11.0) 86
2006Total 74 (5.5) 74
Girls 50 (6.9) 50
Overall
Total 1316 (51%)
Girls 639 (48.5%)
Boys 677 (53.3 %)

50
60
70
80
90
Su
rviv
al
perc
en
t
Boys
Girls
Total
School-wise percentage distribution of students
surviving up to grade 5 (2002 cohort)
0
10
20
30
40
50
1 3 5 7 9 11 13 15 17 19 21 23 25 27 29 31 33 35 37 39 41 43 45 47 49 51 53 55 57 59 61
School rank
Su
rviv
al
perc
en
t

Caste/ethnic group
Students
Grade 1
Grade 2 Grade 3 Grade 4 Grade 5
OverallTotal 2589 1327(51.3) 819(31.6) 657 (25.4) 544 (21.0)
Girls 1318 702 (53.3) 449 (34.1) 364 (27.6) 296 (22.5)
Highly Total 20 9 (45.0) 7 (35.0) 5 (25.3) 5 (25.0)
Promotion flow of 2002 first grade new enrollees
through the primary cycle by ethnic/caste groups
Highly marginalized ethnic
Total 20 9 (45.0) 7 (35.0) 5 (25.3) 5 (25.0)
Girls 8 3 (37.5) 2 (25.0) 2 (25.0) 2 (25.0)
DalitTotal 436 218 (50.0) 127 (29.1) 102 (23.4) 73 (16.7)
Girls 218 114 (52.3) 68 (31.2) 57 (26.1) 39 (17.9)
Chamar, Harijan & Ram
Total 10 5 (50.0) 5 (50.0) 3 (30.0) 2 (20.0)
Girls 4 2 (50.0) 2 (50.0) 2 (50.0) 1 (25.0)
MuslimTotal 119 39 (32.8) 17 (14.3) 15 (12.6) 14 (11.8)
Girls 54 17 (31.5) 8 (14.8) 7 (13.0) 7 (13.0)

Cohort year
Girlsn=5441
Boysn=5250
With ECD
Without ECD
Difference With ECD
Without ECD
Difference
2002 67.6 51.2 16.4 63.5 46.9 16.6
Promotion flow (in %) of grade-one students
by cohort year and ECD background
2002NE=2589
67.6(115)
51.2(588)
16.4 63.5(108)
46.9(516)
16.6
2003NE=2260
43.7(107)
42.0(374)
1.7 41.6(87)
42.5(389)
-0.9
2004NE=2702
62.4(143)
51.2(587)
11.2 65.1(114)
46.1(531)
19.0
2005NE=3653
77.0(231)
62.5(990)
14.5 76.5(218)
60.8(902)
15.7

Students with
2002Grade I
2003Grade II
2004Grade III
2005Grade IV
2006Grade V
Boys Girls Total Boys Girls Total Boys
Girls
Total Boys Girls Total Boys Girls Total
Cohort flow of 2002 grade one enrollees by ECD background
ECD
170(100)
170(100)
340(100)
108(64)
115(68)
223(65)
65(38)
77(45)
142(42)
55(32)
66(39)
121(35)
50(29)
55(32)
105(31)
No ECD
1101(100)
1148(100)
2249(100)
516(47)
588(51)
1104(49)
305(28)
372(32)
677(30)
238(22)
298(26)
536(24)
198(18)
241(21)
439(20)
Total
1271(100)
1318(100)
2589(100)
624(49)
703(53)
1327(51)
370(29)
449(34)
819(32)
293(23)
364(28)
657(25)
248(20)
296(22)
544(21)

Enrollment Growth Pattern
100.00
110.00
120.00
130.00
140.00
150.00
160.00
170.00
70.00
80.00
90.00
100.00
1999 2000 2001 2002 2003 2004 2005 2006
Grade 1 Grade 2 Grade 3 Grade 4 Grade 5 Total
There is a steady growth in enrolment of primary students since 1999.
The growth observed in 2006 from 2005 is sudden except in grade 1 in
which the growth has been negative

10.0
15.0
20.0
25.0
Percentage of New Entrants with ECD in
Grade 1
0.0
5.0
1999 2000 2001 2002 2003 2004 2005 2006
Boys Girls Total
A steady growth till 2001.
A steep growth from 2001 to 2003. (about 3% points more in the case of girls).
A decreasing trend fro 2003 to 2005 and again a growth in 2006

Student Teacher Ratio
Region /Year 2002 2003 2004 2005 2006
Mountain 19.1 18.4 20.5 19.7 18.7
Hill 29.4 28.2 35.2 37.7 35.4
Terai 42.5 42.9 53.2 53.0 48.8Terai 42.5 42.9 53.2 53.0 48.8
Valley 24.7 22.8 31.4 26.6 21.6
Total 31.7 31.0 38.4 40.3 37.2
The ratio is consistently lowest in mountain belt in all the five years.
Highest in Terai (with an increase in 2004 and 2005)
The average STR is 37.2 which is less than national STR 45.2 in primary level
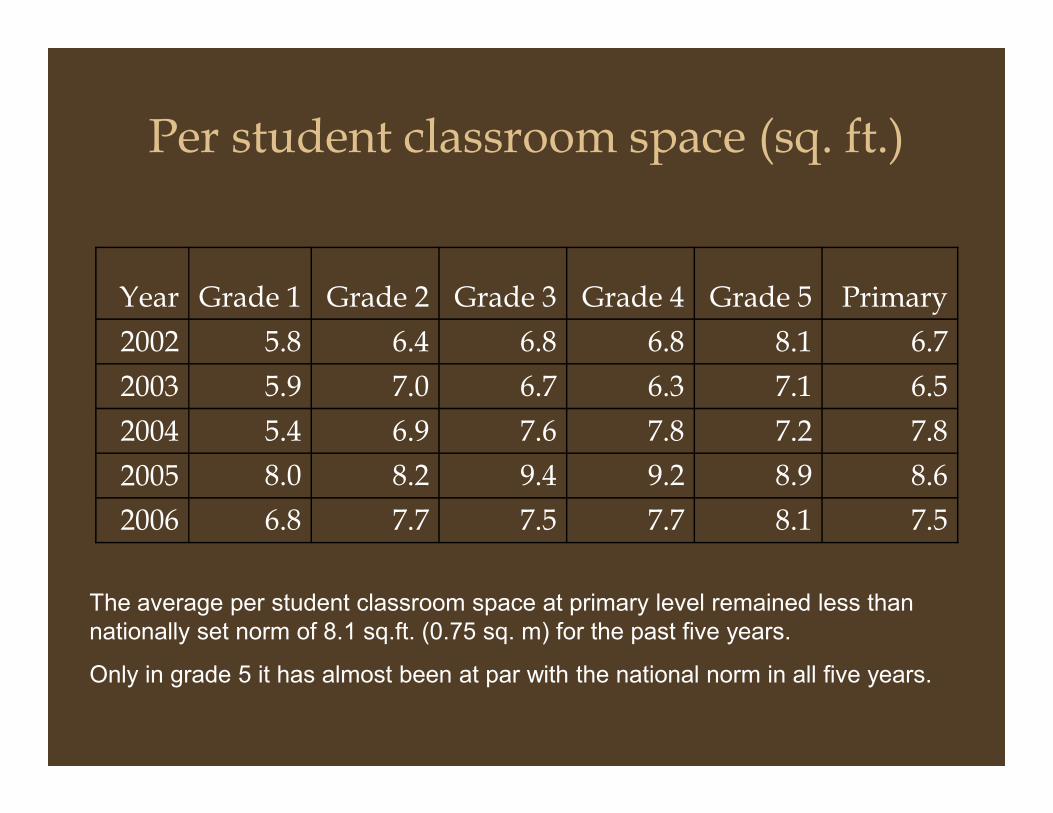
Per student classroom space (sq. ft.)
Year Grade 1 Grade 2 Grade 3 Grade 4 Grade 5 Primary
2002 5.8 6.4 6.8 6.8 8.1 6.7
2003 5.9 7.0 6.7 6.3 7.1 6.5
2004 5.4 6.9 7.6 7.8 7.2 7.8
2005 8.0 8.2 9.4 9.2 8.9 8.6
2006 6.8 7.7 7.5 7.7 8.1 7.5
The average per student classroom space at primary level remained less than
nationally set norm of 8.1 sq.ft. (0.75 sq. m) for the past five years.
Only in grade 5 it has almost been at par with the national norm in all five years.

Gender parity index of students of primary grade
Gender Parity
0.95
1.00
1.05
1.10
0.80
0.85
0.90
0.95
1999 2000 2001 2002 2003 2004 2005 2006
Enrolment of girls in primary schools has out numbered that of boys after 2004.

Effect of ECD on student promotion in grade 1 (2002-2006)
Pass
Percent
with ECD
Pass
Percent
without
Pass
Percent
with ECD
Pass
Percent
without
Year
Boys
Changes in
Pass
Percent
Girls
Changes
in Pass
Percentwith ECD
without
ECDwith ECD
without
ECD
2002 74.50 48.66 26 75.00 53.50 21.50
2003 56.38 53.41 3 50.00 52.20 -2.20
2004 67.60 54.47 13 66.35 58.14 8.21
2005 74.85 61.07 14 74.16 60.07 14.09
Percent Percent

No of student enrolled with ECD background (all cohort 2002-2006)
| ecd |
region | 0 1 | Total
---------+----------------------------+----------------
1 | 11,680 1,973 | 13,653
(85.5) (14.5) (100)
2 | 5,875 2,519 | 8,394 2 | 5,875 2,519 | 8,394 (70.0) (30.0) (100)
3 | 10,312 1,172 | 11,484 (89.8) (10.2) (100)
4 | 6,243 1,371 | 7,614 (82.0) (18.0) (100)
5 | 7,764 0 | 7,764 (100) (0) (100)
---------+----------------------------+----------------
Total | 41,874 7,035 | 48,909 (85.6) (14.4) (100)
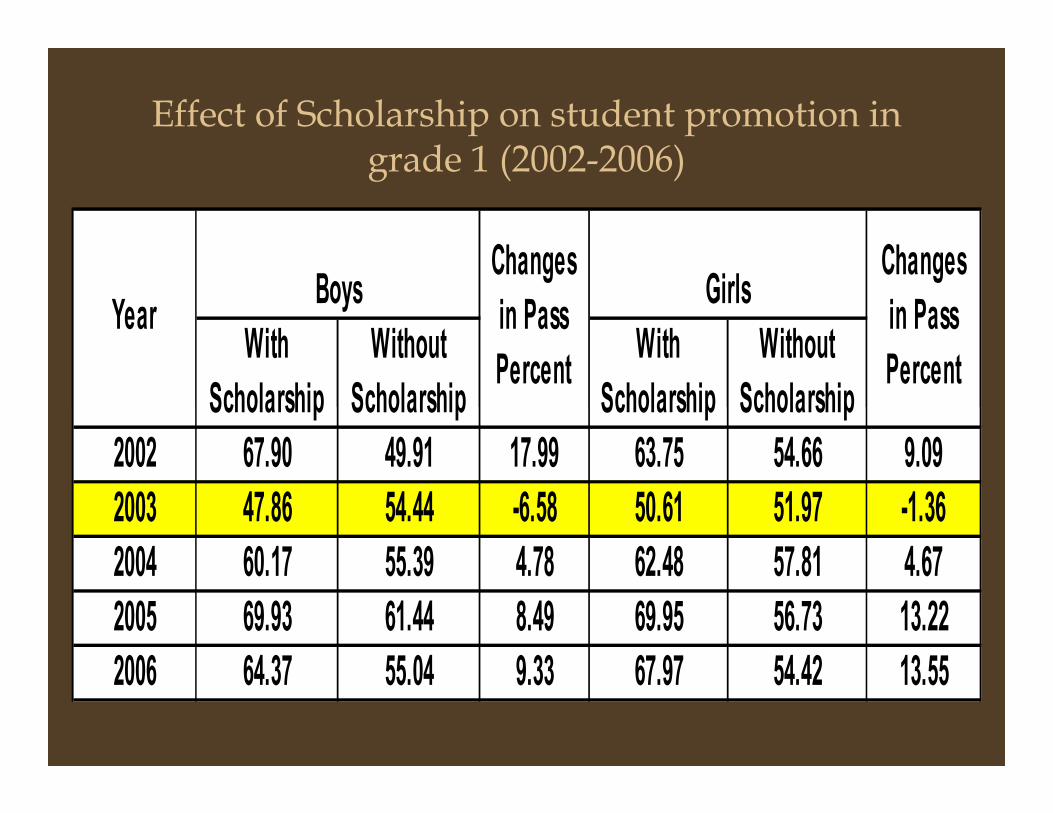
Effect of Scholarship on student promotion in grade 1 (2002-2006)
With
Scholarship
Without
Scholarship
With
Scholarship
Without
Scholarship
Boys GirlsYear
Changes
in Pass
Percent
Changes
in Pass
PercentScholarship Scholarship Scholarship Scholarship
2002 67.90 49.91 17.99 63.75 54.66 9.09
2003 47.86 54.44 -6.58 50.61 51.97 -1.36
2004 60.17 55.39 4.78 62.48 57.81 4.67
2005 69.93 61.44 8.49 69.95 56.73 13.22
2006 64.37 55.04 9.33 67.97 54.42 13.55

Primary school promotion rate extrapolated beyond 2006 based on past trend
50
75
100
Girls are expected to achieve 100% promotion rate by 2012
Boys are expected to achieve 100% promotion rate by 2014
0
25
2002 2003 2004 2005 2006 2007 2008 2009 2010 2011 2012 2013 2014 2015
Boys Girls

Recommendations
1. Diagnose further the issues of access, quality
and efficiency focusing on excluded children
and devise necessary policy and program
responses. (who are the children who will not
Improving Student Promotion
2. Policy and program interventions for improved
learning achievement and reduced wastage in
Mid and Far West.
responses. (who are the children who will not
make it up to grade 5 in 5 years after their entry
into grade one and why they will not do so?)

3. Teacher and head teacher training
curriculum and programs should include
participatory school and classroom
context analysis.
Recommendations
context analysis.
4. Review and redressing of the existing
policy and strategy on ECD and
incentives programs and prioritize
targeting the deprived groups.
1. The MOES/DOE should urgently address the problem of
repetition in grade one if quality, access and efficiency
of PE system are to be improved.
RecommendationsSchool-specific Recommendations
2. The 62 sample school show gender parity in primary
education. But it needs to be further investigated with
the DOE initiative

1. The MOES/DOE should urgently address the
problem of repetition in grade one if quality,
access and efficiency of PE system are to be
improved.
Recommendations
2. The 62 sample school show gender parity in
primary education. But it needs to be further
investigated with the DOE initiative

3. MOES/DOE should take initiatives for
developing data processing and
analyzing skills at district, RC and
school level.
Recommendations
4. MOES/DOE should take initiatives on
student tracking by assigning official
ID code

5. The Flash Report publishing should
eventually be based on student tracking
database so that it will be helpful to
ensure data quality [e.g., calculation of
dropout rates can be more accurate].
Recommendations
dropout rates can be more accurate].
6. Special program initiatives deems
necessary to address the access issue
for Harizan/Ram/Chamar (Terai dalit
groups) and Muslim group

7. Stake holders such as INGOs, NGO, local
stakeholders should be mobilized to
increase the ECD centers. DOE should
coordinate with different agencies to
increase ECD centers rapidly.
Recommendations
increase ECD centers rapidly.
8. Student teacher ratio (STR) of individual
school should be considered and the
teacher deployment should be based
on the context of the individual school

Thank you