Presentation 1Q17 2T11 - APIMECv4-usiminas.infoinvest.com.br/enu/5452/1Q17 presentation.pdf ·...
46
Apresentação Usiminas 2T11 - APIMEC Classification of the information: Public Presentation 1Q17
Transcript of Presentation 1Q17 2T11 - APIMECv4-usiminas.infoinvest.com.br/enu/5452/1Q17 presentation.pdf ·...

Apresentação Usiminas
2T11 - APIMEC
Classification of the information: Public
Presentation
1Q17

Agenda
Usiminas and its
business units
Market
Outlook
Financial
Results
Usiminas
Profile
2

Company Profile
3
Complete solution for products and services
Steel company with the largest number of patents rights in Latin America
Largest Research Center in the steel sector in Latin America
First Brazilian steel company to have its quality system certified by ISO 9001 in 1992
First Brazilian steel company and second in the world to achieve the ISO 14001 environmental management
certificate in 1996
Founded of the most enduring environmental education project of the private sector since 1984

Timeline
4
Operation
Start Up
Cosipa
privatization
Launch of ADR I
program on the
OTC Market
(New York)
•Acquisition
of iron ore
mines
•Acquisition
of Zamprogna
•Creation of Soluções Usiminas
•One CNPJ: Usiminas
incorporates Cosipa
•Creation of Mineração Usiminas
•Acquisition of Codeme and
Metform stake
Automotiva
Usiminas
Divestment
•Selling of
Ternium stake
•Joint Mining
Agreements
with MBL e
Ferrous
Entrance of
Ternium / Tenaris
into Usiminas
Control Group
(New shareholders
agreement)
•Usiminas
privatization
•Listing on
BOVESPA
1993
Listing on
LATIBEX
stock
exchange
section
2011
2012 1962
2005
1994
2013
1991
2008
2010
2009
2014
Friables
Project
conclusion
on Mining
(increasing
the capacity
to 12 million
tons/year)
2015
Temporary
shutdown of
the primary
areas in
Cubatão
2016
•R$ 1 billion
capital
increase
•Debt
Renegotiation
2017
Approval of R$
1 billion
Mineração
Usiminas’
capital
reduction

Shareholding Composition
5
*
*
*
*
Grupo de Controle (63,86%)
1,253,079,108
547,818,424 705,260,684 56.28% 43.72%
Usiminas shares are traded on BM&FBovespa (São Paulo), on the OTC Market (New York) and on a LATIBEX
exchange section (Madrid).
Voting Capital
Total Capital
Nippon Group 21.10%
Ternium/ Tenaris Group 19.81%
Usiminas Pension Fund 4.84% Nippon Group
11.31%
Ternium / Tenaris Group 19.76%
Others 23.19%
Control Group: 45.75%
Free Float: 54.25%
Preferred

6
Complete Solution for Products and Services
Business Units
Mineração Usiminas
Mining
Steel
Ipatinga Plant
Cubatão Plant
Unigal Usiminas
Steel Processing
Soluções Usiminas
Capital Goods
Usiminas Mecânica
DOWNSTREAM UPSTREAM

Mining
Steel
Steel Processing
Capital Goods
Strategically Located
7

Social and Environmental Initiatives
8
Usiminas Cultural Institute
Usiminas invested over R$260 million,
encouraging around 2,000 social projects First educational institution in Brazil
to obtain ISO 9001
São Francisco Xavier School
Márcio Cunha Hospital
Reference center in healthcare all over Brazil
Xerimbabo Usiminas Project
Promotes protection and environmental education
free of charge for more than 2 million young people

Agenda
Usiminas and its
business units
Market
Outlook
Financial
Results
Usiminas
Profile
9

World Crude Steel Market in 2016
Million Tons
Source: World Steel Association/OECD 10
Nominal
Capacity
2,351
Production
1,610
Excess of Capacity 741
24.2
30.2
33.2
42.1
68.6
70.8
78.6
95.6
104.8
808.4
Ukraine
Brazil
Turkey
Germany
South Korea
Russia
USA
India
Japan
China

10% 2%
6%
7%
2% 1%
50%
21%
World Crude Steel Production
1,149 million tons 1,610 million tons
11 Source: World Steel Association
2016 2005
*Except China
*
17%
2%
12%
11%
4% 2%
31%
21% European Union
Europe (others)
Others
North America
South America
Africa
China
Asia and Oceania
+40%

1980 2000 2015
China 34 98 489
South Korea 160 818 1.113
Japan 611 601 497
United States 376 425 297
Germany 469 475 484
Spain 202 435 275
Brazil 101 93 103
Mexico 120 142 191
World Average 152 133 208
Source: World Steel Association
Crude Steel Consumption per Capita
Kg per habitant
12

Brazilian Flat Steel Apparent Consumption
Evolution Quarterly - Thousand Tons
13 Source: Usiminas – Commercial Planning
766 761 805 821 825
1,263 1,351 1,467
1,317 1,316
118 138
162 281 311 2,147
2,250
2,434 2,419 2,452
1Q16 2Q16 3Q16 4Q16 1Q17
Usiminas Other Companies Imports Total

Auto Industry
and Autoparts Oil and Gas Pipelines
Agricultural and
Road Machinery
Heavy Plates and
Hot Rolled
Civil
Construction
Household
Appliances
Cold Rolled and
Galvanized
14
Flat Steel Consumption Markets
Hot Rolled,
Cold Rolled and
Galvanized
Heavy Plates,
Hot Rolled,
Cold Rolled and
Galvanized
Heavy Plates and
Hot Rolled
Heavy Plates and
Hot Rolled

Agenda
Usiminas and its
business units
Market
Outlook
Financial
Results
Usiminas
Profile
15

HDG Placas Laminados a
Quente
Eletrogalvanizados
2,200
Optimized
Rolling
Capacity
4,200 1,900 1,020 350
Cubatão Plant - 1,200 -
3,700 Nominal
Capacity 8,000 2,000* 9,500* 1,050 360
-
Ipatinga Plant 1,050 360 2,500 3,600 1,000 5,000
Flat Steel Capacity of Production
16
Thousand Tons
Slabs Hot Coils Cold Coils Heavy Plates Slab Caster EG
Galvanized
* Temporary shutdown of the primary areas of Cubatão
2,100 ** 1,000** 4,500*
2.300
** Temporary shutdown of the rolling mills
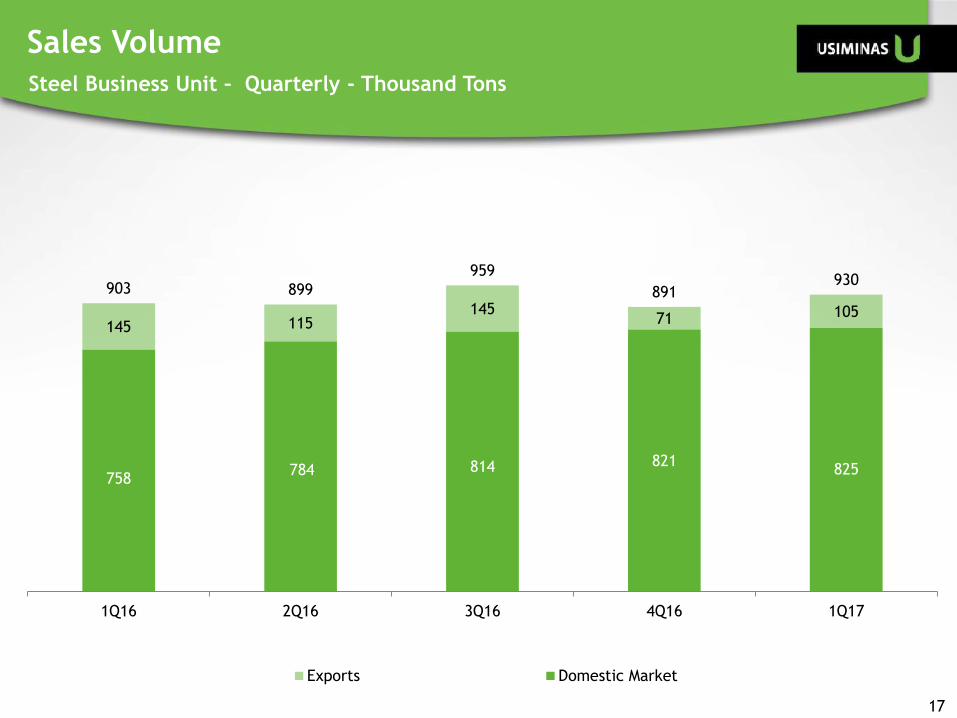
17
Sales Volume
Steel Business Unit – Quarterly - Thousand Tons
758 784 814 821
825
145 115 145
71 105
903 899
959
891 930
1Q16 2Q16 3Q16 4Q16 1Q17
Exports Domestic Market

18
Steel Business Unit
Exports – Main Markets
36%
35%
8%
5%
4%
3% 3% 3%
2% 1%
0%
0%
1Q17
20%
46%
0%
6%
0%
8%
4% 1%
1% 0%
0% 13%
4Q16
Germany
Argentina
United Kingdom
Mexico
Switzerland
China
USA
Spain
Portugal
Belgium
Canada
Others

Steel Business Unit
19
Cost of Goods Sold - COGS
33%
17%
12% 11%
10%
8%
7%
4%
-13%
11%
4Q16
31%
17%
16% 12%
10%
7%
7%
4%
-11%
7%
1Q17
Other Raw Materials
Labor (direct and indirect)
Coal and Coke
Iron Ore and Pellets
Structural Expenses
Energy and Fuels
Depreciation
Spare Parts
Inventories Variation
Others

72 1 (2) 1
1 (37) (42) (35) (14) (23)
(14) (2) (34) (1)
25 93
332 342
488
(71)
46 50
295 224
465 3% 3%
14%
11%
21%
1T16 2T16 3T16 4T16 1T17
20
Adjusted EBITDA and EBITDA Margin
Steel Business Unit – Quarterly - R$ Million

Capacity increase to generate finished products
7.2 million t 9.7 million t
(2010) (2014)
Investments
21
Steel Business Unit
Slabs
Heavy Plates
Hot Rolled Cold Rolled
Hot dip galvanized Electrogalvanized
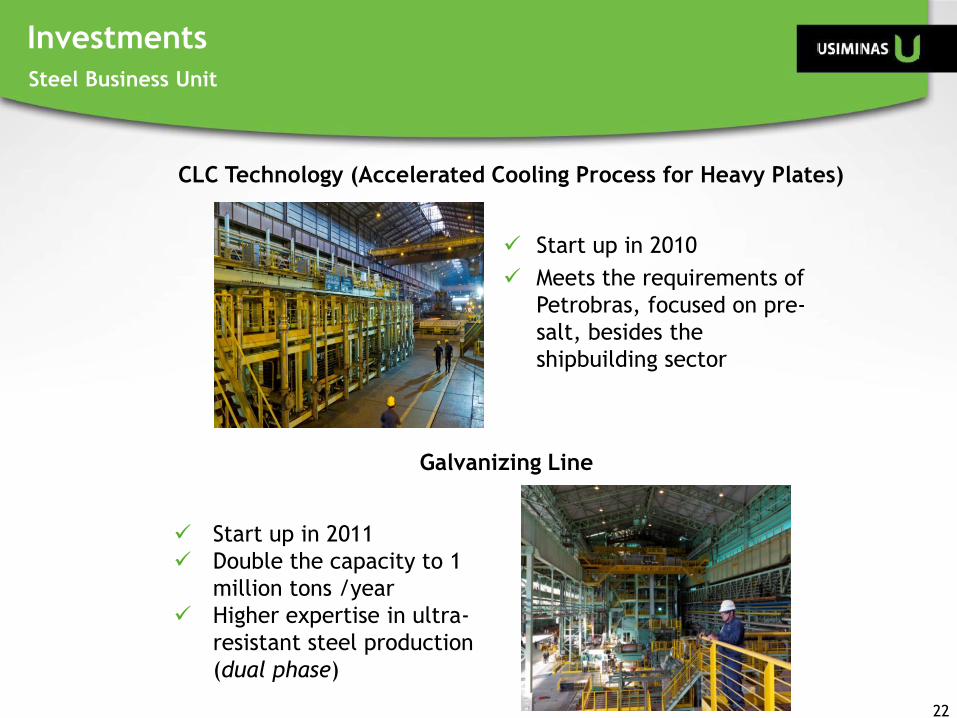
Start up in 2010
Meets the requirements of
Petrobras, focused on pre-
salt, besides the
shipbuilding sector
CLC Technology (Accelerated Cooling Process for Heavy Plates)
Galvanizing Line
Start up in 2011
Double the capacity to 1
million tons /year
Higher expertise in ultra-
resistant steel production
(dual phase)
22
Investments
Steel Business Unit

Start up in 2012
Capacity to process 2.3 million
tons / year
Improving products’ portfolio
(beams, ultra resistant wheels,
higher grades API’s)
Hot Strip Mill
Start up in 2013
Capacity to process 1.7 million
tons / year
Better thickness tolerance,
flatness and surface controls
of materials for wheels, beams
and compressors
Pickling Line
23
Investments
Steel Business Unit

o Met coke with adequate specifications for pig iron production in the blast furnace process
o Started up on May 2015
24
Coke Plant Revamp - Ipatinga
o Reduction of particle emissions, gases and volatile substances
o Coke gas to be used in the operational
facilities of Ipating Mill and electric energy
production
o Coke plant total capacity of 1,1 million
tons/year
Mainly Investment Concluded in 2015
Steel Business Unit

o Located in Serra Azul/Minas Gerais state
o 4 mining sites, acquired from J. Mendes in February, 2008
o Reserves of 2.6 billion tons of iron ore
o It has 20% of voting shares of MRS Logistica, being part of the Control Group
o Retroarea in Itaguaí Port
Description
25
Mining Business Unit
70%
30%
Shareholder Composition Production Capacity
Lump 2 million
Sinter Feed
4 million
Pellet Feed
6 million

MBL
Arcelor Mittal
Ferrous (Santanense)
Comisa Emicon
MMX
Ferrous
MUSA Pau de Vinho
MUSA Leste
Minerita
MUSA Central
MUSA Oeste
Itatiaiuçu
Igarapé São Joaquim De Bicas
Mineração Usiminas
Location
Mining Business Unit
26

Increased capacity from 8 million to 12 million tons / year of iron ore
Iron ore with better quality, higher concentration of iron content and
lower impurity level
Two iron ore processing plants
Friables Project
27
Investments
Mining Business Unit

28
Sales Volume
Mining Business Unit – Quarterly - Thousand Tons
614 592 608 588 615
16 23
181
69 28
344
171
-
-
974
786 789
657 643
1Q16 2Q16 3Q16 4Q16 1Q17
Sales to Usiminas Sales to 3rd parties - Domestic Market Exports Total

Iron Ore Price – PLATTS (62% Fe CFR China)
US$/ton
29
48 56 59
71
86
1Q16 2Q16 3Q16 4Q16 1Q17

30
(4) (3) (1)
2 0
(12)
21
13
24
52
-11%
21%
16%
30%
48%
1Q16 2Q16 3Q16 4Q16 1Q17
Sale of Energy Reported EBITDA Reported EBITDA Margin
Adjusted EBITDA and EBITDA Margin
Mining Business Unit – Quarterly - R$ million
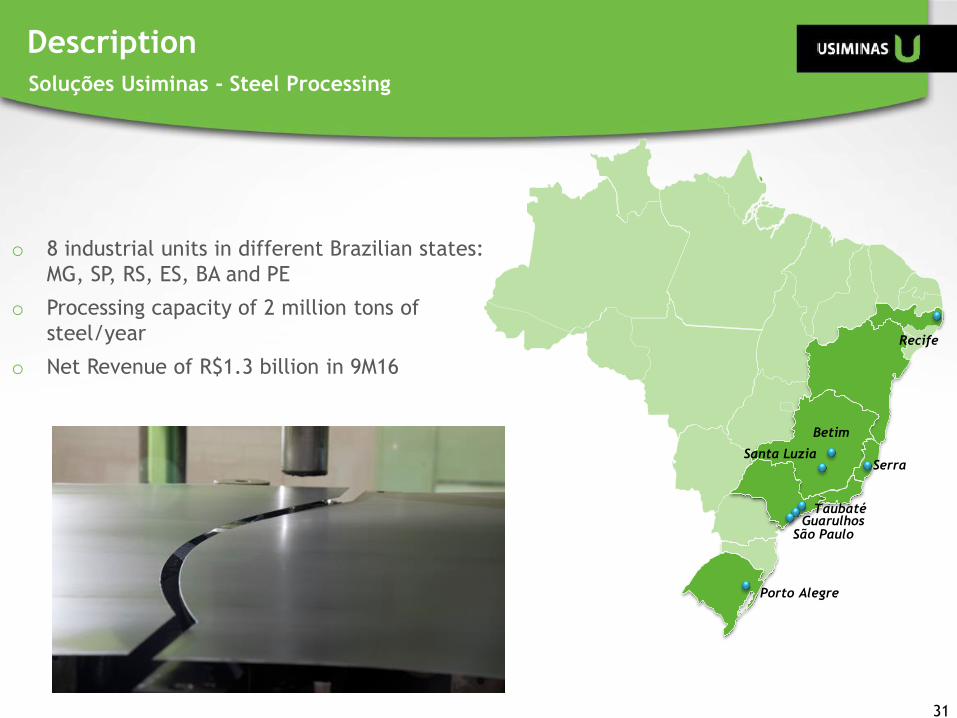
o 8 industrial units in different Brazilian states:
MG, SP, RS, ES, BA and PE
o Processing capacity of 2 million tons of
steel/year
o Net Revenue of R$1.3 billion in 9M16
Description
Soluções Usiminas - Steel Processing
31
Porto Alegre
São Paulo Guarulhos
Taubaté
Recife
Serra
Betim
Santa Luzia

Adjusted EBITDA and EBITDA Margin Steel Processing – Quarterly - R$ million
32
3
14
22
9
37
1%
3% 4%
2%
7%
1Q16 2Q16 3Q16 4Q16 1Q17
Reported EBITDA Reported EBITDA Margin

o Facilities in Ipatinga/Minas Gerais state, Congonhas/Minas Gerais state and in
Cubatão/São Paulo state
o Market Segments: Steel Structures, Shipbuilding and Offshore, Oil and Gas, Industrial
Assembly and Equipment, Foundry and Railcars
o Net Revenue of R$462 million in 9M16
Usiminas Mecânica - Capital Goods
Description
33
Brasília 3rd Bridge
33
Steel Structures

Adjusted EBITDA and EBITDA Margin Capital Goods - Quarterly - R$ million
34
8 10
1
(7) (4)
5%
6%
1%
-7%
-5%
1Q16 2Q16 3Q16 4Q16 1Q17
Reported EBITDA Reported EBITDA Margin
Agenda
Usiminas and its
business units
Market
Data
Financial
Results
Usiminas
Profile
35

72 1 (2) 0 1
(41) (44) (36) (12) (23) (17) (6) (33) (4)
37 117
344 350
559
(71)
3% 3%
14%
11%
23%
1T16 2T16 3T16 4T16 1T17
307 234
68 52
533
36 36
Adjusted EBITDA and EBITDA Margin Consolidated – Quarterly - R$ million

37
Comparing Adjusted and CVM 527 EBITDA Consolidated – R$ Thousand
1Q17 4Q16 1Q16
Net (Loss) Income 108,318 (194,971) (151,377)
Income Tax / Social Contribution 58,855 418,323 (15,360)
Financial Result 54,581 87,053 (101,553)
Depreciation, Amortization 306,341 273,502 318,086
528,095 583,907 49,796
Joint Subsidiary Companies proportional EBITDA 27,973 27,973 45,597
Impairment of Assets - (350,449) 8,030
532,769 234,117 51,578
(51,845)
Adjusted EBITDA
Consolidated (R$ thousand)
Equity in the Results of Associate and Subsidiary
Companies(37,080) (27,314)
EBITDA - Instruction CVM - 527

2,177
14 16 78
333
608
875 875 875 875
647
239
0
548 15
73
137
199 199 199 199
149
2,416
14
564
93
406
745
1,073 1,074 1,074 1,073
796
Cash 2017 2018 2019 2020 2021 2022 2023 2024 2025 2026
Local Currency Foreing Currency
Debt Profile (Principal)
Consolidated - R$ Million
38
Duration: R$: 51 months US$: 51 months

39
Cash Position and Indebtedness (with interest money)
Consolidated - R$ Million
1,736
2,713 2,340 2,257 2,416
5,692 4,525
4,609 4,684 4,464
7,428 7,238 6,948 6,942 6,879
1Q16 2Q16 3Q16 4Q16 1Q17
Net Debt Cash Gross Debt

40
CAPEX Consolidated - R$ million
64
42
25
48
18
4
6
10
14
3
2
3
2
5
3
70
50
37
67
23
1Q16 2Q16 3Q16 4Q16 1Q17
Others Mining Steel

41
G&A Evolution
Consolidated - R$ million
90 86 87
91 93
4.4% 4.2%
3.9%
4.3%
4.0%
1Q16 2Q16 3Q16 4Q16 1Q17
G&A G&A/Net Revenues
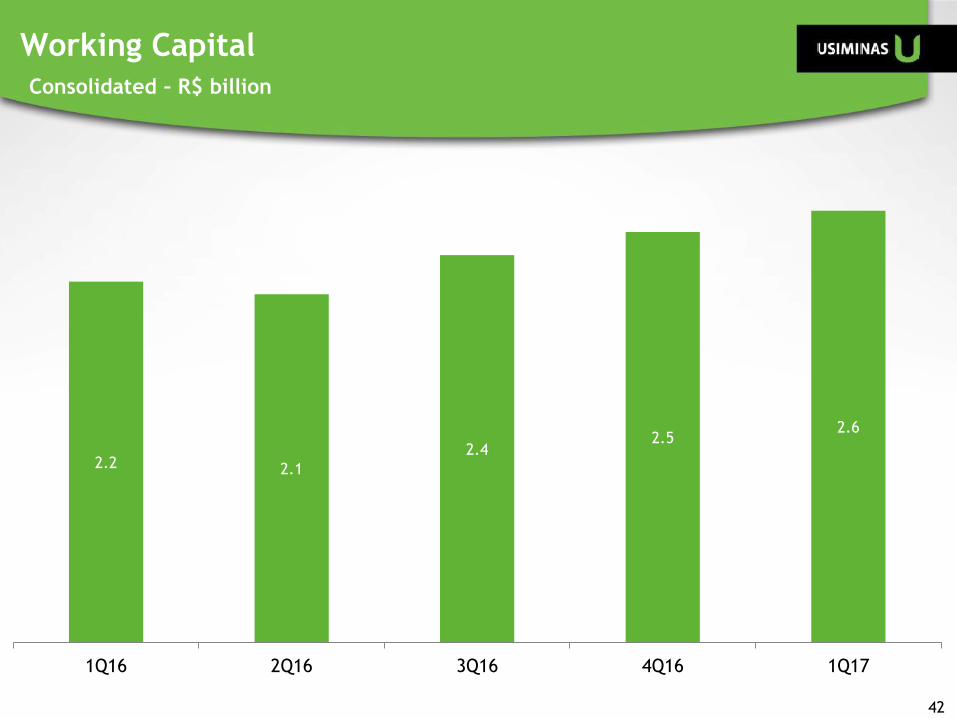
42
Working Capital
Consolidated – R$ billion
2.2 2.1
2.4 2.5
2.6
1Q16 2Q16 3Q16 4Q16 1Q17

484
439 443
648 648
1Q16 2Q16 3Q16 4Q16 1Q17
43
Inventory
turnover
(days)
63 65 42 44 48
Working Capital – Steel Inventories
Thousand Tons

(41)
3
266 259
481
(320) (293)
(34)
283
185
(151) (123) (107)
(195)
108
1Q16 2Q16 3Q16 4Q16 1Q17
Gross Profit EBIT Net Income
44
USD/BRL 3,904 3.558 3.210 3.246 3.259 End of period
*
*Reversion of impairment in the Mining Unit of R$357.7 million,
Gross Profit, EBIT and Net Income - Quarterly
Consolidated - R$ million

Income Statement Per Business Unit – R$ million - Quarterly
Note: All intercompany transactions are made at arm´s length basis 45
R$ million
1Q17 4Q16 1Q17 4Q16 1Q17 4Q16 1Q17 4Q16 1Q17 4Q16 1Q17 4Q16
Net Revenue 108 79 2,219 1,959 567 480 83 106 (626) (504) 2,351 2,120
Domestic Market 108 79 1,978 1,797 567 480 82 105 (626) (504) 2,110 1,958
Exports - - 240 161 0 0 1 1 - - 241 162
COGS (53) (47) (1,798) (1,725) (512) (453) (82) (103) 575 467 (1,870) (1,861)
Gross Profit (Loss) 55 31 421 233 55 27 1 4 (51) (36) 481 259
Operating Income (Expenses) (42) 319 (218) (246) (26) (26) (11) (25) 1 2 (296) 24
EBIT 13 350 203 (13) 29 2 (10) (21) (50) (35) 185 283
Adjusted EBITDA 52 24 465 224 37 9 (4) (7) (16) (15) 533 234
Adj.EBITDA Margin 48% 30% 21% 11% 7% 2% -5% -7% 3% 3% 23% 11%
Income Statement per Business Units - Non Audited - Quarterly
ConsolidatedMining Steel* Steel Processing Capital Goods Adjustment

Declarations relative to business and perspectives of the Company, operating
and financial results and projections, and references to the growth of the
Company constitute mere forecasts and were based on Management´s
expectations in relation to future performance, these expectations are highly
dependent on market behavior, on Brazil´s economic situation, on the industry
and on international markets, and are therefore subject to change.
ADR
Level I
www.usiminas.com/ri
Cristina Morgan C. Drumond Head of IR
Phone: 55-31-3499-8772
Fax: 55-31-3499-9357
Leonardo Karam Rosa IR Manager
Phone: 55-31-3499.8550