CONFERENCE CALL 1Q17 - Marfrigir.marfrig.com.br/Upload/Arquivos/4268_Apresentacao... ·...
12
EARNINGS CONFERENCE CALL MAY 12, 2017 INVESTOR RELATIONS 1Q17
Transcript of CONFERENCE CALL 1Q17 - Marfrigir.marfrig.com.br/Upload/Arquivos/4268_Apresentacao... ·...

EARNINGS CONFERENCE CALL
MAY 12, 2017
INVESTOR RELATIONS
1Q17

2
This material is a presentation of general information about Marfrig Global FoodsS.A. and its consolidated subsidiaries (jointly the “Corporation”) on the datehereof. The information is presented in summary form and does not purport to becomplete.
No representation or warranty, either expressed or implied, is made regarding theaccuracy or scope of the information herein. Neither the Corporation nor any of itsaffiliated companies, consultants or representatives undertake any liability forlosses or damages arising from any of the information presented or contained inthis presentation. The information contained in this presentation is up to date as ofMarch 31, 2017, and, unless stated otherwise, is subject to change without priornotice. Neither the Corporation nor any of its affiliated companies, consultants orrepresentatives have signed any commitment to update such information after thedate hereof. This presentation should not be construed as a legal, tax orinvestment recommendation or any other type of advice.
The data contained herein were obtained from various external sources and theCorporation has not verified said data through any independent source. Therefore,the Corporation makes no warranties as to the accuracy or completeness of suchdata, which involve risks and uncertainties and are subject to change based onvarious factors.
This presentation includes forward-looking statements. Such statements do notconstitute historical fact and reflect the beliefs and expectations of theCorporation’s management. The words “anticipate,” “hope,” “expect,” “estimate,”“intend,” “project,” “plan,” “predict,” “aim” and other similar expressions are usedto identify such statements.
Although the Corporation believes that the expectations and assumptionsreflected by these forward-looking statements are reasonable and based on theinformation currently available to its management, it cannot guarantee results orfuture events. Such forward-looking statements should be considered withcaution, since actual results may differ materially from those expressed or impliedby such statements. Securities are prohibited from being offered or sold in theUnited States unless they are registered or exempt from registration in accordancewith the U.S. Securities Act of 1933, as amended (“Securities Act”). Any futureoffering of securities must be made exclusively through an offering memorandum.This presentation does not constitute an offer, invitation or solicitation tosubscribe or acquire any securities, and no part of this presentation nor anyinformation or statement contained herein should be used as the basis for orconsidered in connection with any contract or commitment of any nature. Anydecision to buy securities in any offering conducted by the Corporation should bebased solely on the information contained in the offering documents, which maybe published or distributed opportunely in connection with any security offeringconducted by the Corporation, depending on the case.
Disclaimer

3
Highlights
Start of Keystone’s IPO process
Initial confidential submission to the SEC already executed
BRL appreciation
Beef: Challenging scenario, weak flesh operation and new structure
Keystone: Record EBITDA for a first quarter
New issuance of US$ 750 million
Last mandatory convert´s interest installment of R$ 327 million, paid
in January

4
Beef’s new structure
Simplification of structure, with direct reporting to global CEO
Greater agility for decision making
Better visibility of results
Focus and independence in management

5
222138
9.0%6.7%
1Q16 1Q17
Beef Highlights | 1Q17
Net Revenue(R$ million)
Total Volume ('000 tons)
Adjusted EBITDA & Margin(R$ million and %)
Result of the quarter impacted, mainly, by BRL appreciation and lower sales volume.
Increase in the volume of fresh meat in the domestic market offset by the retraction of exports.
EBITDA affected by lower sales volume and lower spreads, in line with the industry trend.
-17%
-5%
-38%
42%% Food Service /
Brazilian DomesticMarket
1,146 1,052
1,323 989
2,469 2,040
1Q16 1Q17
56 61
105 94
79 74
240 229
1Q16 1Q17
6
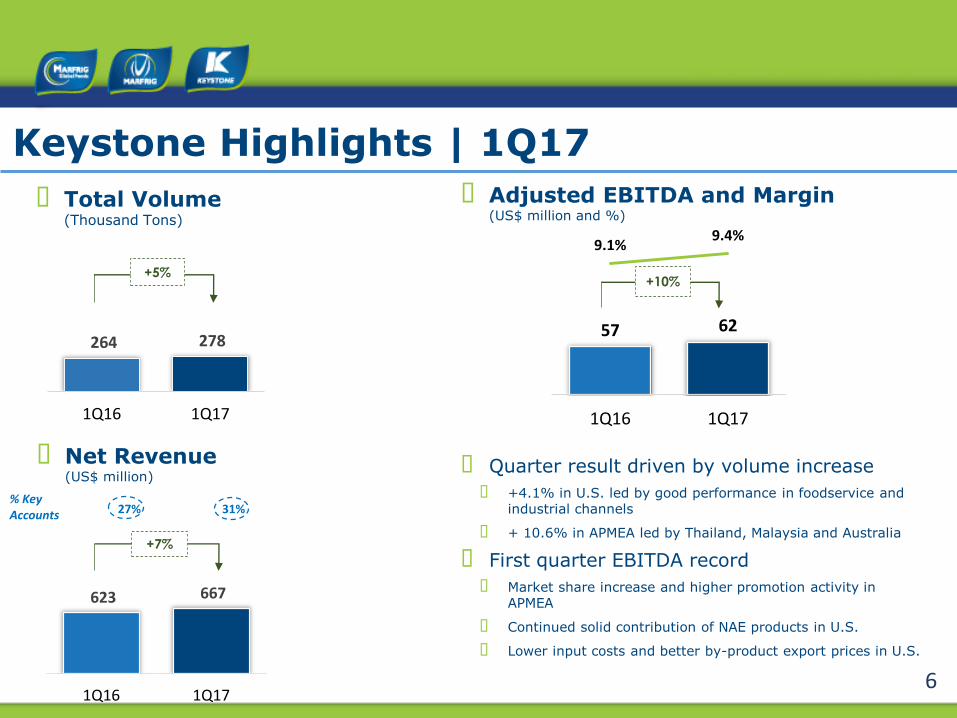
264 278
1Q16 1Q17
Keystone Highlights | 1Q17
Net Revenue(US$ million)
Adjusted EBITDA and Margin(US$ million and %)
Total Volume(Thousand Tons)
+5%+10%
+7%
623 667
1Q16 1Q17
Quarter result driven by volume increase
+4.1% in U.S. led by good performance in foodservice and industrial channels
+ 10.6% in APMEA led by Thailand, Malaysia and Australia
First quarter EBITDA record
Market share increase and higher promotion activity in APMEA
Continued solid contribution of NAE products in U.S.
Lower input costs and better by-product export prices in U.S.
57 62
9.1%9.4%
1Q16 1Q17
% KeyAccounts 27% 31%

7
Financial Performance | Consolidated 1Q17
Net Revenue (R$ million)
Keystone’s excellent performance, driven by its higher sales volume, was offset by dollar devaluation(20%) and Beef Division’s lower salesvolume.
-16%
Revenue Breakdown
By
Bu
sin
ess
By
Cu
rren
cy
36%
15%
39%
10%
Keystone USAKeystone APMEABeef BrazilBeef International
60%21%
19%
US$
Real
Other
4,906 4,136
1Q16 1Q17

8
576460
11.7% 11.1%
1Q16 1Q17
443334
9.0% 8.1%
1Q16 1Q17
50%50%
Keystone Beef
59%
41%
Financial Performance | Consolidated 1Q17
Gross Profit & Gross Margin(R$ million and %)
Adjusted EBITDA & Margin(R$ million and %)
EBITDA affected by the retraction ofcattle margins, partially offset by theexpasion of Keystone’s margins andvolumes.
-20%
EB
ITD
A
Breakd
ow
n 1Q16 1Q17
-25%

9
-
200
400
600
800
1.000
1.200
2018 2019 2020 2021-2023 2024
Before*
Avg. Term: 4.2 years
-
200
400
600
800
1.000
1.200
2018 2019 2020 2021-2023 2024
After
Avg. Term: 4.9 years
Liability Management ProcessBonds Maturity Schedule
(pro forma)
In USD
*4Q16
*Proforma May,17
2018 2019 2020 2021 2023 2024
Dec, 2016 Balance 282 m 660 m 485 m 28 m 1 bn
Issuance 750 m
Repurchase 65 m 485 m
Pro-forma Balance 217 m 660 m 28 m 1 bn 750 m

10
Debt Amortization Schedule & IndicatorsR$ million
+5%
Net Debt (R$ and US$ billion)
1.8 1.9US$
1Q16 1Q17
Gross Debt 11,150 11,844
Cash 5,279 5,704
Net Debt 5,872 6,140
Adjusted EBITDA LTM from continuing operations 1,614 1,504
Net Debt / Adj. EBITDA LTM from cont. operations 3.64x 4.08x
Avg. Cost (% p.a.)6.97% vs. 7.64% in 1Q16
Avg. Term4.4 vs. 3.2 years in 1Q16
5.9 6.1
4Q16 1Q17
5,704
1,025 1,146
2,088
9331,256
3,064
2,331
Cash & Equiv. 2017 2018 2019 2020 2021 to 2022 2023 2024

11
Cash Flow | Consolidated 1Q17
1Q17 R$ million
Lower interest and maintenance of investments aligned with the Company's growth plans.
80
(253)
CFO Capex Interests FCFDescontinued
Total FCF
(134)
(213)
14

INVESTOR RELATIONS
www.marfrig.com.br/ir


![1Q17 Presentation - Final.pptx [Read-Only]s2.q4cdn.com/.../2017/1Q17-Presentation-Final.pdf · 2017-05-09 · measures in the Appendices of this presentation. Q1’16 Q1’17 Organic](https://static.fdocuments.us/doc/165x107/5ed1a2194adb1670573e8f25/1q17-presentation-finalpptx-read-onlys2q4cdncom20171q17-presentation-finalpdf.jpg)