Presentation 02. GIS for Noise - adc40.org
29
GIS for Noise Simple GIS Tools to Improve Noise Analysis Presented by Kevin Keller TRB ADC 40 Summer Meeting July 23, 2007 San Luis Obispo, CA
Transcript of Presentation 02. GIS for Noise - adc40.org

GIS for Noise
Simple GIS Tools to Improve Noise AnalysisPresented by Kevin Keller
TRB ADC 40 Summer Meeting July 23, 2007
San Luis Obispo, CA

GIS – Geographic Information System
• Geographic – Related to the surface of the earth – Point, Line, Polygon
• Information – Each Point, Line, Polygon has Data related to directly to it.
• System – Computer Program

GIS Computer Software
• ESRI (ArcView)– Has the most users – 90 % of the GIS market - most public agencies in the U.S. are users.
• CADD system can be set up to work like a GIS system
• Google Earth, MSN Live Search• Noise Model Software:TNM, LIMA,
Soundplan, CANDA, ETC.

How can this improve Noise Analysis?

GIS Data• Land Use Data – Zoning, Parcel
– Use to plan field work, placement of model sites, address and building information
• Air Photos– Use to plan field work, placement of model sites, measuring
distance, graphics
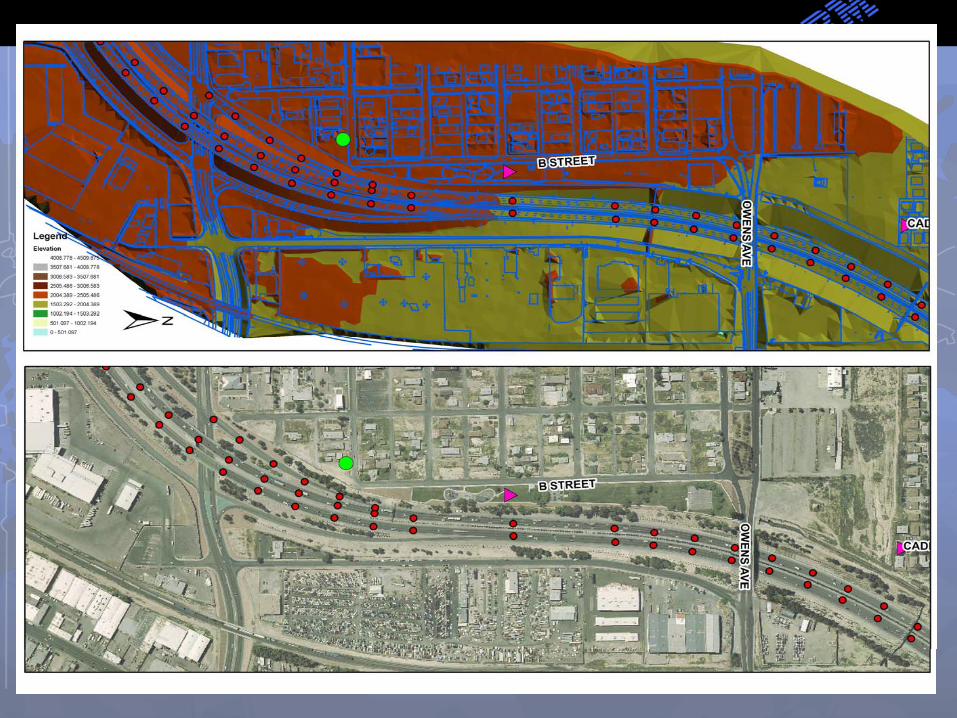
• Topographical – USGS DEM, CADD Contour Lines– Use to build 3d surface of project area, which is used to
calculated elevations of roadways, receivers, and barriers.

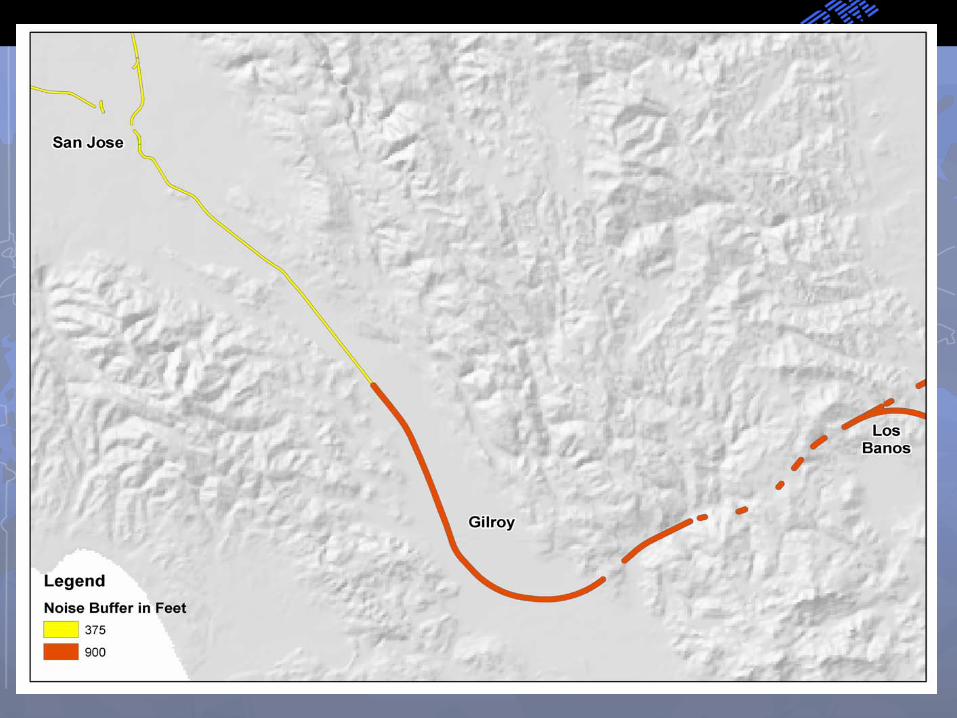
Screening Level
• Distance – Buffer, Overlay
• Sensitive Land Uses
• Potential Affected Population


Impact Metric = (#Res. Population Impacts/Mile) + (0.3 x(#MU Population Impacts/Mile)) + ((100 X # Hospitals)/Mile) + (250 x # Schools)/Mile)

Building a TNM Model• Data – Need to Start
• CADD/GIS file of existing TOPO –Roadway, Buildings, Contour Lines, etc
• Data – Needed to Complete Model
• Measurement Locations, Traffic
• Build Design File showing lane markings, and Edge of Proposed Roadway
• Software Needed – TNM, ARCGIS, Excel


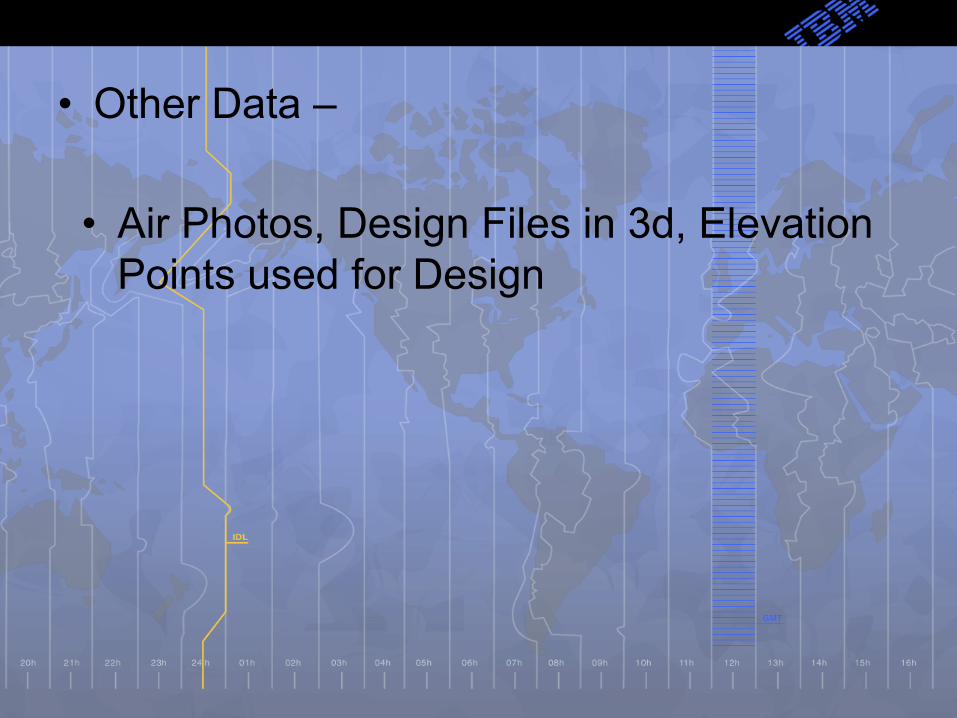
• Other Data –
• Air Photos, Design Files in 3d, Elevation Points used for Design


Output - Graphics


Questions