Presentación de PowerPoint - Coca-Cola FEMSA are cautioned not to put undue reliance on such...
16
Investor Relations 2016
Transcript of Presentación de PowerPoint - Coca-Cola FEMSA are cautioned not to put undue reliance on such...
Investor Relations 2016
Cautionary Statement
2
FORWARD-LOOKING STATEMENTS This presentation contains “forward-looking statements” These forward-looking statements relate to Coca-Cola FEMSA, S.A.B. de C.V. its Subsidiaries (“KOF”) and their businesses, and are based on KOF management’s good faith expectations regarding KOF and its businesses. Recipients are cautioned not to put undue reliance on such forward-looking statements, which are not a guarantee of performance and are subject to a number of uncertainties and other factors, many of which are outside KOF’s control, that could cause actual results of KOF and its businesses to differ materially from such statements. KOF is under no obligation, and expressly disclaims any intention or obligation, to update or alter any forward-looking statements, whether as a result of new information, future events or otherwise. CONFIDENTIALITY The nature of all the information in this presentation is proprietary and confidential.
ADDITIONAL INFORMATION AND WHERE TO FIND IT Documents filed by KOF are available at the Securities and Exchange Commission’s public reference room located at 450 Fifth Street, N.W., Washington, D.C. 20594. Investors and security holders may call the Commission at 1-800-SEC-0330 for further information on the public reference room. Free copies of all of KOF’s filings with the Commission may also be obtained by directing a request to: COCA-COLA FEMSA Mario Pani # 100, Piso 7, Col. Santa Fé Cuajimalpa 05348, México D.F., México
INVESTOR RELATIONS Roland Karig / (52) 55 1519 5186 / [email protected] Tania Ramirez / (52) 55 1519 5013 / [email protected]
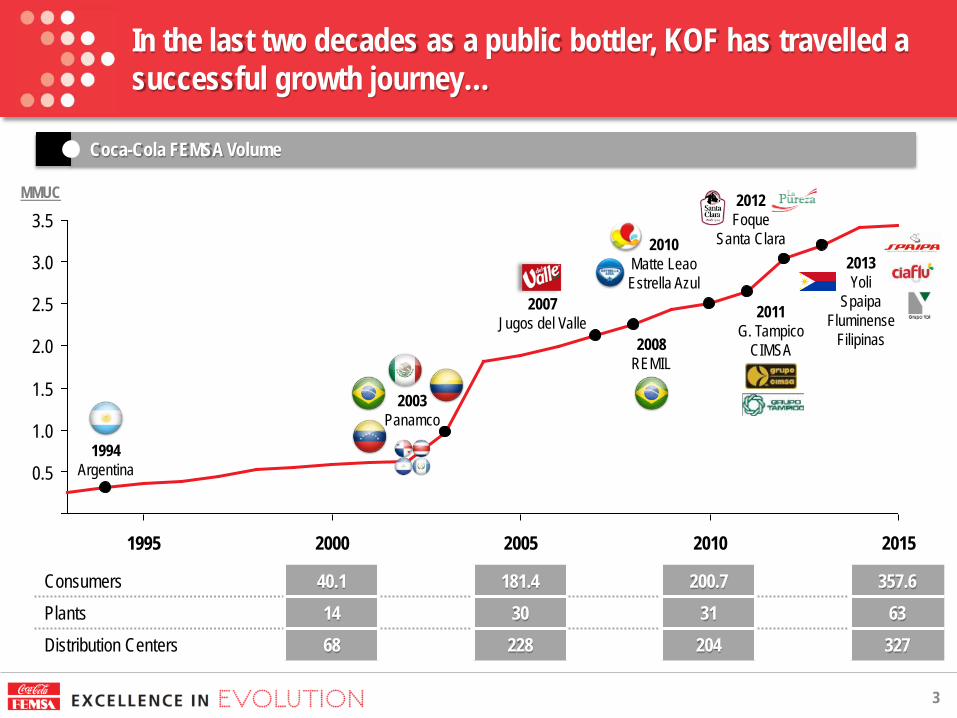
In the last two decades as a public bottler, KOF has travelled a successful growth journey…
2.0
1.0
3.0
2.5
3.5
1.5
2015 2010 2005
0.5
2000 1995
2003 Panamco
2007 Jugos del Valle
2010 Matte Leao Estrella Azul
2008 REMIL
1994 Argentina
2012 Foque
Santa Clara
2011 G. Tampico
CIMSA
2013 Yoli
Spaipa Fluminense
Filipinas
MMUC
Consumers 40.1 181.4 200.7 357.6 Plants 14 30 31 63 Distribution Centers 68 228 204 327
3
Coca-Cola FEMSA Volume
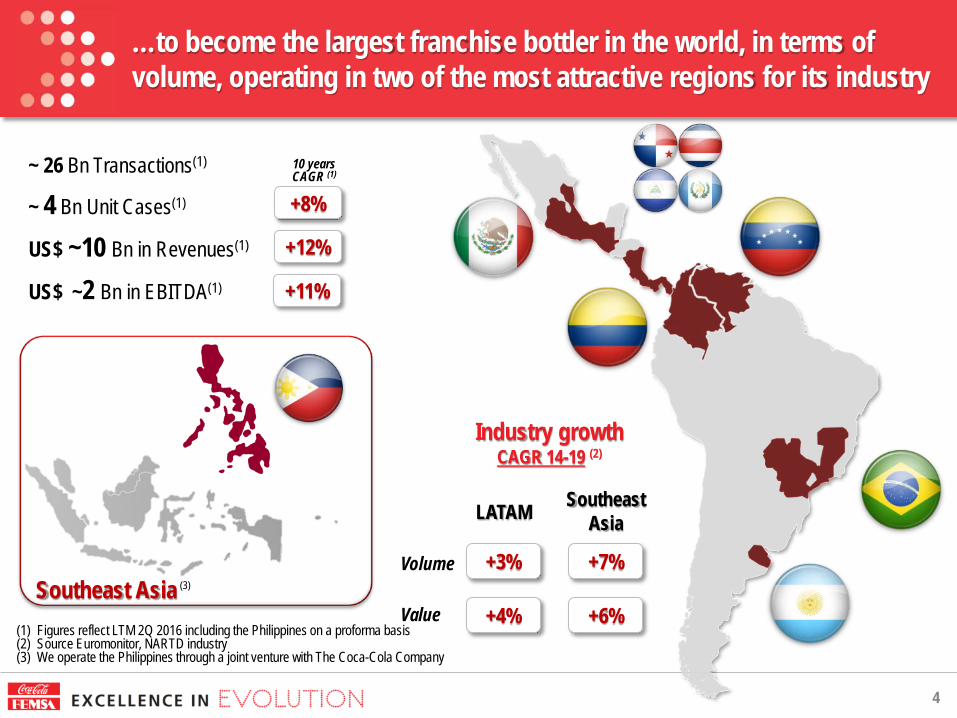
…to become the largest franchise bottler in the world, in terms of volume, operating in two of the most attractive regions for its industry
4
(1) Figures reflect LTM 2Q 2016 including the Philippines on a proforma basis (2) Source Euromonitor, NARTD industry (3) We operate the Philippines through a joint venture with The Coca-Cola Company
~ 26 Bn Transactions(1)
~ 4 Bn Unit Cases(1)
US$ ~10 Bn in Revenues(1)
US$ ~2 Bn in EBITDA(1)
+8%
+12%
+11%
10 years CAGR (1)
Southeast Asia
Industry growth CAGR 14-19 (2)
LATAM Southeast Asia
+3% +7%
+4% +6%
Volume
Value (3)
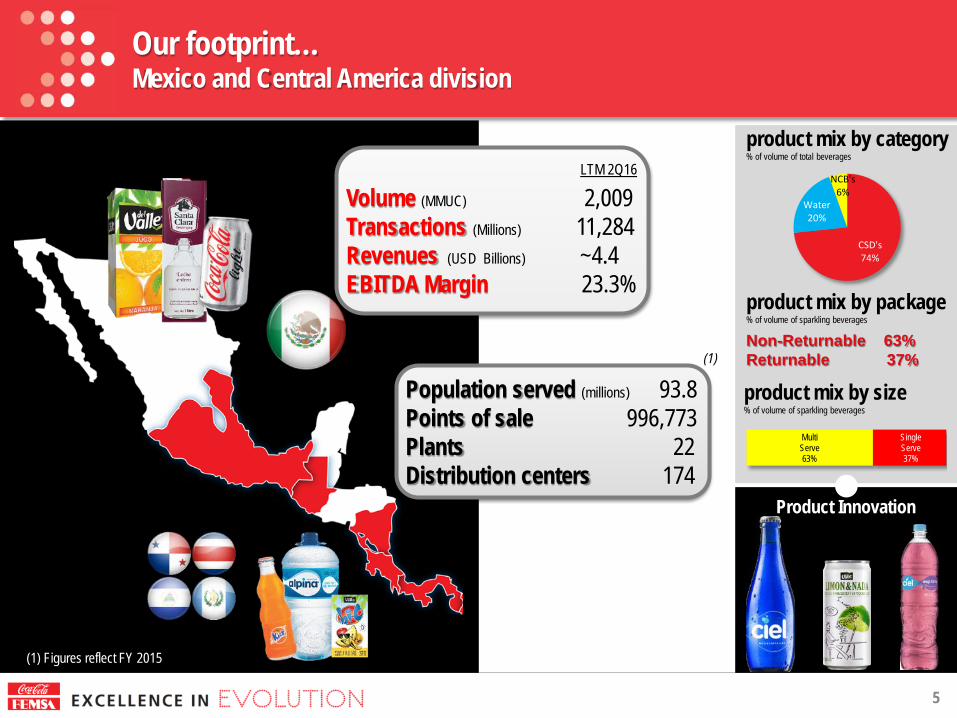
Our footprint… Mexico and Central America division
5
product mix by package % of volume of sparkling beverages
product mix by category % of volume of total beverages
product mix by size % of volume of sparkling beverages
CSD's 74%
Water 20%
NCB's 6%
Multi Serve 63%
Single Serve 37%
Non-Returnable 63% Returnable 37%
Population served (millions) 93.8 Points of sale 996,773 Plants 22 Distribution centers 174
Volume (MMUC) 2,009 Transactions (Millions) 11,284 Revenues (USD Billions) ~4.4 EBITDA Margin 23.3%
Product Innovation
(1) Figures reflect FY 2015
(1)
LTM 2Q16
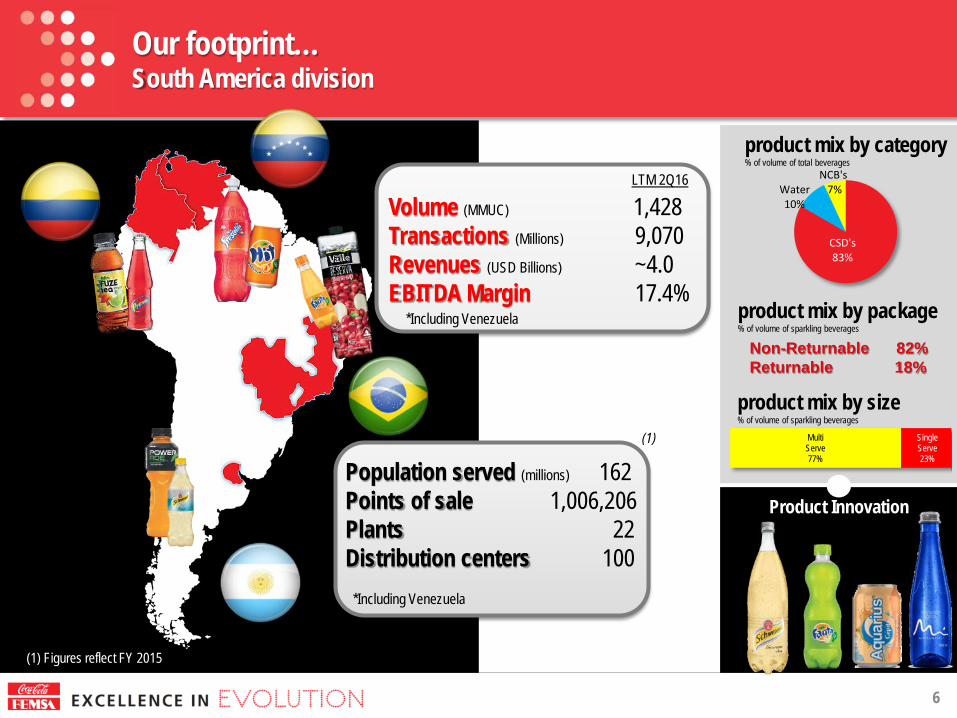
Our footprint… South America division
6
product mix by package % of volume of sparkling beverages
product mix by category % of volume of total beverages
product mix by size % of volume of sparkling beverages
Population served (millions) 162 Points of sale 1,006,206 Plants 22 Distribution centers 100
*Including Venezuela
Volume (MMUC) 1,428 Transactions (Millions) 9,070 Revenues (USD Billions) ~4.0 EBITDA Margin 17.4%
*Including Venezuela
Non-Returnable 82% Returnable 18%
CSD's 83%
Water 10%
NCB's 7%
(1) Figures reflect FY 2015
Multi Serve 77%
Single Serve 23%
Product Innovation
LTM 2Q16
(1)
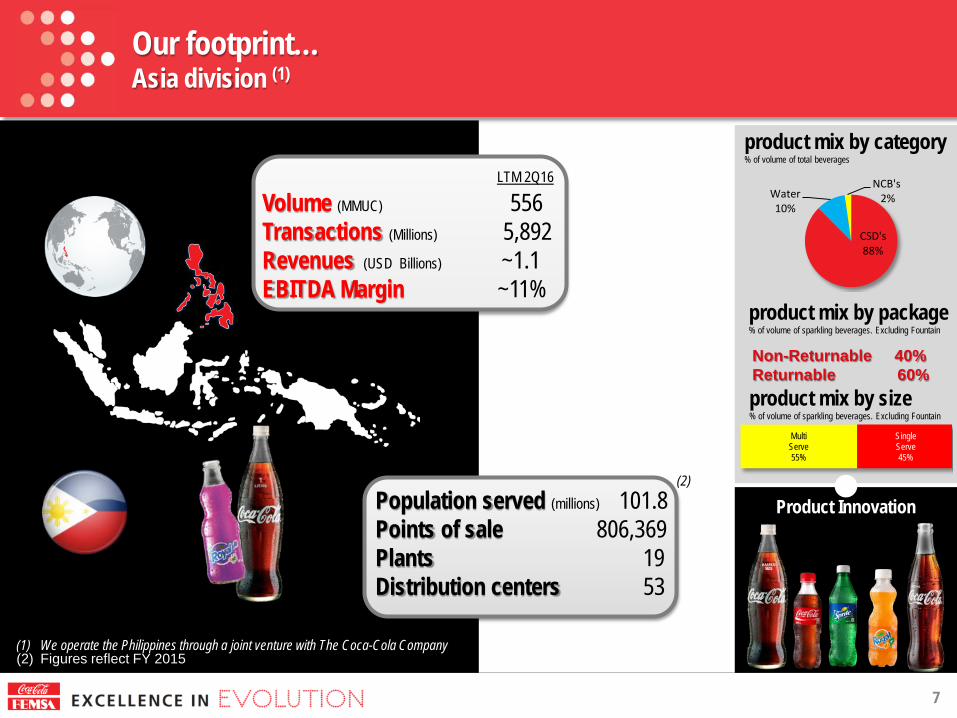
Our footprint… Asia division (1)
7
product mix by package % of volume of sparkling beverages. Excluding Fountain
product mix by category % of volume of total beverages
product mix by size % of volume of sparkling beverages. Excluding Fountain
Volume (MMUC) 556 Transactions (Millions) 5,892 Revenues (USD Billions) ~1.1 EBITDA Margin ~11%
Population served (millions) 101.8 Points of sale 806,369 Plants 19 Distribution centers 53
CSD's 88%
Water 10%
NCB's 2%
Non-Returnable 40% Returnable 60%
(1) We operate the Philippines through a joint venture with The Coca-Cola Company (2) Figures reflect FY 2015
Multi Serve 55%
Single Serve 45%
Product Innovation
LTM 2Q16
(2)
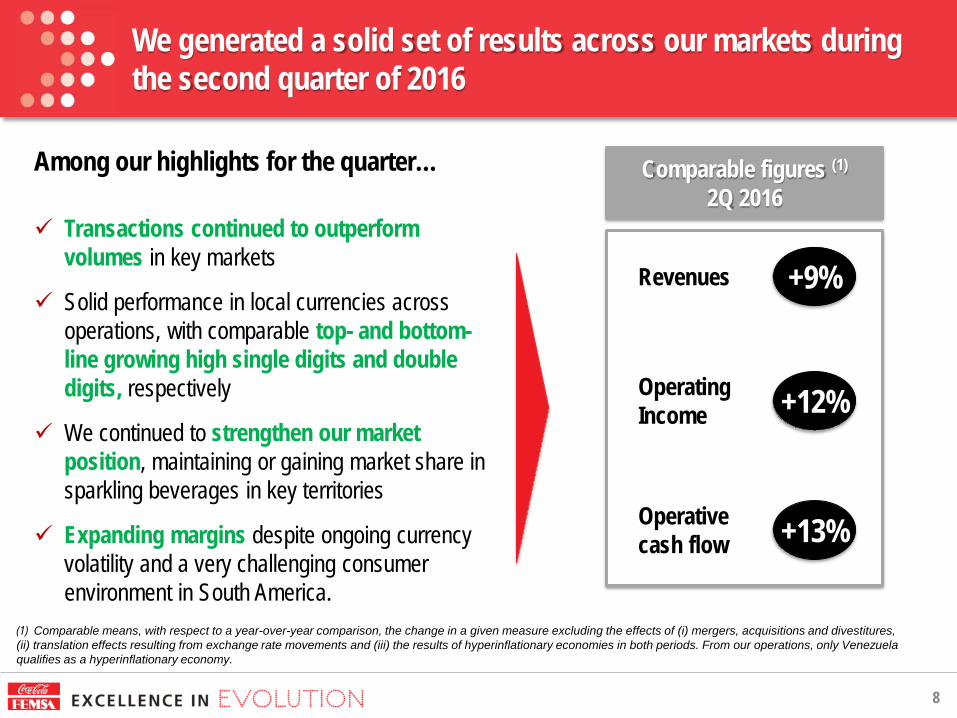
We generated a solid set of results across our markets during the second quarter of 2016
8
Among our highlights for the quarter… Transactions continued to outperform
volumes in key markets
Solid performance in local currencies across operations, with comparable top- and bottom-line growing high single digits and double digits, respectively
We continued to strengthen our market position, maintaining or gaining market share in sparkling beverages in key territories
Expanding margins despite ongoing currency volatility and a very challenging consumer environment in South America.
Comparable figures (1)
2Q 2016
Revenues
Operating Income
Operative cash flow
+9%
+12%
+13%
(1) Comparable means, with respect to a year-over-year comparison, the change in a given measure excluding the effects of (i) mergers, acquisitions and divestitures, (ii) translation effects resulting from exchange rate movements and (iii) the results of hyperinflationary economies in both periods. From our operations, only Venezuela qualifies as a hyperinflationary economy.
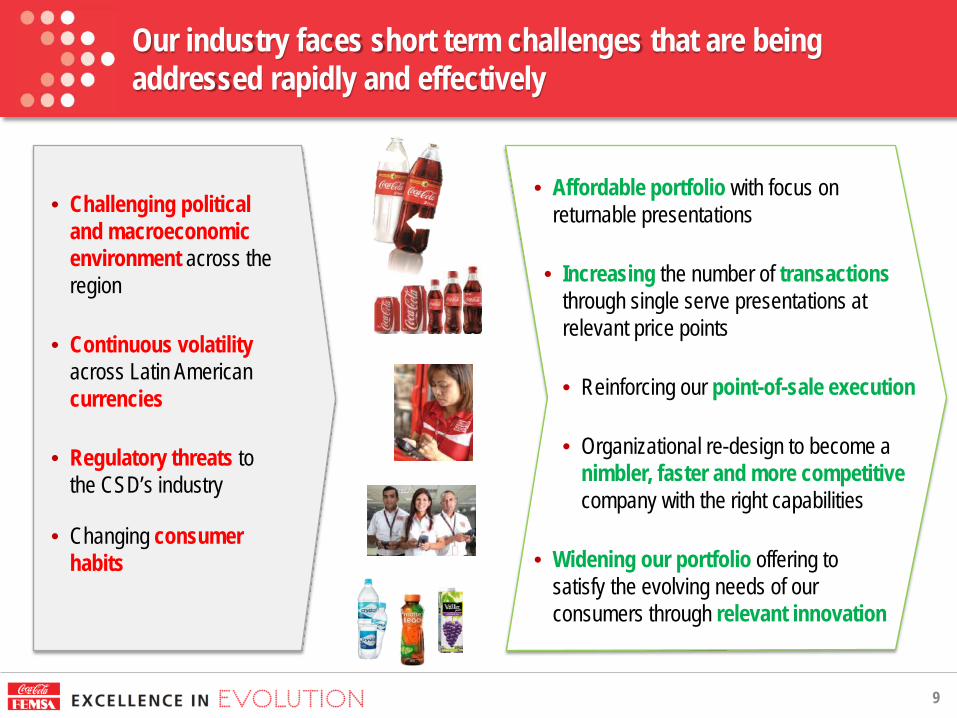
Our industry faces short term challenges that are being addressed rapidly and effectively
9
• Challenging political and macroeconomic environment across the region
• Continuous volatility across Latin American currencies
• Regulatory threats to the CSD’s industry
• Changing consumer habits
• Affordable portfolio with focus on returnable presentations
• Increasing the number of transactions through single serve presentations at relevant price points
• Reinforcing our point-of-sale execution
• Organizational re-design to become a nimbler, faster and more competitive company with the right capabilities
• Widening our portfolio offering to satisfy the evolving needs of our consumers through relevant innovation
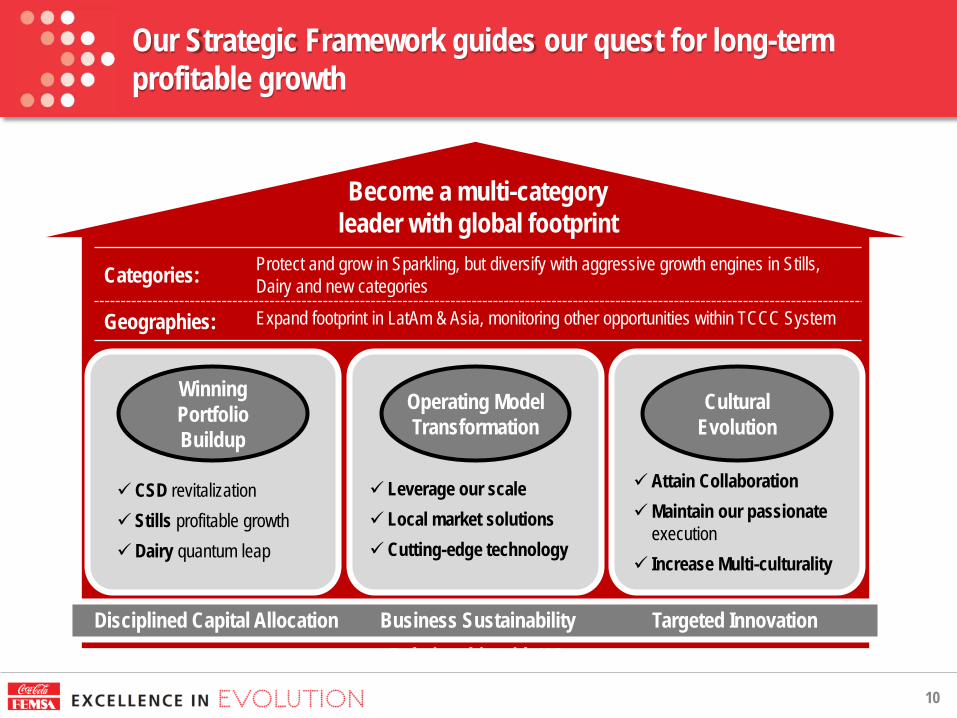
Our Strategic Framework guides our quest for long-term profitable growth
10
Winning Portfolio Buildup
Operating Model Transformation
Cultural Evolution
CSD revitalization Stills profitable growth Dairy quantum leap
Attain Collaboration Maintain our passionate
execution Increase Multi-culturality
Disciplined Capital Allocation Business Sustainability Relationship with KO
Categories: Protect and grow in Sparkling, but diversify with aggressive growth engines in Stills, Dairy and new categories
Geographies: Expand footprint in LatAm & Asia, monitoring other opportunities within TCCC System
Leverage our scale Local market solutions Cutting-edge technology
Targeted Innovation
Become a multi-category leader with global footprint
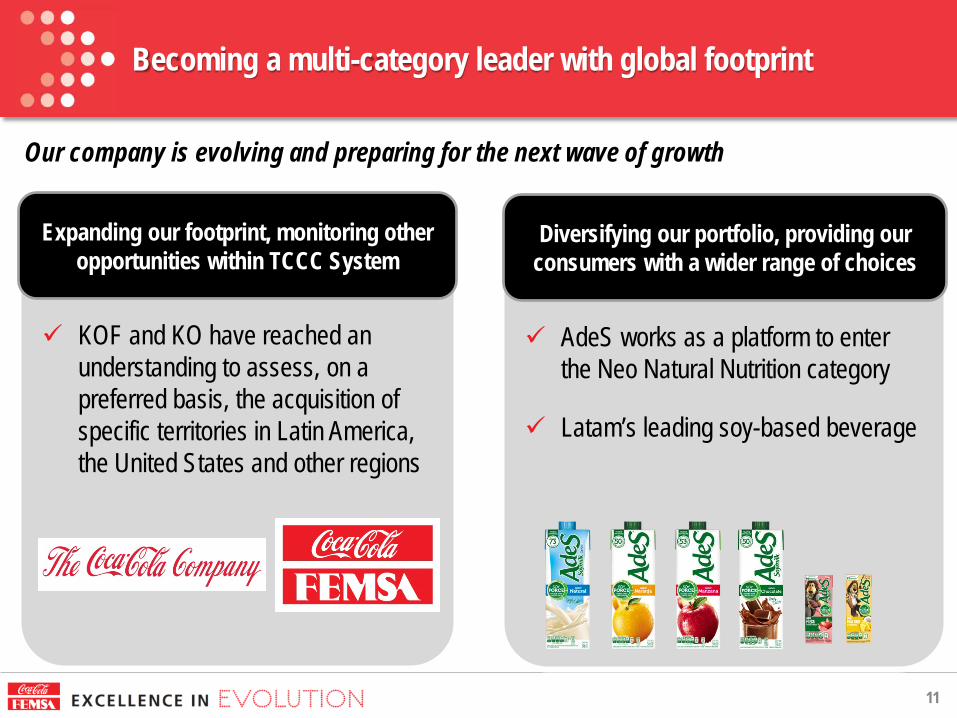
Becoming a multi-category leader with global footprint
11
Our company is evolving and preparing for the next wave of growth
KOF and KO have reached an understanding to assess, on a preferred basis, the acquisition of specific territories in Latin America, the United States and other regions
Expanding our footprint, monitoring other opportunities within TCCC System
AdeS works as a platform to enter the Neo Natural Nutrition category
Latam’s leading soy-based beverage
Diversifying our portfolio, providing our consumers with a wider range of choices
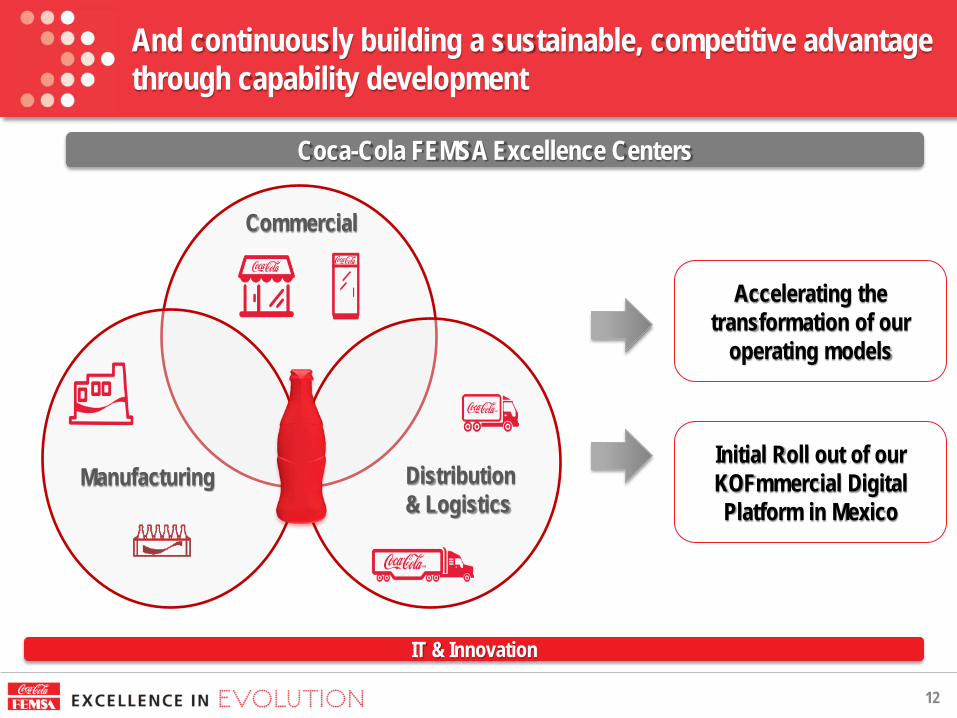
And continuously building a sustainable, competitive advantage through capability development
12
Commercial
Distribution & Logistics
Manufacturing
Coca-Cola FEMSA Excellence Centers
IT & Innovation
Accelerating the transformation of our
operating models
Initial Roll out of our KOFmmercial Digital Platform in Mexico
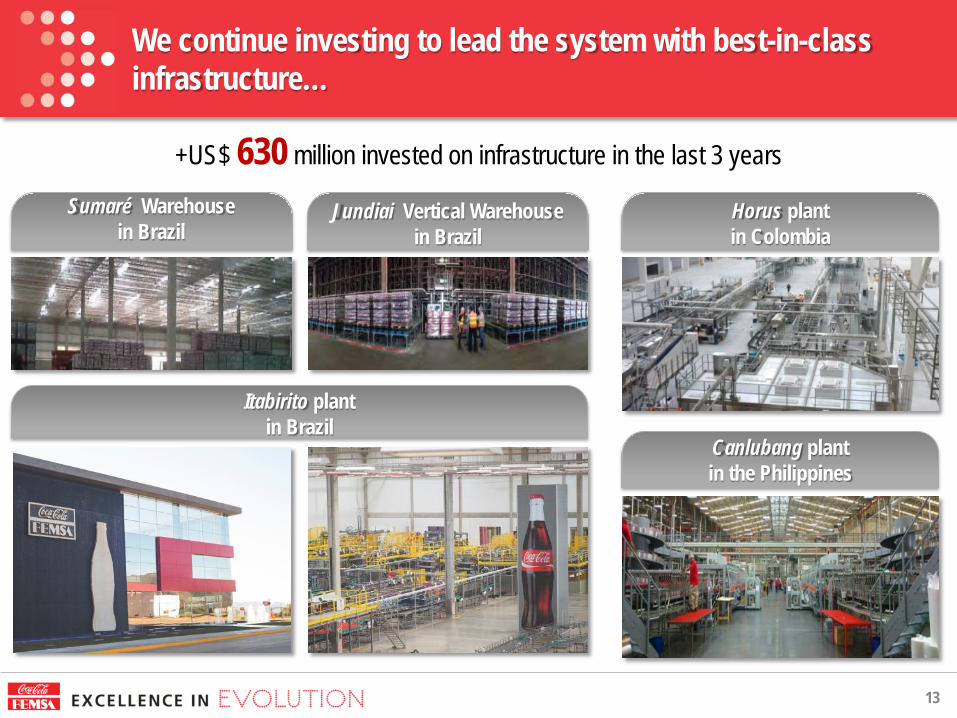
We continue investing to lead the system with best-in-class infrastructure…
13
Itabirito plant in Brazil
Jundiai Vertical Warehouse in Brazil
Sumaré Warehouse in Brazil
+US$ 630 million invested on infrastructure in the last 3 years
Horus plant in Colombia
Canlubang plant in the Philippines
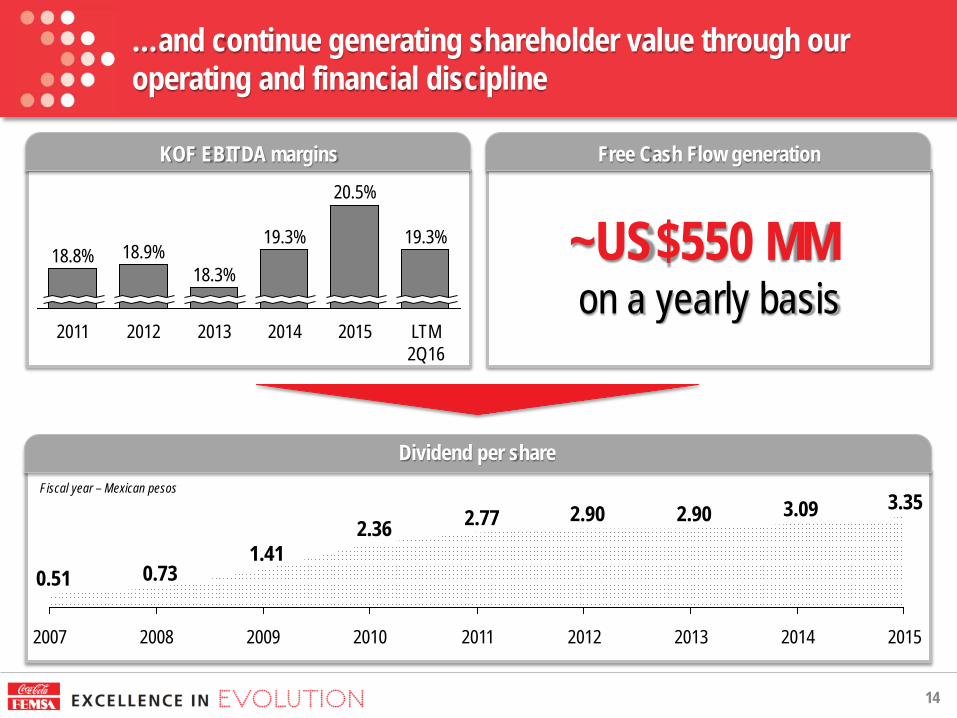
…and continue generating shareholder value through our operating and financial discipline
14
KOF EBITDA margins Free Cash Flow generation
Dividend per share
~US$550 MM on a yearly basis
LTM 2Q16
19.3%
2015
20.5%
2014
19.3%
2013
18.3%
2012
18.9%
2011
18.8%
Fiscal year – Mexican pesos 3.353.092.902.902.772.36
1.410.730.51
2013 2012 2011 2010 2009 2008 2007 2015 2014
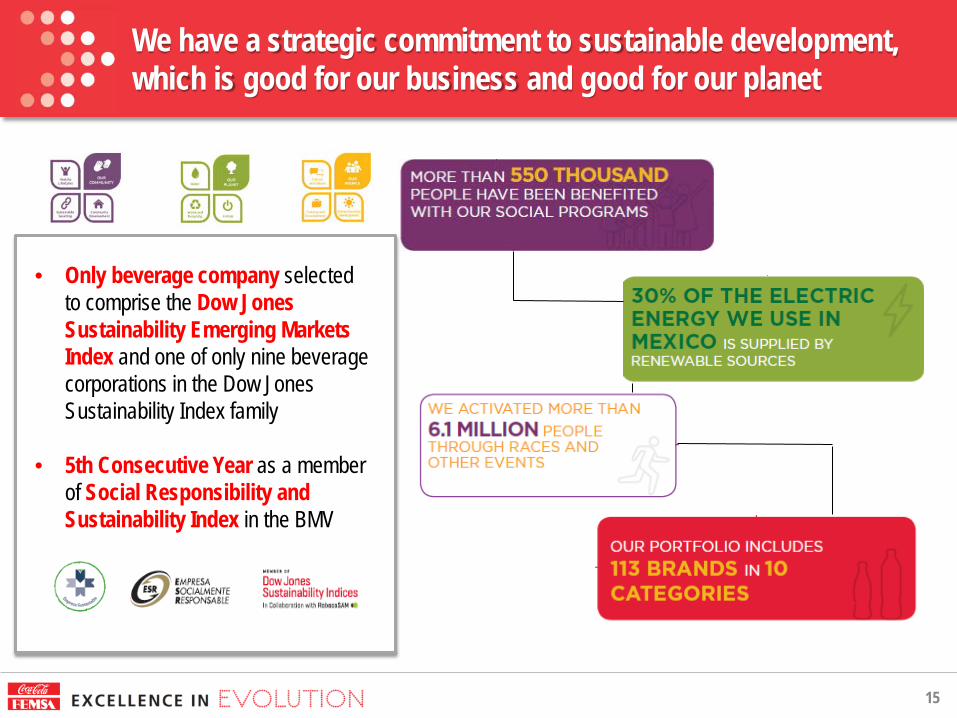
We have a strategic commitment to sustainable development, which is good for our business and good for our planet
15
• Only beverage company selected to comprise the Dow Jones Sustainability Emerging Markets Index and one of only nine beverage corporations in the Dow Jones Sustainability Index family
• 5th Consecutive Year as a member of Social Responsibility and Sustainability Index in the BMV
16
Thanks