Preparation of National Electrification Rollout Plan and ...
214
Preparation of National Electrification Rollout Plan and Financing Prospectus Final Report 11 April 2017 Submitted to DPE and the World Bank by: The Earth Institute Economic Consulting Associates Sustainable Engineering Lab School of Engineering and Applied Sciences and Earth Institute, Columbia University tel: +1-212-854-2956 [email protected] Economic Consulting Associates Limited 41 Lonsdale Road, London NW6 6RA, UK tel: +44 20 7604 4546 fax: +44 20 7604 4547 www.eca-uk.com
Transcript of Preparation of National Electrification Rollout Plan and ...
Preparation of National
Electrification Rollout
Plan and Financing
Prospectus
Final Report
11 April 2017
Submitted to DPE and the World
Bank by:
The Earth Institute
Economic Consulting Associates
Sustainable Engineering Lab
School of Engineering and Applied Sciences and
Earth Institute, Columbia University
tel: +1-212-854-2956
Economic Consulting Associates Limited
41 Lonsdale Road, London NW6 6RA, UK
tel: +44 20 7604 4546
fax: +44 20 7604 4547
www.eca-uk.com
Preparation of National Electrification Rollout Plan and Financing Prospectus
Contents
i
Contents
Abbreviations and acronyms vii
Executive summary 1
Introduction to this report 11
PART 1: GEOSPATIAL LEAST-COST NATIONAL ELECTRIFICATION PLAN 12
1 Introduction 13
2 Data collection and preparation 14
2.1 Geo-referenced PPL distribution system map 14
2.2 Geo-located demands 18
2.3 Technical and cost parameters 22
2.4 The need for a geospatial planning platform 32
3 Estimate of current grid access 33
4 Final Model Results 35
4.1 Final results for the “Base Case” 36
4.2 Costs of grid extension per decile and household (“cost build-up”) 42
4.3 Results of a high cost analysis reflecting recent project costs 46
4.4 Potential approaches to cost reduction 50
PART 2: IMPLEMENTATION OF THE LEAST-COST NATIONAL ELECTRIFICATION PLAN 53
5 Institutional framework 54
5.1 Introduction 54
5.2 Existing framework 55
5.3 Evaluation of options 67
5.4 Summary of recommendations 83
6 Funding mechanisms 106
6.1 Introduction 106
6.2 Existing mechanisms 107
6.3 Evaluation of options 115
Preparation of National Electrification Rollout Plan and Financing Prospectus
Contents
ii
6.4 Summary of recommendations 120
7 Environmental and social considerations 124
7.1 Introduction 124
7.2 Description of the different options for delivery access to electricity 125
7.3 Potential environmental and social impacts 128
7.4 Legal and regulatory context 132
7.5 Assessment of institutional capacity 155
8 Financing plan 158
8.1 Introduction 158
8.2 Electrification activities under NEROP 159
8.3 The investment requirements of NEROP 164
8.4 Availability of financing for NEROP 170
8.5 NEROP financing plan 175
ANNEXES 183
A1 All Geospatial Modelling Parameters 184
A2 Assessment of Inter-Household Distance 187
A3 30% Correction Factor for MV Length 191
A4 Geospatial Plan: Sensitivity Analysis 192
A5 International case studies on electrification 195
A5.1 Centralised approaches 195
A5.2 Decentralised approaches 198
A5.3 Hybrid approaches 200
A5.4 Community approaches 202
A5.5 Funding 203
Preparation of National Electrification Rollout Plan and Financing Prospectus
Tables, figures and boxes
iii
Tables, figures and boxes
Tables
Table 1: Summary MV grid infrastructure features mapped by PPL, February, 2016 15
Table 2: “Core” model parameters that apply to all electrification technologies. 23
Table 3:Household demand (PPL billing data, 2015, WB poverty analysis, 2004) 25
Table 4: Electrification project document, for verification of unit costs (PPL, 2016) 26
Table 5: “Base Case” values for critical model parameters related to grid access. 27
Table 6: Critical model parameters that apply to off-grid electrification technologies. 29
Table 7: Estimate of current grid access (PPL billing records, geospatial query, WB, HIES) 34
Table 8New household connections by 2030, by province (Base Case) 37
Table 9: System results and costs for 100% electricity access (grid and off-grid) by 2030 38
Table 10: Model result (Base Case, with 30% MV correction factor) 39
Table 11: Households, demand, MV added to PPL grid systems (Base Case) 41
Table 12: Incremental cumulative and average costs per decile of grid roll-out 43
Table 13: Cost Build-up per household (with 30% "MV correction factor") 45
Table 14: Model result (High Cost scenario, with 30% MV correction factor) 47
Table 15 Strengths and weaknesses of existing institutional framework 66
Table 16 Key characteristics of PPL sector 68
Table 17 Key ingredients checklist - centralised implementation 71
Table 18 PNG challenges checklist – centralised implementation 71
Table 19 Key ingredients checklist - decentralised implementation 74
Table 20 PNG challenges checklist – decentralised implementation 75
Table 21 Key ingredients checklist – hybrid public-private implementation 77
Table 22 PNG challenges checklist – hybrid public-private implementation 78
Table 23 Key ingredients checklist – community implementation 81
Table 24 PNG challenges checklist – community implementation 81
Table 25 Tiers of electricity access 88
Table 26 Alternative institutional models to OGEA 90
Table 27 Overview of institutional responsibilities under NEROP 94
Table 28 High-level technical assistance and capacity-building plan for NEROP 98
Table 29 Indicative technical assistance and capacity-building budget 104
Table 30 PPL implemented electricity projects in 2016 budget (million Kina) 111
Table 31 Provincial administration implemented projects in 2016 budget (million Kina) 111
Preparation of National Electrification Rollout Plan and Financing Prospectus
Tables, figures and boxes
iv
Table 32 Total electricity sector funding in 2016 budget (million Kina) 112
Table 33 Strengths and weaknesses of existing funding mechanisms 114
Table 34 Annual Fees (Kina) for Level 2 and Level 3 Prescribed Activities 144
Table 35 NEROP costs – grid intensification 164
Table 36 Scenarios for unit capital costs 165
Table 37 NEROP costs – grid extensions 167
Table 38 The cost impact of not implementing new hydro projects 168
Table 39 NEROP costs – off-grid solutions 169
Table 40 Total NEROP costs – base cost scenario 169
Table 41 Total NEROP costs – high cost scenario 170
Table 42 Total electricity sector funding in 2016 budget (million Kina) 172
Table 43 Summary of financing plan – no financing constraint 176
Table 44 Financing sources in the first 5 years – no financing constraint 177
Table 45 Grid only financing sources in the first 5 years – no financing constraint 177
Table 46 Summary of financing plan – US$50m/year financing cap 178
Table 47 Financing sources in the first 5 years – US$50m/year financing cap 178
Table 48 Grid only financing sources in the first 5 years – US$50m/year financing cap 179
Table 49 Summary of financing plan – higher unit costs 179
Table 50 Financing sources in the first 5 years – higher unit costs 180
Table 51 Grid only financing sources in the first 5 years – higher unit costs 180
Table 52 Summary of financing plans under all scenarios 181
Table 53 Financing sources in the first 5 years – no financing constraint 182
Table 54: Sample community reviewed for inter-household spacing 188
Table 55: Results of "OW + ABC" approximation of inter-household distance 188
Table 56: Results of "area-based" approximation of inter-household distance. 189
Table 57: Results of "single-line" approximation of inter-household distance. 189
Table 58: Summary of results for three scenarios of the sensitivity analysis 194
Figures
Figure 1: Map of existing PPL MV grid systems (left); line length per system (right) 16
Figure 2: Grid infrastructure equipment (power plants, substations, transformers) 16
Figure 3: Other grid infrastructure (switches, end poles) 17
Figure 4: Non-geolocated CUs at the LLG level (2011 Census) 19
Figure 5: Creating a geographic “centroid” (red) for points, lines and polygons 19
Preparation of National Electrification Rollout Plan and Financing Prospectus
Tables, figures and boxes
v
Figure 6: Geo-located 2011 census units (orange) with centroids assigned the population for non-geolocated ward CUs (red). 20
Figure 7: Centroid (red) represents all non-geolocated population for CUs in an LLG 21
Figure 8:Household electricity consumption data from PPL service centers 24
Figure 9: Illustration of grid system components with unit costs for modelling 28
Figure 10: The 30% “correction factor” for MV lengths addresses the difference between an ideal straight line between locations vs. a path following local roads and topography. 29
Figure 11: Proposed new electricity systems (Final Results, Base Case). 36
Figure 12: Proposed grid extension by PPL system (Base Case). 40
Figure 13: Proposed grid, sequenced, by % households connected (Base Case). 42
Figure 14: Marginal cost curve for grid components as NEROP progresses (Base Case) 44
Figure 15: Marginal cost curve for grid components as NEROP progresses (High Cost scenario) 48
Figure 16: Proposed electrification system for each location ("High Cost" scenario) 49
Figure 17: Proposed grid network expansion by decile ("High Cost" scenario) 50
Figure 18 Org structure of DPE Energy Wing - Rural Electrification Division 64
Figure 19 Overview of key stakeholders 66
Figure 20 Overview of institutional options 82
Figure 21 Recommended institutional structure 84
Figure 22 Summary of recommended institutional responsibilities 85
Figure 23 Overview of procurement responsibilities 87
Figure 24 Overview of funding responsibilities 88
Figure 25 Organisational structure – REA in Tanzania 92
Figure 26 Breakdown of funding sources for electricity sector investments, 2016-2019 112
Figure 27 Recommended funding mechanisms 121
Figure 28 Overview of financing sources 121
Figure 29 CEPA Environmental Regulatory Framework 146
Figure 30 Approach to preparing a financing plan for NEROP 158
Figure 31 Current electrification in PNG (% of households) 159
Figure 32 Households to be connected under NEROP, by electrification activity 163
Figure 33 Households electrified in 2030 if 70% target is met 163
Figure 34 Range of capital costs per household (base case) – grid extensions 166
Figure 35 Breakdown of funding sources for electricity sector investments, 2016-2019 172
Figure 36 Average recurring costs vs tariffs (US$/kWh) 175
Figure 37 Annual capex and electrification rate – no financing constraint 176
Figure 38 Annual capex and electrification rate – US$50m/year financing cap 178
Preparation of National Electrification Rollout Plan and Financing Prospectus
Tables, figures and boxes
vi
Figure 39 Annual capex and electrification rate – higher unit costs 179
Figure 40: Open wire plus ABC approximation of inter-household spacing 188
Figure 41: Area-based approximation of inter-household spacing 189
Figure 42: Single line approximation of inter-household spacing 189
Figure 43: Results of visual review of satellite imagery for household spacing. 190
Figure 44: 30% "correction factor" addresses the complex pathways between locations 191
Boxes
Box 1 Electrification planning under NEROP 96
Box 2 Calculating an affordable tariff 175
Box 3 Utility led electrification in Lao PDR 195
Box 4 State led electrification in Vietnam 196
Box 5 Rural electrification office in Morocco 197
Box 6 Private sector participation in Chile 198
Box 7 Decentralised electrification in Burkina Faso 199
Box 8 Qualified third party model in the Philippines 200
Box 9 Rural electrification in Ethiopia 201
Box 10 Community involvement in Bangladesh 202
Box 11 Wholesale power subsidies in Thailand 203
Box 12 Franchise areas in the Philippines 203
Box 13 Capital subsidies in Peru 204
Box 14 Operational subsidies in Peru 205
PNG-NEROP-FinalReport-2017-04-11.docx 12/04/2017
Preparation of National Electrification Rollout Plan and Financing Prospectus
Abbreviations and acronyms
vii
Abbreviations and acronyms
ADB Asian Development Bank
AIIB Asian Infrastructure Investment Bank
AP Affected People
ARAP Abbreviated Resettlement Action Plan
BOT Build Operate Transfer
Capex Capital Expenditure
CCDA Climate Change Development Authority
CDM Clean Development Mechanism
CEPA Conservation and Environment Protection Authority
CSO Community Service Obligation
CU Census Unit (in NSO 2002 and 2011 Census datasets)
DBO Design Build Operate
DDA District Development Authority
DEC Department of Environment and Conservation
DMS Detailed Measurement Survey
DP Displaced Persons
DPE Department of Petroleum and Energy
DVG Department of the Valuer General
EA Environmental Assessment
ECA Economic Consulting Associates
EIA Environmental Impact Assessment
EIP Electricity Industry Policy
EIR Environmental Inception Report
EIS Environmental Impact Statement
EMC Electricity Management Committee
EMP Environment Management Plan
EMPR Emissions Mitigation Plan Report
EP Equator Principles
EP Environment Permit
ERP Emissions Reduction Plan
ES Environment Specialist
ESIA Environmental and Social Impact Assessment
ESMP Environment and Social Management Plan
FPIC Free, Prior and Informed Consent
GAD Gender and Development
GoPNG Government of Papua New Guinea
HV high voltage (66 kV and above)
IEE Initial Environmental Examination
IFC International Finance Corporation
IOL Inventory of Loss
IP Indigenous People/s
IPP Indigenous Peoples Plan
IPPF Indigenous Peoples Plan Framework
Preparation of National Electrification Rollout Plan and Financing Prospectus
Abbreviations and acronyms
viii
IPPR Independent Power Producer
IU Implementation Unit
kV kilovolt, or 1,000 volts (e.g. grid line capacity)
kVA kilovolt-ampere, or 1,000 volt amps (e.g. transformer or generator capacity)
kWh kilowatt-hour, or 1,000 watt hours (e.g.energy consumption)
LARP Land Acquisition and Resettlement Plan
LLG Local Level Government
LS Lump Sum
LV Low Voltage
LV low voltage (below 11 kV, e.g. 415 V and 220 V)
MV medium voltage (below 66 kV, e.g. 11 kV, 22 kV and 33 kV)
NEROP National Electrification Roll-Out Plan
NSO Papua New Guinea National Statsistics Office
O&M Operations and Maintenance
ODA Overseas Development Assistance
OGEA Off-Grid Electrification Authority
OP Operational Policies and Procedures of the WB
Opex Operating Expenditure
PAP Project Affected People
PCCI PNG Chamber of Commerce and Industry
PCR Physical Cultural Resource
PGK Papua New Guinea Kina
PMU Project Management Unit
PNG Papua New Guinea
PPA Power Purchase Agreement
PPL Papua New Guinea Power, Ltd.
PS Performance Standards (IFC)
PV Photo Voltaic
RAP Resettlement Action Plan
RCS Replacement Cost Survey
RPF Resettlement Policy Framework
SAR Social Assessment Report
SEL Sustainable Engineering Lab (affiliated with Columbia University)
SIA Social Impact Assessment
SIP Service Improvement Program
SMEC SMEC International Pty Ltd
SWER Single Wire Earth Return (distribution line)
TEIP Town Electrification Investment Program
ToR Terms of Reference
USD United States Dollar
WB World Bank
Wp Watt peak (e.g. solar panel capacity)
Preparation of National Electrification Rollout Plan and Financing Prospectus
Executive summary
1
Executive summary
About this report
This is the final report for geospatial least-cost modelling by the Columbia University consulting team for the National Electrification Roll-Out Plan (NEROP) for Papua New Guinea.
Part 1 of this report describes the results of geospatial cost and technical modelling as conducted by Sustainable Engineering Lab at the Earth Institute at Columbia University (SEL/EI).
Part 2 of this report details the implementation of NEROP, including the institutional framework, funding mechanisms, environmental and social safeguards, and financial plan, as prepared by Economic Consulting Associates (ECA).
Part 1: Geospatial Least-Cost National Electrification Plan
Preparation of the geospatial plan
The final modelling and analysis work took place in June and July, 2016, following completion of the medium voltage grid infrastructure mapping effort conducted by PNG Power (with support from the Columbia team) in March, 2016, and the presentation of preliminary results at the June 15, 2016, NEROP workshop in Port Moresby, Papua New Guinea.
This Final Report describes final results of algorithmic modelling performed by the team from the SEL/EI.The approach used in this modelling has been to: a) employ the best-available data for electricity demands (primarily settlements, education and health facilities) and the electricity grid network, b) compare the costs of electrification of unserved populations by grid, mini-grid and off-grid/solar technologies (informed by local and international information on costs and technical standards), and c) report on the recommended technology option, as well as the cost and technical capacity and other details, for each location.
Key insights from the geospatial modelling
The following summary provides the main insights gained from this geospatial least-cost modelling work:
PPL’s smartphone GPS mapping of the utility’s distribution grid was successful. The utility’s map of MV grid lines and related equipment (transformers, substations and switches) provides a sound basis for geospatial planning. Used in combination with other geospatial data (such as NSO census data and geolocated social infrastructure points) it has allowed an estimate of the national population within range of low-cost grid access, as well as least-cost modelling for future MV extensions and non-grid electrification options.
Preparation of National Electrification Rollout Plan and Financing Prospectus
Executive summary
2
Technical and cost modelling suggest that grid electrification is the least-cost option for approximately 75% of the nation’s population that currently lacks electricity access. A sensitivity analysis exploring multiple modelling scenarios confirms that grid is generally the most cost-effective option, though the proportion of the population recommended for grid varies between 65-80%, depending upon modelling assumptions. The overwhelming majority of the remaining population is recommended for mini-grids.
These model results provide estimates of technical needs and costs for achieving 100% electricity access, which, with some assumptions, are adapted to PNG’s 70% national electrification target. The average cost per household across the entire grid extension program is around US$1,550; for the national PNG target (70% access) the per household cost per grid connection is about US$1,475. The difference in cost reflects the prioritization of lower cost connections, which typically require less low and medium voltage line, for the earlier portion of the grid extension program. The cost per household for mini-grid access with the same service standard as grid-connected homes is about US$1,160 but this cost is highly variable, depending crucially upon the capacity (in Watts per household) of the mini-grid specified.
Parameter inputs, such as unit costs for electricity equipment and geographic factors such as LV line needed to cover the “last mile” to connect homes, are a key determinant in model results. A close review of modelling parameters with local electrification experts from PPL and the private sector suggest that the distances between homes in different parts of the country, which determine LV costs, are a key factor.
The project work plan has been updated to target completion within the 8-month timeframe. The current plan is on-track to complete the project by the contract closing date of late September.
Part 2: Implementation of the Least-Cost National Electrification
Plan
Institutional framework
The current institutional framework
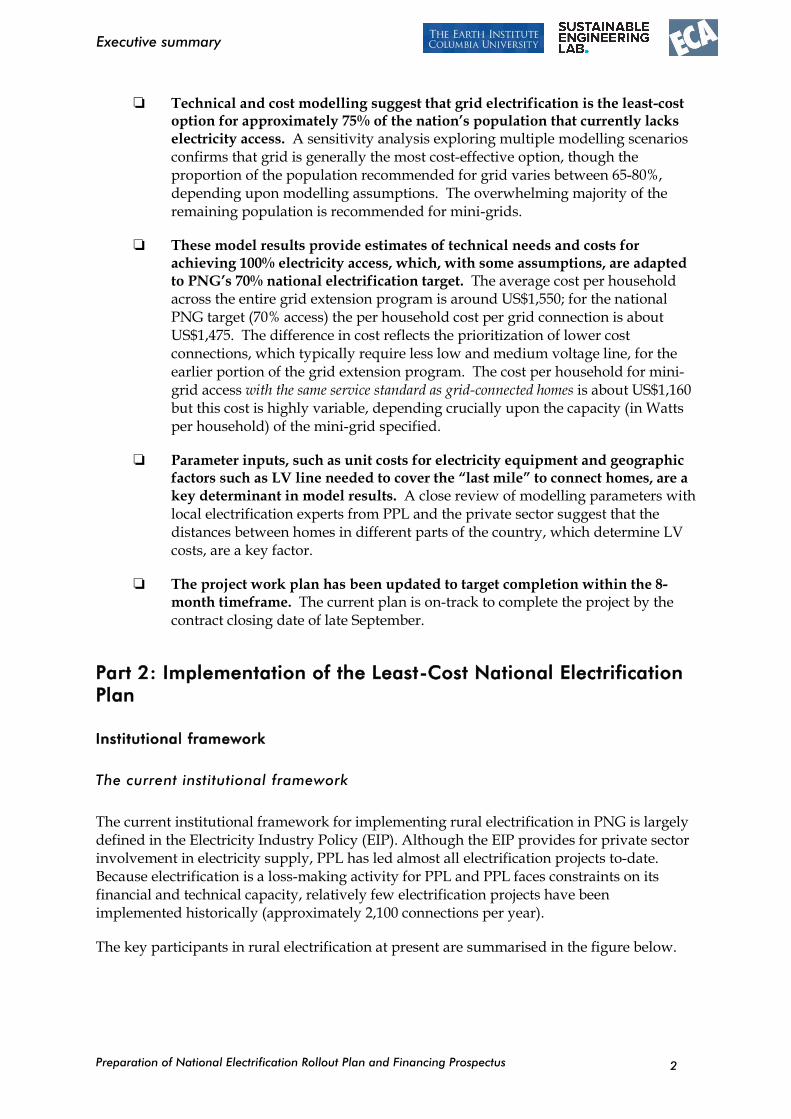
The current institutional framework for implementing rural electrification in PNG is largely defined in the Electricity Industry Policy (EIP). Although the EIP provides for private sector involvement in electricity supply, PPL has led almost all electrification projects to-date. Because electrification is a loss-making activity for PPL and PPL faces constraints on its financial and technical capacity, relatively few electrification projects have been implemented historically (approximately 2,100 connections per year).
The key participants in rural electrification at present are summarised in the figure below.
Preparation of National Electrification Rollout Plan and Financing Prospectus
Executive summary
3
Key electrification challenges and requirements
International experience shows that the exact institutional structure is not critical to a country’s success in implementing an electrification program. What is more important is that the chosen structure suits the specific circumstances of the particular country. Nevertheless, there are a few fundamental challenges that all electrification programs face, including:
Low affordability and high costs in remote areas: Electrification is generally not financially viable without subsidies, and it can undermine the financial position of existing utilities.
Exposed to political interference: There are usually political pressures to electrify favoured communities first. This can lead to both overlapping and conflicting government responsibilities.
Limited technical and management capacity: Electrification is labour-intensive and requires large numbers of people. Power utility management is often not focused on electrification as a priority and it gets neglected.
There are also a few critical lessons that can be drawn from international experience:
Clear performance indicators and incentives: Entities must have clear targets for delivery and incentives to meet these.
Ring-fence from commercial activities: Given that electrification is generally loss-making, particularly mini-grids.
Preparation of National Electrification Rollout Plan and Financing Prospectus
Executive summary
4
Avoid creating excessive costs: Having multiple small entities reduces economies of scale and increases administrative and regulatory costs.
Ensure sustainability: Entities responsible for operating and maintaining systems must have sufficient technical and financial capacity to do so.
Recommended institutional framework for implementing NEROP
We recommend that PNG adopt a hybrid approach to implementing NEROP, with PPL responsible for grid extensions and the private sector responsible for establishing new off-grid solutions, including mini-grids. If there is insufficient interest from the private sector in establishing mini-grids, the obligation falls back on PPL.
This approach combines the key advantages of centralised implementation – economies of scale, use of existing technical and commercial expertise, the ability to directly control the speed of the rollout – with the key advantages of a decentralised model – utilisation of private sector capital and expertise, overcoming capacity constraints on the utility, reducing costs through competition, independence from political interference.
More specifically we recommend that:
PPL be given grid rollout targets, as defined by the lead policy-making agency (DPE), coupled with incentive mechanisms for achieving those targets. A central fund for electrification projects will be established. PPL can use it to fund the capital costs of grid extensions
A new Off-Grid Electrification Authority (OGEA) be established, which is a sister company to PPL, with Kumul Consolidated Holdings as its shareholder. OGEA will be the owner and licensed operator of all mini-grids. However, OGEA will not directly construct or operate systems, all services would be contracted out to either the private sector or PPL. It will effectively be a procurement authority/asset manager. This ensures that the limited technical and operational capacity within PNG is not spread too thinly.
PPL be allowed to compete with the private sector for OGEA tendered contracts, on the same terms. In the event that there is insufficient interest in a contract, the obligation would fall back on PPL as the operator of last resort under a Design Build Operate (DBO) contract. Importantly, PPL would fully recover all of its costs under the contract. In other words, PPL will not be forced to cross-subsidise loss-making mini-grids.
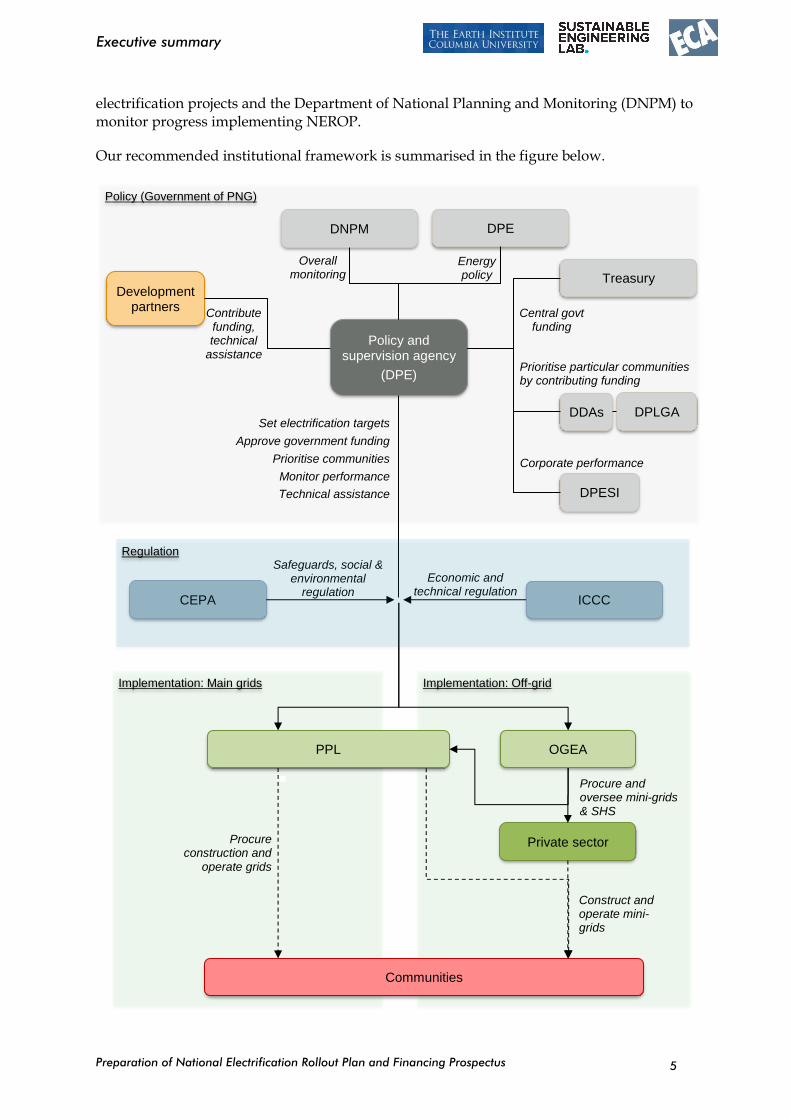
We recommend that the lead primary policy making agency (DPE) define electrification targets for both PPL and OGEA, including selecting and prioritising the areas to be served (by either PPL-led grid extension or OGEA-led mini-grids), administer the electrification funds and ensure that available funding aligns with the electrification targets, and encourage and mobilise the private sector, including involving communities where possible.
DPE will need to work closely with a number of other government departments, in particular with the Department of Provincial and Local Government Affairs (DPLGA) to identify/prioritise communities for electrification and to allocate SIP funding to
Preparation of National Electrification Rollout Plan and Financing Prospectus
Executive summary
5
electrification projects and the Department of National Planning and Monitoring (DNPM) to monitor progress implementing NEROP.
Our recommended institutional framework is summarised in the figure below.
Implementation: Main grids Implementation: Off-grid
Policy (Government of PNG)
Private sector
PPL OGEA
Policy and supervision agency
(DPE)
Communities
Construct and operate mini-grids
Procure and oversee mini-grids & SHS
Procure construction and
operate grids
Set electrification targets
Approve government funding
Prioritise communities
Monitor performance
Technical assistance
DDAs
Prioritise particular communities by contributing funding
ICCC
Economic and technical regulation
CEPA
Safeguards, social & environmental
regulation
Development partners
DPE DNPM
Treasury
DPLGA
Central govt funding
Overall monitoring
Energy policy
Contribute funding, technical
assistance
DPESI
Regulation
Corporate performance
Preparation of National Electrification Rollout Plan and Financing Prospectus
Executive summary
6
Technical assistance required
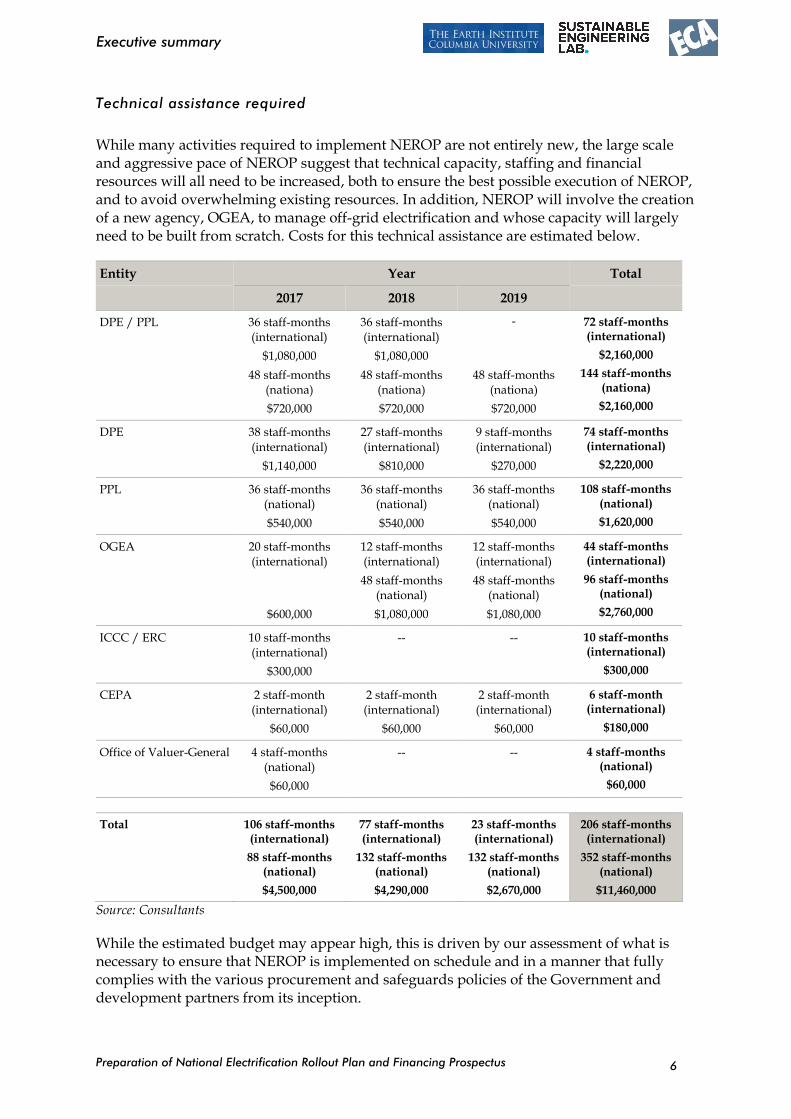
While many activities required to implement NEROP are not entirely new, the large scale and aggressive pace of NEROP suggest that technical capacity, staffing and financial resources will all need to be increased, both to ensure the best possible execution of NEROP, and to avoid overwhelming existing resources. In addition, NEROP will involve the creation of a new agency, OGEA, to manage off-grid electrification and whose capacity will largely need to be built from scratch. Costs for this technical assistance are estimated below.
Entity Year Total
2017 2018 2019
DPE / PPL 36 staff-months (international)
$1,080,000
48 staff-months (nationa)
$720,000
36 staff-months (international)
$1,080,000
48 staff-months (nationa)
$720,000
-
48 staff-months (nationa)
$720,000
72 staff-months (international)
$2,160,000
144 staff-months (nationa)
$2,160,000
DPE 38 staff-months (international)
$1,140,000
27 staff-months (international)
$810,000
9 staff-months (international)
$270,000
74 staff-months (international)
$2,220,000
PPL 36 staff-months (national)
$540,000
36 staff-months (national)
$540,000
36 staff-months (national)
$540,000
108 staff-months (national)
$1,620,000
OGEA 20 staff-months (international)
$600,000
12 staff-months (international)
48 staff-months (national)
$1,080,000
12 staff-months (international)
48 staff-months (national)
$1,080,000
44 staff-months (international)
96 staff-months (national)
$2,760,000
ICCC / ERC 10 staff-months (international)
$300,000
-- -- 10 staff-months (international)
$300,000
CEPA 2 staff-month (international)
$60,000
2 staff-month (international)
$60,000
2 staff-month (international)
$60,000
6 staff-month (international)
$180,000
Office of Valuer-General 4 staff-months (national)
$60,000
-- -- 4 staff-months (national)
$60,000
Total 106 staff-months (international)
88 staff-months (national)
$4,500,000
77 staff-months (international)
132 staff-months (national)
$4,290,000
23 staff-months (international)
132 staff-months (national)
$2,670,000
206 staff-months (international)
352 staff-months (national)
$11,460,000
Source: Consultants
While the estimated budget may appear high, this is driven by our assessment of what is necessary to ensure that NEROP is implemented on schedule and in a manner that fully complies with the various procurement and safeguards policies of the Government and development partners from its inception.
Preparation of National Electrification Rollout Plan and Financing Prospectus
Executive summary
7
Funding mechanisms
The current funding mechanisms
PPL currently relies on cross-subsidies, by applying a uniform tariff, to operate expensive diesel mini-grid systems. PPL has not however increased tariffs in recent years and its financial capacity is limited, which makes funding further electrification projects difficult.
The EIP envisages that future grid extensions to unprofitable areas will be funded through up-front subsidies and grid-specific tariffs. One key mechanism for the Government to provide up-front subsidies is the national CSO framework, however it has yet been fully implemented and therefore no centralised funding is available at present. Similarly, the Electricity Trust Fund envisaged in the EIP has not been established.
International experience with funding electrification
No successful rural electrification program worldwide has functioned without some form of subsidy, although the exact form of subsidy is not critical. What matters most is cost-recovery –- operators must be able to recover the full costs of supply through a combination of tariffs and subsidies.
Capital cost subsidies are the primary mechanism for funding rural electrification programs worldwide. By reducing the installation cost of the generators and distribution grid, either through grant funding or concessionary loans, many schemes are then able to charge affordable tariffs that fully cover the remaining costs of operating the system.
The cost of operating mini-grids in PNG (including capital replacement) is likely to exceed $0.50/kWh in many cases, which may limit consumption for many rural households. While this can likely be reduced in some cases by reducing service standards and implementing off-grid solutions such as solar home systems, we still expect that capital, operational, and connection subsidies will be needed in many cases to ensure that PNG operators can fully recover their costs.
Recommended funding mechanisms
Our key recommendations for funding NEROP include:
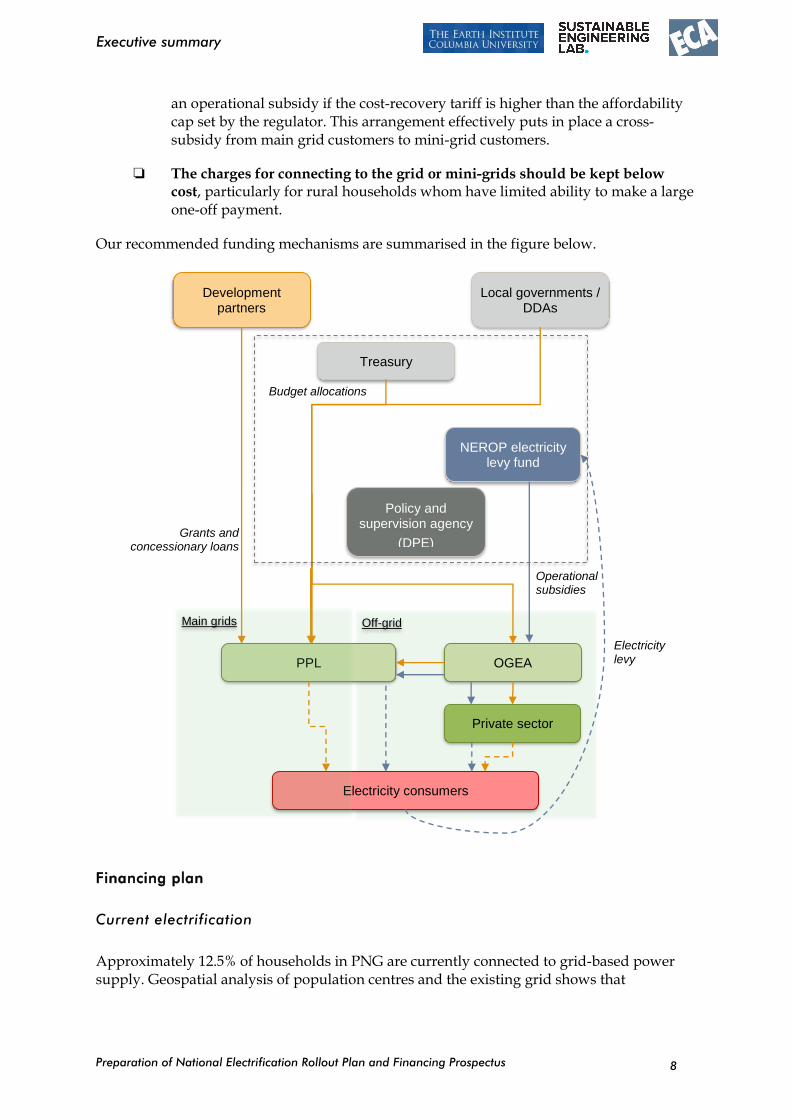
Central government and local government should contribute to an electrification fund used to subsidise the upfront capital costs of both grid extensions and off-grid solutions. Treasury will administer the fund and define the prioritisation of areas/schemes. Local governments should be able to top-up or fully cover the available funding for a particular scheme in their province,bring forward the scheme in the queue.
Development partners can co-finance specific projects or geographic areas covering both grid extensions and off-grid solutions. Bundling investments into geographic areas should minimise transaction costsupport.
An electricity levy should be added to consumers’ electricity bills that is used to provide operational subsidies in select cases. Schemes would be eligible for
Preparation of National Electrification Rollout Plan and Financing Prospectus
Executive summary
8
an operational subsidy if the cost-recovery tariff is higher than the affordability cap set by the regulator. This arrangement effectively puts in place a cross-subsidy from main grid customers to mini-grid customers.
The charges for connecting to the grid or mini-grids should be kept below cost, particularly for rural households whom have limited ability to make a large one-off payment.
Our recommended funding mechanisms are summarised in the figure below.
Financing plan
Current electrification
Approximately 12.5% of households in PNG are currently connected to grid-based power supply. Geospatial analysis of population centres and the existing grid shows that
Off-grid
Policy and supervision agency
(DPE)
Development partners
OGEA
Treasury
Local governments / DDAs
NEROP electricity levy fund
PPL
Private sector
Electricity consumers
Grants and concessionary loans
Operational subsidies
Main grids
Electricity levy
Budget allocations
Preparation of National Electrification Rollout Plan and Financing Prospectus
Executive summary
9
approximately 6.5% of households are within 1km of an existing grid transformer but not connected. The remaining 81% of households are further than 1 km from the grid.
Investment requirement
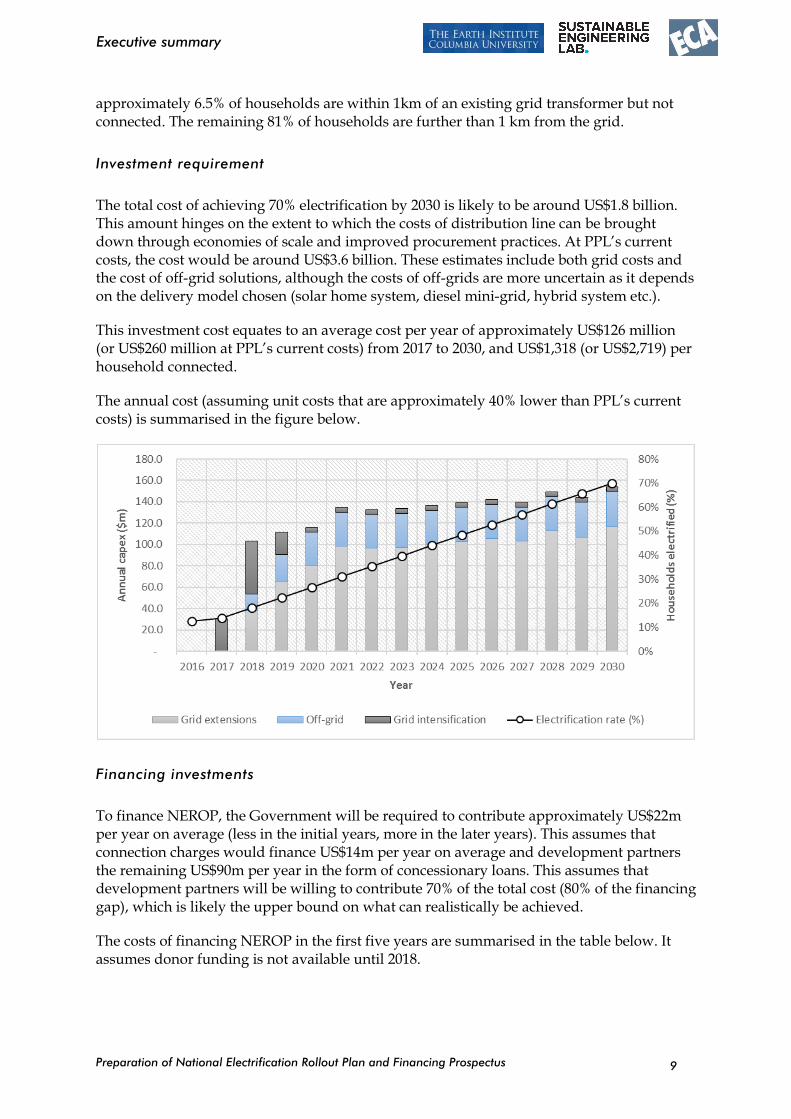
The total cost of achieving 70% electrification by 2030 is likely to be around US$1.8 billion. This amount hinges on the extent to which the costs of distribution line can be brought down through economies of scale and improved procurement practices. At PPL’s current costs, the cost would be around US$3.6 billion. These estimates include both grid costs and the cost of off-grid solutions, although the costs of off-grids are more uncertain as it depends on the delivery model chosen (solar home system, diesel mini-grid, hybrid system etc.).
This investment cost equates to an average cost per year of approximately US$126 million (or US$260 million at PPL’s current costs) from 2017 to 2030, and US$1,318 (or US$2,719) per household connected.
The annual cost (assuming unit costs that are approximately 40% lower than PPL’s current costs) is summarised in the figure below.
Financing investments
To finance NEROP, the Government will be required to contribute approximately US$22m per year on average (less in the initial years, more in the later years). This assumes that connection charges would finance US$14m per year on average and development partners the remaining US$90m per year in the form of concessionary loans. This assumes that development partners will be willing to contribute 70% of the total cost (80% of the financing gap), which is likely the upper bound on what can realistically be achieved.
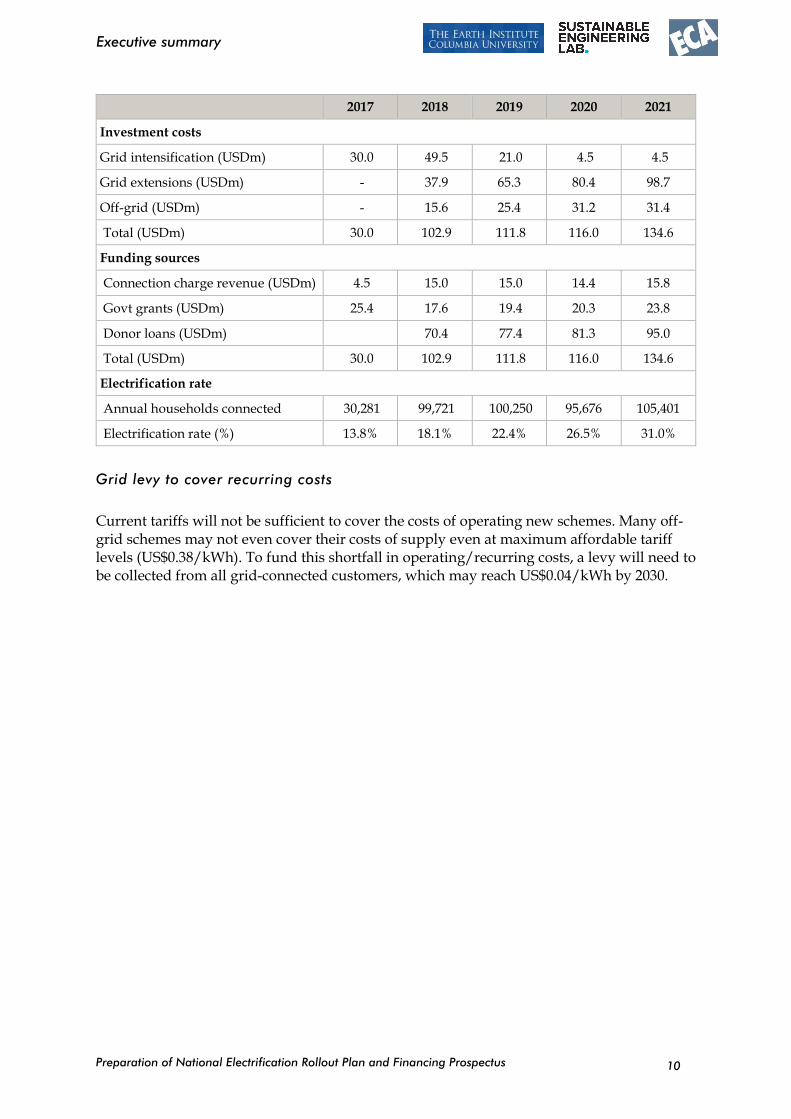
The costs of financing NEROP in the first five years are summarised in the table below. It assumes donor funding is not available until 2018.
Preparation of National Electrification Rollout Plan and Financing Prospectus
Executive summary
10
2017 2018 2019 2020 2021
Investment costs
Grid intensification (USDm) 30.0 49.5 21.0 4.5 4.5
Grid extensions (USDm) - 37.9 65.3 80.4 98.7
Off-grid (USDm) - 15.6 25.4 31.2 31.4
Total (USDm) 30.0 102.9 111.8 116.0 134.6
Funding sources
Connection charge revenue (USDm) 4.5 15.0 15.0 14.4 15.8
Govt grants (USDm) 25.4 17.6 19.4 20.3 23.8
Donor loans (USDm) 70.4 77.4 81.3 95.0
Total (USDm) 30.0 102.9 111.8 116.0 134.6
Electrification rate
Annual households connected 30,281 99,721 100,250 95,676 105,401
Electrification rate (%) 13.8% 18.1% 22.4% 26.5% 31.0%
Grid levy to cover recurring costs
Current tariffs will not be sufficient to cover the costs of operating new schemes. Many off-grid schemes may not even cover their costs of supply even at maximum affordable tariff levels (US$0.38/kWh). To fund this shortfall in operating/recurring costs, a levy will need to be collected from all grid-connected customers, which may reach US$0.04/kWh by 2030.

Preparation of National Electrification Rollout Plan and Financing Prospectus
Introduction to this report
11
Introduction to this report
This is the Final Report for the National Electrification Roll-Out Plan (NEROP) for Papua New Guinea. The document consists of two parts:
Part 1: Geospatial Least-Cost National Electrification Plan: the first part (sections 1 - 5) documents the data-driven, technical and cost modelling work undertaken by the prime contractor, the Sustainable Engineering Lab, of the Earth Institute at Columbia University (SEL/EI), to create a least-cost plan for to achieve national electrification targets defined by the Papua New Guinea Department of Petroleum and Energy (DPE).
Part 2: Institutional Framework, Funding Mechanisms, Financing Plan: the second part (sections 5 – 8) documents results of related work on other dimensions of the NEROP project, including financial, regulatory, and environmental and social safeguards, by Economic Consulting Associates (ECA).
This report presents the final results for the NEROP project. The Investment Prospectus is provided separately.

Preparation of National Electrification Rollout Plan and Financing Prospectus
Part 1: Geospatial Least-Cost National
Electrification Plan
12
PART 1: GEOSPATIAL LEAST-COST NATIONAL ELECTRIFICATION
PLAN
Preparation of National Electrification Rollout Plan and Financing Prospectus
Introduction
13
1 Introduction
This document presents the final results for the geo-spatial technical and cost analysis for the project “Preparation of National Electrification Least Cost Geospatial Rollout Plan (grid and off-grid) and Sector-wide Investment Financing Prospectus,” implemented by the Papua New Guinea Department of Petroleum and Energy (DPE). These results have been prepared by Columbia University – specifically the Sustainable Engineering Lab, directed by Prof. Vijay Modi, which is part of the Earth Institute at Columbia University. This technical and cost modelling is the foundation for the geospatial least cost national electrification rollout plan for the Government of Papua New Guinea, with a target of achieving 70% electricity access nationwide by 2030.
This work emerges from the country’s national electrification goals and planning process, as outlined in the Government’s Electricity Industry Policy (EIP). Recognizing electricity as a key enabler for achieving economic growth, widely shared prosperity, and modernization, the Government of Papua New Guinea (GoPNG) has prioritized increasing electricity access as an important element of the country’s Vision 2050. To address this challenge, the EIP aims to put in place the institutions, processes, and mechanisms to enable achievement of the national goals of reliable supply and affordable access for all citizens in an efficient and equitable manner. The EIP established the Electricity Management Committee (EMC) as the overarching coordinating body to implement and achieve the objectives set out in the EIP, with the Secretary of the Department of Petroleum and Energy (DPE) as the EMC’s chair. A major policy initiative launched under the EIP is the preparation of the National Electrification Rollout Plan (NEROP) to scale up access nationwide. The geo-spatial least-cost national electrification plan that immediately follows is one of the key components of NEROP. This geo-spatial analysis also forms the basis for other key NEROP components, including the parallel effort by Economic Consulting Associates focused on preparation of the Prospectus for Investment Financing for the first 5 years of the project, also described in this report.
The scope of work broadly encompasses: geo-located electricity demand projections; evaluation and comparison of grid and non-grid electrification technologies for each demand location; and creation of a least-cost GIS electrification roll-out plan with attention to the plan’s sensitivity to key variables and policies. These have been performed by an open-source, web-based software system for electrification cost modelling designed and used by SEL/EI in New York City, called “NetworkPlanner.” Results of this work were used by another member of this consulting consortium (ECA) as a key input for that firm’s preparation of preliminary results for an investment plan, as well as to inform investigations of institutional, regulatory, environmental and social aspects of this project. All results of this work were presented at the NEROP workshop in Port Moresby, Papua New Guinea, on August 17, 2016.
Preparation of National Electrification Rollout Plan and Financing Prospectus
Data collection and preparation
14
2 Data collection and preparation
Initial efforts to collect and prepare data were described in Inception Report, including: collection of geo-located populated places and other electricity demand locations, initial training for mapping of medium voltage grid infrastructure, and collection of information regarding technical and cost parameters for modelling.
A very brief review of the main components of the SEL electrification planning approach helps to put this data collection work in context. The SEL model relies upon three main types of information: (i) geolocated demand points (populated places and social infrastructure), (ii) a map of medium-voltage grid infrastructure (MV lines and transformers), and (iii) 75-80 modelling parameters related to settlement patterns, technical aspects and costs of grid and non-grid electrification projects and technologies. The model employs this information in three basic steps. First, the model computes future electricity demand for all locations in the system along with the costs to meet this demand using three electrification technologies (grid, diesel mini-grid and solar systems); second, the model uses a combination of location and cost data to propose a grid network and non-grid system locations; and, third, the model performs a simple computation comparing initial investment costs vs. electricity delivered to each grid location to prioritize the grid extension to each location (prioritization of non-grid systems is not specified in this step).
Building upon the description provided in the Inception Report, the following section details subsequent efforts to complete, refine, vet or otherwise improve the underlying geo-spatial dataset.
2.1 Geo-referenced PPL distribution system map
SEL/EI conducted a week long training for a group of PPL teams during the inception visit in February, 2016, focused on use of GPS-enabled smartphones to map the existing medium voltage (MV) grid infrastructure, including lines, transformers and other equipment. Within a week following the training, PPL had put in place field logistics and vehicles for 5 separate mapping teams. Within about 40 days, PPL successfully mapped a total of approximately 4,100 km of MV lines, comprising 1,880 km of 11 kV lines (primarily in urban areas) and 2,216 km of 22 kV lines (primarily in rural areas). The PPL teams also simultaneously mapped other grid infrastructure and assets like, power plants, injection substations, transformers, switches, isolators and end poles. A summary of the features mapped is presented in Table 1 below (and all of this data is accessible via an online geo-database portal at ppl.gridmaps.org).
Preparation of National Electrification Rollout Plan and Financing Prospectus
Data collection and preparation
15
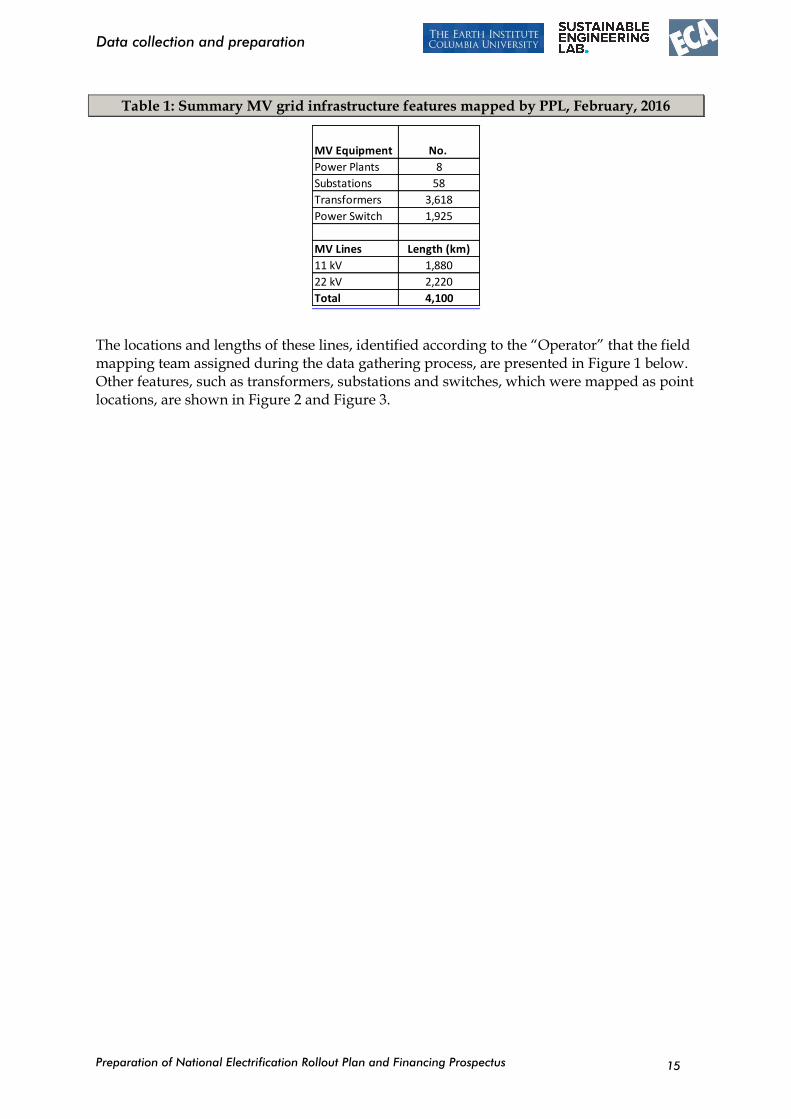
Table 1: Summary MV grid infrastructure features mapped by PPL, February, 2016
The locations and lengths of these lines, identified according to the “Operator” that the field mapping team assigned during the data gathering process, are presented in Figure 1 below. Other features, such as transformers, substations and switches, which were mapped as point locations, are shown in Figure 2 and Figure 3.
MV Equipment No.
Power Plants 8
Substations 58
Transformers 3,618
Power Switch 1,925
MV Lines Length (km)
11 kV 1,880
22 kV 2,220
Total 4,100
Preparation of National Electrification Rollout Plan and Financing Prospectus
Data collection and preparation
16
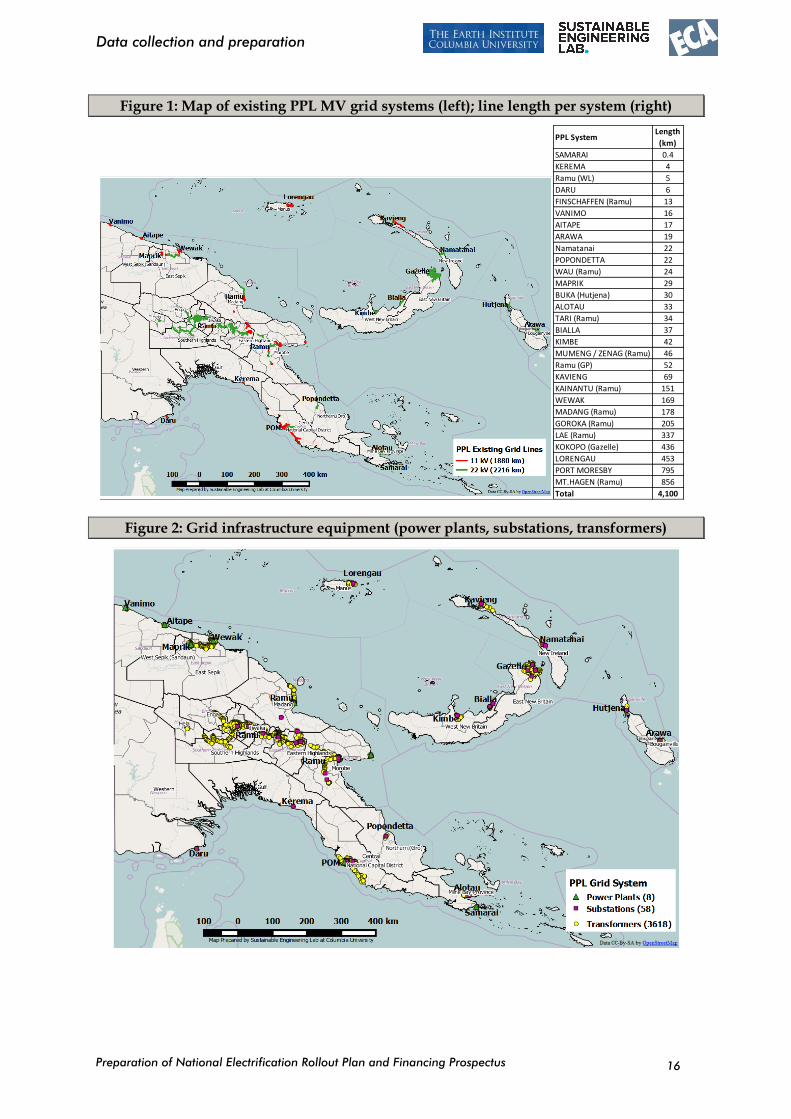
Figure 1: Map of existing PPL MV grid systems (left); line length per system (right)
Figure 2: Grid infrastructure equipment (power plants, substations, transformers)
PPL SystemLength
(km)
SAMARAI 0.4
KEREMA 4
Ramu (WL) 5
DARU 6
FINSCHAFFEN (Ramu) 13
VANIMO 16
AITAPE 17
ARAWA 19
Namatanai 22
POPONDETTA 22
WAU (Ramu) 24
MAPRIK 29
BUKA (Hutjena) 30
ALOTAU 33
TARI (Ramu) 34
BIALLA 37
KIMBE 42
MUMENG / ZENAG (Ramu) 46
Ramu (GP) 52
KAVIENG 69
KAINANTU (Ramu) 151
WEWAK 169
MADANG (Ramu) 178
GOROKA (Ramu) 205
LAE (Ramu) 337
KOKOPO (Gazelle) 436
LORENGAU 453
PORT MORESBY 795
MT.HAGEN (Ramu) 856
Total 4,100
Preparation of National Electrification Rollout Plan and Financing Prospectus
Data collection and preparation
17
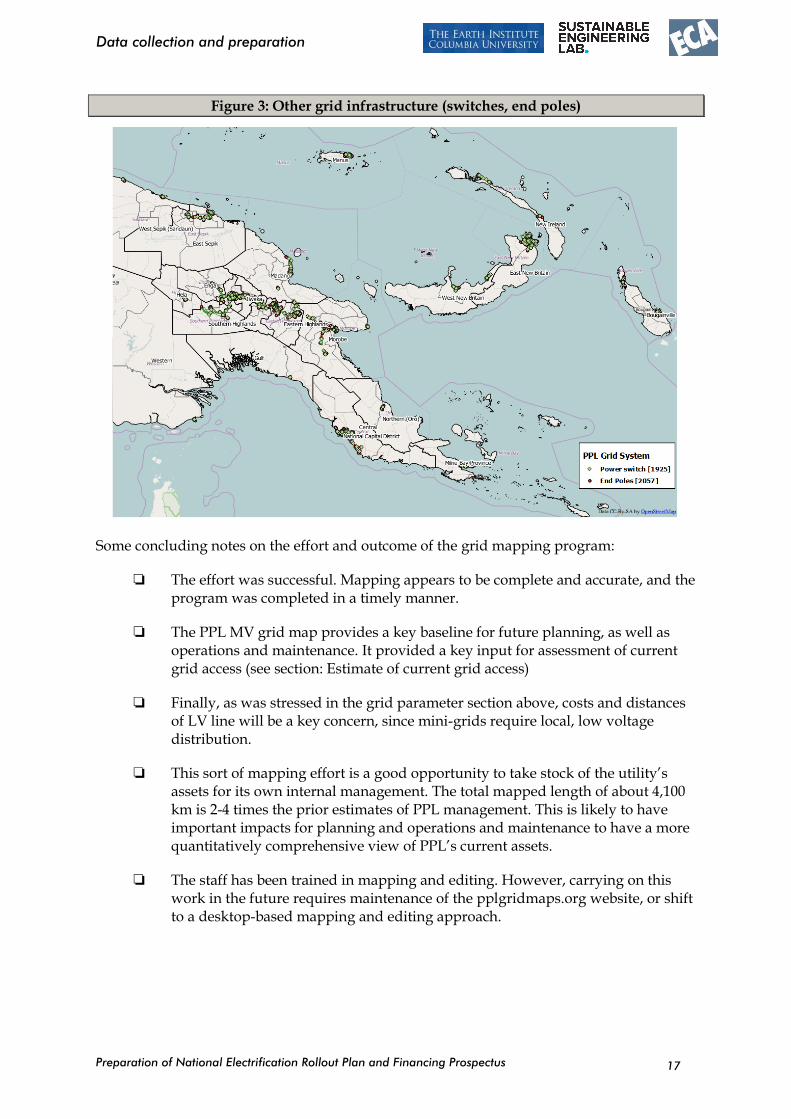
Figure 3: Other grid infrastructure (switches, end poles)
Some concluding notes on the effort and outcome of the grid mapping program:
The effort was successful. Mapping appears to be complete and accurate, and the program was completed in a timely manner.
The PPL MV grid map provides a key baseline for future planning, as well as operations and maintenance. It provided a key input for assessment of current grid access (see section: Estimate of current grid access)
Finally, as was stressed in the grid parameter section above, costs and distances of LV line will be a key concern, since mini-grids require local, low voltage distribution.
This sort of mapping effort is a good opportunity to take stock of the utility’s assets for its own internal management. The total mapped length of about 4,100 km is 2-4 times the prior estimates of PPL management. This is likely to have important impacts for planning and operations and maintenance to have a more quantitatively comprehensive view of PPL’s current assets.
The staff has been trained in mapping and editing. However, carrying on this work in the future requires maintenance of the pplgridmaps.org website, or shift to a desktop-based mapping and editing approach.
Preparation of National Electrification Rollout Plan and Financing Prospectus
Data collection and preparation
18
2.2 Geo-located demands
The most important dataset for geolocated demands was the 2011 Census data obtained from NSO which provided residential demand points in the form of geolocated census units with population. It was noted in the Inception Report that this dataset would need to be cleaned to prepare a standardized national dataset. The key issue with this dataset was the absence of georeferencing coordinates for some of the census units.
2.2.1 Census Unit records (CUs) without clear geolocation information
Of the list of about 27,000 Census Unit (CU) records in the 2011 Census data received from NSO, about 22,000 CUs, representing about 6.2 million people, are geolocated (with latitude and longitude coordinates). However, about 5,000 CU records – representing about 1.04 million people, or about 14% of the total national population – lack geographic coordinates1.On further scrutiny2, about 1,100 of the non-geolocated CU records are urban CUs representing about 187,000 people, or about 3% of the national population. The remaining set of CU records are non-geolocated – representing 850,000 people, or 11% of the national population – are identified as rural locations.
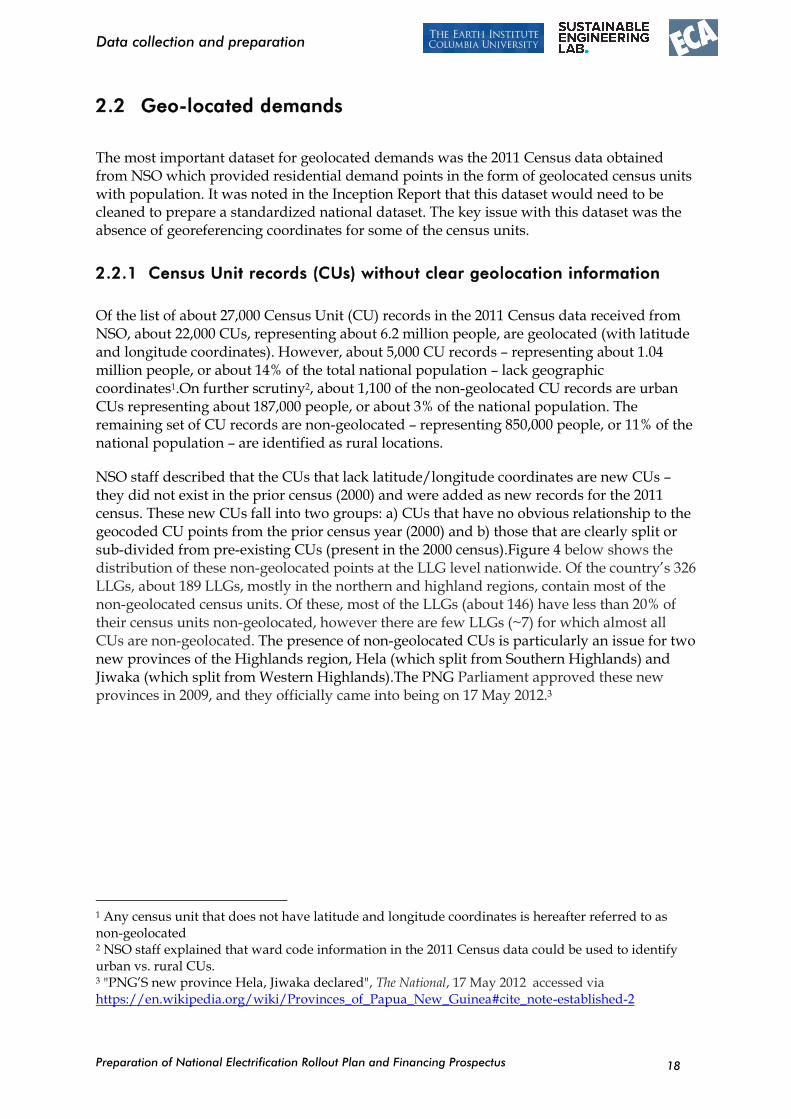
NSO staff described that the CUs that lack latitude/longitude coordinates are new CUs – they did not exist in the prior census (2000) and were added as new records for the 2011 census. These new CUs fall into two groups: a) CUs that have no obvious relationship to the geocoded CU points from the prior census year (2000) and b) those that are clearly split or sub-divided from pre-existing CUs (present in the 2000 census).Figure 4 below shows the distribution of these non-geolocated points at the LLG level nationwide. Of the country’s 326 LLGs, about 189 LLGs, mostly in the northern and highland regions, contain most of the non-geolocated census units. Of these, most of the LLGs (about 146) have less than 20% of their census units non-geolocated, however there are few LLGs (~7) for which almost all CUs are non-geolocated. The presence of non-geolocated CUs is particularly an issue for two new provinces of the Highlands region, Hela (which split from Southern Highlands) and Jiwaka (which split from Western Highlands).The PNG Parliament approved these new provinces in 2009, and they officially came into being on 17 May 2012.3
1 Any census unit that does not have latitude and longitude coordinates is hereafter referred to as non-geolocated 2 NSO staff explained that ward code information in the 2011 Census data could be used to identify urban vs. rural CUs. 3 "PNG’S new province Hela, Jiwaka declared", The National, 17 May 2012 accessed via https://en.wikipedia.org/wiki/Provinces_of_Papua_New_Guinea#cite_note-established-2
Preparation of National Electrification Rollout Plan and Financing Prospectus
Data collection and preparation
19
Figure 4: Non-geolocated CUs at the LLG level (2011 Census)
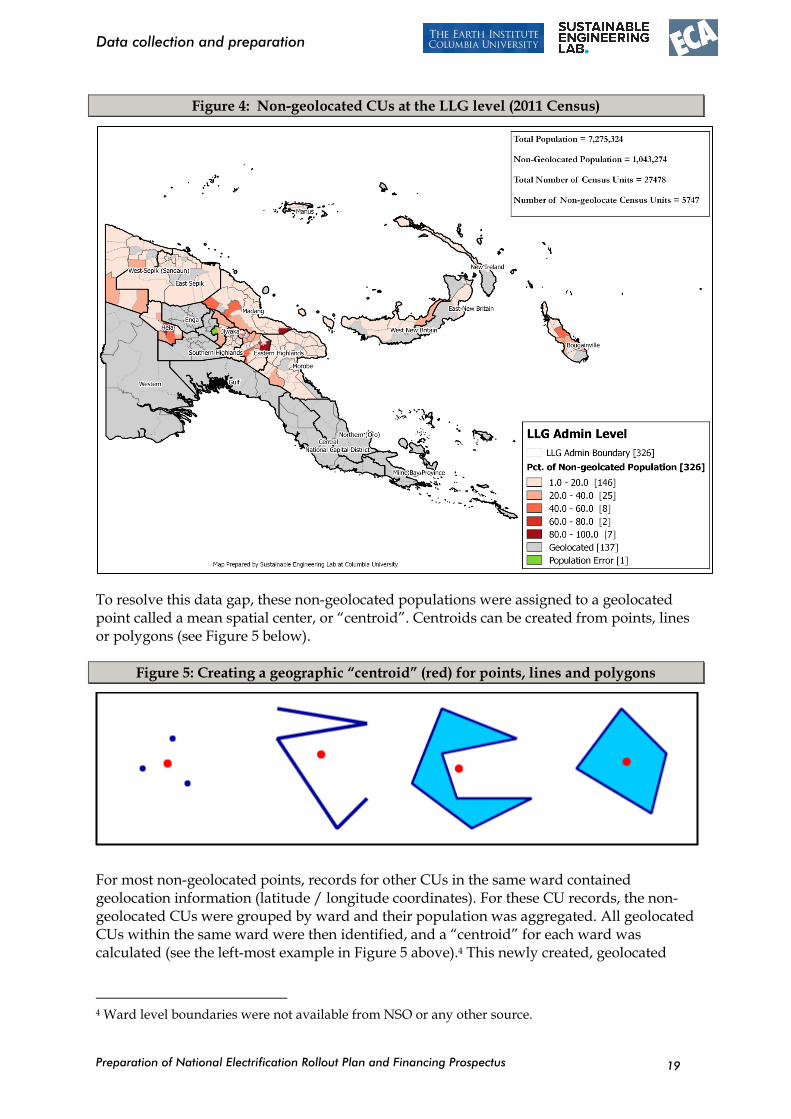
To resolve this data gap, these non-geolocated populations were assigned to a geolocated point called a mean spatial center, or “centroid”. Centroids can be created from points, lines or polygons (see Figure 5 below).
Figure 5: Creating a geographic “centroid” (red) for points, lines and polygons
For most non-geolocated points, records for other CUs in the same ward contained geolocation information (latitude / longitude coordinates). For these CU records, the non-geolocated CUs were grouped by ward and their population was aggregated. All geolocated CUs within the same ward were then identified, and a “centroid” for each ward was calculated (see the left-most example in Figure 5 above).4 This newly created, geolocated
4 Ward level boundaries were not available from NSO or any other source.
Preparation of National Electrification Rollout Plan and Financing Prospectus
Data collection and preparation
20
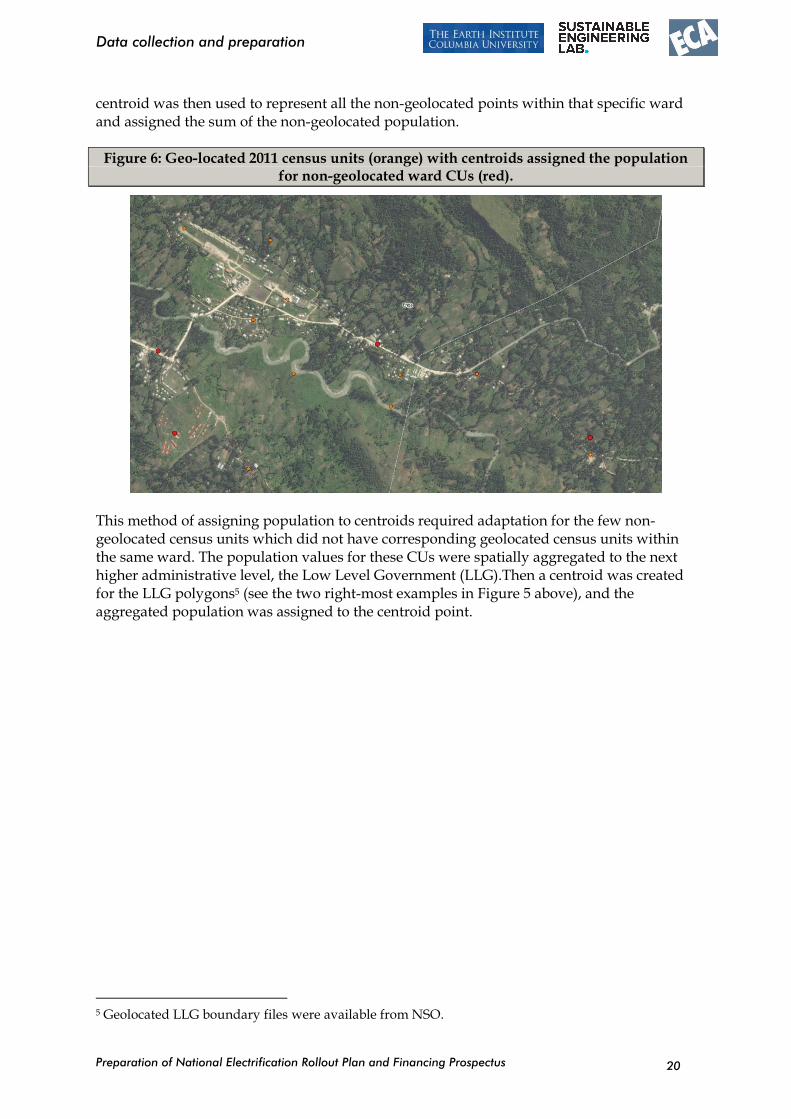
centroid was then used to represent all the non-geolocated points within that specific ward and assigned the sum of the non-geolocated population.
Figure 6: Geo-located 2011 census units (orange) with centroids assigned the population for non-geolocated ward CUs (red).
This method of assigning population to centroids required adaptation for the few non-geolocated census units which did not have corresponding geolocated census units within the same ward. The population values for these CUs were spatially aggregated to the next higher administrative level, the Low Level Government (LLG).Then a centroid was created for the LLG polygons5 (see the two right-most examples in Figure 5 above), and the aggregated population was assigned to the centroid point.
5 Geolocated LLG boundary files were available from NSO.
Preparation of National Electrification Rollout Plan and Financing Prospectus
Data collection and preparation
21
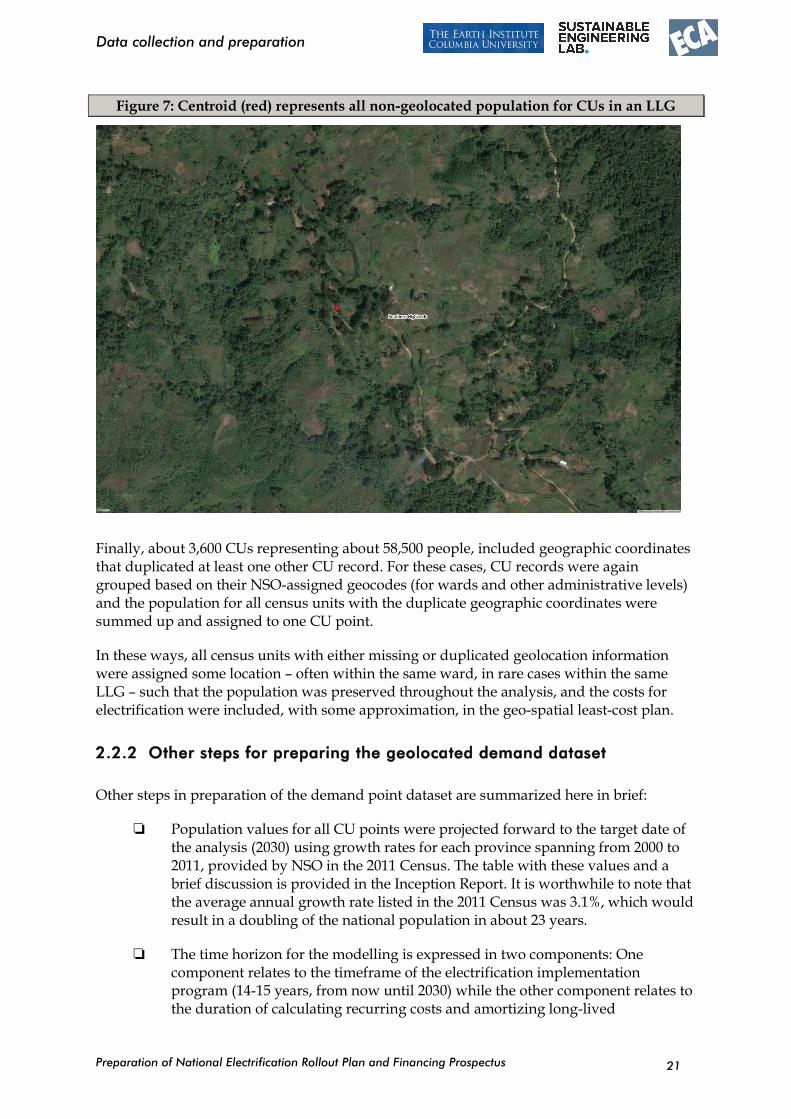
Figure 7: Centroid (red) represents all non-geolocated population for CUs in an LLG
Finally, about 3,600 CUs representing about 58,500 people, included geographic coordinates that duplicated at least one other CU record. For these cases, CU records were again grouped based on their NSO-assigned geocodes (for wards and other administrative levels) and the population for all census units with the duplicate geographic coordinates were summed up and assigned to one CU point.
In these ways, all census units with either missing or duplicated geolocation information were assigned some location – often within the same ward, in rare cases within the same LLG – such that the population was preserved throughout the analysis, and the costs for electrification were included, with some approximation, in the geo-spatial least-cost plan.
2.2.2 Other steps for preparing the geolocated demand dataset
Other steps in preparation of the demand point dataset are summarized here in brief:
Population values for all CU points were projected forward to the target date of the analysis (2030) using growth rates for each province spanning from 2000 to 2011, provided by NSO in the 2011 Census. The table with these values and a brief discussion is provided in the Inception Report. It is worthwhile to note that the average annual growth rate listed in the 2011 Census was 3.1%, which would result in a doubling of the national population in about 23 years.
The time horizon for the modelling is expressed in two components: One component relates to the timeframe of the electrification implementation program (14-15 years, from now until 2030) while the other component relates to the duration of calculating recurring costs and amortizing long-lived
Preparation of National Electrification Rollout Plan and Financing Prospectus
Data collection and preparation
22
infrastructure (such as grid lines). This latter component is typically set at 25-30 years based on international accounting approach for major infrastructure investments. These two are combined under a single time horizon parameter in the model by recalculating the population growth rates to yield the same results in the 30-year amortization time frame that they would in the 2016-2030 timeframe that defines the target year.
2.3 Technical and cost parameters
It is necessary to establish around 75 parameter values for a successful model run. Using the best possible parameters is essential for making realistic cost and technical estimates that will be credible to the utility, private sector, and other development partners. For this reason, as much as possible, these parameters are gathered locally, with the majority of the information coming from PPL itself.6 Others have been obtained from the private sector (primarily from Certway Power) and international comparison. The resulting parameters are listed in Annex A1. The ten “core” parameters presented in Table 2 below are both critical to the overall outcome of the analysis and are also generally applicable to all electrification technologies (grid, mini-grid or off-grid / solar).For roughly half of these “core” parameters, this analysis has assigned a specific value for each location in the dataset, based on geographic data. This data includes growth rates provided by NSO, wealth and poverty data from the World Bank, and other similar sources that provide additional details for how parameters change over the landscape. The key parameters are described in more detail in the following sub-sections.
6 The PPL staff involved in these discussions have been described in the Inception Report.
Preparation of National Electrification Rollout Plan and Financing Prospectus
Data collection and preparation
23
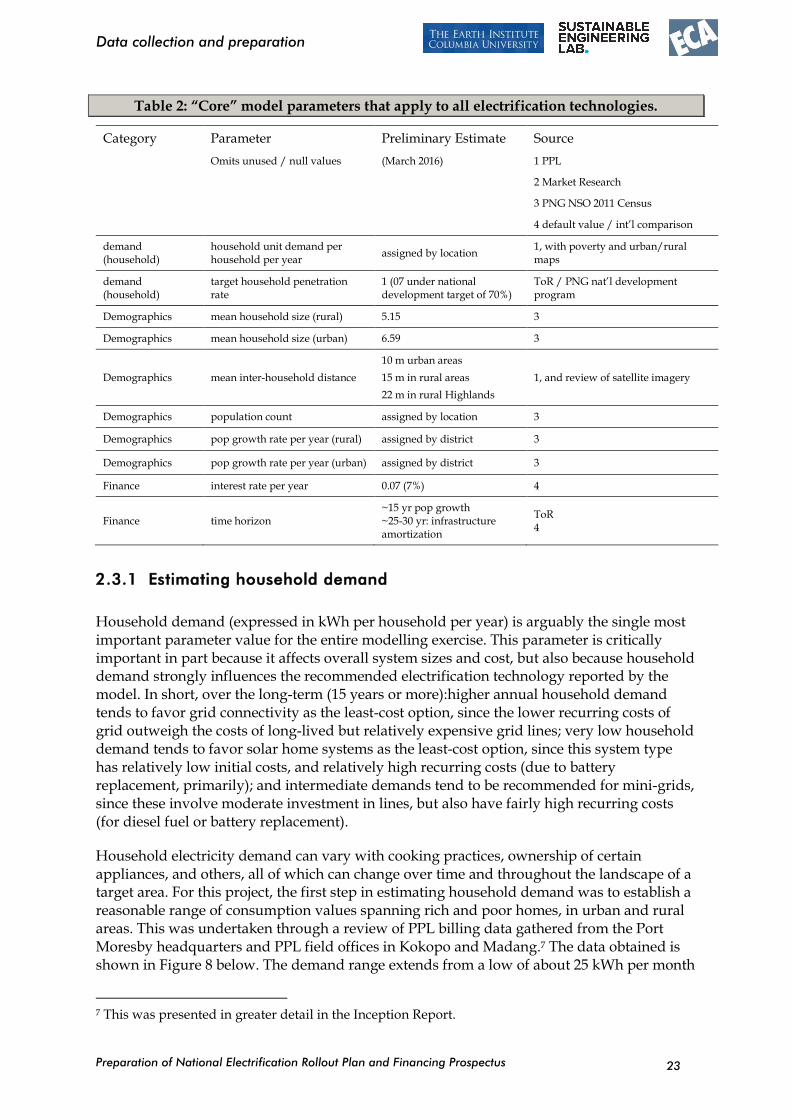
Table 2: “Core” model parameters that apply to all electrification technologies.
Category Parameter Preliminary Estimate Source
Omits unused / null values (March 2016) 1 PPL
2 Market Research
3 PNG NSO 2011 Census
4 default value / int’l comparison
demand (household)
household unit demand per household per year
assigned by location 1, with poverty and urban/rural maps
demand (household)
target household penetration rate
1 (07 under national development target of 70%)
ToR / PNG nat’l development program
Demographics mean household size (rural) 5.15 3
Demographics mean household size (urban) 6.59 3
Demographics mean inter-household distance
10 m urban areas
15 m in rural areas
22 m in rural Highlands
1, and review of satellite imagery
Demographics population count assigned by location 3
Demographics pop growth rate per year (rural) assigned by district 3
Demographics pop growth rate per year (urban) assigned by district 3
Finance interest rate per year 0.07 (7%) 4
Finance time horizon ~15 yr pop growth ~25-30 yr: infrastructure amortization
ToR 4
2.3.1 Estimating household demand
Household demand (expressed in kWh per household per year) is arguably the single most important parameter value for the entire modelling exercise. This parameter is critically important in part because it affects overall system sizes and cost, but also because household demand strongly influences the recommended electrification technology reported by the model. In short, over the long-term (15 years or more):higher annual household demand tends to favor grid connectivity as the least-cost option, since the lower recurring costs of grid outweigh the costs of long-lived but relatively expensive grid lines; very low household demand tends to favor solar home systems as the least-cost option, since this system type has relatively low initial costs, and relatively high recurring costs (due to battery replacement, primarily); and intermediate demands tend to be recommended for mini-grids, since these involve moderate investment in lines, but also have fairly high recurring costs (for diesel fuel or battery replacement).
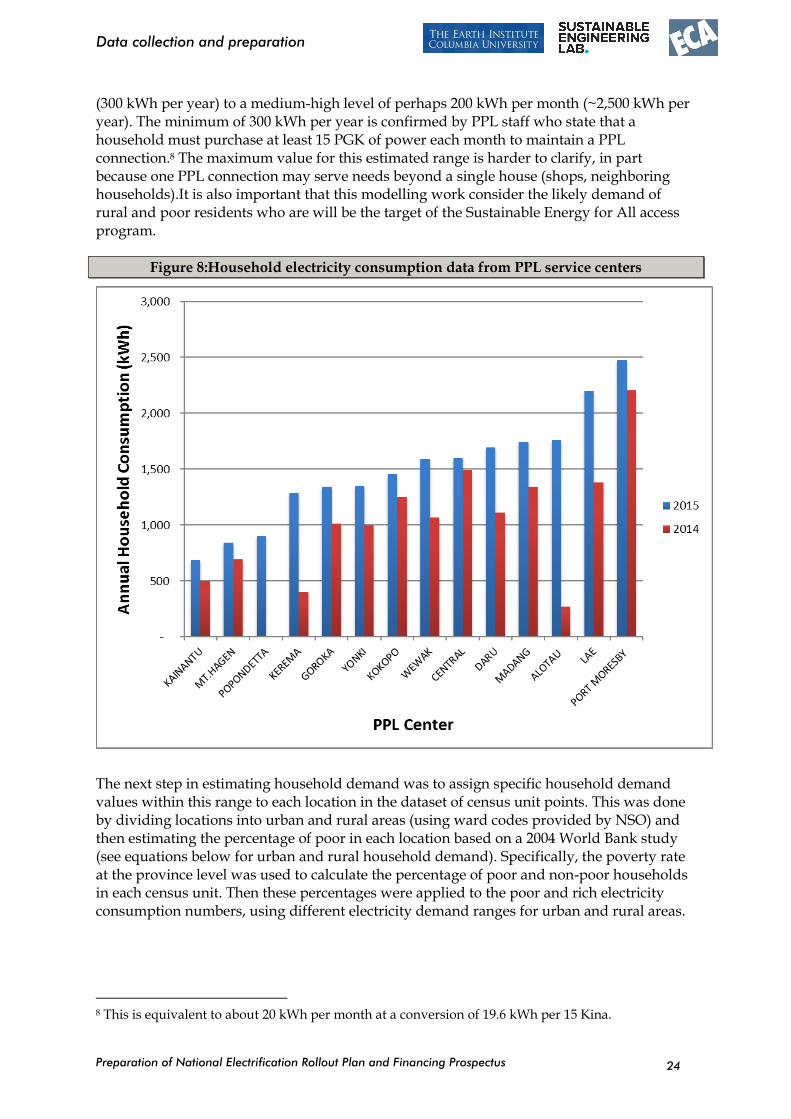
Household electricity demand can vary with cooking practices, ownership of certain appliances, and others, all of which can change over time and throughout the landscape of a target area. For this project, the first step in estimating household demand was to establish a reasonable range of consumption values spanning rich and poor homes, in urban and rural areas. This was undertaken through a review of PPL billing data gathered from the Port Moresby headquarters and PPL field offices in Kokopo and Madang.7 The data obtained is shown in Figure 8 below. The demand range extends from a low of about 25 kWh per month
7 This was presented in greater detail in the Inception Report.
Preparation of National Electrification Rollout Plan and Financing Prospectus
Data collection and preparation
24
(300 kWh per year) to a medium-high level of perhaps 200 kWh per month (~2,500 kWh per year). The minimum of 300 kWh per year is confirmed by PPL staff who state that a household must purchase at least 15 PGK of power each month to maintain a PPL connection.8 The maximum value for this estimated range is harder to clarify, in part because one PPL connection may serve needs beyond a single house (shops, neighboring households).It is also important that this modelling work consider the likely demand of rural and poor residents who are will be the target of the Sustainable Energy for All access program.
Figure 8:Household electricity consumption data from PPL service centers
The next step in estimating household demand was to assign specific household demand values within this range to each location in the dataset of census unit points. This was done by dividing locations into urban and rural areas (using ward codes provided by NSO) and then estimating the percentage of poor in each location based on a 2004 World Bank study (see equations below for urban and rural household demand). Specifically, the poverty rate at the province level was used to calculate the percentage of poor and non-poor households in each census unit. Then these percentages were applied to the poor and rich electricity consumption numbers, using different electricity demand ranges for urban and rural areas.
8 This is equivalent to about 20 kWh per month at a conversion of 19.6 kWh per 15 Kina.
Preparation of National Electrification Rollout Plan and Financing Prospectus
Data collection and preparation
25
𝑼𝒓𝒃𝒂𝒏 𝒂𝒏𝒏𝒖𝒂𝒍 𝒉𝒐𝒖𝒔𝒆𝒉𝒐𝒍𝒅 𝒆𝒍𝒆𝒄𝒕𝒓𝒊𝒄𝒊𝒕𝒚 𝒅𝒆𝒎𝒂𝒏𝒅
=𝑁𝑜𝑛 𝑝𝑜𝑜𝑟 ℎ𝑜𝑢𝑠𝑒ℎ𝑜𝑙𝑑 𝑛𝑢𝑚𝑏𝑒𝑟×2500 + 𝑃𝑜𝑜𝑟 ℎ𝑜𝑢𝑠𝑒ℎ𝑜𝑙𝑑 𝑛𝑢𝑚𝑏𝑒𝑟×1000
𝑁𝑜𝑛 𝑝𝑜𝑜𝑟 ℎ𝑜𝑢𝑠𝑒ℎ𝑜𝑙𝑑 𝑛𝑢𝑚𝑏𝑒𝑟 + 𝑃𝑜𝑜𝑟 ℎ𝑜𝑢𝑠𝑒ℎ𝑜𝑙𝑑 𝑛𝑢𝑚𝑏𝑒𝑟
𝑹𝒖𝒓𝒂𝒍 𝒂𝒏𝒏𝒖𝒂𝒍 𝒉𝒐𝒖𝒔𝒆𝒉𝒐𝒍𝒅 𝒆𝒍𝒆𝒄𝒕𝒓𝒊𝒄𝒊𝒕𝒚 𝒅𝒆𝒎𝒂𝒏𝒅
=𝑁𝑜𝑛 𝑝𝑜𝑜𝑟 ℎ𝑜𝑢𝑠𝑒ℎ𝑜𝑙𝑑 𝑛𝑢𝑚𝑏𝑒𝑟×1000 + 𝑃𝑜𝑜𝑟 ℎ𝑜𝑢𝑠𝑒ℎ𝑜𝑙𝑑 𝑛𝑢𝑚𝑏𝑒𝑟×300
𝑁𝑜𝑛 𝑝𝑜𝑜𝑟 ℎ𝑜𝑢𝑠𝑒ℎ𝑜𝑙𝑑 𝑛𝑢𝑚𝑏𝑒𝑟 + 𝑃𝑜𝑜𝑟 ℎ𝑜𝑢𝑠𝑒ℎ𝑜𝑙𝑑 𝑛𝑢𝑚𝑏𝑒𝑟
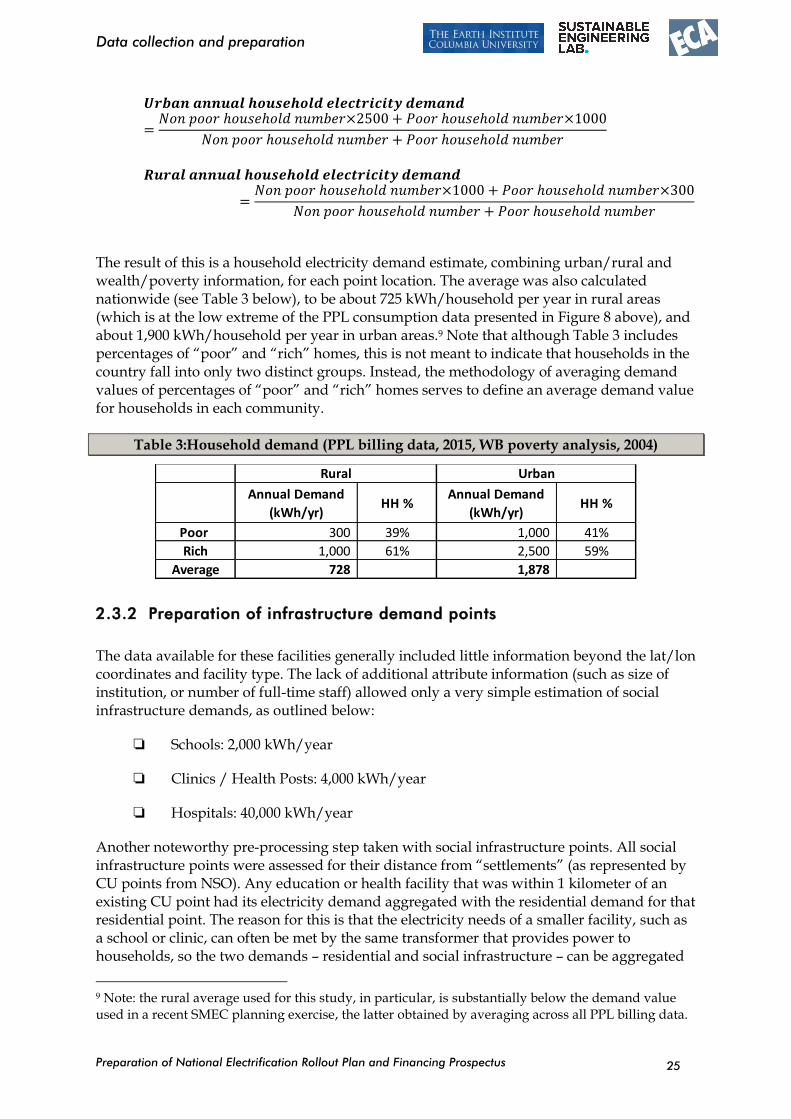
The result of this is a household electricity demand estimate, combining urban/rural and wealth/poverty information, for each point location. The average was also calculated nationwide (see Table 3 below), to be about 725 kWh/household per year in rural areas (which is at the low extreme of the PPL consumption data presented in Figure 8 above), and about 1,900 kWh/household per year in urban areas.9 Note that although Table 3 includes percentages of “poor” and “rich” homes, this is not meant to indicate that households in the country fall into only two distinct groups. Instead, the methodology of averaging demand values of percentages of “poor” and “rich” homes serves to define an average demand value for households in each community.
Table 3:Household demand (PPL billing data, 2015, WB poverty analysis, 2004)
2.3.2 Preparation of infrastructure demand points
The data available for these facilities generally included little information beyond the lat/lon coordinates and facility type. The lack of additional attribute information (such as size of institution, or number of full-time staff) allowed only a very simple estimation of social infrastructure demands, as outlined below:
Schools: 2,000 kWh/year
Clinics / Health Posts: 4,000 kWh/year
Hospitals: 40,000 kWh/year
Another noteworthy pre-processing step taken with social infrastructure points. All social infrastructure points were assessed for their distance from “settlements” (as represented by CU points from NSO). Any education or health facility that was within 1 kilometer of an existing CU point had its electricity demand aggregated with the residential demand for that residential point. The reason for this is that the electricity needs of a smaller facility, such as a school or clinic, can often be met by the same transformer that provides power to households, so the two demands – residential and social infrastructure – can be aggregated
9 Note: the rural average used for this study, in particular, is substantially below the demand value used in a recent SMEC planning exercise, the latter obtained by averaging across all PPL billing data.
Annual Demand
(kWh/yr)HH %
Annual Demand
(kWh/yr)HH %
Poor 300 39% 1,000 41%
Rich 1,000 61% 2,500 59%
Average 728 1,878
Rural Urban
Preparation of National Electrification Rollout Plan and Financing Prospectus
Data collection and preparation
26
at the location of the residential point. However, education and health facilities located more than 1 km from a CU point lie outside of the reported range (from PPL) of low voltage line connections to a transformer, and so were preserved as independent points in the dataset, distinct from residential locations. As results of modelling will later show, the vast majority of solar systems recommended by the model target these facilities.10
2.3.3 Cost and technical parameters for the grid distribution network
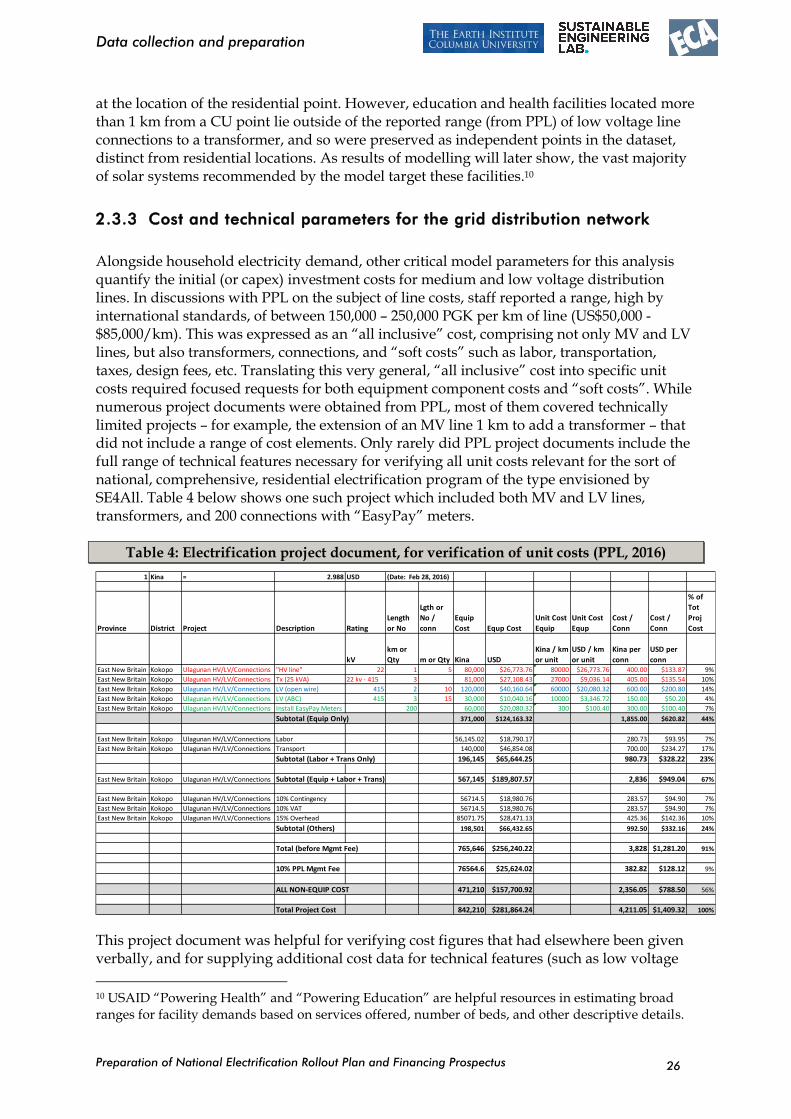
Alongside household electricity demand, other critical model parameters for this analysis quantify the initial (or capex) investment costs for medium and low voltage distribution lines. In discussions with PPL on the subject of line costs, staff reported a range, high by international standards, of between 150,000 – 250,000 PGK per km of line (US$50,000 - $85,000/km). This was expressed as an “all inclusive” cost, comprising not only MV and LV lines, but also transformers, connections, and “soft costs” such as labor, transportation, taxes, design fees, etc. Translating this very general, “all inclusive” cost into specific unit costs required focused requests for both equipment component costs and “soft costs”. While numerous project documents were obtained from PPL, most of them covered technically limited projects – for example, the extension of an MV line 1 km to add a transformer – that did not include a range of cost elements. Only rarely did PPL project documents include the full range of technical features necessary for verifying all unit costs relevant for the sort of national, comprehensive, residential electrification program of the type envisioned by SE4All. Table 4 below shows one such project which included both MV and LV lines, transformers, and 200 connections with “EasyPay” meters.
Table 4: Electrification project document, for verification of unit costs (PPL, 2016)
This project document was helpful for verifying cost figures that had elsewhere been given verbally, and for supplying additional cost data for technical features (such as low voltage
10 USAID “Powering Health” and “Powering Education” are helpful resources in estimating broad ranges for facility demands based on services offered, number of beds, and other descriptive details.
1 Kina = 2.988 USD (Date: Feb 28, 2016)
Province District Project Description Rating
Length
or No
Lgth or
No /
conn
Equip
Cost Equp Cost
Unit Cost
Equip
Unit Cost
Equp
Cost /
Conn
Cost /
Conn
% of
Tot
Proj
Cost
kV
km or
Qty m or Qty Kina USD
Kina / km
or unit
USD / km
or unit
Kina per
conn
USD per
connEast New Britain Kokopo Ulagunan HV/LV/Connections "HV line" 22 1 5 80,000 $26,773.76 80000 $26,773.76 400.00 $133.87 9%
East New Britain Kokopo Ulagunan HV/LV/Connections Tx (25 kVA) 22 kv - 415 3 81,000 $27,108.43 27000 $9,036.14 405.00 $135.54 10%
East New Britain Kokopo Ulagunan HV/LV/Connections LV (open wire) 415 2 10 120,000 $40,160.64 60000 $20,080.32 600.00 $200.80 14%
East New Britain Kokopo Ulagunan HV/LV/Connections LV (ABC) 415 3 15 30,000 $10,040.16 10000 $3,346.72 150.00 $50.20 4%
East New Britain Kokopo Ulagunan HV/LV/Connections Install EasyPay Meters 200 60,000 $20,080.32 300 $100.40 300.00 $100.40 7%
Subtotal (Equip Only) 371,000 $124,163.32 1,855.00 $620.82 44%
East New Britain Kokopo Ulagunan HV/LV/Connections Labor 56,145.02 $18,790.17 280.73 $93.95 7%
East New Britain Kokopo Ulagunan HV/LV/Connections Transport 140,000 $46,854.08 700.00 $234.27 17%
Subtotal (Labor + Trans Only) 196,145 $65,644.25 980.73 $328.22 23%
East New Britain Kokopo Ulagunan HV/LV/Connections Subtotal (Equip + Labor + Trans) 567,145 $189,807.57 2,836 $949.04 67%
East New Britain Kokopo Ulagunan HV/LV/Connections 10% Contingency 56714.5 $18,980.76 283.57 $94.90 7%
East New Britain Kokopo Ulagunan HV/LV/Connections 10% VAT 56714.5 $18,980.76 283.57 $94.90 7%
East New Britain Kokopo Ulagunan HV/LV/Connections 15% Overhead 85071.75 $28,471.13 425.36 $142.36 10%
Subtotal (Others) 198,501 $66,432.65 992.50 $332.16 24%
Total (before Mgmt Fee) 765,646 $256,240.22 3,828 $1,281.20 91%
10% PPL Mgmt Fee 76564.6 $25,624.02 382.82 $128.12 9%
ALL NON-EQUIP COST 471,210 $157,700.92 2,356.05 $788.50 56%
Total Project Cost 842,210 $281,864.24 4,211.05 $1,409.32 100%
Preparation of National Electrification Rollout Plan and Financing Prospectus
Data collection and preparation
27
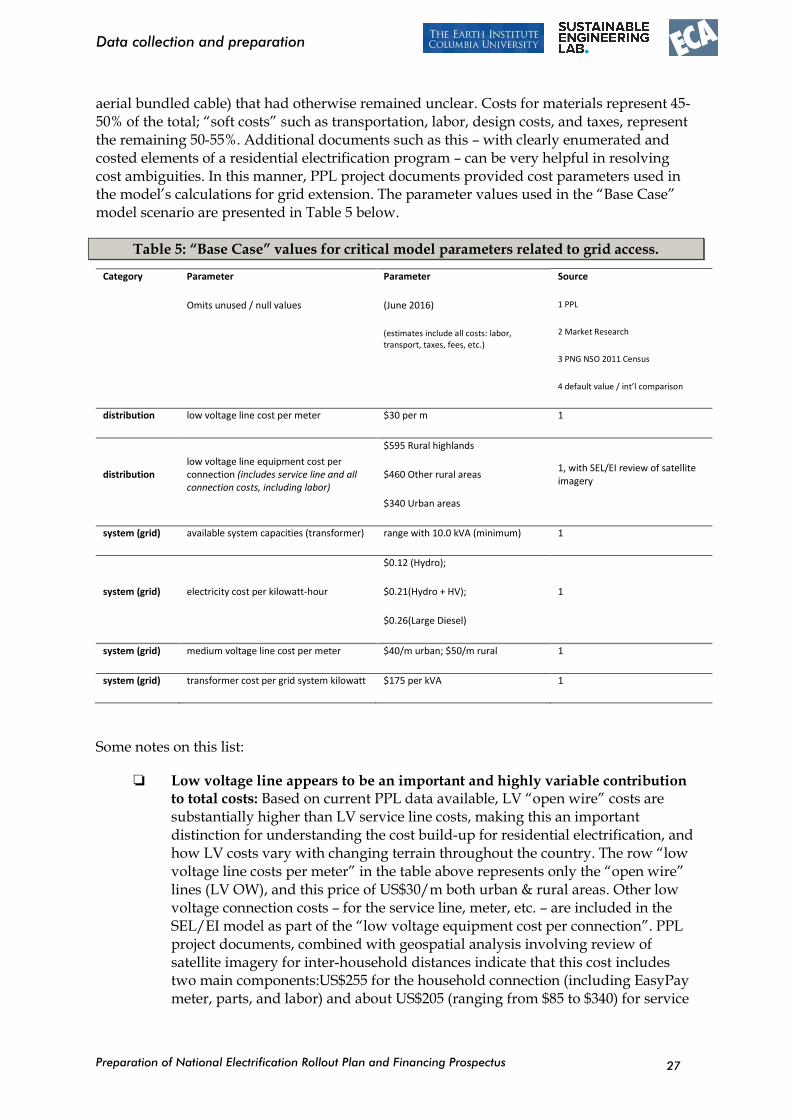
aerial bundled cable) that had otherwise remained unclear. Costs for materials represent 45-50% of the total; “soft costs” such as transportation, labor, design costs, and taxes, represent the remaining 50-55%. Additional documents such as this – with clearly enumerated and costed elements of a residential electrification program – can be very helpful in resolving cost ambiguities. In this manner, PPL project documents provided cost parameters used in the model’s calculations for grid extension. The parameter values used in the “Base Case” model scenario are presented in Table 5 below.
Table 5: “Base Case” values for critical model parameters related to grid access.
Category Parameter
Omits unused / null values
Parameter
(June 2016)
(estimates include all costs: labor, transport, taxes, fees, etc.)
Source
1 PPL
2 Market Research
3 PNG NSO 2011 Census
4 default value / int’l comparison
distribution low voltage line cost per meter $30 per m 1
distribution low voltage line equipment cost per connection (includes service line and all connection costs, including labor)
$595 Rural highlands
$460 Other rural areas
$340 Urban areas
1, with SEL/EI review of satellite imagery
system (grid) available system capacities (transformer) range with 10.0 kVA (minimum) 1
system (grid) electricity cost per kilowatt-hour
$0.12 (Hydro);
$0.21(Hydro + HV);
$0.26(Large Diesel)
1
system (grid) medium voltage line cost per meter $40/m urban; $50/m rural 1
system (grid) transformer cost per grid system kilowatt $175 per kVA 1
Some notes on this list:
Low voltage line appears to be an important and highly variable contribution to total costs: Based on current PPL data available, LV “open wire” costs are substantially higher than LV service line costs, making this an important distinction for understanding the cost build-up for residential electrification, and how LV costs vary with changing terrain throughout the country. The row “low voltage line costs per meter” in the table above represents only the “open wire” lines (LV OW), and this price of US$30/m both urban & rural areas. Other low voltage connection costs – for the service line, meter, etc. – are included in the SEL/EI model as part of the “low voltage equipment cost per connection”. PPL project documents, combined with geospatial analysis involving review of satellite imagery for inter-household distances indicate that this cost includes two main components:US$255 for the household connection (including EasyPay meter, parts, and labor) and about US$205 (ranging from $85 to $340) for service
Preparation of National Electrification Rollout Plan and Financing Prospectus
Data collection and preparation
28
line. The ranges in these costs are generally due to large variations in household spacing over the national landscape. An attempt to quantify this variation is described in Assessment of Inter-Household Distance .
While materials costs are in the upper range of international reference values, an additional 50-55% due to soft costs places the PNG unit costs well beyond many other countries, suggesting potential to reduce overall costs.
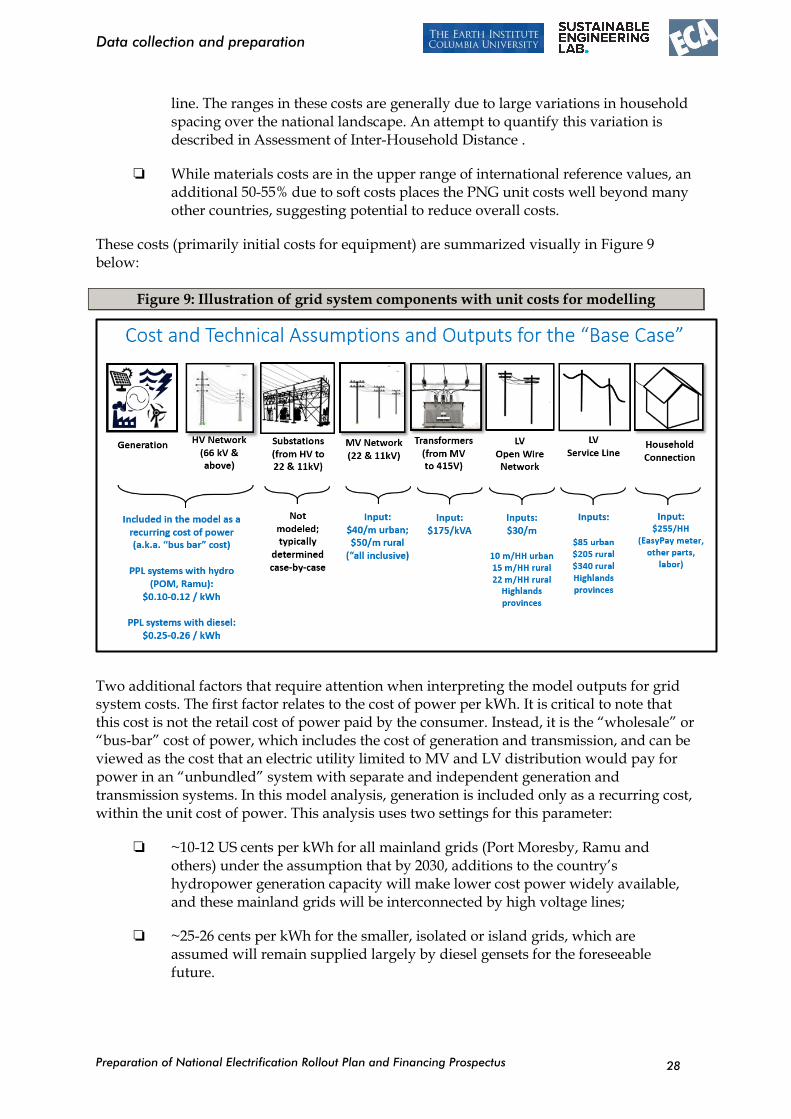
These costs (primarily initial costs for equipment) are summarized visually in Figure 9 below:
Figure 9: Illustration of grid system components with unit costs for modelling
Two additional factors that require attention when interpreting the model outputs for grid system costs. The first factor relates to the cost of power per kWh. It is critical to note that this cost is not the retail cost of power paid by the consumer. Instead, it is the “wholesale” or “bus-bar” cost of power, which includes the cost of generation and transmission, and can be viewed as the cost that an electric utility limited to MV and LV distribution would pay for power in an “unbundled” system with separate and independent generation and transmission systems. In this model analysis, generation is included only as a recurring cost, within the unit cost of power. This analysis uses two settings for this parameter:
~10-12 US cents per kWh for all mainland grids (Port Moresby, Ramu and others) under the assumption that by 2030, additions to the country’s hydropower generation capacity will make lower cost power widely available, and these mainland grids will be interconnected by high voltage lines;
~25-26 cents per kWh for the smaller, isolated or island grids, which are assumed will remain supplied largely by diesel gensets for the foreseeable future.
Preparation of National Electrification Rollout Plan and Financing Prospectus
Data collection and preparation
29
The assumption that the cost of power will be low (roughly on par with the Port Moresby and Ramu grids today) throughout the entire “mainland” area requires some explanation. Given that several systems on the PNG mainland now operate under diesel power, this assumption requires addition of high voltage transmission lines to interconnect lower cost generation (such as hydro) with areas that currently rely on diesel. This has been discussed with DPE and PPL, and found to be realistic, both because PNG has energy resources that offer lower cost generation and because a case can be made for cost-effective HV extensions of the distances required (typically 100-150 km) for many of the demand centers in PNG, once population growth is included. (The latter option, HV extensions, is discussed in more detail in the sub-section Final results for the “Base Case”.)
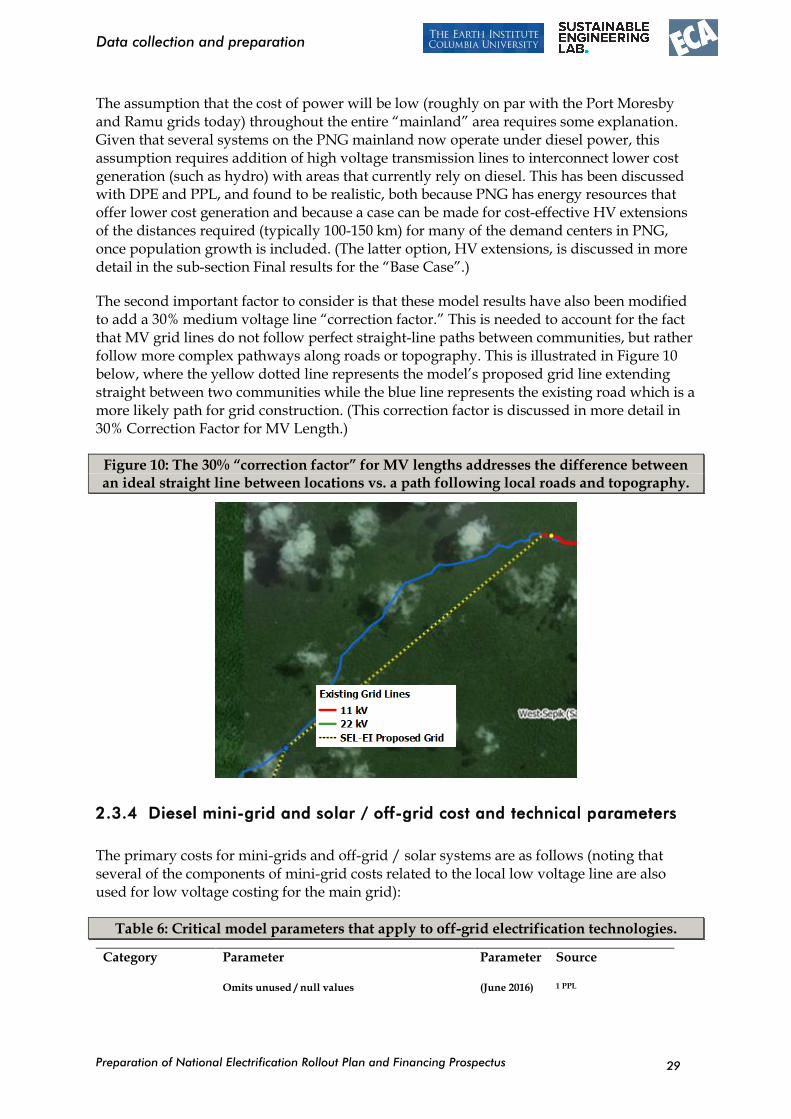
The second important factor to consider is that these model results have also been modified to add a 30% medium voltage line “correction factor.” This is needed to account for the fact that MV grid lines do not follow perfect straight-line paths between communities, but rather follow more complex pathways along roads or topography. This is illustrated in Figure 10 below, where the yellow dotted line represents the model’s proposed grid line extending straight between two communities while the blue line represents the existing road which is a more likely path for grid construction. (This correction factor is discussed in more detail in 30% Correction Factor for MV Length.)
Figure 10: The 30% “correction factor” for MV lengths addresses the difference between an ideal straight line between locations vs. a path following local roads and topography.
2.3.4 Diesel mini-grid and solar / off-grid cost and technical parameters
The primary costs for mini-grids and off-grid / solar systems are as follows (noting that several of the components of mini-grid costs related to the local low voltage line are also used for low voltage costing for the main grid):
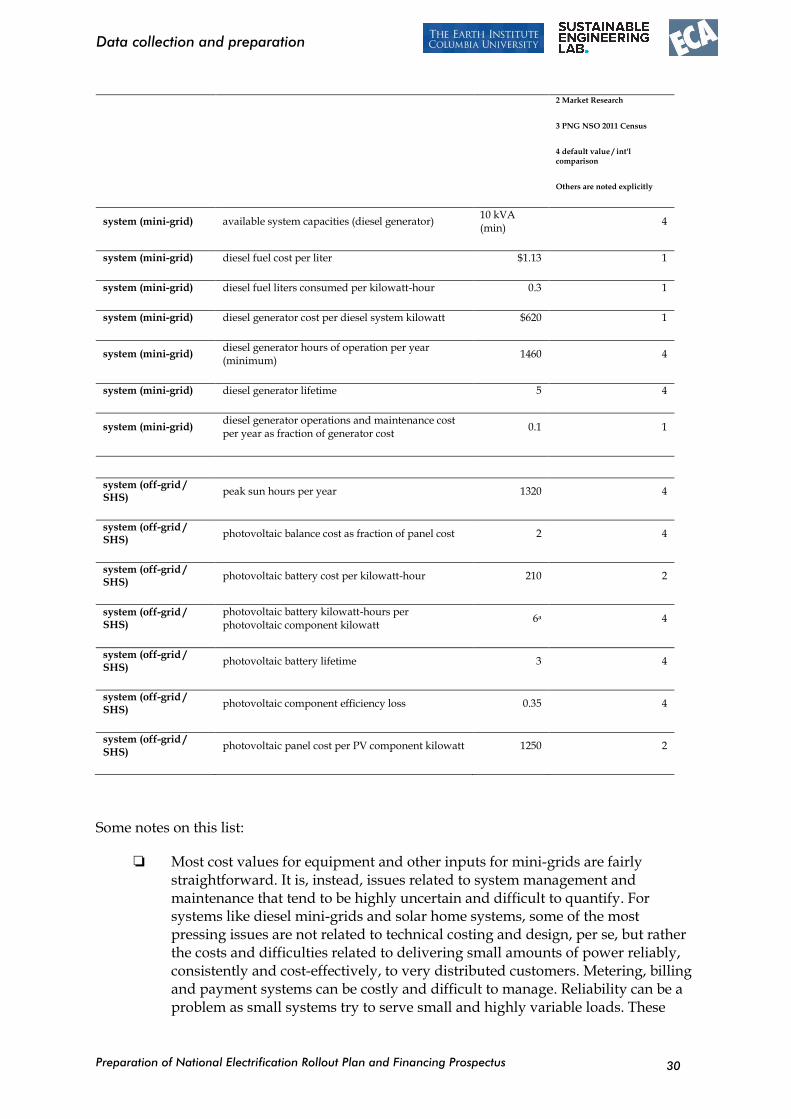
Table 6: Critical model parameters that apply to off-grid electrification technologies.
Category Parameter
Omits unused / null values
Parameter
(June 2016)
Source
1 PPL
Preparation of National Electrification Rollout Plan and Financing Prospectus
Data collection and preparation
30
2 Market Research
3 PNG NSO 2011 Census
4 default value / int'l comparison
Others are noted explicitly
system (mini-grid) available system capacities (diesel generator) 10 kVA (min)
4
system (mini-grid) diesel fuel cost per liter $1.13 1
system (mini-grid) diesel fuel liters consumed per kilowatt-hour 0.3 1
system (mini-grid) diesel generator cost per diesel system kilowatt $620 1
system (mini-grid) diesel generator hours of operation per year (minimum)
1460 4
system (mini-grid) diesel generator lifetime 5 4
system (mini-grid) diesel generator operations and maintenance cost per year as fraction of generator cost
0.1 1
system (off-grid / SHS)
peak sun hours per year 1320 4
system (off-grid / SHS)
photovoltaic balance cost as fraction of panel cost 2 4
system (off-grid / SHS)
photovoltaic battery cost per kilowatt-hour 210 2
system (off-grid / SHS)
photovoltaic battery kilowatt-hours per photovoltaic component kilowatt
6a 4
system (off-grid / SHS)
photovoltaic battery lifetime 3 4
system (off-grid / SHS)
photovoltaic component efficiency loss 0.35 4
system (off-grid / SHS)
photovoltaic panel cost per PV component kilowatt 1250 2
Some notes on this list:
Most cost values for equipment and other inputs for mini-grids are fairly straightforward. It is, instead, issues related to system management and maintenance that tend to be highly uncertain and difficult to quantify. For systems like diesel mini-grids and solar home systems, some of the most pressing issues are not related to technical costing and design, per se, but rather the costs and difficulties related to delivering small amounts of power reliably, consistently and cost-effectively, to very distributed customers. Metering, billing and payment systems can be costly and difficult to manage. Reliability can be a problem as small systems try to serve small and highly variable loads. These
Preparation of National Electrification Rollout Plan and Financing Prospectus
Data collection and preparation
31
factors hinder cost-recovery, and management in general, as PNG has experienced in the past with rural and distributed electrification programs such as the C-systems. Nonetheless, mini-grid and off-grid / solar systems are likely to play a role in PNG due to the highly distributed population, rough terrain, and other challenges to grid extension.
Parameters that have a strong impact on recurring costs tend to be particularly important for non-grid systems, such as cost of diesel fuel, and the cost and lifespan of batteries for solar systems.
A key parameter is the minimum size of diesel genset that the model will assign to a mini-grid. In these model runs, this has been set at 10 kVA. This is important, since it sets a sort of “threshold” value – simply operating a 10 kVA generator for a minimum of 4 hours per day requires a certain number of homes to be cost-effective, probably 50 or more.
Finally, as was stressed in the grid parameter section above, costs and distances of LV line will be a key concern, since mini-grids require local, low voltage distribution.
Preparation of National Electrification Rollout Plan and Financing Prospectus
Data collection and preparation
32
2.4 The need for a geospatial planning platform
Looking ahead to implementation of NEROP, it is crucial to recognize the needs that a multi-year, large-scale electrification roll-out plan will require for ongoing planning, tracking of implementation and assessing progress toward access goals.
First, a key purpose of this consultancy has been to develop capacity locally for ongoing planning. Although the national plan has been completed by this consultancy, it is strongly recommended that local planners – working within Papua New Guinea with access to local data sources – continue this quantitative, long-term, least-cost geospatial planning. Over the 15-year timeframe of NEROP, data sources are virtually certain to change and hopefully will improve. Much like the mapping of PPL’s distribution infrastructure helped with this planning effort, an inventory of key commercial or social infrastructure demand points – including schools, clinics, markets, and industrial sites -- could improve the specificity and detail for this plan. Also, the national plan will need to be localized, yielding more precise results for each province, district or even LLG. Finally, plans will need to be reassessed as more becomes known about electricity demand in households, communities and non-residential locations. Experience from several countries shows that the first, national-scale plan created by international consultants is only the first step in a multi-year, nationwide effort which can be improved the more it is localized and refined.
Second, important new data capacities will need to be added within DPE and/or PPL to monitor and evaluate the implementation of the roll-out program. Thousands of kilometers of new grid lines will need to be mapped, and their status (under construction, completed, energized, etc.) will need to be tracked. Access rates within communities – which have been estimated in this report (see following section Estimate of current grid access) – will need to be quantified more precisely in the near term, and monitored annually over the medium to long term, to continually gauge progress toward universal access. Locations planned for grid vs. off-grid systems will need to be identified, and information will need to be shared, to avoid conflicting or duplicative project implementation and waste of funds. Finally, DPE and PPL will benefit from careful monitoring of the costs, speed of implementation, and other factors related to a multi-billion-dollar grid and off-grid roll-out program.
All of these needs can be met by a geospatial planning platform which is established with international assistance, but transferred to local practitioners for use and maintenance, as needed. Such a system combines maps and tabular outputs to capture the status of electricity access throughout the country, the progress towards universal access, and location, capacity, type and cost of electricity equipment as it is planned, procured and installed. It is estimated that such a system will require two teams working in parallel – one team of about 4 international consultants, working for 2 years to establish, train and transfer the system for local use; and another team of about 4 local workers who will over 3 years help develop the system, manage it locally, and use it to track and report on electrification progress over the span of NEROP. The total cost for these two teams, over 2-3 years is estimated at about US$4.5 million (see Table 28, on page 98; and Table 29, page 104).
Preparation of National Electrification Rollout Plan and Financing Prospectus
Estimate of current grid access
33
3 Estimate of current grid access
Grid Access was estimated using a combination of PPL data, geospatial queries performed by SEL using NSO and PPL grid data, as well as other sources.
PPL billing data provided information for the total number of residential customers (sum of domestic customers using old analog meters and new “EasyPay” meters).
The average of 2014 and 2015 totals is about ~90,000 customers
~90,000 households x 5.15 people per household = ~460,000 people nationally.
By this calculation, at least ~6.4% of the national population has a formal PPL connection which is documented within the utility’s billing records. Note that the PPL data has substantial uncertainty. For example, the data reports residential connections within each of the utility’s nearly 30 separate grid systems. The PPL data lists only 1 residential customer for the entire system of Arawa, which seems extremely unlikely. Other systems have similarly suspect data.11
Other sources (WB, HIES) provide total national electricity access rate of 12-13%. If this figure is correct, it suggests that for every documented and official PPL residential account, there is another that is note documented within PPL’s records.
SEL performed a geospatial query to determine that about 19-20% of the NSO census units fall within 1 km of the MV grid transformers. It is estimated that, for the other ~80-82% of the national population, the following are true:
these communities lack grid access;
they are greater than 1 km from a PPL transformer;
connecting them to the grid requires some addition of transformers and/or MV lines
These three bolded points above are summarized in Table 7 below, which also provides a 2030 population estimate:
11 PPL confirmed that these billing records need to be checked and updated (discussions, June 2016).
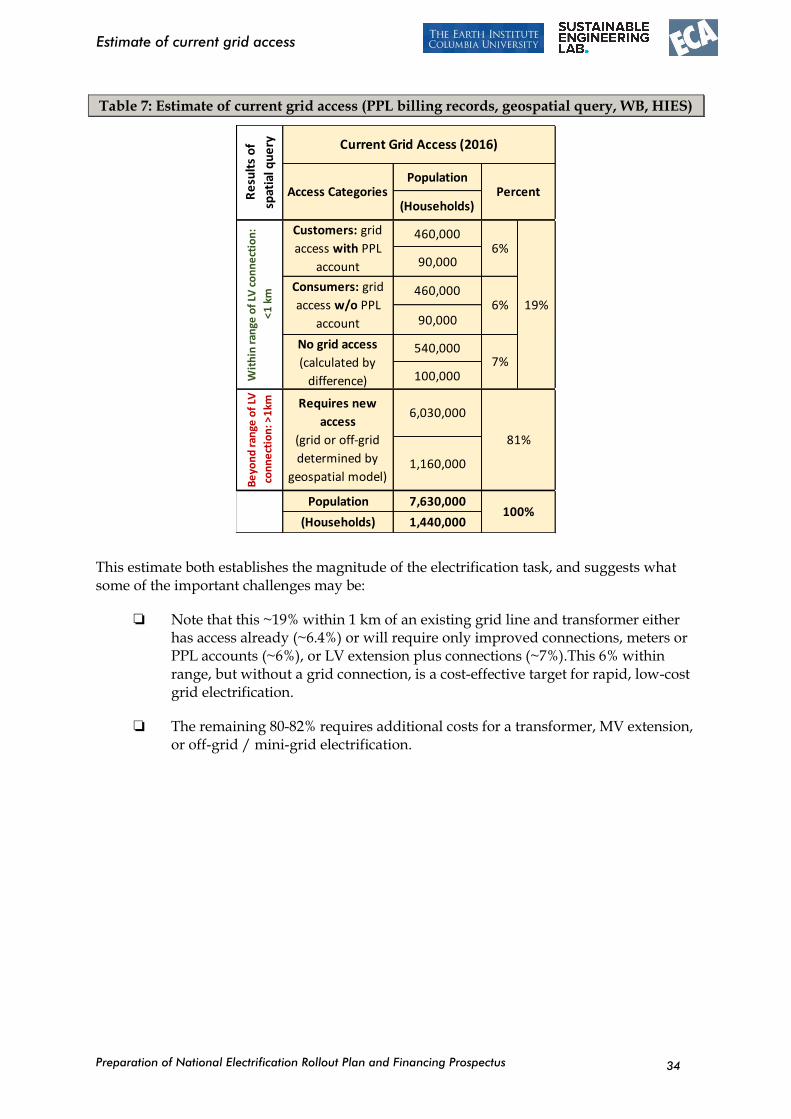
Preparation of National Electrification Rollout Plan and Financing Prospectus
Estimate of current grid access
34
Table 7: Estimate of current grid access (PPL billing records, geospatial query, WB, HIES)
This estimate both establishes the magnitude of the electrification task, and suggests what some of the important challenges may be:
Note that this ~19% within 1 km of an existing grid line and transformer either has access already (~6.4%) or will require only improved connections, meters or PPL accounts (~6%), or LV extension plus connections (~7%).This 6% within range, but without a grid connection, is a cost-effective target for rapid, low-cost grid electrification.
The remaining 80-82% requires additional costs for a transformer, MV extension, or off-grid / mini-grid electrification.
Population
(Households)
460,000
90,000
460,000
90,000
540,000
100,000
Population 7,630,000
(Households) 1,440,000100%
Be
yon
d r
ange
of
LV
con
ne
ctio
n: >
1km Requires new
access
(grid or off-grid
determined by
geospatial model)
6,030,000
81%
1,160,000
Consumers: grid
access w/o PPL
account
6%
No grid access
(calculated by
difference)
7%
Wit
hin
ran
ge o
f LV
co
nn
ect
ion
:
<1
km
Customers: grid
access with PPL
account
6%
19%
Re
sult
s o
f
spat
ial q
ue
ry Current Grid Access (2016)
Access Categories Percent
Preparation of National Electrification Rollout Plan and Financing Prospectus
Final Model Results
35
4 Final Model Results
Based on the input data described above – demand points for settlements and social infrastructure, existing MV distribution lines and equipment, and numerous cost and technical parameters – the SEL/EI team performed multiple modelling scenario runs. Most of the results described in this document are based on set “best guess” model parameters with a reduction of approximately 40% on overall unit costs for grid extension compared to PPL’s current costs. Other scenarios were run, both a “high cost” scenario representing grid costs from recent implementation (see next section, p. 46), as well as smaller changes in a sensitivity analyses (see Appendix, p. 192). While all scenarios favor grid extension as the least cost option for most of the country’s population, the geographic scope and cost of such a program varies based on assumptions.
A few notes before more detailed look at the model results:
Note that outputs of this analysis are intended as an estimate of the overall investments required to achieve 100% electrification nationally over a minimum timespan of 15-years for the NEROP program. They are meant to guide investment planning, budgeting, and discussions among various development partners who are contributing to broad national electrification planning. As such, these results are not a detailed engineering design, nor a year-by-year construction plan. Detailed and specific designs and implementation plans will necessarily be a product of subsequent investment analyses, engineering design work, and budgeting and policy planning steps that are beyond the scope of this study.
Recognizing that PNG’s goal under NEROP is to achieve 70% electrification by 2030, the results of this geospatial least cost plan nonetheless describe investments needed to achieve 100% electrification. This is in order to quantify the most cost-effective means of electrifying the whole country, to providing the most complete dataset possible, which can then serve as a basis for selecting 70% to cover under a more specific, time-bound plan. The adjustments related to the 70% target are mentioned where appropriate in the geospatial sections of this paper, and this subject is discussed in more detail in the sections related to the investment prospectus.
These model results present least-cost electrification plans for the population that must be reached by “intensification” of the grid network (mostly low voltage connections near existing grid infrastructure), extension of the grid network (including substantial medium voltage line construction to span distances between communities), or through non-grid electrification options (mini-grids or off-grid / solar systems). Recall that about 6.4% of the country’s population already has grid access according to PPL records, and another significant fraction (perhaps 12-13%) reside within 1 km of the existing grid system. This latter group is therefore likely to receive electricity access in the earliest phase of NEROP through a combination of improved connections and lower cost LV intensification.
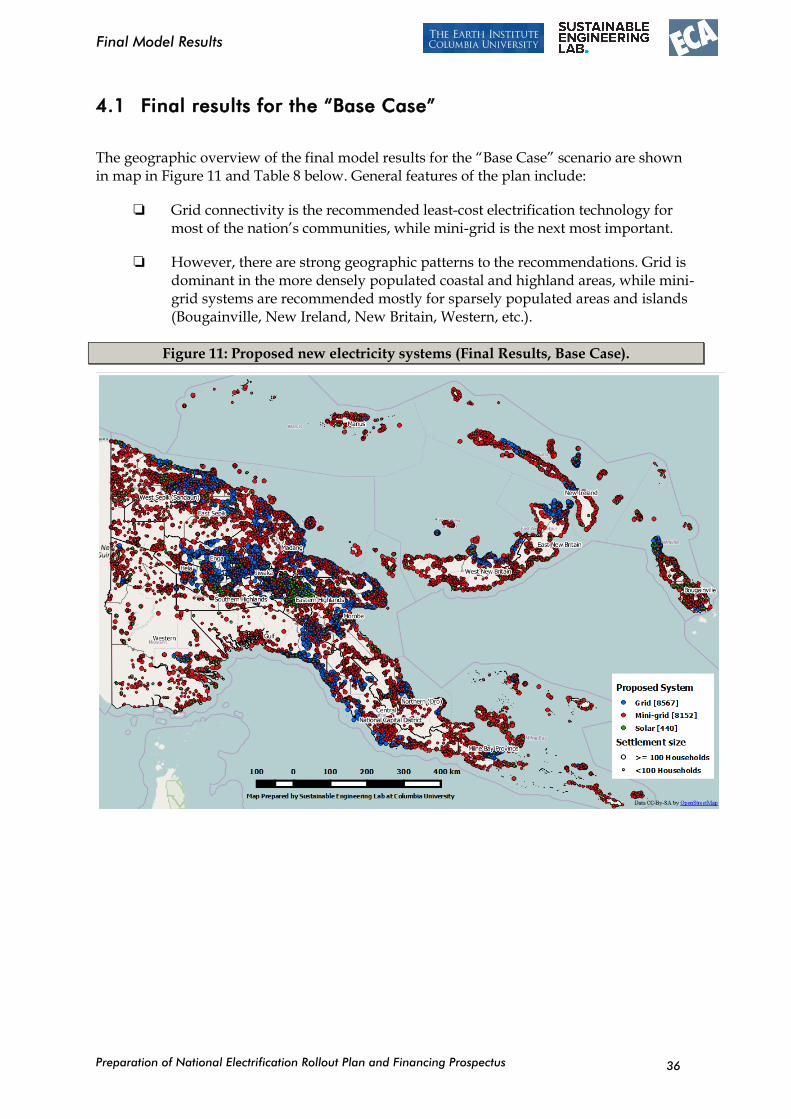
Preparation of National Electrification Rollout Plan and Financing Prospectus
Final Model Results
36
4.1 Final results for the “Base Case”
The geographic overview of the final model results for the “Base Case” scenario are shown in map in Figure 11 and Table 8 below. General features of the plan include:
Grid connectivity is the recommended least-cost electrification technology for most of the nation’s communities, while mini-grid is the next most important.
However, there are strong geographic patterns to the recommendations. Grid is dominant in the more densely populated coastal and highland areas, while mini-grid systems are recommended mostly for sparsely populated areas and islands (Bougainville, New Ireland, New Britain, Western, etc.).
Figure 11: Proposed new electricity systems (Final Results, Base Case).
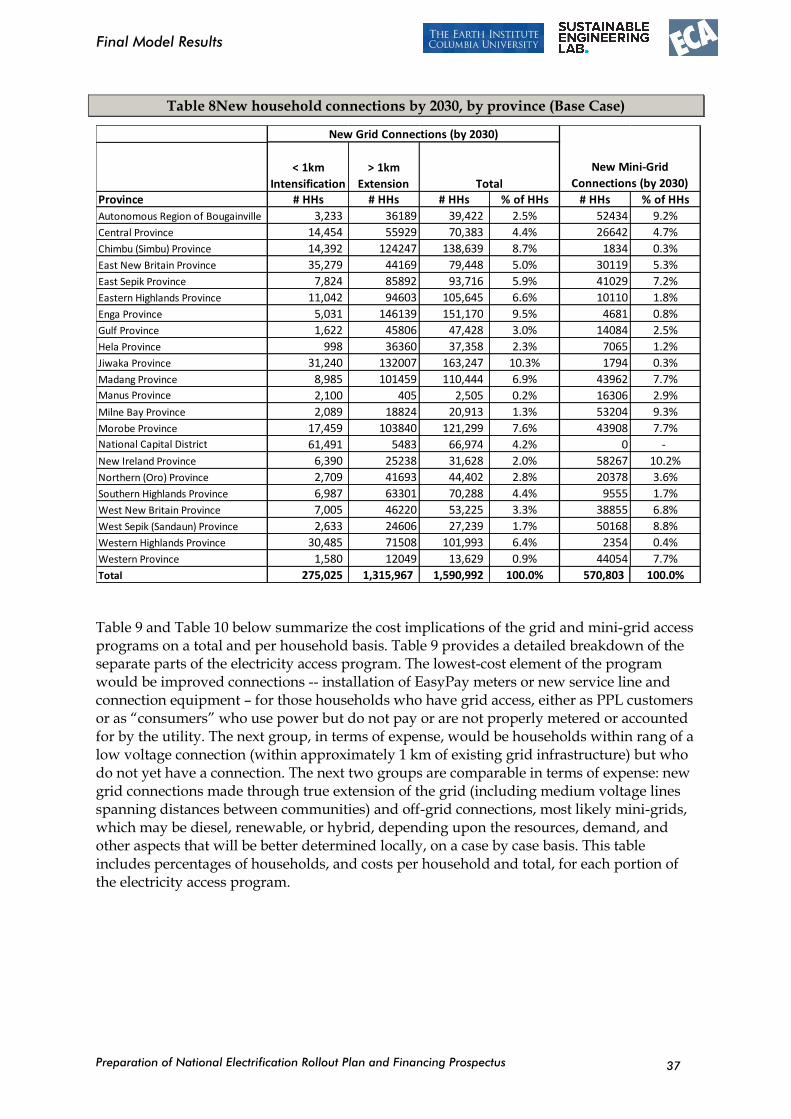
Preparation of National Electrification Rollout Plan and Financing Prospectus
Final Model Results
37
Table 8New household connections by 2030, by province (Base Case)
Table 9 and Table 10 below summarize the cost implications of the grid and mini-grid access programs on a total and per household basis. Table 9 provides a detailed breakdown of the separate parts of the electricity access program. The lowest-cost element of the program would be improved connections -- installation of EasyPay meters or new service line and connection equipment – for those households who have grid access, either as PPL customers or as “consumers” who use power but do not pay or are not properly metered or accounted for by the utility. The next group, in terms of expense, would be households within rang of a low voltage connection (within approximately 1 km of existing grid infrastructure) but who do not yet have a connection. The next two groups are comparable in terms of expense: new grid connections made through true extension of the grid (including medium voltage lines spanning distances between communities) and off-grid connections, most likely mini-grids, which may be diesel, renewable, or hybrid, depending upon the resources, demand, and other aspects that will be better determined locally, on a case by case basis. This table includes percentages of households, and costs per household and total, for each portion of the electricity access program.
< 1km
Intensification
> 1km
ExtensionProvince # HHs # HHs # HHs % of HHs # HHs % of HHs
Autonomous Region of Bougainville 3,233 36189 39,422 2.5% 52434 9.2%
Central Province 14,454 55929 70,383 4.4% 26642 4.7%
Chimbu (Simbu) Province 14,392 124247 138,639 8.7% 1834 0.3%
East New Britain Province 35,279 44169 79,448 5.0% 30119 5.3%
East Sepik Province 7,824 85892 93,716 5.9% 41029 7.2%
Eastern Highlands Province 11,042 94603 105,645 6.6% 10110 1.8%
Enga Province 5,031 146139 151,170 9.5% 4681 0.8%
Gulf Province 1,622 45806 47,428 3.0% 14084 2.5%
Hela Province 998 36360 37,358 2.3% 7065 1.2%
Jiwaka Province 31,240 132007 163,247 10.3% 1794 0.3%
Madang Province 8,985 101459 110,444 6.9% 43962 7.7%Manus Province 2,100 405 2,505 0.2% 16306 2.9%
Milne Bay Province 2,089 18824 20,913 1.3% 53204 9.3%
Morobe Province 17,459 103840 121,299 7.6% 43908 7.7%National Capital District 61,491 5483 66,974 4.2% 0 -
New Ireland Province 6,390 25238 31,628 2.0% 58267 10.2%
Northern (Oro) Province 2,709 41693 44,402 2.8% 20378 3.6%
Southern Highlands Province 6,987 63301 70,288 4.4% 9555 1.7%
West New Britain Province 7,005 46220 53,225 3.3% 38855 6.8%
West Sepik (Sandaun) Province 2,633 24606 27,239 1.7% 50168 8.8%
Western Highlands Province 30,485 71508 101,993 6.4% 2354 0.4%
Western Province 1,580 12049 13,629 0.9% 44054 7.7%
Total 275,025 1,315,967 1,590,992 100.0% 570,803 100.0%
New Grid Connections (by 2030)
New Mini-Grid
Connections (by 2030)Total
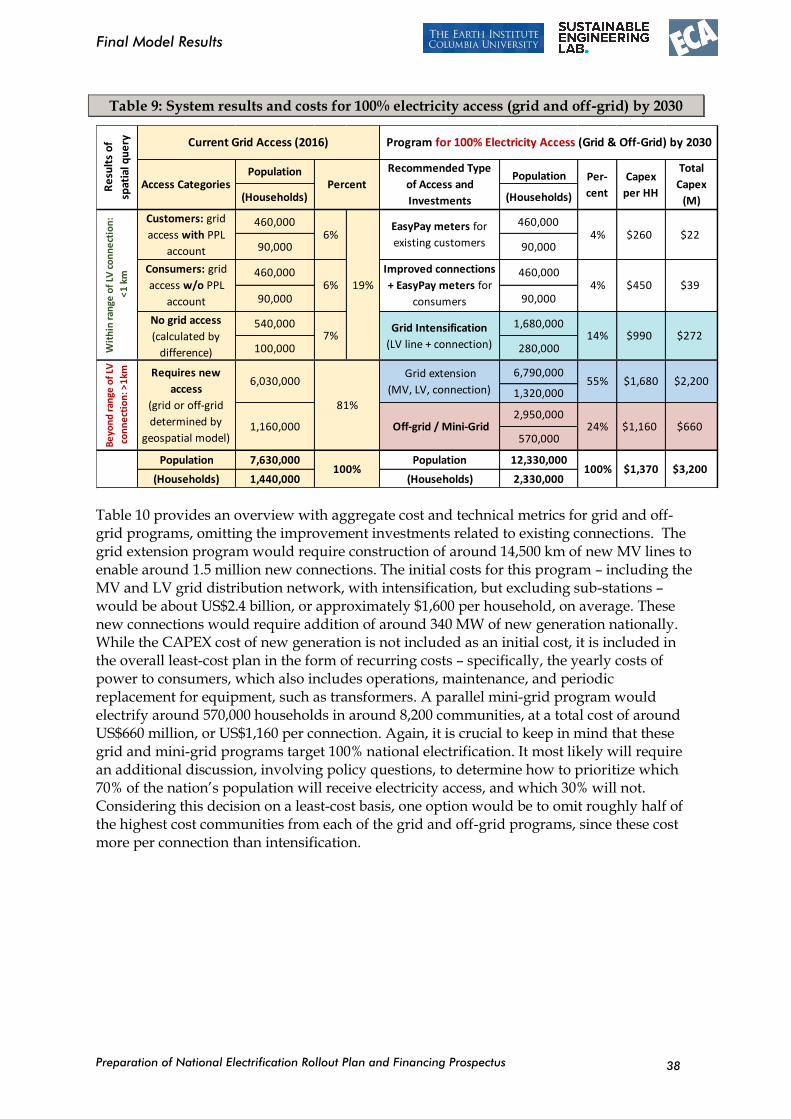
Preparation of National Electrification Rollout Plan and Financing Prospectus
Final Model Results
38
Table 9: System results and costs for 100% electricity access (grid and off-grid) by 2030
Table 10 provides an overview with aggregate cost and technical metrics for grid and off-grid programs, omitting the improvement investments related to existing connections. The grid extension program would require construction of around 14,500 km of new MV lines to enable around 1.5 million new connections. The initial costs for this program – including the MV and LV grid distribution network, with intensification, but excluding sub-stations – would be about US$2.4 billion, or approximately $1,600 per household, on average. These new connections would require addition of around 340 MW of new generation nationally. While the CAPEX cost of new generation is not included as an initial cost, it is included in the overall least-cost plan in the form of recurring costs – specifically, the yearly costs of power to consumers, which also includes operations, maintenance, and periodic replacement for equipment, such as transformers. A parallel mini-grid program would electrify around 570,000 households in around 8,200 communities, at a total cost of around US$660 million, or US$1,160 per connection. Again, it is crucial to keep in mind that these grid and mini-grid programs target 100% national electrification. It most likely will require an additional discussion, involving policy questions, to determine how to prioritize which 70% of the nation’s population will receive electricity access, and which 30% will not. Considering this decision on a least-cost basis, one option would be to omit roughly half of the highest cost communities from each of the grid and off-grid programs, since these cost more per connection than intensification.
Population Population
(Households) (Households)
460,000 460,000
90,000 90,000
460,000 460,000
90,000 90,000
540,000 1,680,000
100,000 280,000
6,790,000
1,320,000
2,950,000
570,000
Population 7,630,000 Population 12,330,000
(Households) 1,440,000 (Households) 2,330,000100% 100% $1,370 $3,200
$272
Be
yon
d r
ange
of
LV
con
ne
ctio
n: >
1km Requires new
access
(grid or off-grid
determined by
geospatial model)
6,030,000
81%
Grid extension
(MV, LV, connection) 55% $1,680 $2,200
1,160,000 Off-grid / Mini-Grid 24% $1,160 $660
Wit
hin
ran
ge o
f LV
co
nn
ect
ion
:
<1
km
EasyPay meters for
existing customers4% $260 $22
Consumers: grid
access w/o PPL
account
6%
Improved connections
+ EasyPay meters for
consumers
4% $450 $39
No grid access
(calculated by
difference)
7%Grid Intensification
(LV line + connection)14% $990
Customers: grid
access with PPL
account
6%
19%
Re
sult
s o
f
spat
ial q
ue
ry Current Grid Access (2016) Program for 100% Electricity Access (Grid & Off-Grid) by 2030
Access Categories Percent
Recommended Type
of Access and
Investments
Per-
cent
Capex
per HH
Total
Capex
(M)
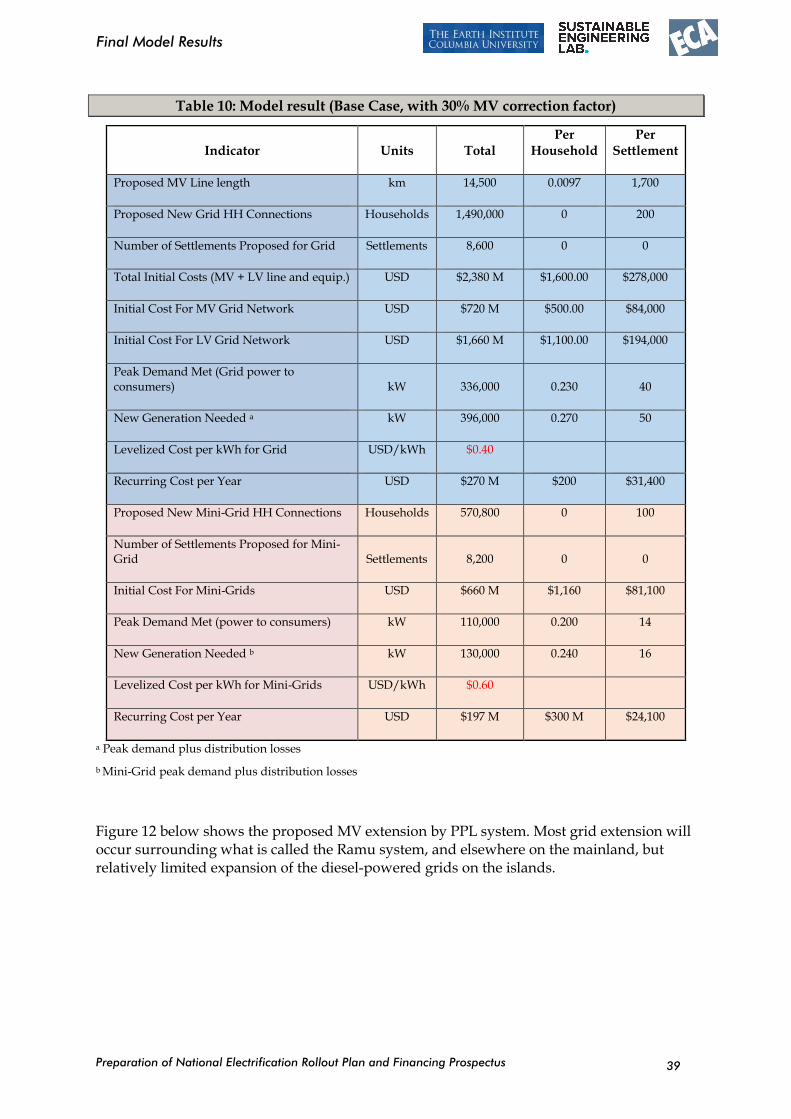
Preparation of National Electrification Rollout Plan and Financing Prospectus
Final Model Results
39
Table 10: Model result (Base Case, with 30% MV correction factor)
Indicator Units Total Per
Household Per
Settlement
Proposed MV Line length km 14,500 0.0097 1,700
Proposed New Grid HH Connections Households 1,490,000 0 200
Number of Settlements Proposed for Grid Settlements 8,600 0 0
Total Initial Costs (MV + LV line and equip.) USD $2,380 M $1,600.00 $278,000
Initial Cost For MV Grid Network USD $720 M $500.00 $84,000
Initial Cost For LV Grid Network USD $1,660 M $1,100.00 $194,000
Peak Demand Met (Grid power to consumers) kW 336,000 0.230 40
New Generation Needed a kW 396,000 0.270 50
Levelized Cost per kWh for Grid USD/kWh $0.40
Recurring Cost per Year USD $270 M $200 $31,400
Proposed New Mini-Grid HH Connections Households 570,800 0 100
Number of Settlements Proposed for Mini-Grid Settlements 8,200 0 0
Initial Cost For Mini-Grids USD $660 M $1,160 $81,100
Peak Demand Met (power to consumers) kW 110,000 0.200 14
New Generation Needed b kW 130,000 0.240 16
Levelized Cost per kWh for Mini-Grids USD/kWh $0.60
Recurring Cost per Year USD $197 M $300 M $24,100
a Peak demand plus distribution losses
b Mini-Grid peak demand plus distribution losses
Figure 12 below shows the proposed MV extension by PPL system. Most grid extension will occur surrounding what is called the Ramu system, and elsewhere on the mainland, but relatively limited expansion of the diesel-powered grids on the islands.
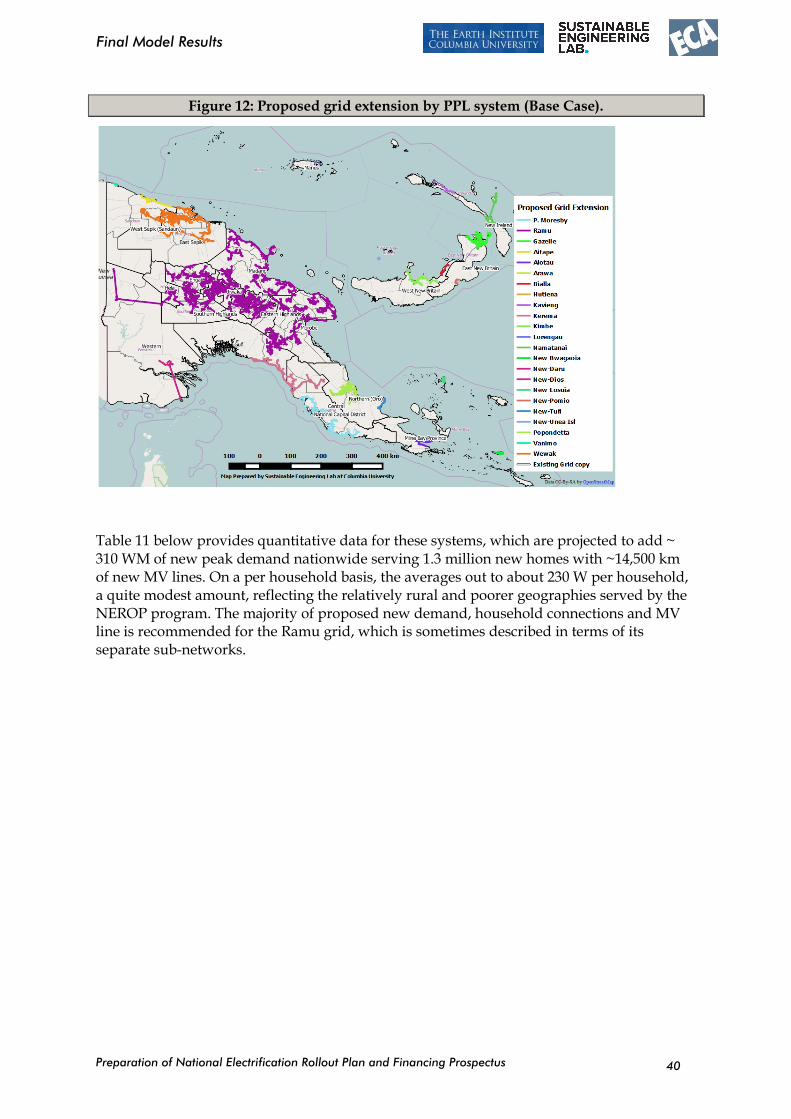
Preparation of National Electrification Rollout Plan and Financing Prospectus
Final Model Results
40
Figure 12: Proposed grid extension by PPL system (Base Case).
Table 11 below provides quantitative data for these systems, which are projected to add ~ 310 WM of new peak demand nationwide serving 1.3 million new homes with ~14,500 km of new MV lines. On a per household basis, the averages out to about 230 W per household, a quite modest amount, reflecting the relatively rural and poorer geographies served by the NEROP program. The majority of proposed new demand, household connections and MV line is recommended for the Ramu grid, which is sometimes described in terms of its separate sub-networks.
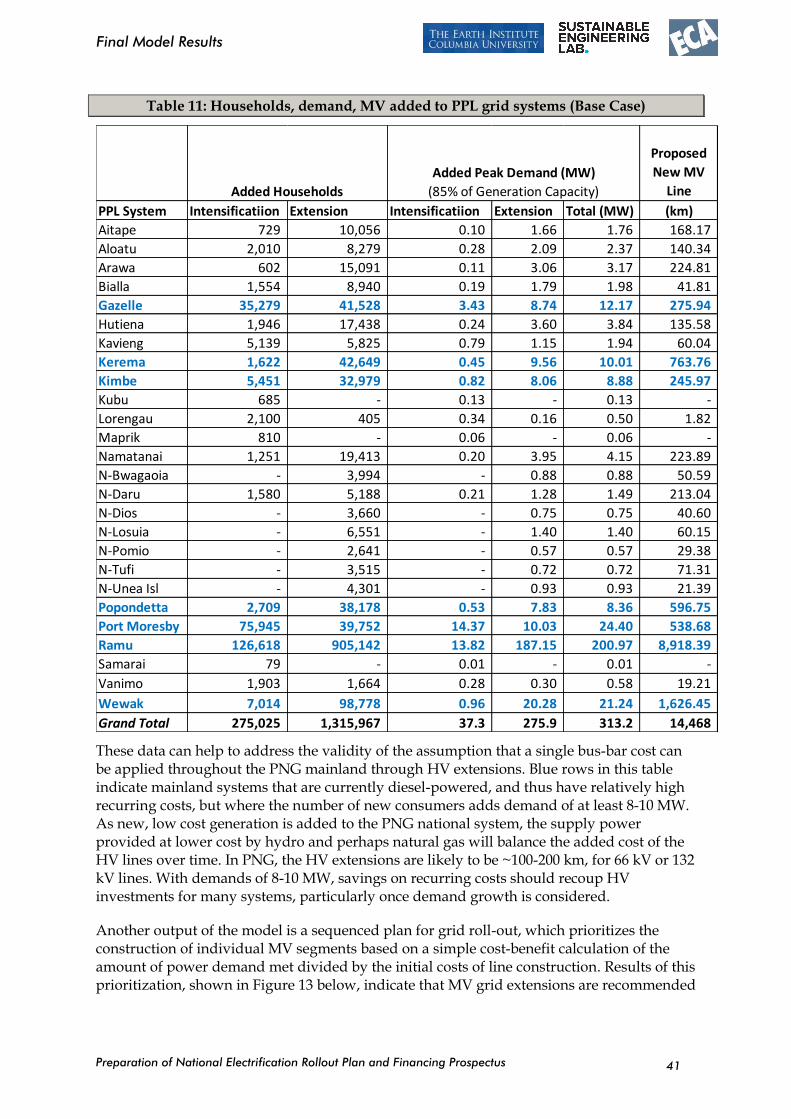
Preparation of National Electrification Rollout Plan and Financing Prospectus
Final Model Results
41
Table 11: Households, demand, MV added to PPL grid systems (Base Case)
These data can help to address the validity of the assumption that a single bus-bar cost can be applied throughout the PNG mainland through HV extensions. Blue rows in this table indicate mainland systems that are currently diesel-powered, and thus have relatively high recurring costs, but where the number of new consumers adds demand of at least 8-10 MW. As new, low cost generation is added to the PNG national system, the supply power provided at lower cost by hydro and perhaps natural gas will balance the added cost of the HV lines over time. In PNG, the HV extensions are likely to be ~100-200 km, for 66 kV or 132 kV lines. With demands of 8-10 MW, savings on recurring costs should recoup HV investments for many systems, particularly once demand growth is considered.
Another output of the model is a sequenced plan for grid roll-out, which prioritizes the construction of individual MV segments based on a simple cost-benefit calculation of the amount of power demand met divided by the initial costs of line construction. Results of this prioritization, shown in Figure 13 below, indicate that MV grid extensions are recommended
Proposed
New MV
Line
PPL System Intensificatiion Extension Intensificatiion Extension Total (MW) (km)
Aitape 729 10,056 0.10 1.66 1.76 168.17
Aloatu 2,010 8,279 0.28 2.09 2.37 140.34
Arawa 602 15,091 0.11 3.06 3.17 224.81
Bialla 1,554 8,940 0.19 1.79 1.98 41.81
Gazelle 35,279 41,528 3.43 8.74 12.17 275.94
Hutiena 1,946 17,438 0.24 3.60 3.84 135.58
Kavieng 5,139 5,825 0.79 1.15 1.94 60.04
Kerema 1,622 42,649 0.45 9.56 10.01 763.76
Kimbe 5,451 32,979 0.82 8.06 8.88 245.97
Kubu 685 - 0.13 - 0.13 -
Lorengau 2,100 405 0.34 0.16 0.50 1.82
Maprik 810 - 0.06 - 0.06 -
Namatanai 1,251 19,413 0.20 3.95 4.15 223.89
N-Bwagaoia - 3,994 - 0.88 0.88 50.59
N-Daru 1,580 5,188 0.21 1.28 1.49 213.04
N-Dios - 3,660 - 0.75 0.75 40.60
N-Losuia - 6,551 - 1.40 1.40 60.15
N-Pomio - 2,641 - 0.57 0.57 29.38
N-Tufi - 3,515 - 0.72 0.72 71.31
N-Unea Isl - 4,301 - 0.93 0.93 21.39
Popondetta 2,709 38,178 0.53 7.83 8.36 596.75
Port Moresby 75,945 39,752 14.37 10.03 24.40 538.68
Ramu 126,618 905,142 13.82 187.15 200.97 8,918.39
Samarai 79 - 0.01 - 0.01 -
Vanimo 1,903 1,664 0.28 0.30 0.58 19.21
Wewak 7,014 98,778 0.96 20.28 21.24 1,626.45
Grand Total 275,025 1,315,967 37.3 275.9 313.2 14,468
Added Households
Added Peak Demand (MW)
(85% of Generation Capacity)
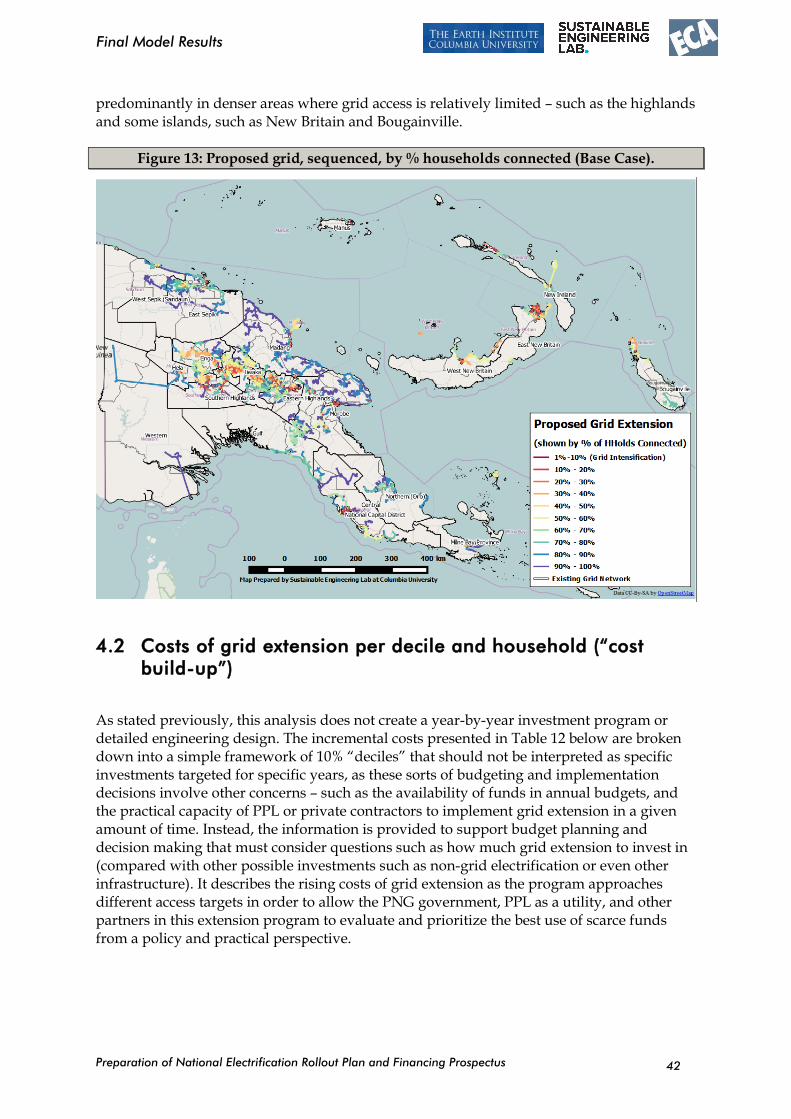
Preparation of National Electrification Rollout Plan and Financing Prospectus
Final Model Results
42
predominantly in denser areas where grid access is relatively limited – such as the highlands and some islands, such as New Britain and Bougainville.
Figure 13: Proposed grid, sequenced, by % households connected (Base Case).
4.2 Costs of grid extension per decile and household (“cost
build-up”)
As stated previously, this analysis does not create a year-by-year investment program or detailed engineering design. The incremental costs presented in Table 12 below are broken down into a simple framework of 10% “deciles” that should not be interpreted as specific investments targeted for specific years, as these sorts of budgeting and implementation decisions involve other concerns – such as the availability of funds in annual budgets, and the practical capacity of PPL or private contractors to implement grid extension in a given amount of time. Instead, the information is provided to support budget planning and decision making that must consider questions such as how much grid extension to invest in (compared with other possible investments such as non-grid electrification or even other infrastructure). It describes the rising costs of grid extension as the program approaches different access targets in order to allow the PNG government, PPL as a utility, and other partners in this extension program to evaluate and prioritize the best use of scarce funds from a policy and practical perspective.
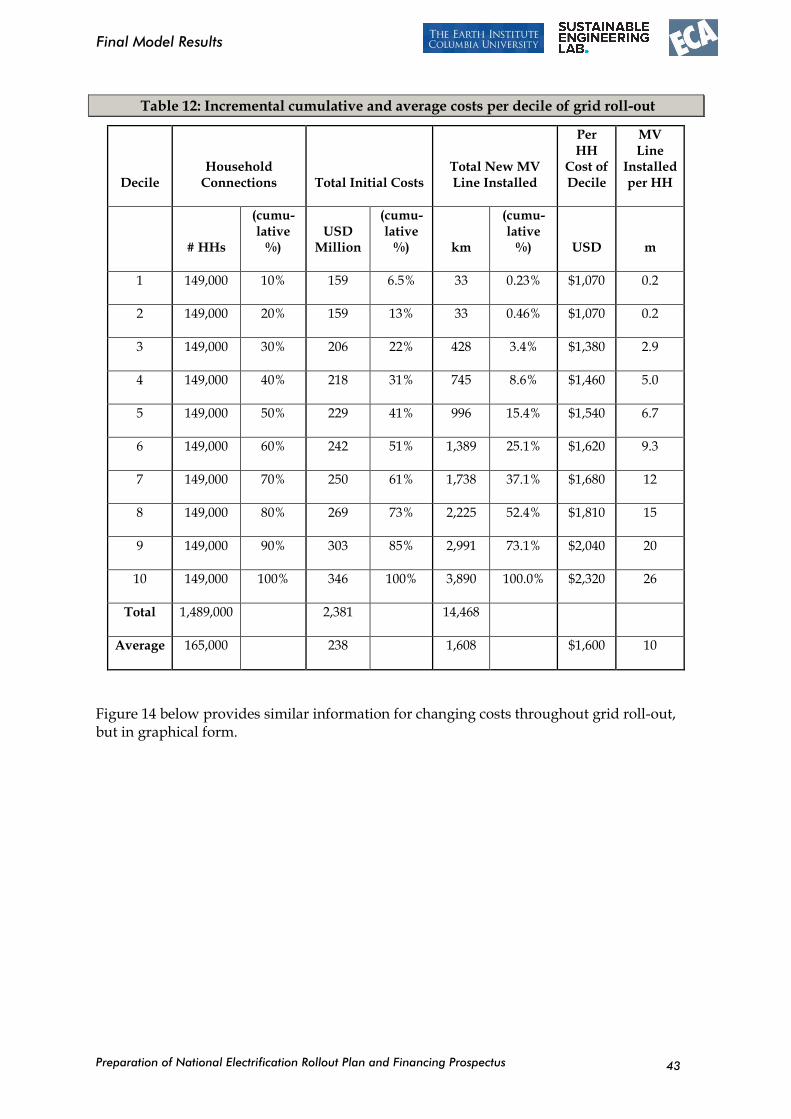
Preparation of National Electrification Rollout Plan and Financing Prospectus
Final Model Results
43
Table 12: Incremental cumulative and average costs per decile of grid roll-out
Decile Household
Connections Total Initial Costs Total New MV Line Installed
Per HH
Cost of Decile
MV Line
Installed per HH
# HHs
(cumu-lative
%) USD
Million
(cumu-lative
%) km
(cumu-lative
%) USD m
1 149,000 10% 159 6.5% 33 0.23% $1,070 0.2
2 149,000 20% 159 13% 33 0.46% $1,070 0.2
3 149,000 30% 206 22% 428 3.4% $1,380 2.9
4 149,000 40% 218 31% 745 8.6% $1,460 5.0
5 149,000 50% 229 41% 996 15.4% $1,540 6.7
6 149,000 60% 242 51% 1,389 25.1% $1,620 9.3
7 149,000 70% 250 61% 1,738 37.1% $1,680 12
8 149,000 80% 269 73% 2,225 52.4% $1,810 15
9 149,000 90% 303 85% 2,991 73.1% $2,040 20
10 149,000 100% 346 100% 3,890 100.0% $2,320 26
Total 1,489,000 2,381 14,468
Average 165,000 238 1,608 $1,600 10
Figure 14 below provides similar information for changing costs throughout grid roll-out, but in graphical form.
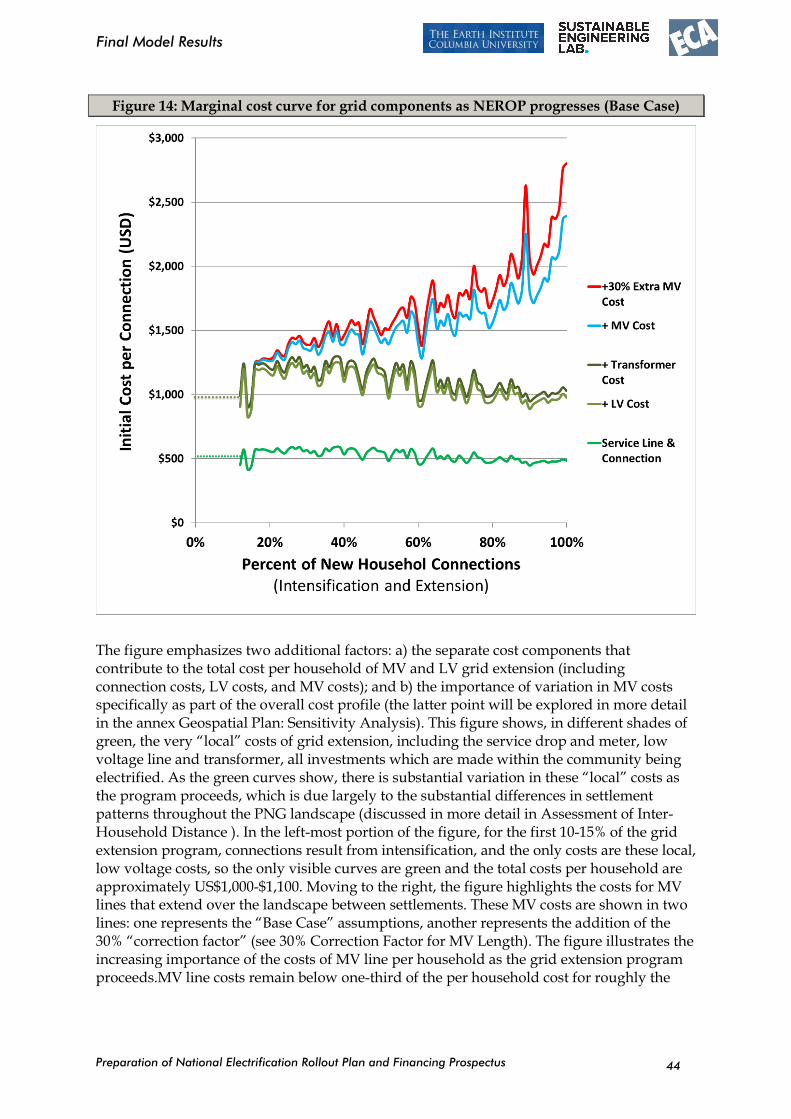
Preparation of National Electrification Rollout Plan and Financing Prospectus
Final Model Results
44
Figure 14: Marginal cost curve for grid components as NEROP progresses (Base Case)
The figure emphasizes two additional factors: a) the separate cost components that contribute to the total cost per household of MV and LV grid extension (including connection costs, LV costs, and MV costs); and b) the importance of variation in MV costs specifically as part of the overall cost profile (the latter point will be explored in more detail in the annex Geospatial Plan: Sensitivity Analysis). This figure shows, in different shades of green, the very “local” costs of grid extension, including the service drop and meter, low voltage line and transformer, all investments which are made within the community being electrified. As the green curves show, there is substantial variation in these “local” costs as the program proceeds, which is due largely to the substantial differences in settlement patterns throughout the PNG landscape (discussed in more detail in Assessment of Inter-Household Distance ). In the left-most portion of the figure, for the first 10-15% of the grid extension program, connections result from intensification, and the only costs are these local, low voltage costs, so the only visible curves are green and the total costs per household are approximately US$1,000-$1,100. Moving to the right, the figure highlights the costs for MV lines that extend over the landscape between settlements. These MV costs are shown in two lines: one represents the “Base Case” assumptions, another represents the addition of the 30% “correction factor” (see 30% Correction Factor for MV Length). The figure illustrates the increasing importance of the costs of MV line per household as the grid extension program proceeds.MV line costs remain below one-third of the per household cost for roughly the
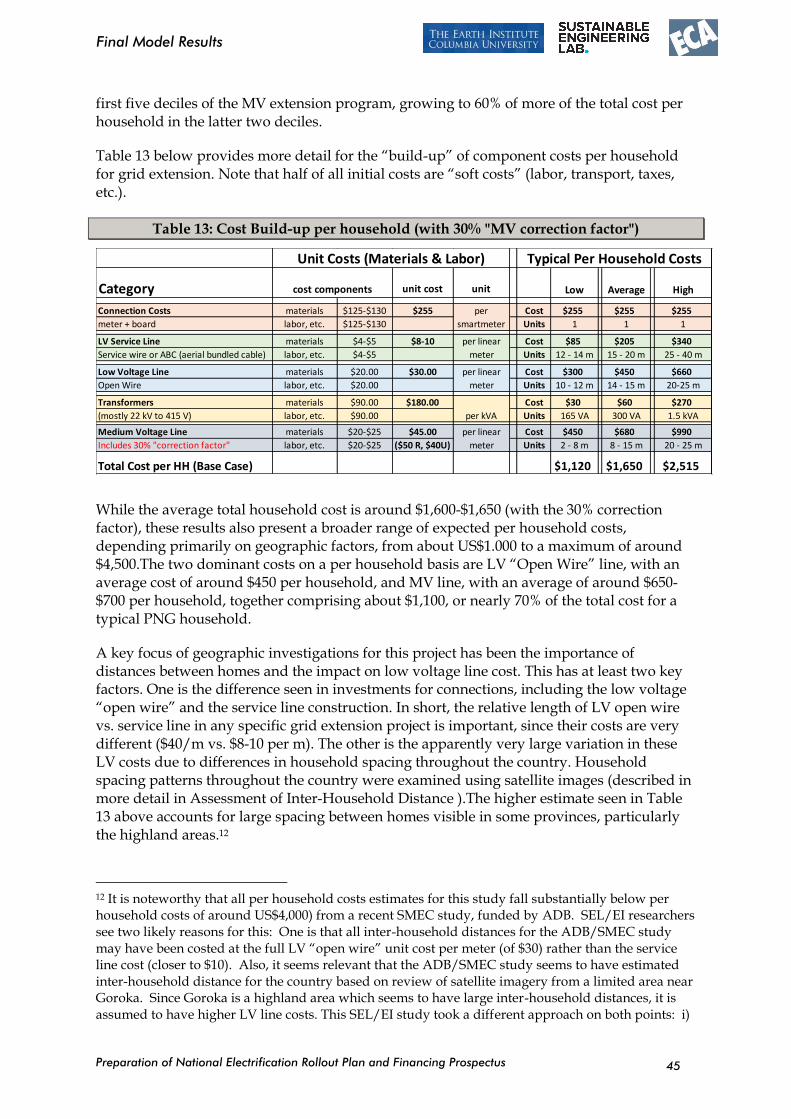
Preparation of National Electrification Rollout Plan and Financing Prospectus
Final Model Results
45
first five deciles of the MV extension program, growing to 60% of more of the total cost per household in the latter two deciles.
Table 13 below provides more detail for the “build-up” of component costs per household for grid extension. Note that half of all initial costs are “soft costs” (labor, transport, taxes, etc.).
Table 13: Cost Build-up per household (with 30% "MV correction factor")
While the average total household cost is around $1,600-$1,650 (with the 30% correction factor), these results also present a broader range of expected per household costs, depending primarily on geographic factors, from about US$1.000 to a maximum of around $4,500.The two dominant costs on a per household basis are LV “Open Wire” line, with an average cost of around $450 per household, and MV line, with an average of around $650-$700 per household, together comprising about $1,100, or nearly 70% of the total cost for a typical PNG household.
A key focus of geographic investigations for this project has been the importance of distances between homes and the impact on low voltage line cost. This has at least two key factors. One is the difference seen in investments for connections, including the low voltage “open wire” and the service line construction. In short, the relative length of LV open wire vs. service line in any specific grid extension project is important, since their costs are very different ($40/m vs. $8-10 per m). The other is the apparently very large variation in these LV costs due to differences in household spacing throughout the country. Household spacing patterns throughout the country were examined using satellite images (described in more detail in Assessment of Inter-Household Distance ).The higher estimate seen in Table 13 above accounts for large spacing between homes visible in some provinces, particularly the highland areas.12
12 It is noteworthy that all per household costs estimates for this study fall substantially below per household costs of around US$4,000) from a recent SMEC study, funded by ADB. SEL/EI researchers see two likely reasons for this: One is that all inter-household distances for the ADB/SMEC study may have been costed at the full LV “open wire” unit cost per meter (of $30) rather than the service line cost (closer to $10). Also, it seems relevant that the ADB/SMEC study seems to have estimated inter-household distance for the country based on review of satellite imagery from a limited area near Goroka. Since Goroka is a highland area which seems to have large inter-household distances, it is assumed to have higher LV line costs. This SEL/EI study took a different approach on both points: i)
Category unit cost unit Low Average High
Connection Costs materials $125-$130 $255 Cost $255 $255 $255
meter + board labor, etc. $125-$130 Units 1 1 1
LV Service Line materials $4-$5 $8-10 Cost $85 $205 $340
Service wire or ABC (aerial bundled cable) labor, etc. $4-$5 Units 12 - 14 m 15 - 20 m 25 - 40 m
Low Voltage Line materials $20.00 $30.00 Cost $300 $450 $660
Open Wire labor, etc. $20.00 Units 10 - 12 m 14 - 15 m 20-25 m
Transformers materials $90.00 $180.00 Cost $30 $60 $270
(mostly 22 kV to 415 V) labor, etc. $90.00 Units 165 VA 300 VA 1.5 kVA
Medium Voltage Line materials $20-$25 $45.00 Cost $450 $680 $990
Includes 30% "correction factor" labor, etc. $20-$25 ($50 R, $40U) Units 2 - 8 m 8 - 15 m 20 - 25 m
Total Cost per HH (Base Case) $1,120 $1,650 $2,515
per
smartmeter
per linear
meter
per kVA
per linear
meter
per linear
meter
Unit Costs (Materials & Labor)
cost components
Typical Per Household Costs
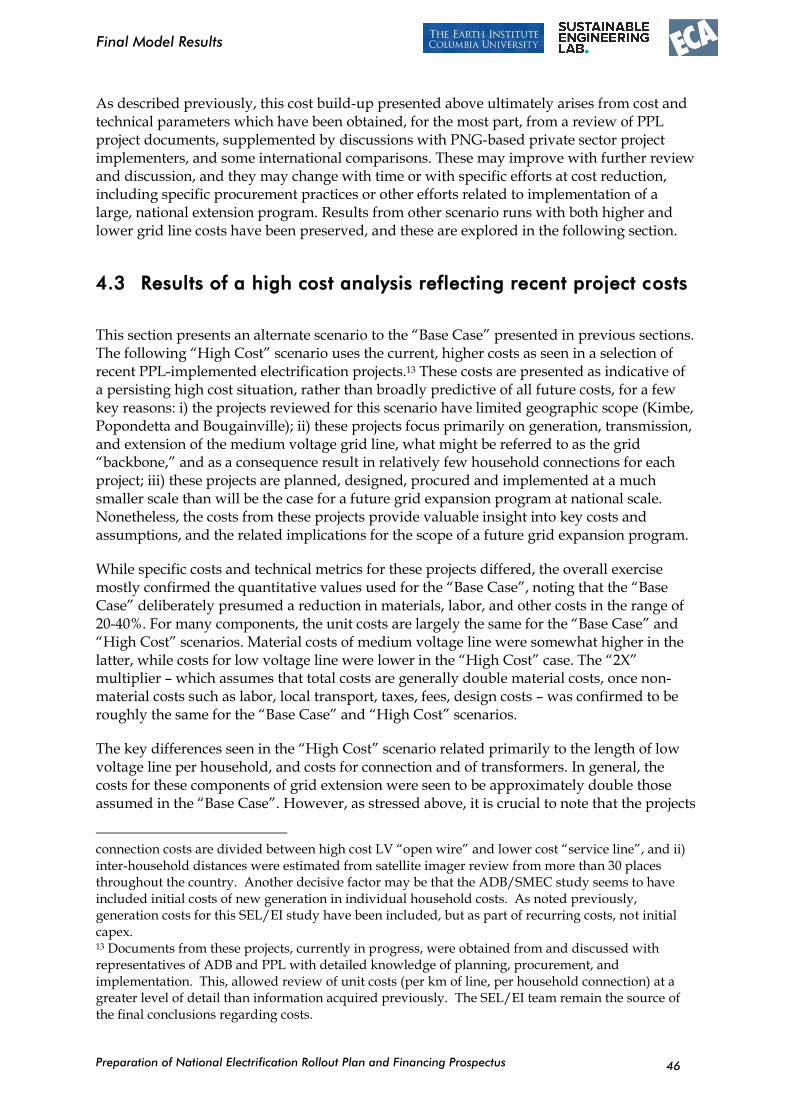
Preparation of National Electrification Rollout Plan and Financing Prospectus
Final Model Results
46
As described previously, this cost build-up presented above ultimately arises from cost and technical parameters which have been obtained, for the most part, from a review of PPL project documents, supplemented by discussions with PNG-based private sector project implementers, and some international comparisons. These may improve with further review and discussion, and they may change with time or with specific efforts at cost reduction, including specific procurement practices or other efforts related to implementation of a large, national extension program. Results from other scenario runs with both higher and lower grid line costs have been preserved, and these are explored in the following section.
4.3 Results of a high cost analysis reflecting recent project costs
This section presents an alternate scenario to the “Base Case” presented in previous sections. The following “High Cost” scenario uses the current, higher costs as seen in a selection of recent PPL-implemented electrification projects.13 These costs are presented as indicative of a persisting high cost situation, rather than broadly predictive of all future costs, for a few key reasons: i) the projects reviewed for this scenario have limited geographic scope (Kimbe, Popondetta and Bougainville); ii) these projects focus primarily on generation, transmission, and extension of the medium voltage grid line, what might be referred to as the grid “backbone,” and as a consequence result in relatively few household connections for each project; iii) these projects are planned, designed, procured and implemented at a much smaller scale than will be the case for a future grid expansion program at national scale. Nonetheless, the costs from these projects provide valuable insight into key costs and assumptions, and the related implications for the scope of a future grid expansion program.
While specific costs and technical metrics for these projects differed, the overall exercise mostly confirmed the quantitative values used for the “Base Case”, noting that the “Base Case” deliberately presumed a reduction in materials, labor, and other costs in the range of 20-40%. For many components, the unit costs are largely the same for the “Base Case” and “High Cost” scenarios. Material costs of medium voltage line were somewhat higher in the latter, while costs for low voltage line were lower in the “High Cost” case. The “2X” multiplier – which assumes that total costs are generally double material costs, once non-material costs such as labor, local transport, taxes, fees, design costs – was confirmed to be roughly the same for the “Base Case” and “High Cost” scenarios.
The key differences seen in the “High Cost” scenario related primarily to the length of low voltage line per household, and costs for connection and of transformers. In general, the costs for these components of grid extension were seen to be approximately double those assumed in the “Base Case”. However, as stressed above, it is crucial to note that the projects
connection costs are divided between high cost LV “open wire” and lower cost “service line”, and ii) inter-household distances were estimated from satellite imager review from more than 30 places throughout the country. Another decisive factor may be that the ADB/SMEC study seems to have included initial costs of new generation in individual household costs. As noted previously, generation costs for this SEL/EI study have been included, but as part of recurring costs, not initial capex. 13 Documents from these projects, currently in progress, were obtained from and discussed with representatives of ADB and PPL with detailed knowledge of planning, procurement, and implementation. This, allowed review of unit costs (per km of line, per household connection) at a greater level of detail than information acquired previously. The SEL/EI team remain the source of the final conclusions regarding costs.
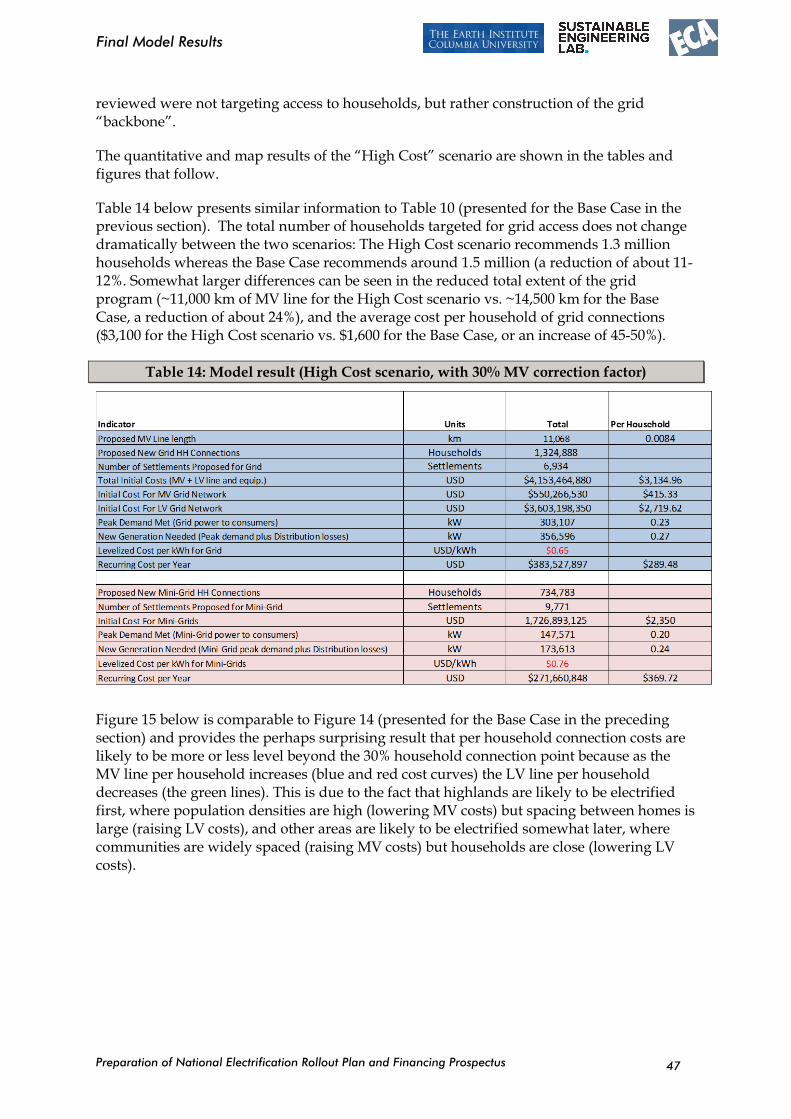
Preparation of National Electrification Rollout Plan and Financing Prospectus
Final Model Results
47
reviewed were not targeting access to households, but rather construction of the grid “backbone”.
The quantitative and map results of the “High Cost” scenario are shown in the tables and figures that follow.
Table 14 below presents similar information to Table 10 (presented for the Base Case in the previous section). The total number of households targeted for grid access does not change dramatically between the two scenarios: The High Cost scenario recommends 1.3 million households whereas the Base Case recommends around 1.5 million (a reduction of about 11-12%. Somewhat larger differences can be seen in the reduced total extent of the grid program (~11,000 km of MV line for the High Cost scenario vs. ~14,500 km for the Base Case, a reduction of about 24%), and the average cost per household of grid connections ($3,100 for the High Cost scenario vs. $1,600 for the Base Case, or an increase of 45-50%).
Table 14: Model result (High Cost scenario, with 30% MV correction factor)
Figure 15 below is comparable to Figure 14 (presented for the Base Case in the preceding section) and provides the perhaps surprising result that per household connection costs are likely to be more or less level beyond the 30% household connection point because as the MV line per household increases (blue and red cost curves) the LV line per household decreases (the green lines). This is due to the fact that highlands are likely to be electrified first, where population densities are high (lowering MV costs) but spacing between homes is large (raising LV costs), and other areas are likely to be electrified somewhat later, where communities are widely spaced (raising MV costs) but households are close (lowering LV costs).
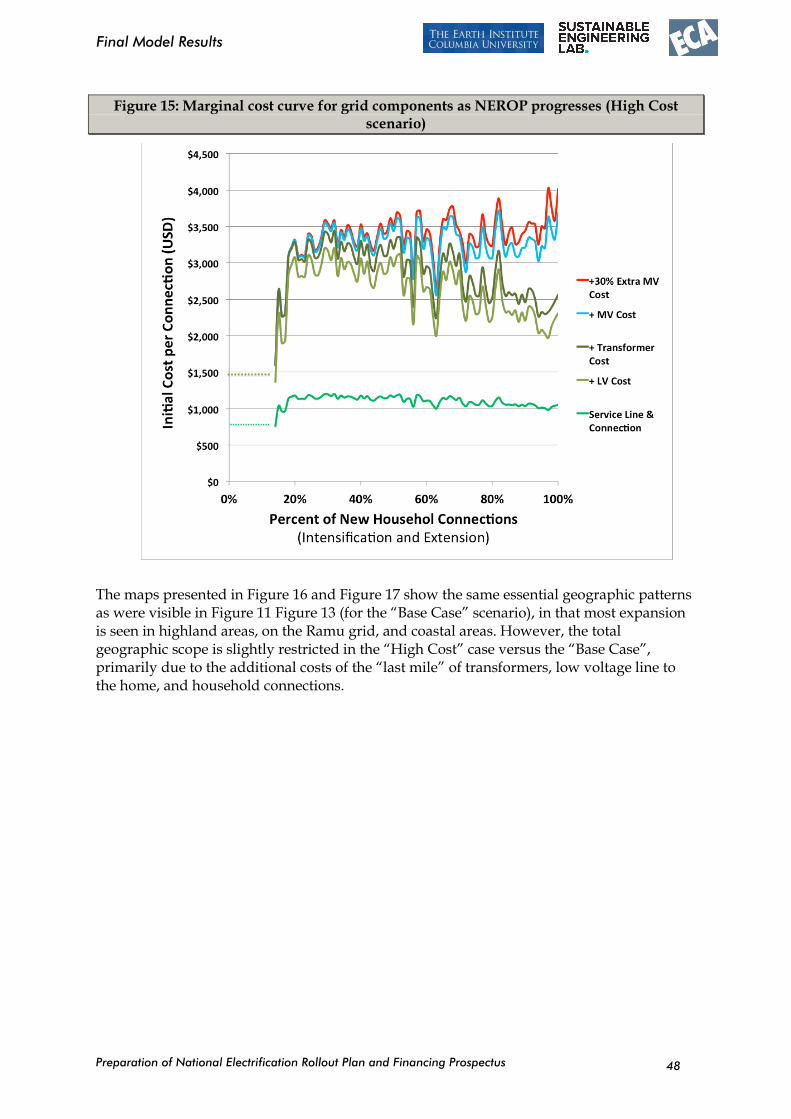
Preparation of National Electrification Rollout Plan and Financing Prospectus
Final Model Results
48
Figure 15: Marginal cost curve for grid components as NEROP progresses (High Cost scenario)
The maps presented in Figure 16 and Figure 17 show the same essential geographic patterns as were visible in Figure 11 Figure 13 (for the “Base Case” scenario), in that most expansion is seen in highland areas, on the Ramu grid, and coastal areas. However, the total geographic scope is slightly restricted in the “High Cost” case versus the “Base Case”, primarily due to the additional costs of the “last mile” of transformers, low voltage line to the home, and household connections.
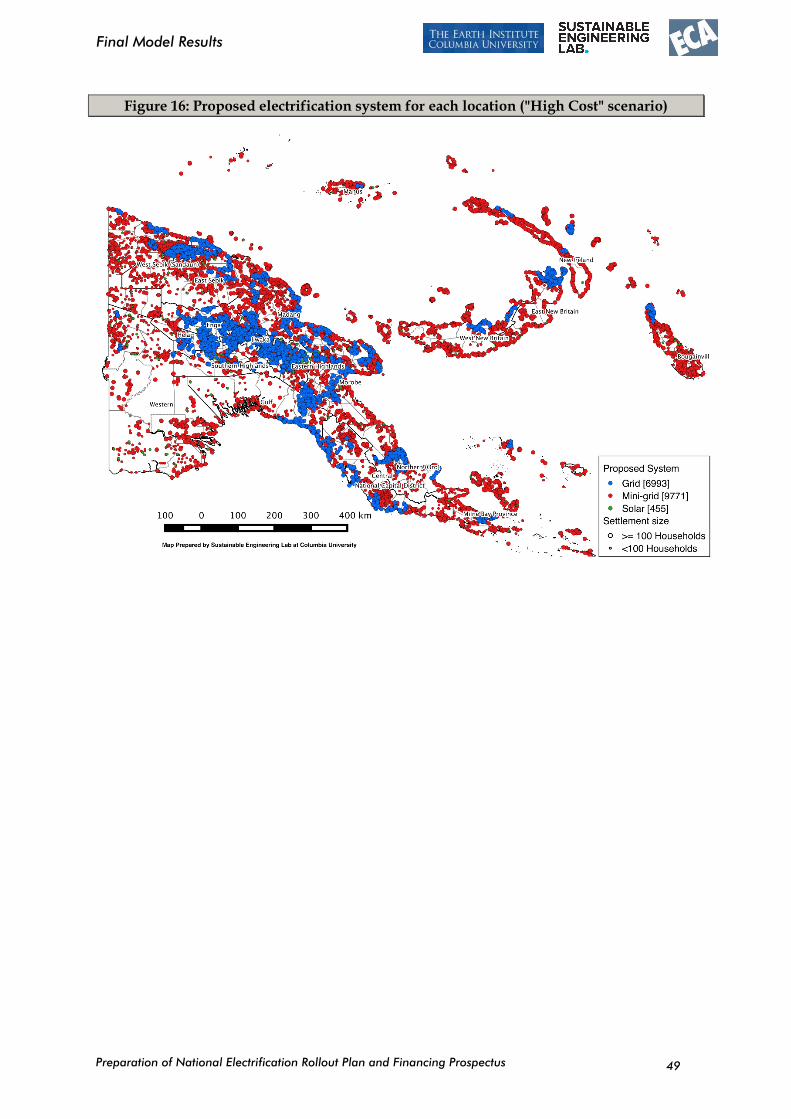
Preparation of National Electrification Rollout Plan and Financing Prospectus
Final Model Results
49
Figure 16: Proposed electrification system for each location ("High Cost" scenario)
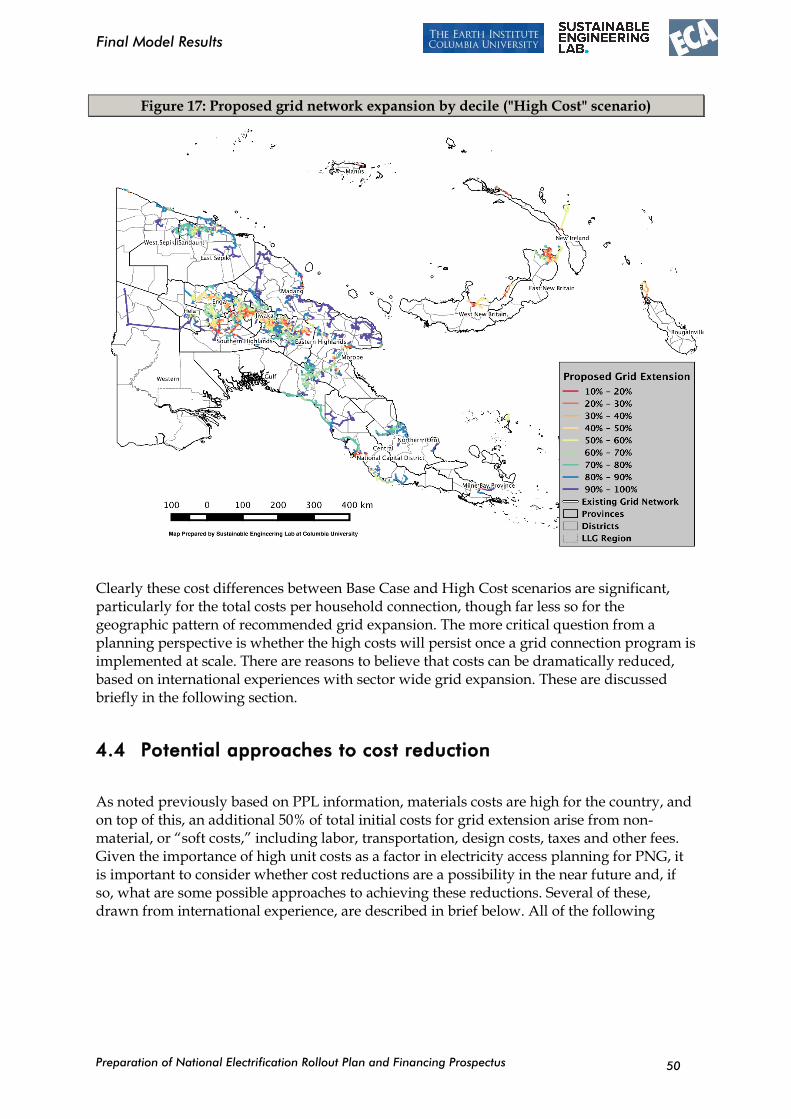
Preparation of National Electrification Rollout Plan and Financing Prospectus
Final Model Results
50
Figure 17: Proposed grid network expansion by decile ("High Cost" scenario)
Clearly these cost differences between Base Case and High Cost scenarios are significant, particularly for the total costs per household connection, though far less so for the geographic pattern of recommended grid expansion. The more critical question from a planning perspective is whether the high costs will persist once a grid connection program is implemented at scale. There are reasons to believe that costs can be dramatically reduced, based on international experiences with sector wide grid expansion. These are discussed briefly in the following section.
4.4 Potential approaches to cost reduction
As noted previously based on PPL information, materials costs are high for the country, and on top of this, an additional 50% of total initial costs for grid extension arise from non-material, or “soft costs,” including labor, transportation, design costs, taxes and other fees. Given the importance of high unit costs as a factor in electricity access planning for PNG, it is important to consider whether cost reductions are a possibility in the near future and, if so, what are some possible approaches to achieving these reductions. Several of these, drawn from international experience, are described in brief below. All of the following
Preparation of National Electrification Rollout Plan and Financing Prospectus
Final Model Results
51
combined can lead to relatively quick and dramatic reductions -- 40% reduction in the span of 5 years is not at all unreasonable.14
Design and project planning targeting household access: Multiple conversations among electrification practitioners in PNG – both within PPL and outside – suggest that current planning and design tends to prioritize building out the grid “backbone” over maximizing new household connections. This is for rational reasons: project funders, past planning practice, and other factors all tend to assume that PPL’s primary role is to establish the main grid “backbone” (MV line with some transformers and LV) while others, often local governments and households themselves, are responsible for some degree of LV extension, wiring and connection costs. As a result, grid extension programs may result in only 10-20% of the homes in a given area being connected to nearby grid. To raise access rates, it may help to increase the focus during the project planning phase on LV extensions to all communities within a 5 – 10 km radius of the MV line. Programs to reduce the costs of connection to homes may help to increase access as well, and may be supported by subsidies, reduction of household wiring costs with broader use of MSKs, smoothing costs of connection across multiple billing cycles, or subsidies.
Broad, multi-departmental cost review within PPL: We recommend a working group or similar be created within PPL to first review costs (material, labor, etc.) for recent projects and look for opportunities for reductions.
Reduction of materials costs with bulk procurement from international markets: A comprehensive, national electrification program will permit procurement on international markets of larger quantities of materials than is typical for most PNG grid extension projects, allowing for reduced pricing. Furthermore, this procurement may have support from international experts (World Bank, et al) with experience in such procurement, perhaps enhancing savings.
Reduction in non-material costs through larger contracts, with improved procurement: Perhaps the most important reason to expect that NEROP can offer opportunities for savings on both materials and “soft costs” is that the program will be implementing grid extension at unprecedented scale, suggesting that any factors – such as transportation, storage, design – that may be amenable to economies of scale. Transport and storage systems for wire, poles and other components can be implemented in a manner that uses the same resources for multiple projects in different regions, reducing costs for any single grid extension; design and other costs related to highly skilled labor may be able to spread the same talent over more projects, as well as establishing rapid, standardized design templates that speed this work and reduce costs.
14 This figure of 40% cost reduction is drawn from recent experience of the World Bank with scaled-up grid access in Rwanda (personal discussions).
Preparation of National Electrification Rollout Plan and Financing Prospectus
Final Model Results
52
Single wire earth return (SWER): Reviews of SWER costs15 report that SWER can bring real cost savings – of perhaps 30% or so – but that this involves trade-offs that must be evaluated by PPL.
This broad list represents a variety of options for ensuring that implementation at scale can be achieved at costs closer to the Base Case from this report, rather than the High Costs seen in a few recent projects.
15 Discussions with UN/WB procurement specialist for grid construction; http://tdworld.com/archive/when-one-wire-enough

Preparation of National Electrification Rollout Plan and Financing Prospectus
Part 2: Implementation of the Least-Cost
National Electrification Plan
53
PART 2: IMPLEMENTATION OF THE LEAST-COST NATIONAL
ELECTRIFICATION PLAN
Preparation of National Electrification Rollout Plan and Financing Prospectus
Institutional framework
54
5 Institutional framework
5.1 Introduction
In this section we review the existing institutional framework in PNG with respect to implementation of NEROP. We evaluate the existing framework and use lessons from international experience to recommend improvements to the framework.
The institutional framework and the framework for funding the implementation of NEROP are inevitably interlinked, but in this section we focus predominately on the institutional framework and discuss the detail of the funding framework in Section 6.
Terms of reference
Key excerpts from the terms of reference for Task 7, the review of the institutional framework, are provided below:
“rapid strategic review of the current regulatory framework, and economic regulation […] to evaluate the adequacy and completeness of the regulations for regulatory oversight called for under a program for systematically scaling up electricity access”
“the international good practices and principles demonstrated in comparable regulatory frameworks in other countries.”
“Oversight and enforcement mandate needed to ensure effective and efficient implementation of access scale up implementation”
“Addressing regulatory issues that may arise from the need to strike appropriate balance in the trade-off between encouraging private participation […]
avoiding ‘cherry picking’ of enclave service areas”
“TA and capacity strengthening needs for the DPE and ICCC, to effectively play their due role in economic and technical regulatory oversight, progress reporting, and compliance monitoring of utility and other entities engaged in the implementation of electricity services”
Structure of this section
This section is structured as follows:
Section 5.2 describes the existing framework in PNG.
Section 5.3 describes and evaluates the main options for implementing NEROP.
Section 5.4 summarises our recommendations.
Preparation of National Electrification Rollout Plan and Financing Prospectus
Institutional framework
55
5.2 Existing framework
5.2.1 Existing policy and regulations
There are number of different key policy documents, some of which are due to be
updated
The existing regulatory and institutional framework for rural electrification is set out in a number of different laws, regulations, and policy documents, as summarised in the box below.
Key laws/regulations/policies:
Electricity Industry Policy
PPL Ltd.’s Electricity Regulatory contract
CSO Policy and Guidelines
Other applicable laws/regulations/policies:
PNG Vision 2050
Development Strategic Plan 2010-2030
Medium Term Development Plan 2011 – 2015
PPP Act and Policy
Organic Law
Electricity Supply (Government Power Stations) Act
District Development Authority Act
Kumul Holdings Act
ICCC Act 2002
Electricity Industry Act
PPL Ltd.’s Electricity Regulatory contract
PPL Ltd.’s Licences
Third Party Access Code
Grid Code
Good Procurement Manual
Preparation of National Electrification Rollout Plan and Financing Prospectus
Institutional framework
56
The Electricity Industry Policy (EIP) was published in 2011 and has been due to be reviewed and updated since 2013 (it has not). At present there is also no policy dedicated to rural electrification.
This implies that, going forward, there is scope to revise and update the institutional framework for implementing NEROP.
Policy sets a clear target for electrification: 70% of households by 2030
The PNG Development Strategic Plan 2010-2030 provides clear policy direction with respect to electrification: Over 70% of households by 2030. This target is further elaborated in the Strategic Plan as 10.5% annual growth target (which means relatively few connections in the early years, but a much higher connection rate towards 2030), whereas the PNG Medium Term Development Plan 2011-2015 sets five yearly targets with a more linear connection rate. Key excerpts are provided in the box below.
PNG Development Strategic Plan 2010-2030:
“By 2030 over 70% of households and all businesses have access to reliable, affordable and modern clean energy sources”
“10.5% annual growth target” (from 2010 onwards)
“More than 60% of PNG‟s rural population will have access to electricity”
PNG Medium Term Development Plan 2011-2015:
2015 target: 27 % of households. 2020 target: 41% of households. 2025 target: 55% of households. 2030 target: At least 70%.
EMC is the overarching institution responsible for overseeing NEROP
The institutional framework set out in the EIP, including the Electricity Management Committee (EMC) and the Energy Wing of DPE, has been established, although it is arguably not yet fully effective. EMC has only met a small number of times and the Energy Wing of DPE is understaffed.
The key excerpt from the EIP is provided in the box below.
Electricity Industry Policy, 2011:
“The EMC will be established by the Government to be the overarching coordinating body to achieve the objectives of this Policy.”
Preparation of National Electrification Rollout Plan and Financing Prospectus
Institutional framework
57
DPE has clear responsibility for implementing NEROP
The EIP envisaged that the Energy Wing of the Department of Energy and Petroleum (DPE) would be secretariat to the EMC and would carry out the operational functions, namely prioritising electrification projects, allocating funding, and tendering out projects (as discussed further below).
The EIP does not envisage that DPE would actually construct and operate electrification schemes, only that it will be the implementing agency that facilitates the construction and operation contracts.
Key excerpts from the EIP are provided in the box below.
Electricity Industry Policy, 2011:
“The work of the EMC will be supported and facilitated by a Secretariat established within the DPE.”
“The operational functions and responsibilities of the EMC will be led by the DPE, with the involvement of the organizations represented in the Committee. These functions and responsibilities will include in particular, the following: Based on the National Electrification Roll-out Plan, prioritize projects under CSOs to be funded by the National Government and delivered on annual basis according to Government’s priority”
“Delivering CSOs for the electricity sector is the sole responsibility of the government Department or a designated body responsible for managing the Government’s policy on these CSOs and their administrations. It is the responsibility of the government Department or the designated body to identify and prioritize the qualified target groups or areas that would benefit from the Government’s CSO delivery.”
PPL can be directed to carry out grid extensions in non-commercially viable
areas, if funding is provided
To-date, PPL has not been explicitly obliged to carry out grid extensions, for example based on electrification targets, although the EIP does foresee this possibility so long as PPL is compensated. The EIP is not explicit about how future grid extensions will be implemented under NEROP, although it appears to assume that PPL will operate any future grid extensions (as opposed to tendering out both the construction and operation, as per mini-grids).
The EIP makes it clear that PPL will not be expected to undertake unprofitable grid extensions. PPL may apply for Community Service Obligation funding in such cases.
PPL’s exclusive zone is only 10km of its existing network (and customers with load >10MW are excluded), so third parties are already free to apply for a license to supply power in all other areas.
Key excerpts from the EIP are provided in the box below.
Preparation of National Electrification Rollout Plan and Financing Prospectus
Institutional framework
58
Electricity Industry Policy, 2011:
“PPL has been granted exclusive rights to retail electricity in areas in which it supplied power together with a 10 km surrounding zone at the time of issue of its licence.”
“State financing towards these network extension projects will solely and independently be determined by the Government in line with its priority for electrification and not influenced by PPL’s request for assistance. All “profitable” ventures to PPL in this area of supply will not be subsidized by the Government as they do not qualify for State financing. The economic regulator will require adequate access to information on PPL to assist the Government to properly assess and determine this.”
EIP states that off-grid electrification will be competitively tendered out
The EIP envisages that power supply to rural areas that are isolated from the main grids are tendered out, with the private sector and PPL (if it chooses) competing for capital subsidies. The tariff in those areas will be set by ICCC on a cost-recovery basis (such that, presumably, no operational subsidy is required). To-date, no new isolated/mini-grids have been implemented.
Key excerpts from the EIP are provided in the box below.
Electricity Industry Policy, 2011:
“Where rural electrification priorities of the Government in line with its CSOs warrant it, and as it deems efficient, the Government will continue to subsidize existing producers in the area to progress rural electrification. Otherwise, the Government will open up competition for fresh entry into the market and subsidize the construction of new electricity assets, through the appropriate process it administers”
“Manage a public tender process and screen proposals for electrification investment projects under CSOs in accordance with the rules of the Central Supply and Tenders Board (CSTB)”
“The EMC will operate in accordance with the rules and guidelines established for the tendering of work by the Central Supply and Tenders Board (CSTB) and liaise closely with the CSTB in implementing the competitive tender process”
The private sector is to play a key role in electrification
There is clear policy direction that NEROP will include a strong emphasis on private sector participation, from the overarching Papua New Guinea Vision 2050 down to the detail of the EIP. As above, the EIP envisages that new electrification projects will be competitively tendered.
The private sector is already able to establish new grids outside of PPL’s exclusive area, so long as it is granted a licence by ICCC (the terms of which are not onerous). The PPP centre must approve any significant transactions involving private sector financing. The EIP foresees that the private sector will own any electricity assets it finances.
Preparation of National Electrification Rollout Plan and Financing Prospectus
Institutional framework
59
Key excerpts from the relevant policy documents are provided in the box below.
Vision 2050:
“The implementation of the Public Private Partnerships (PPPs) and community services obligation policy in the medium-term and long-term will enable private sector participation and contribution to infrastructure development and other service delivery initiatives”
Electricity Industry Policy, 2011:
“IPPs can take the opportunity to compete with PPL for the money that the State makes available for funding the Government’s CSOs. In this arrangement, the State will subsidize through competitive tender the most efficient bidder, particularly in terms of the tender for the lowest amount of subsidy, to develop, own and operate the electricity infrastructure in the market.”
“For electricity projects that should be developed under a PPP model, the EMC will trigger the process and work closely with the National PPP Centre who will lead in the whole process of PPP transaction to facilitate PPL’s partnership with potential service providers.”
Electricity Industry Policy, 2011: “It is intended that the developers of electricity assets that are developed with some State subsidy would own and operate these assets on commercial basis.”
National Public Private Partnership Policy, 2014:
“Under a PPP, the asset may not be ultimately owned by the public sector, however, PPPs involve a long term financial commitment by the public sector through payments to the private sector, to allow the private sector to recoup the cost of their investment”
“All projects of PGK 50 million or more must be submitted to the PPP Centre to test whether a PPP would be the most suitable modality.”
“This Act applies to all Relevant Public Bodies [defined to include State Owned Enterprises]”
Electricity Industry Act, 2002:
“The operations in the electricity supply industry for which a licence is required are: (a) the generation of electricity; and (b) the operation of a transmission or distribution network; and (c) the retailing of electricity; and (d) other operations for which a licence is required by the regulations.”
Provincial local governments will also play a key role in funding and possibly
implementing electrification projects
The federal nature of PNG’s Government (as defined primarily in the Organic Law) means that local governments, be it at the Provincial, District, or Local-Level Government, have some responsibilities for electricity provision.
In particular, the District Development Authorities Act makes District Development Authorities (DDAs) responsible for providing infrastructure services, but whether or not that includes power supply is subject to a ministerial determination on a case-by-case basis. We are not aware of any such ministerial determinations with respect to power supply as yet.
Preparation of National Electrification Rollout Plan and Financing Prospectus
Institutional framework
60
The EIP recognises that its policy directives to centralise electricity provision, either by being supplied by PPL’s grid or supply being tendered out by DPE, are potentially at odds with the Organic Law (and the resulting DDA Act) and therefore recognises that the approach may have to vary province-by-province to reflect local laws and the on-the-ground circumstances.
Key excerpts from the relevant policy documents are provided in the box below.
Electricity Industry Policy, 2011:
“Work with the Provincial or Local Level Governments (LLGs), individual Members of the National Parliament seeking assistance with the delivery of electrification projects, should they be seeking to utilize their provincial funds, district support grants or Parliamentary discretionary funds and development funding, for electrification purposes. Such resources could be used as counterpart funding to prioritize projects identified as priorities for rural electrification”
“Any arrangement that the National Government establishes with LLGs for the supply of electricity under the National Government’s CSOs may impinge or have implications on the ambit of the OLPLLG. All such arrangements should be done within the provisions of this mandate, and therefore done through the provincial governments, who would be the channel for this national government intervention.”
“The provincial governments, under their Development Plans, will identify electrification needs and present such plans to the EMC”
“The provincial governments can put in place arrangements to work with the EMC to initiate competitive tendering for subsidized supply of electricity services to these centres by IPPs”
Organic Law on Provincial Governments and Local-level Governments, 1998:
“Subject to the Constitution, this Organic Law, and a Provincial Government law, a Local-level Government may make laws on the following subject matters: (f) Provision of electricity”
District Development Authority Act, 2014:
“The Minister shall determine the service delivery functions and responsibilities of each District Development Authority in consultation with the Board and the Provincial Executive Council”
A robust licensing and tariff regulatory regime is already in place, although it
may be transferred to a new entity
The Independent Consumer Competition Commission (ICCC) has had responsibility for the economic regulation of the power sector since 2002. In our view, the regulatory regime established by the ICCC is robust and to an international standard.
Technical regulation of PPL is less ideal. ICCC were originally delegated responsibility, but without any technical staff, ICCC delegated the role to PPL (which was a reasonable approach, given that PPL was the national supplier). The EIP envisaged third-party suppliers/retailers, which requires that technical regulation be carried out by an independent party. Responsibility was meant to be transferred to DPE, but without the Energy Wing having adequate resources this has not yet happened.
Preparation of National Electrification Rollout Plan and Financing Prospectus
Institutional framework
61
It is important to note that in PNG political influence sometimes runs counter to regulatory rules and decisions, which impacts negatively on PPL’s performance16. For example, ICCC approved tariff increases in 2013, but PPL has not implemented them (to the detriment of its financial performance), presumably due to media statements by senior politicians. Some of PPL’s recent decisions to sign up to new Power Purchase Agreements do not appear to be least-cost17, which may have come about due to influence by politicians and/or board members. This is certainly not an uncommon phenomenon, but underlines the importance of insulating the institutions responsible for implementing NEROP from political interference.
Key excerpts from the EIP are provided in the box below.
Electricity Industry Policy, 2011:
“The technical regulatory functions will be transferred from the ICCC to DPE, in a process that will ultimately establish DPE as the mandated technical regulator of the electricity industry”
“The ICCC will retain and perform all economic regulatory functions in the electricity industry, as economic regulator”
EMC and DPE will lead monitoring of NEROP, with assistance from DNPM and
Kumul Consolidated Holdings
The EIP envisages that EMC will monitor the national electrification rollout, with most of the day-to-day work being carried out by its secretariat, DPE.
The Department of National Planning and Monitoring (DNPM) also have statutory obligations with respect to monitoring the performance of public enterprises and plays a key role as a member of the EMC.
Treasury plays a key role in administering the Community Service Obligation (CSO) policy and fund (as described in Section 6), and would therefore also play a role in monitoring implementation of NEROP.
PPL’s shareholder, the Independent Public Business Coordination, was recently restructured and renamed Kumul Consolidated Holdings Ltd (KCH). This has implications for the governance of PPL as a whole, but does not directly affect PPL’s future role in electrification.
Key excerpts from the relevant policy documents are provided in the box below.
Electricity Industry Policy, 2011
“An independent review will be undertaken once every two years on the implementation of the Policy. The EMC will decide on how this independent review will be instituted and progressed. The
16 http://pidp.eastwestcenter.org/pireport/2016/March/03-16-03.htm 17 As identified Grid Development Rapid Review, ECA, February 2016. These decisions were made without conforming to the ICCC’s Third Party Access Code regulations.
Preparation of National Electrification Rollout Plan and Financing Prospectus
Institutional framework
62
review should ascertain whether the stated policy goals and objectives are or have been achieved during the implementation process.”
“The DNPM will lead other members of the EMC in the development of an implementation, monitoring and evaluation framework for this Policy. This framework will include specific performance benchmarks to be achieved.”
“Independent Public Business Corporation will monitor the performance of PPL, and in particular implement disciplines relating to reporting requirements and information disclosure.”
Community Service Obligation Guidelines, 2012:
“Monitoring will be undertaken at least annually for input into the budget cycle. The Purchasing Department will be responsible to ensure appropriate performance monitoring is undertaken with support from Treasury and DNPM.”
5.2.2 Existing institutional capacity
PPL has dedicated rural electrification teams, but they have limited capacity to
implement large rollout projects
In its 2015 Power Development Plan PPL estimates that it has historically constructed power lines throughout PNG at the rate of about 70 km per annum and connected 30 new customers per km of distribution line, i.e. around 2,100 new connections per year. This is much less than what will be needed under NEROP.
At present electrification is carried out by the Rural Electrification Services team within PPL (for Government funded projects) or by dedicated project units (for development partner funded projects).
The Rural Electrification Services team comprises of 65 permanent staff. This includes a technical team in each of PPL’s five regions, comprising approximately six staff in each. The head office team is comprised of around 35 administrative staff. The team also makes use of more than 100 casual staff (predominantly linesmen) on a project-by-project basis. The team’s responsibilities with respect to MV/LV grid extension include investigation/feasibility studies, surveys, design, procurement and construction. Historically all of these tasks have been done internally, while in recent years PPL has started to contract out some services, namely the surveying and construction. Experience using private sector contractors is mixed. The Rural Electrification Services team does not connect households; this is done by a separate team within PPL.
Recent experience implementing grid rollouts shows that PPL’s capacity is constrained and that delays are frequent. For example, on the Town Electrification Investment Programme (TEIP), financed through an ADB loan, PPL is used its internal staff to construct the line, yet only 3km of a total of 130km of line had been constructed in three months (as at late 2015). Some of these delays, but not all, are due to land issues.
One of the key challenges identified by the Rural Electrification Services team is PPL’s procurement processes, which are cumbersome. For example, any project over PGK500,000 requires Board approval and the Board only meets quarterly.
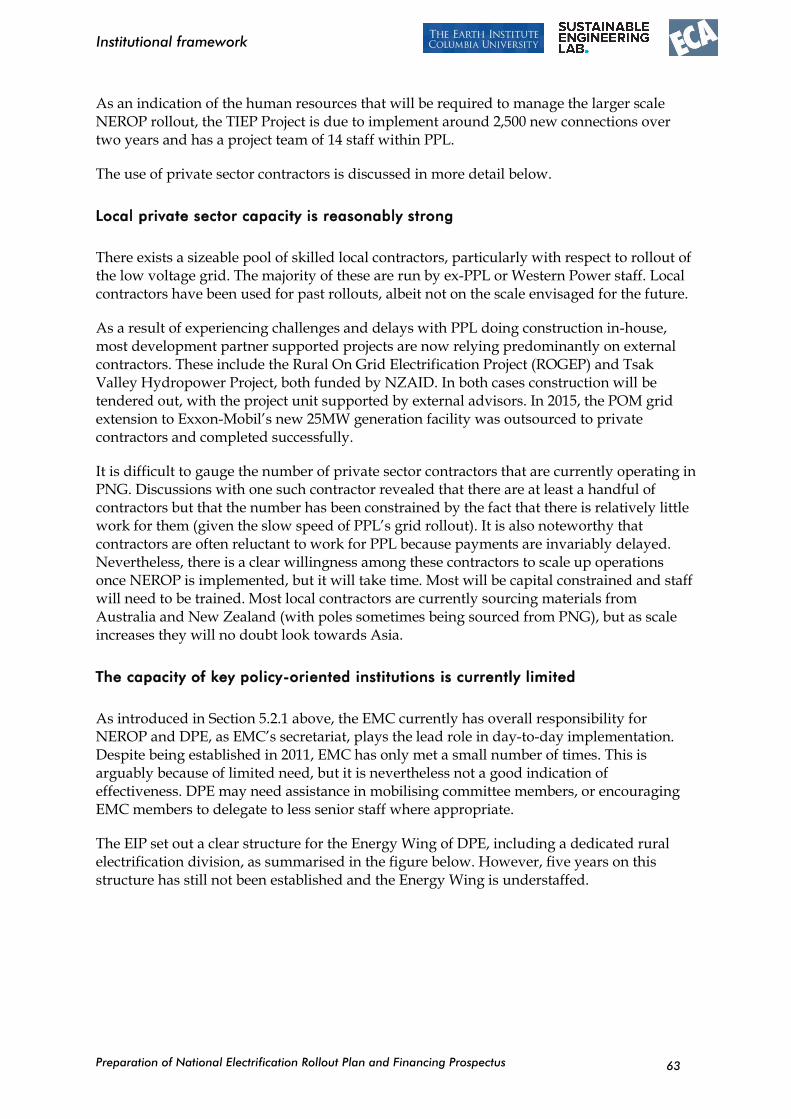
Preparation of National Electrification Rollout Plan and Financing Prospectus
Institutional framework
63
As an indication of the human resources that will be required to manage the larger scale NEROP rollout, the TIEP Project is due to implement around 2,500 new connections over two years and has a project team of 14 staff within PPL.
The use of private sector contractors is discussed in more detail below.
Local private sector capacity is reasonably strong
There exists a sizeable pool of skilled local contractors, particularly with respect to rollout of the low voltage grid. The majority of these are run by ex-PPL or Western Power staff. Local contractors have been used for past rollouts, albeit not on the scale envisaged for the future.
As a result of experiencing challenges and delays with PPL doing construction in-house, most development partner supported projects are now relying predominantly on external contractors. These include the Rural On Grid Electrification Project (ROGEP) and Tsak Valley Hydropower Project, both funded by NZAID. In both cases construction will be tendered out, with the project unit supported by external advisors. In 2015, the POM grid extension to Exxon-Mobil’s new 25MW generation facility was outsourced to private contractors and completed successfully.
It is difficult to gauge the number of private sector contractors that are currently operating in PNG. Discussions with one such contractor revealed that there are at least a handful of contractors but that the number has been constrained by the fact that there is relatively little work for them (given the slow speed of PPL’s grid rollout). It is also noteworthy that contractors are often reluctant to work for PPL because payments are invariably delayed. Nevertheless, there is a clear willingness among these contractors to scale up operations once NEROP is implemented, but it will take time. Most will be capital constrained and staff will need to be trained. Most local contractors are currently sourcing materials from Australia and New Zealand (with poles sometimes being sourced from PNG), but as scale increases they will no doubt look towards Asia.
The capacity of key policy-oriented institutions is currently limited
As introduced in Section 5.2.1 above, the EMC currently has overall responsibility for NEROP and DPE, as EMC’s secretariat, plays the lead role in day-to-day implementation. Despite being established in 2011, EMC has only met a small number of times. This is arguably because of limited need, but it is nevertheless not a good indication of effectiveness. DPE may need assistance in mobilising committee members, or encouraging EMC members to delegate to less senior staff where appropriate.
The EIP set out a clear structure for the Energy Wing of DPE, including a dedicated rural electrification division, as summarised in the figure below. However, five years on this structure has still not been established and the Energy Wing is understaffed.
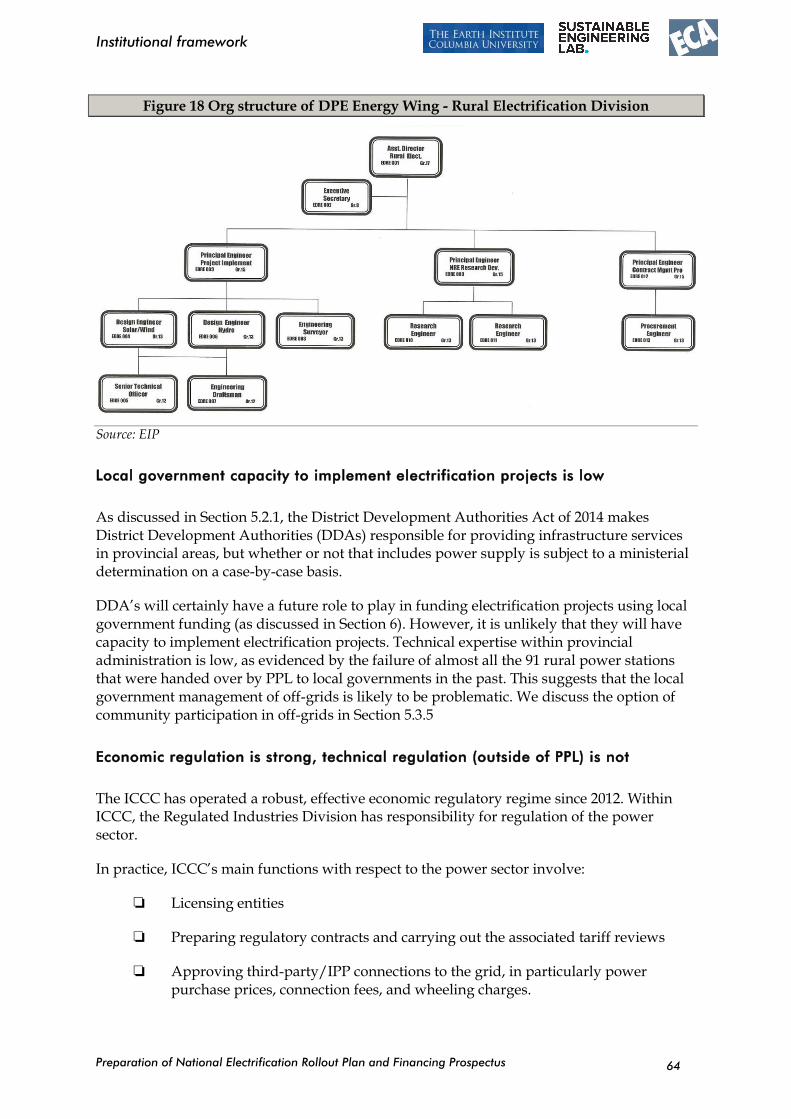
Preparation of National Electrification Rollout Plan and Financing Prospectus
Institutional framework
64
Figure 18 Org structure of DPE Energy Wing - Rural Electrification Division
Source: EIP
Local government capacity to implement electrification projects is low
As discussed in Section 5.2.1, the District Development Authorities Act of 2014 makes District Development Authorities (DDAs) responsible for providing infrastructure services in provincial areas, but whether or not that includes power supply is subject to a ministerial determination on a case-by-case basis.
DDA’s will certainly have a future role to play in funding electrification projects using local government funding (as discussed in Section 6). However, it is unlikely that they will have capacity to implement electrification projects. Technical expertise within provincial administration is low, as evidenced by the failure of almost all the 91 rural power stations that were handed over by PPL to local governments in the past. This suggests that the local government management of off-grids is likely to be problematic. We discuss the option of community participation in off-grids in Section 5.3.5
Economic regulation is strong, technical regulation (outside of PPL) is not
The ICCC has operated a robust, effective economic regulatory regime since 2012. Within ICCC, the Regulated Industries Division has responsibility for regulation of the power sector.
In practice, ICCC’s main functions with respect to the power sector involve:
Licensing entities
Preparing regulatory contracts and carrying out the associated tariff reviews
Approving third-party/IPP connections to the grid, in particularly power purchase prices, connection fees, and wheeling charges.
Preparation of National Electrification Rollout Plan and Financing Prospectus
Institutional framework
65
PPL still have responsibility for technical regulation in the industry, despite the EIP envisaging responsibility being transferred to DPE. This is largely due to the fact that there is limited technical expertise in the public sector outside of PPL. There is an urgent need to transfer technical regulation away from PPL given the increasing role that third-parties are playing the power sector. This is also important for the implementation of NEROP.
While there are clear advantages to establishing ICCC as the dedicated energy sector regulator, in particular the economies of scope in bringing together the economic and technical regulation, there is a serious risk that ICCC’s strong capacity and track record gets diluted and that regulation becomes more politicised. This poses a serious risk to NEROP, given the importance of the regulatory framework.
Development partners have a strong presence and capacity in the PPL sector,
however there is limited coordination between the various partner
Development partners have played a key role in funding past electrification projects. Partners active in the power sector in PNG include:
The World Bank Group (including both the International Bank for Reconstruction and Development and the International Finance Corporation)
Asian Development Bank (ADB)
Japan International Cooperation Agency (JICA)
Australian Department of Foreign Affairs and Trade (DFAT)
New Zealand Ministry of Foreign Affairs and Trade (MFAT)
European Union (EU)
United Nations (UN)
To-date funding has occurred on a project-by-project basis and no sector-wide approach has been established, although there is significant cooperation and communication between the development partners.
5.2.3 Summary of strengths and weaknesses
The figure below provides an overview of the key stakeholders involved in electrification in PNG. In following table provides a summary of the strengths and weaknesses of PNG’s institutional framework, as described in the preceding sections.
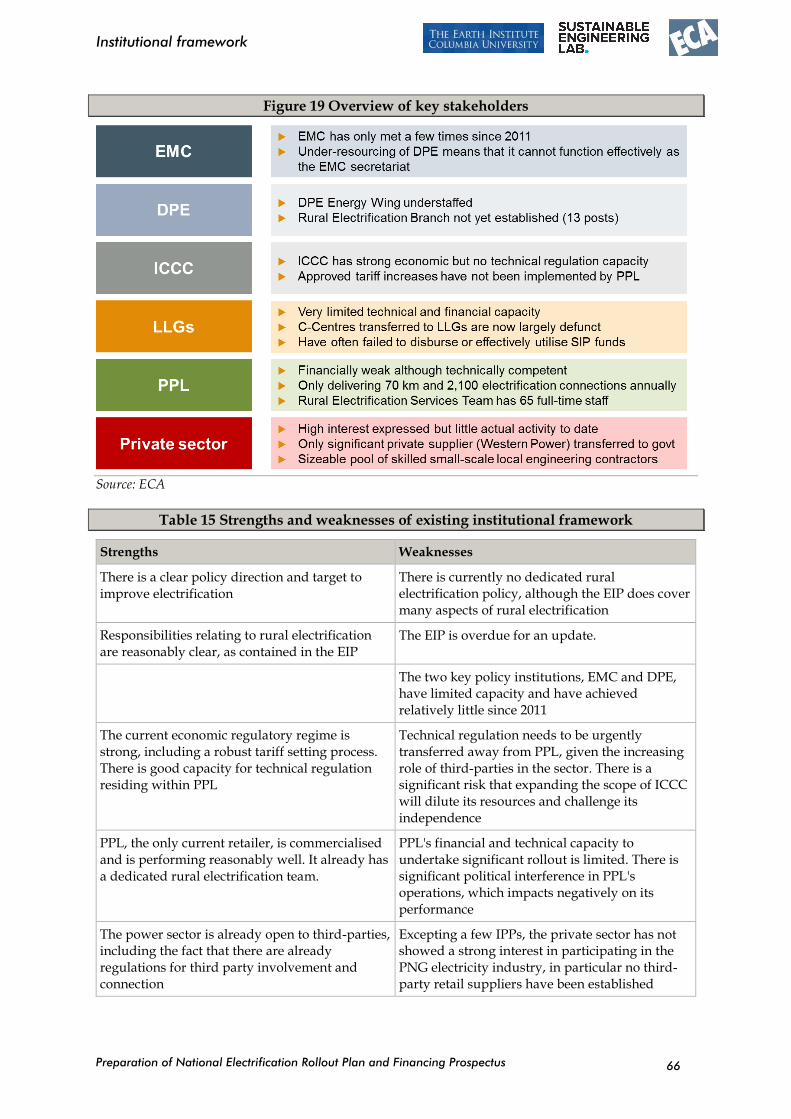
Preparation of National Electrification Rollout Plan and Financing Prospectus
Institutional framework
66
Figure 19 Overview of key stakeholders
Source: ECA
Table 15 Strengths and weaknesses of existing institutional framework
Strengths Weaknesses
There is a clear policy direction and target to improve electrification
There is currently no dedicated rural electrification policy, although the EIP does cover many aspects of rural electrification
Responsibilities relating to rural electrification are reasonably clear, as contained in the EIP
The EIP is overdue for an update.
The two key policy institutions, EMC and DPE, have limited capacity and have achieved relatively little since 2011
The current economic regulatory regime is strong, including a robust tariff setting process. There is good capacity for technical regulation residing within PPL
Technical regulation needs to be urgently transferred away from PPL, given the increasing role of third-parties in the sector. There is a significant risk that expanding the scope of ICCC will dilute its resources and challenge its independence
PPL, the only current retailer, is commercialised and is performing reasonably well. It already has a dedicated rural electrification team.
PPL's financial and technical capacity to undertake significant rollout is limited. There is significant political interference in PPL's operations, which impacts negatively on its performance
The power sector is already open to third-parties, including the fact that there are already regulations for third party involvement and connection
Excepting a few IPPs, the private sector has not showed a strong interest in participating in the PNG electricity industry, in particular no third-party retail suppliers have been established
Preparation of National Electrification Rollout Plan and Financing Prospectus
Institutional framework
67
Strengths Weaknesses
There are a number of different private sector contractors that have been used successfully to carry out grid extensions
Development of private sector expertise has been constrained by a shortage in work and will take time to increase to the scale required for a large scale rollout
Development partners have played a key role in past electrification in PNG and expect strong continuing involvement in the sector
Development partners apply a project-by-project approach, there is no sector wide approach
Source: ECA
5.3 Evaluation of options
In this section we describe and evaluate a number of different institutional models that could be applied in PNG to implement NEROP.
5.3.1 Introduction
Key ingredients of a successful model
A number of studies18 have reviewed rural electrification programs internationally and identified the key reasons for their successes and failures. From these, we can identify the key ingredients of success, which are summarised as follows:
The exact institutional structure is not critical, given that international experience shows that a variety of approaches have been successful. It is more important that the structure suits the specific circumstances of the particular country.
The agency with overall responsibility for implementation needs a high degree
of operating autonomy and it should be shielded from political interference, particularly with respect to the selection of projects/communities. This means the agency needs strong, capable, and dedicated leadership.
The implementing agency’s primary focus should be on electrification and it
must be held accountable, for example through strict targets.
There should be a strong institutional support structure, particularly the policy-making ministry and the power sector regulator.
18 Particularly useful studies, include (1) Achieving Universal Access to Modern Energy in East Asia and the Pacific, The World Bank, 2011 (2) Meeting the Challenge of Rural Electrification in Developing Nations, Douglas F Barnes, 2005, (3) Review of Experiences with Rural Electrification Agencies, Lessons for Africa, EUEI-PDF, 2008, (4) How Small Power Producers and Mini-Grids Can Deliver Electrification and Renewable Energy in Africa, Bernard Tenenbaum et al, 2014
Preparation of National Electrification Rollout Plan and Financing Prospectus
Institutional framework
68
A clear system for ranking and/or prioritising areas for obtaining a supply should be established and a multi-year plan defined, to ensure adequate resources are committed and political interference is minimised.
Economies of scale and scope is important to reducing the cost of construction and operation of the system and to reducing the transaction cost of implementing projects.
The companies providing retail supply of electricity must be technically and
financially strong to ensure services are operated sustainably.
For small-scale service providers to succeed, there should be a strong supply
chain (including equipment installers, consultants, project developers, financiers).
The program should endeavour to utilise the technical expertise and capital of
the private sector, so long as it does not constrain implementation.
Community support and involvement can be very valuable to the success of new schemes, particularly in remote rural areas.
Later in this section, we use these ingredients as a means of evaluating the institutional/ regulatory options available to PNG.
Key characteristics of Papua New Guinea
As above, one of the key ingredients to the successful implementation of rural electrification programs is that the institutional framework matches the specific circumstances of the country-at-hand. PNG is unique in many respects and therefore it is not realistic to simply copy the model applied in another country. Some of the unique challenges facing rural electrification in PNG are summarised in the table below and are described in more detail in Section 5.2.
Table 16 Key characteristics of PPL sector
Demographics Power sector
Low population Expensive cost of supply, partly due to challenging geography
Low population density State-owned, vertically-integrated electricity provider (although reforms planned)
Low income per capita Reasonably performing, commercialised utility, but financially and capacity constrained
High rural population Strong economic regulatory framework
Significant political influence
Limited private sector involvement / track record
Capacity constrained policy makers
Potentially strong fiscal revenues from commodities (although this is looking less likely based on current gas prices)
Federal/decentralised governance
Preparation of National Electrification Rollout Plan and Financing Prospectus
Institutional framework
69
Source: ECA
Later in this section, we use these key characteristics as a means of evaluating the institutional options available to PNG.
Selection of key options
The primary distinction between most countries’ approach to rural electrification is whether they took a centralised or decentralised approach. This essentially means whether the national utility played the leading role in grid rollout and the establishment of new off-grids, or whether there were multiple private or community-based operators throughout the country.
The trade-off can be summarised as:
“Whether the natural cost-advantages of centralised rural electrification from economies of scale (in finance, investments and management) and of scope (integration of planning, securing of investment finance and implementation) are superior to the competitive forces of unleashing multiple private actors in de-centralised RE, or vice-versa?”19
The evidence from experience internationally suggests that a centralised approach is generally more successful in achieving new connections quickly, so long as the power company in charge is reasonably capable and efficient. This is not a surprising result after all, given the challenges in making rural electrification commercially viable for the private sector.
A decentralised approach has been taken in many countries in an effort to circumvent the weak capacity of the centralised utility, with mixed results. Of the factors that contribute to the successful implementation of a decentralised approach, a clear regulatory framework and funding mechanism is the most important. The private sector will simply not be interested in investing if the framework does not minimise their risks and guarantee commercial viability. International experience shows that a decentralised approach tends to have an improved chance of success when a country is first starting its electrification program. This is because as the country gets electrified, it gets progressively more expensive to provide access and therefore more challenging to make investments viable for the private sector.
It is, of course, possible to combine the centralised and decentralised approaches, usually by giving the central utility the key role in grid expansion and the private sector the key role in establishing off-grid solutions. In the following sub-sections, we explore four key approaches that all sit within the centralised>decentralised spectrum.
Countries reviewed
In identifying the key options and recommend an appropriate institutional framework for Papua New Guinea, we have reviewed the experience of numerous countries with respect to rural electrification. These include Burkina Faso, Cambodia, Chile, Costa Rica, Ethiopia,
19 Review of Experiences with Rural Electrification Agencies, Lessons for Africa, EUEI-PDF, 2008
Preparation of National Electrification Rollout Plan and Financing Prospectus
Institutional framework
70
Ghana, Guatemala, Kenya, Lao PDR, Mali, Mexico, Morocco, Myanmar, Rwanda, Thailand, Uganda, and Vietnam.
As described above, it is not appropriate just to copy one country’s approach and apply it in PNG. Therefore, in the following sections, rather than catalogue the approaches in all these countries, we focus on picking out key features that are particularly relevant to the challenges faced in PNG.
5.3.2 Centralised implementation: PPL plays the lead role
Overview of approach
Under this option PPL would be the lead entity responsible for rural electrification, including undertaking grid extensions, establishing mini-grids, and installing solar home systems. PPL would be the only retail supplier nationally. In practise, this would require establishing a separate division within PPL (which is a significantly beefed up version of the existing rural electrification team), and/or possibly a subsidiary company that implements and manages the mini-grids.
Key advantages and disadvantages
The key advantage of this approach is that it utilises the fact that PPL has the vast majority of existing technical and commercial capacity in PNG. A fully centralised approach has the potential to deliver the quickest results by utilising PPL’s economies of scale. This is borne out in international experience, for example the success of countries such as Vietnam in the rapid electrification of the country by the national utility. Given that the private sector has never before provided retail services in PNG, it is hard to imagine that a widespread electrification plan can be implemented without significant involvement from PPL.
However, PPL is already under significant operational and financial strain. This makes PNG in contrast to the international success stories of centralised implementation, most of which have had involved strong, well-funded central utilities. Giving PPL sole responsibility for an ambitious electrification plan under the current political and commercial environment would likely put PPL in a precarious position.
In particular, PPL is already operating a small number of isolated systems at a significant loss, largely because political pressure prevents it from charging grid-specific tariffs (i.e. higher tariffs in remote areas).20 Increasing the number of these mini-grids dramatically without insulating PPL from the financial consequences would jeopardise all of its operations, unless there is a significant shift in political support for cost-recovery tariffs. The other key concern is resource capacity within PPL to undertake all of the rollout. PPL has the majority of the existing capacity within the electricity sector, but its capacity is still constrained and it would struggle to quickly establish numerous new systems in remote areas.
20 As described in Section 5.2, the regulations allow PPL to charge different tariffs for different grids, but as yet it has opted not to (due to social and political pressure)
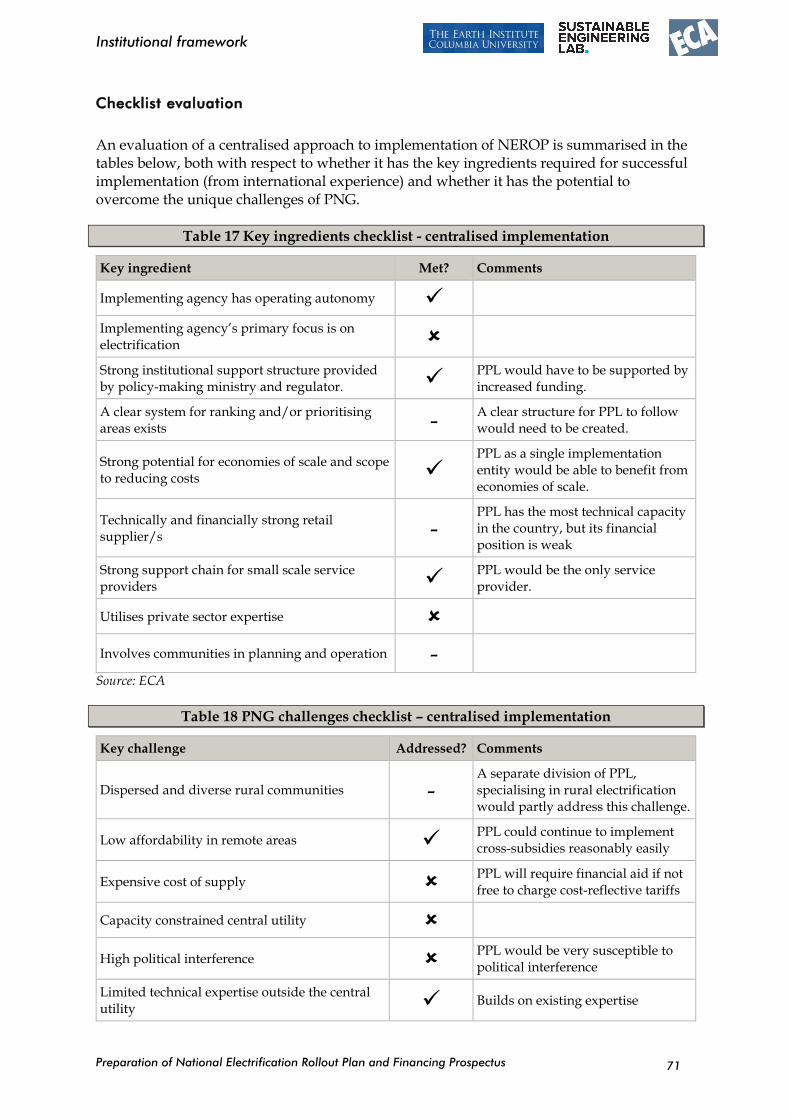
Preparation of National Electrification Rollout Plan and Financing Prospectus
Institutional framework
71
Checklist evaluation
An evaluation of a centralised approach to implementation of NEROP is summarised in the tables below, both with respect to whether it has the key ingredients required for successful implementation (from international experience) and whether it has the potential to overcome the unique challenges of PNG.
Table 17 Key ingredients checklist - centralised implementation
Key ingredient Met? Comments
Implementing agency has operating autonomy ✓
Implementing agency’s primary focus is on electrification
Strong institutional support structure provided by policy-making ministry and regulator. ✓
PPL would have to be supported by increased funding.
A clear system for ranking and/or prioritising areas exists -
A clear structure for PPL to follow would need to be created.
Strong potential for economies of scale and scope to reducing costs ✓
PPL as a single implementation entity would be able to benefit from economies of scale.
Technically and financially strong retail supplier/s -
PPL has the most technical capacity in the country, but its financial position is weak
Strong support chain for small scale service providers ✓
PPL would be the only service provider.
Utilises private sector expertise
Involves communities in planning and operation -
Source: ECA
Table 18 PNG challenges checklist – centralised implementation
Key challenge Addressed? Comments
Dispersed and diverse rural communities - A separate division of PPL, specialising in rural electrification would partly address this challenge.
Low affordability in remote areas ✓ PPL could continue to implement cross-subsidies reasonably easily
Expensive cost of supply PPL will require financial aid if not free to charge cost-reflective tariffs
Capacity constrained central utility
High political interference PPL would be very susceptible to political interference
Limited technical expertise outside the central utility ✓ Builds on existing expertise
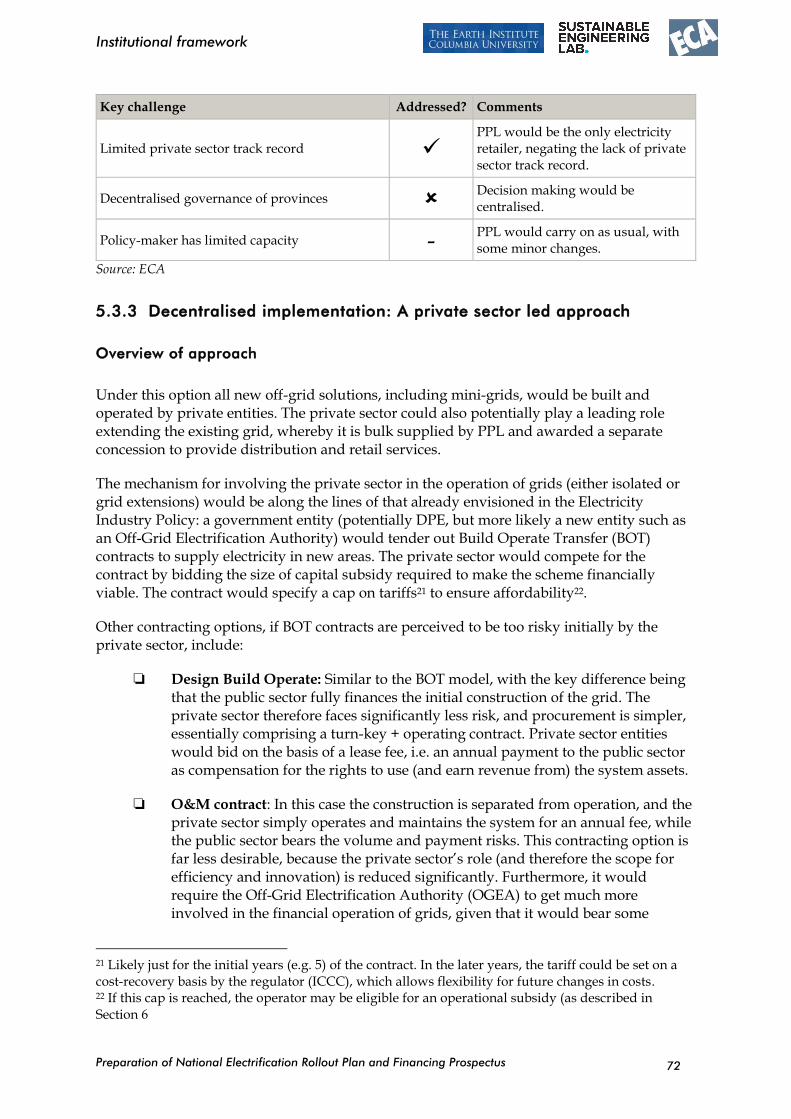
Preparation of National Electrification Rollout Plan and Financing Prospectus
Institutional framework
72
Key challenge Addressed? Comments
Limited private sector track record ✓
PPL would be the only electricity retailer, negating the lack of private sector track record.
Decentralised governance of provinces Decision making would be centralised.
Policy-maker has limited capacity - PPL would carry on as usual, with some minor changes.
Source: ECA
5.3.3 Decentralised implementation: A private sector led approach
Overview of approach
Under this option all new off-grid solutions, including mini-grids, would be built and operated by private entities. The private sector could also potentially play a leading role extending the existing grid, whereby it is bulk supplied by PPL and awarded a separate concession to provide distribution and retail services.
The mechanism for involving the private sector in the operation of grids (either isolated or grid extensions) would be along the lines of that already envisioned in the Electricity Industry Policy: a government entity (potentially DPE, but more likely a new entity such as an Off-Grid Electrification Authority) would tender out Build Operate Transfer (BOT) contracts to supply electricity in new areas. The private sector would compete for the contract by bidding the size of capital subsidy required to make the scheme financially viable. The contract would specify a cap on tariffs21 to ensure affordability22.
Other contracting options, if BOT contracts are perceived to be too risky initially by the private sector, include:
Design Build Operate: Similar to the BOT model, with the key difference being that the public sector fully finances the initial construction of the grid. The private sector therefore faces significantly less risk, and procurement is simpler, essentially comprising a turn-key + operating contract. Private sector entities would bid on the basis of a lease fee, i.e. an annual payment to the public sector as compensation for the rights to use (and earn revenue from) the system assets.
O&M contract: In this case the construction is separated from operation, and the private sector simply operates and maintains the system for an annual fee, while the public sector bears the volume and payment risks. This contracting option is far less desirable, because the private sector’s role (and therefore the scope for efficiency and innovation) is reduced significantly. Furthermore, it would require the Off-Grid Electrification Authority (OGEA) to get much more involved in the financial operation of grids, given that it would bear some
21 Likely just for the initial years (e.g. 5) of the contract. In the later years, the tariff could be set on a cost-recovery basis by the regulator (ICCC), which allows flexibility for future changes in costs. 22 If this cap is reached, the operator may be eligible for an operational subsidy (as described in Section 6
Preparation of National Electrification Rollout Plan and Financing Prospectus
Institutional framework
73
volume/revenue risk (for example, if tariff revenues are significant less or more than the O&M fee).
In our view, BOT and DBO contract would be the preferred models to implement a decentralised approach. We would not recommend implementing O&M contracts, because the Off-Grid Electrification Authority (OGEA) should remain independent from operational issues, or it risks becoming a fully-fledged retailer than simply a management company.
Key advantages and disadvantages
The key advantages of major private sector involvement (particularly under a BOT type contract) are that it would:
Utilise private sector capital: Thereby reducing the burden on the public sector to finance the significant upfront costs of electrification
Tap into the expertise and experience of international operators: This helps circumvent capacity constraints on PPL. With time, local private sector expertise and capability would also grow, to the point where PNG might have a thriving electricity industry benefiting from competitive pressure. This is the vision of the Electricity Industry Policy.
De-politicise tariffs: New operators will have separate regulatory contracts and tariff calculations, which should make justifying grid-specific (i.e. cost-recovery) tariffs easier and make tariffs less prone to political interference.
Local management by multiple operators: PNG has a sparse population and a very challenging geography, which means that some of the isolated systems will be very difficult to manage by a central utility. Having multiple operators makes it easier to establish effective local management.
However, the reality is that PNG has no past track record with the private sector operating grids23 and it will likely be very difficult to incentivise the private sector to operate in remote rural areas. This is due to both the financial reality – a large subsidy will likely be needed to recover costs – and the practical difficulties of providing retail services in these areas. With time and experience (once it has been clearly demonstrated that these grids can be commercially viable under a sound regulatory framework), the private sector will be more willing to get involved, but in the early days of NEROP we expect that it will be difficult to involve the private sector. It is noteworthy that for a number of years (since the Electricity Industry Policy was formulated) the private sector has been allowed to establish private networks outside of PPL’s exclusive zone, but has declined to do so, even in areas that would be the ‘low hanging fruit’ with respect to financial viability. In our view, committing fully to a private sector led approach risks very slow results initially. This is evidenced by experience in countries such as Chile.
Perceived risk by the private sector also means increased costs. Public utilities such as PPL will initially be better positioned to manage the risks related to providing retail services to rural areas and should therefore be cheaper. In addition, a fully private sector approach
23 Except arguably Western Power, although in practice it operated a heavily loss-making community service.
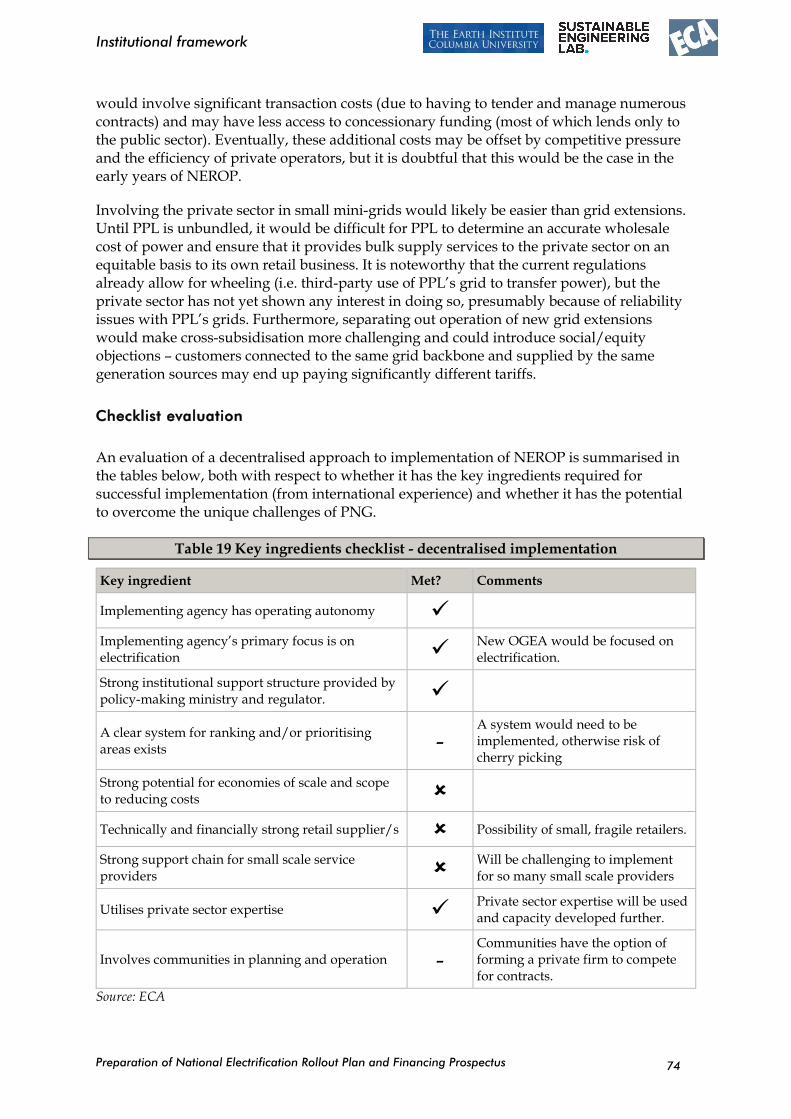
Preparation of National Electrification Rollout Plan and Financing Prospectus
Institutional framework
74
would involve significant transaction costs (due to having to tender and manage numerous contracts) and may have less access to concessionary funding (most of which lends only to the public sector). Eventually, these additional costs may be offset by competitive pressure and the efficiency of private operators, but it is doubtful that this would be the case in the early years of NEROP.
Involving the private sector in small mini-grids would likely be easier than grid extensions. Until PPL is unbundled, it would be difficult for PPL to determine an accurate wholesale cost of power and ensure that it provides bulk supply services to the private sector on an equitable basis to its own retail business. It is noteworthy that the current regulations already allow for wheeling (i.e. third-party use of PPL’s grid to transfer power), but the private sector has not yet shown any interest in doing so, presumably because of reliability issues with PPL’s grids. Furthermore, separating out operation of new grid extensions would make cross-subsidisation more challenging and could introduce social/equity objections – customers connected to the same grid backbone and supplied by the same generation sources may end up paying significantly different tariffs.
Checklist evaluation
An evaluation of a decentralised approach to implementation of NEROP is summarised in the tables below, both with respect to whether it has the key ingredients required for successful implementation (from international experience) and whether it has the potential to overcome the unique challenges of PNG.
Table 19 Key ingredients checklist - decentralised implementation
Key ingredient Met? Comments
Implementing agency has operating autonomy ✓
Implementing agency’s primary focus is on electrification ✓
New OGEA would be focused on electrification.
Strong institutional support structure provided by policy-making ministry and regulator. ✓
A clear system for ranking and/or prioritising areas exists -
A system would need to be implemented, otherwise risk of cherry picking
Strong potential for economies of scale and scope to reducing costs
Technically and financially strong retail supplier/s Possibility of small, fragile retailers.
Strong support chain for small scale service providers
Will be challenging to implement for so many small scale providers
Utilises private sector expertise ✓ Private sector expertise will be used and capacity developed further.
Involves communities in planning and operation -
Communities have the option of forming a private firm to compete for contracts.
Source: ECA
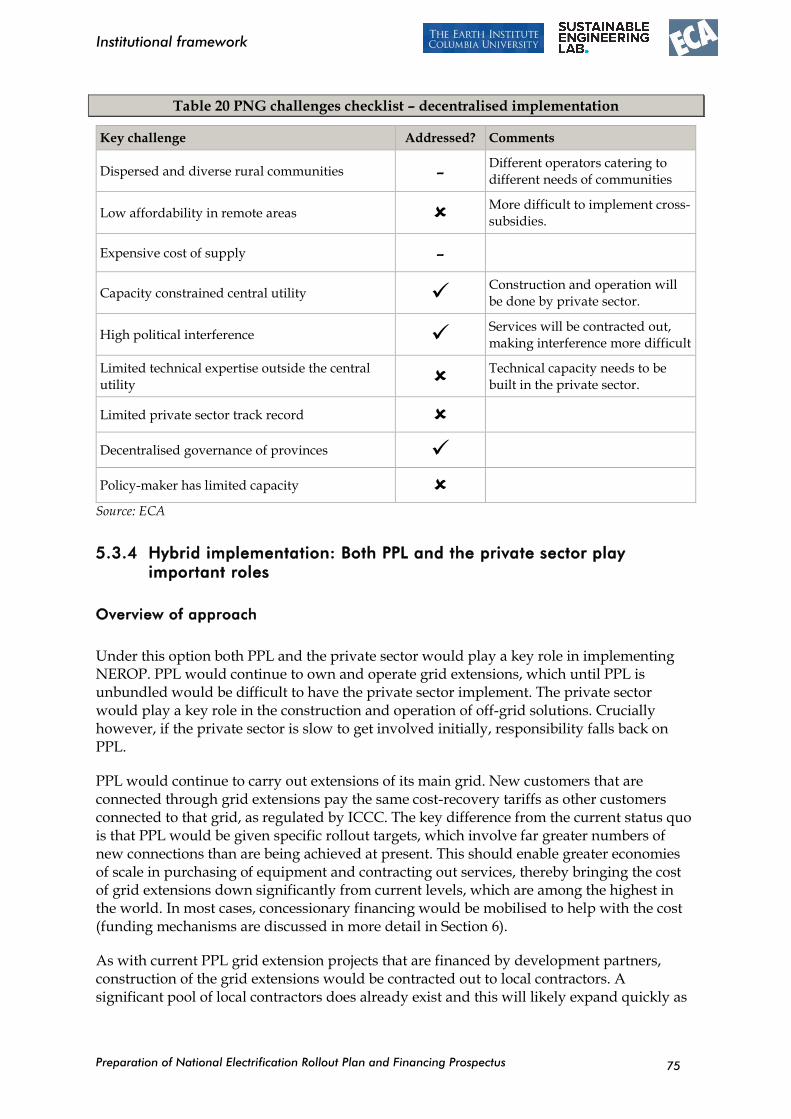
Preparation of National Electrification Rollout Plan and Financing Prospectus
Institutional framework
75
Table 20 PNG challenges checklist – decentralised implementation
Key challenge Addressed? Comments
Dispersed and diverse rural communities - Different operators catering to different needs of communities
Low affordability in remote areas More difficult to implement cross-subsidies.
Expensive cost of supply -
Capacity constrained central utility ✓ Construction and operation will be done by private sector.
High political interference ✓ Services will be contracted out, making interference more difficult
Limited technical expertise outside the central utility
Technical capacity needs to be built in the private sector.
Limited private sector track record
Decentralised governance of provinces ✓
Policy-maker has limited capacity
Source: ECA
5.3.4 Hybrid implementation: Both PPL and the private sector play
important roles
Overview of approach
Under this option both PPL and the private sector would play a key role in implementing NEROP. PPL would continue to own and operate grid extensions, which until PPL is unbundled would be difficult to have the private sector implement. The private sector would play a key role in the construction and operation of off-grid solutions. Crucially however, if the private sector is slow to get involved initially, responsibility falls back on PPL.
PPL would continue to carry out extensions of its main grid. New customers that are connected through grid extensions pay the same cost-recovery tariffs as other customers connected to that grid, as regulated by ICCC. The key difference from the current status quo is that PPL would be given specific rollout targets, which involve far greater numbers of new connections than are being achieved at present. This should enable greater economies of scale in purchasing of equipment and contracting out services, thereby bringing the cost of grid extensions down significantly from current levels, which are among the highest in the world. In most cases, concessionary financing would be mobilised to help with the cost (funding mechanisms are discussed in more detail in Section 6).
As with current PPL grid extension projects that are financed by development partners, construction of the grid extensions would be contracted out to local contractors. A significant pool of local contractors does already exist and this will likely expand quickly as
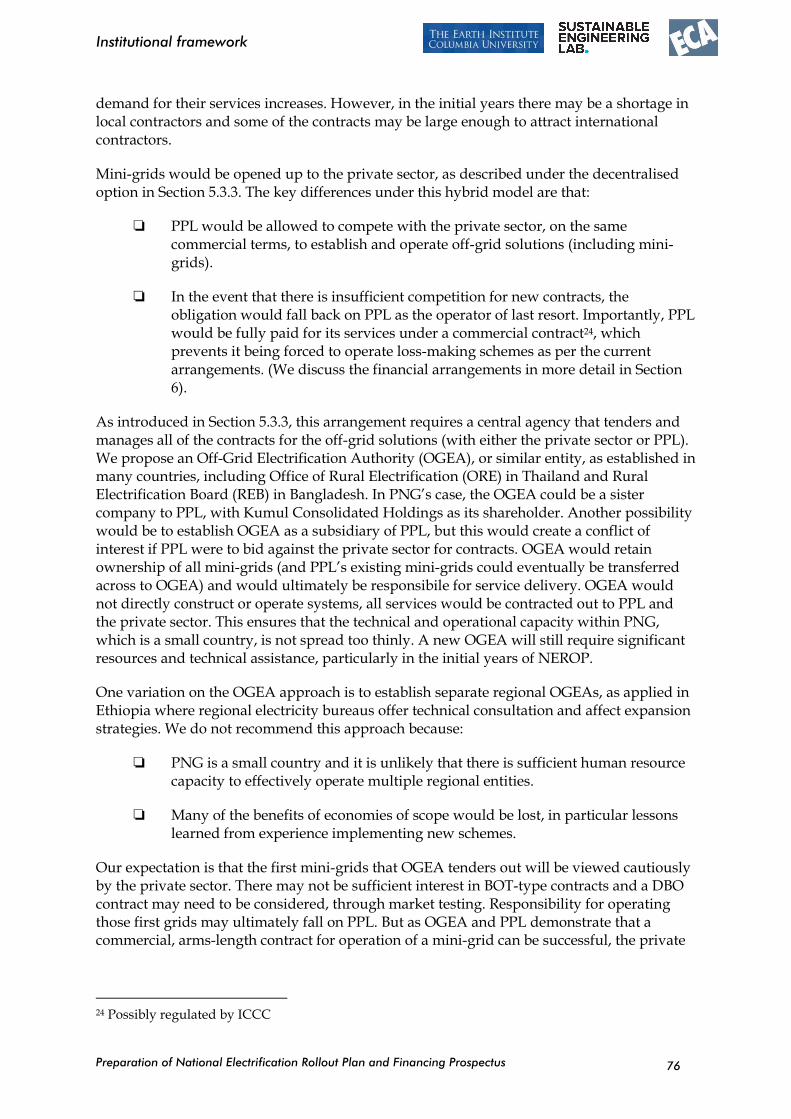
Preparation of National Electrification Rollout Plan and Financing Prospectus
Institutional framework
76
demand for their services increases. However, in the initial years there may be a shortage in local contractors and some of the contracts may be large enough to attract international contractors.
Mini-grids would be opened up to the private sector, as described under the decentralised option in Section 5.3.3. The key differences under this hybrid model are that:
PPL would be allowed to compete with the private sector, on the same commercial terms, to establish and operate off-grid solutions (including mini-grids).
In the event that there is insufficient competition for new contracts, the obligation would fall back on PPL as the operator of last resort. Importantly, PPL would be fully paid for its services under a commercial contract24, which prevents it being forced to operate loss-making schemes as per the current arrangements. (We discuss the financial arrangements in more detail in Section 6).
As introduced in Section 5.3.3, this arrangement requires a central agency that tenders and manages all of the contracts for the off-grid solutions (with either the private sector or PPL). We propose an Off-Grid Electrification Authority (OGEA), or similar entity, as established in many countries, including Office of Rural Electrification (ORE) in Thailand and Rural Electrification Board (REB) in Bangladesh. In PNG’s case, the OGEA could be a sister company to PPL, with Kumul Consolidated Holdings as its shareholder. Another possibility would be to establish OGEA as a subsidiary of PPL, but this would create a conflict of interest if PPL were to bid against the private sector for contracts. OGEA would retain ownership of all mini-grids (and PPL’s existing mini-grids could eventually be transferred across to OGEA) and would ultimately be responsibile for service delivery. OGEA would not directly construct or operate systems, all services would be contracted out to PPL and the private sector. This ensures that the technical and operational capacity within PNG, which is a small country, is not spread too thinly. A new OGEA will still require significant resources and technical assistance, particularly in the initial years of NEROP.
One variation on the OGEA approach is to establish separate regional OGEAs, as applied in Ethiopia where regional electricity bureaus offer technical consultation and affect expansion strategies. We do not recommend this approach because:
PNG is a small country and it is unlikely that there is sufficient human resource capacity to effectively operate multiple regional entities.
Many of the benefits of economies of scope would be lost, in particular lessons learned from experience implementing new schemes.
Our expectation is that the first mini-grids that OGEA tenders out will be viewed cautiously by the private sector. There may not be sufficient interest in BOT-type contracts and a DBO contract may need to be considered, through market testing. Responsibility for operating those first grids may ultimately fall on PPL. But as OGEA and PPL demonstrate that a commercial, arms-length contract for operation of a mini-grid can be successful, the private
24 Possibly regulated by ICCC
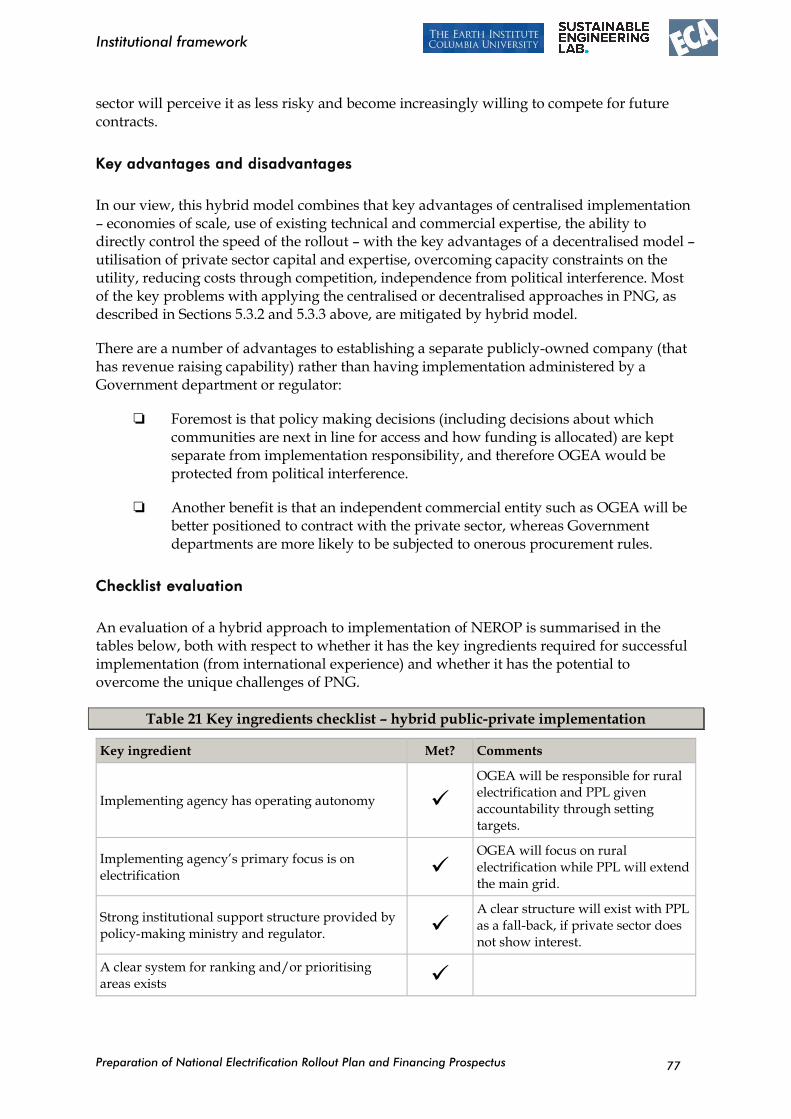
Preparation of National Electrification Rollout Plan and Financing Prospectus
Institutional framework
77
sector will perceive it as less risky and become increasingly willing to compete for future contracts.
Key advantages and disadvantages
In our view, this hybrid model combines that key advantages of centralised implementation – economies of scale, use of existing technical and commercial expertise, the ability to directly control the speed of the rollout – with the key advantages of a decentralised model – utilisation of private sector capital and expertise, overcoming capacity constraints on the utility, reducing costs through competition, independence from political interference. Most of the key problems with applying the centralised or decentralised approaches in PNG, as described in Sections 5.3.2 and 5.3.3 above, are mitigated by hybrid model.
There are a number of advantages to establishing a separate publicly-owned company (that has revenue raising capability) rather than having implementation administered by a Government department or regulator:
Foremost is that policy making decisions (including decisions about which communities are next in line for access and how funding is allocated) are kept separate from implementation responsibility, and therefore OGEA would be protected from political interference.
Another benefit is that an independent commercial entity such as OGEA will be better positioned to contract with the private sector, whereas Government departments are more likely to be subjected to onerous procurement rules.
Checklist evaluation
An evaluation of a hybrid approach to implementation of NEROP is summarised in the tables below, both with respect to whether it has the key ingredients required for successful implementation (from international experience) and whether it has the potential to overcome the unique challenges of PNG.
Table 21 Key ingredients checklist – hybrid public-private implementation
Key ingredient Met? Comments
Implementing agency has operating autonomy ✓ OGEA will be responsible for rural electrification and PPL given accountability through setting targets.
Implementing agency’s primary focus is on electrification ✓
OGEA will focus on rural electrification while PPL will extend the main grid.
Strong institutional support structure provided by policy-making ministry and regulator. ✓
A clear structure will exist with PPL as a fall-back, if private sector does not show interest.
A clear system for ranking and/or prioritising areas exists ✓
Preparation of National Electrification Rollout Plan and Financing Prospectus
Institutional framework
78
Key ingredient Met? Comments
Strong potential for economies of scale and scope to reducing costs ✓
PPL’s expansion of the main grid has potential for utilising economies of scale. As the private sector becomes more involved, cost-reduction solutions will be introduced.
Technically and financially strong retail supplier/s ✓
PPL will act as a fall-back option for off-grid systems, if no suitable suppliers get involved.
Strong support chain for small scale service providers -
Will be important to support private sector, but not critical given continued role of PPL
Utilises private sector expertise ✓
By involving private sector in off-grid solutions, capacity will be built within the sector leading to increasing expertise.
Involves communities in planning and operation -
Communities have the option of forming a private firm to compete for contracts.
Source: ECA
Table 22 PNG challenges checklist – hybrid public-private implementation
Key challenge Addressed? Comments
Dispersed and diverse rural communities - Limited community involvement, but allows operators to vary by community
Low affordability in remote areas -
Private sector will need full cost recovery, cross-subsidies complex to implement
Expensive cost of supply -
By setting grid specific tariffs and subsidies the cost of supply is better represented in retail price.
Capacity constrained central utility ✓
PPL will focus on main grid expansion while off-grid systems are tendered out to private industry.
High political interference ✓
This model removes political interference from the process and transfers decision making to OGEA.
Limited technical expertise outside the central utility ✓
PPL will act as a fall-back option, while technical capacity builds up in the private sector.
Limited private sector track record ✓ PPL will act as fall back operator
Decentralised governance of provinces ✓
Preparation of National Electrification Rollout Plan and Financing Prospectus
Institutional framework
79
Key challenge Addressed? Comments
Policy-maker has limited capacity ✓
This model would strengthen the policy maker through added regulations and frameworks.
Source: ECA
5.3.5 Community involvement: Rural electricity cooperatives
Overview of approach
This option is a variation on the decentralised / private sector approach, and therefore can be integrated into the hybrid approach described above. Rather than relying a central OGEA owning new grids and on the private sector to operate them, communities are mobilised to form electricity cooperatives that own, and in some cases operate, the new grids.
This option is still heavily reliant on a central OGEA (or similar) that helps mobilises communities, monitors the schemes, and provides technical support.
Establishment of the electricity cooperative can involve the community making a financial contribution. The mobilisation of communities can be used as a key criterion for prioritising areas to electrify.
Key advantages and disadvantages
There are significant advantages to involving communities in electricity provision:
Less resistances to cost-recovery tariffs: Communities have a strong interest in the sustainability of electricity services, thereby minimising resistance to tariff increases and issues around non-payment.
Operating flexibility: Community involvement builds flexibility into the operating arrangement. When issues arise such as objections to tariff increases or management weaknesses, as they inevitably do due to the inherent challenges of rural electrification, they are better equipped to adapt than a private company with contractual obligations.
Lower costs: Community involvement can significantly lower the cost of managing and operating the system, particularly through the supply of cheap local labour, which leads to lower tariffs and improves schemes’ sustainability.
Social benefits: Cooperatives bring significant social benefits, including job creation, skills training, and co-operative spirit.
Minimises land use issues: Community ownership can circumvent land use issues when establishing new schemes, which are a significant barrier to grid construction in PNG.
Aligns broadly with government policy: PNG has a decentralised model of governance and is actively promoting community participation. More
Preparation of National Electrification Rollout Plan and Financing Prospectus
Institutional framework
80
specifically, the Office of Cooperative Societies was established in 2000 to “revitalize and facilitate the development of co-operative societies in the country”.
Unfortunately, it can be very difficult to implement schemes quickly and sustainably under this model and therefore it would be risky to rely heavily on it to implement an ambitious, large-scale electrification program.
PNG’s past experience with community-based organisations has demonstrated how challenging the model is to implement. Many co-operatives were established by the Australian Colonial Administration during the colonial era (many of which were farming co-operatives) and they all ultimately failed. That is despite them typically carrying out far less complex functions than the management of an electricity system. The reasons for the failure of past cooperatives is summarised as follows by a 2005 study25:
“Some placed the blame on the Colonial Administration for not doing enough to assist co-operatives, whilst others thought that the failure of the movement was due to over-enthusiastic bureaucratic interference in the management of co-operative affairs, which the members resented. Others theorised that the co-operative principle of open membership that coerced people of different clans or tribes (some traditional enemies) to carry on business together, was unworkable in many areas of the country. Constant factional infighting from the directors' level to the regular members, which made it impossible for most co-operatives to function efficiently, strengthened this assertion. Others still thought that the Australian business people instigated the failure of the co-operative movement in order to thwart competition. Most likely, however, the decline of the co-operative movement was due to a combination of several factors.”
Electricity cooperatives are likely to be particularly challenging to implement in PNG, where so many small mini-grids will need to be established. Most will not be large enough to source the required managerial and technical expertise. For example, in the Philippines many of the small mini-grids that were managed by cooperatives eventually fell into disrepair and the grids were transferred back to the central utility (NPC). Many small cooperatives also suffer from politicisation. Examples can be found from many countries, for example in the Philippines board members set tariffs far too low in order to gain popularity which would benefit their political careers. This left some cooperatives in very poor financial state which often led to restructuring or the merging of two or more cooperatives. PNG’s experience with government power stations falling into disrepair once transferred to local governments is another example of the challenges of local management.
Most of the international success stories of electricity cooperatives involve relatively few cooperatives that are quite large in size by PNG standards. For example, in Costa Rica, four cooperatives were established that led all of the rural electrification. In the Philippines, most of the cooperatives that survived are supplied by the national grid and are reasonably large distribution networks. They therefore have the necessary critical mass to establish a strong, capable management team. It would be difficult to achieve this in PNG due to its small population and the remote location of many rural communities.
25 The Saga of the Co-operative Movement in Papua New Guinea, John Mugambwa, Journal of South Pacific Law, 2005
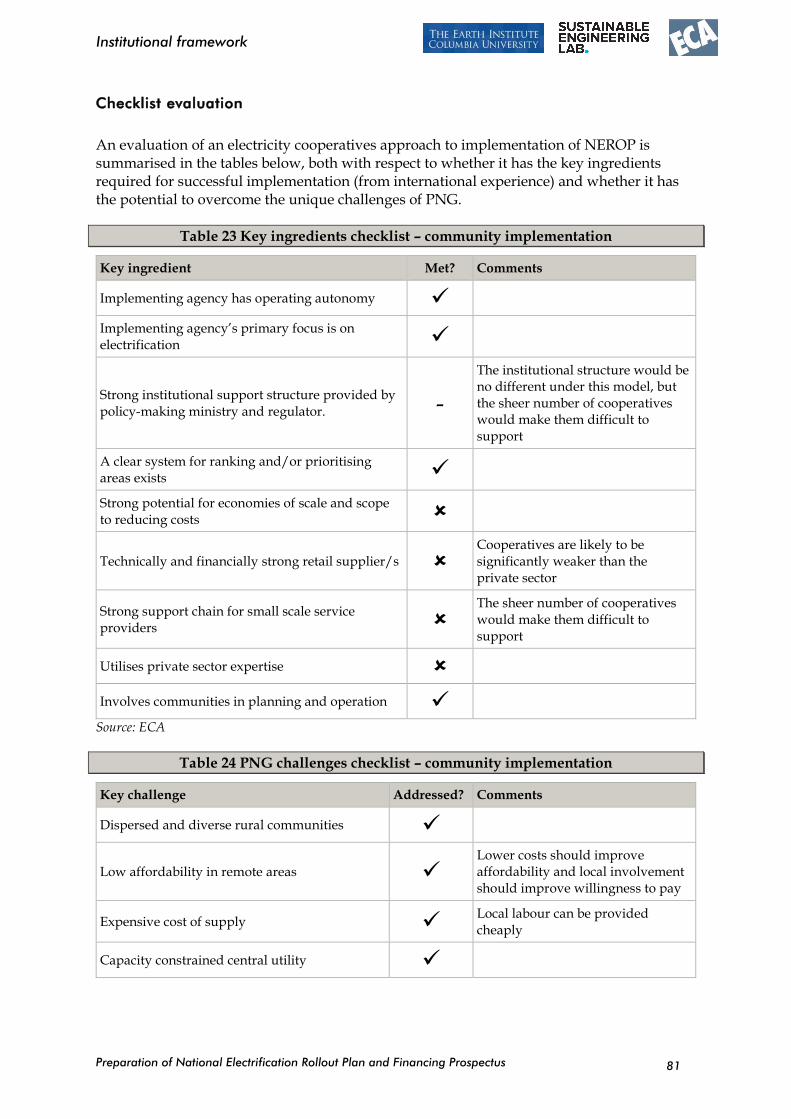
Preparation of National Electrification Rollout Plan and Financing Prospectus
Institutional framework
81
Checklist evaluation
An evaluation of an electricity cooperatives approach to implementation of NEROP is summarised in the tables below, both with respect to whether it has the key ingredients required for successful implementation (from international experience) and whether it has the potential to overcome the unique challenges of PNG.
Table 23 Key ingredients checklist – community implementation
Key ingredient Met? Comments
Implementing agency has operating autonomy ✓
Implementing agency’s primary focus is on electrification ✓
Strong institutional support structure provided by policy-making ministry and regulator. -
The institutional structure would be no different under this model, but the sheer number of cooperatives would make them difficult to support
A clear system for ranking and/or prioritising areas exists ✓
Strong potential for economies of scale and scope to reducing costs
Technically and financially strong retail supplier/s
Cooperatives are likely to be significantly weaker than the private sector
Strong support chain for small scale service providers
The sheer number of cooperatives would make them difficult to support
Utilises private sector expertise
Involves communities in planning and operation ✓
Source: ECA
Table 24 PNG challenges checklist – community implementation
Key challenge Addressed? Comments
Dispersed and diverse rural communities ✓
Low affordability in remote areas ✓
Lower costs should improve affordability and local involvement should improve willingness to pay
Expensive cost of supply ✓ Local labour can be provided cheaply
Capacity constrained central utility ✓
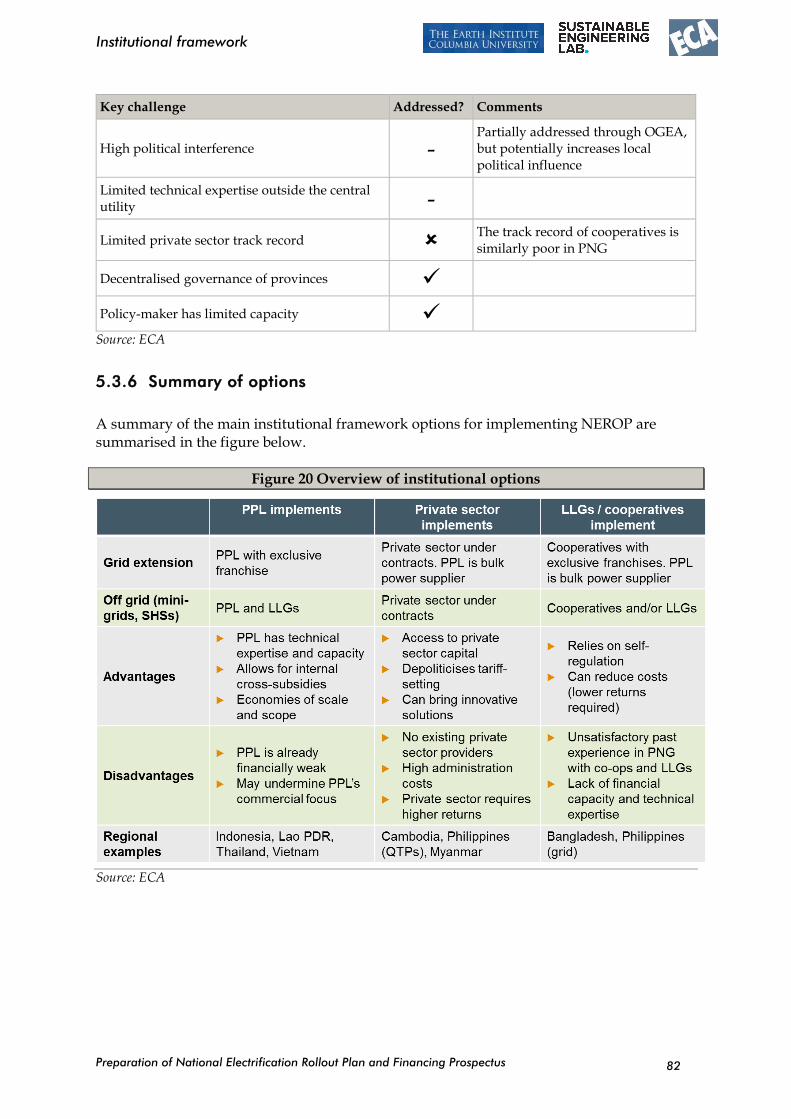
Preparation of National Electrification Rollout Plan and Financing Prospectus
Institutional framework
82
Key challenge Addressed? Comments
High political interference -
Partially addressed through OGEA, but potentially increases local political influence
Limited technical expertise outside the central utility -
Limited private sector track record The track record of cooperatives is similarly poor in PNG
Decentralised governance of provinces ✓
Policy-maker has limited capacity ✓
Source: ECA
5.3.6 Summary of options
A summary of the main institutional framework options for implementing NEROP are summarised in the figure below.
Figure 20 Overview of institutional options
Source: ECA
Preparation of National Electrification Rollout Plan and Financing Prospectus
Institutional framework
83
5.4 Summary of recommendations
5.4.1 Overview of recommended framework
We recommend that PNG adopt a hybrid approach to implementing NEROP, with PPL responsible for grid extensions (centralised implementation) and the private sector responsible for establishing new off-grid solutions, including mini-grids, (decentralised implementation). If there is insufficient interest from the private sector in establishing mini-grids, the obligation falls back on PPL.
As detailed in Section 5.3 above, this approach combines the key advantages of centralised implementation – economies of scale, use of existing technical and commercial expertise, the ability to directly control the speed of the rollout – with the key advantages of a decentralised model – utilisation of private sector capital and expertise, overcoming capacity constraints on the utility, reducing costs through competition, independence from political interference.
Our recommended institutional structure is summarised in the figures below.
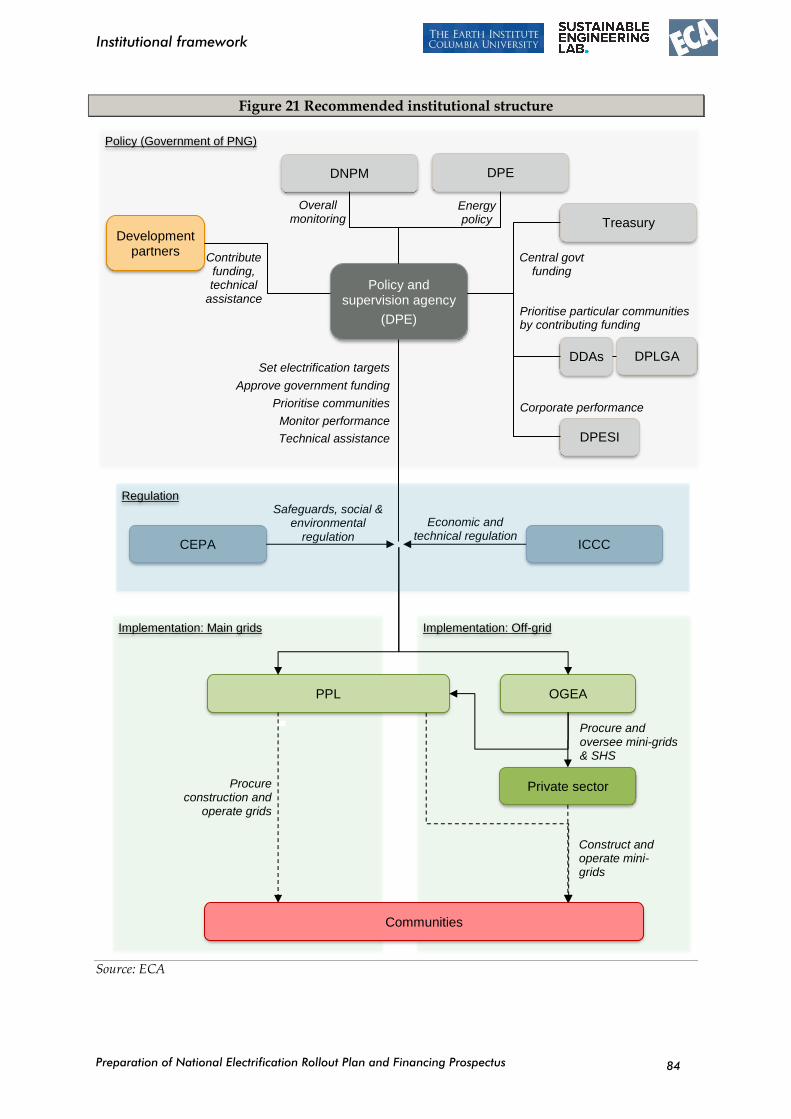
Preparation of National Electrification Rollout Plan and Financing Prospectus
Institutional framework
84
Figure 21 Recommended institutional structure
Source: ECA
Implementation: Main grids Implementation: Off-grid
Policy (Government of PNG)
Private sector
PPL OGEA
Policy and supervision agency
(DPE)
Communities
Construct and operate mini-grids
Procure and oversee mini-grids & SHS
Procure construction and
operate grids
Set electrification targets
Approve government funding
Prioritise communities
Monitor performance
Technical assistance
DDAs
Prioritise particular communities by contributing funding
ICCC
Economic and technical regulation
CEPA
Safeguards, social & environmental
regulation
Development partners
DPE DNPM
Treasury
DPLGA
Central govt funding
Overall monitoring
Energy policy
Contribute funding, technical
assistance
DPESI
Regulation
Corporate performance
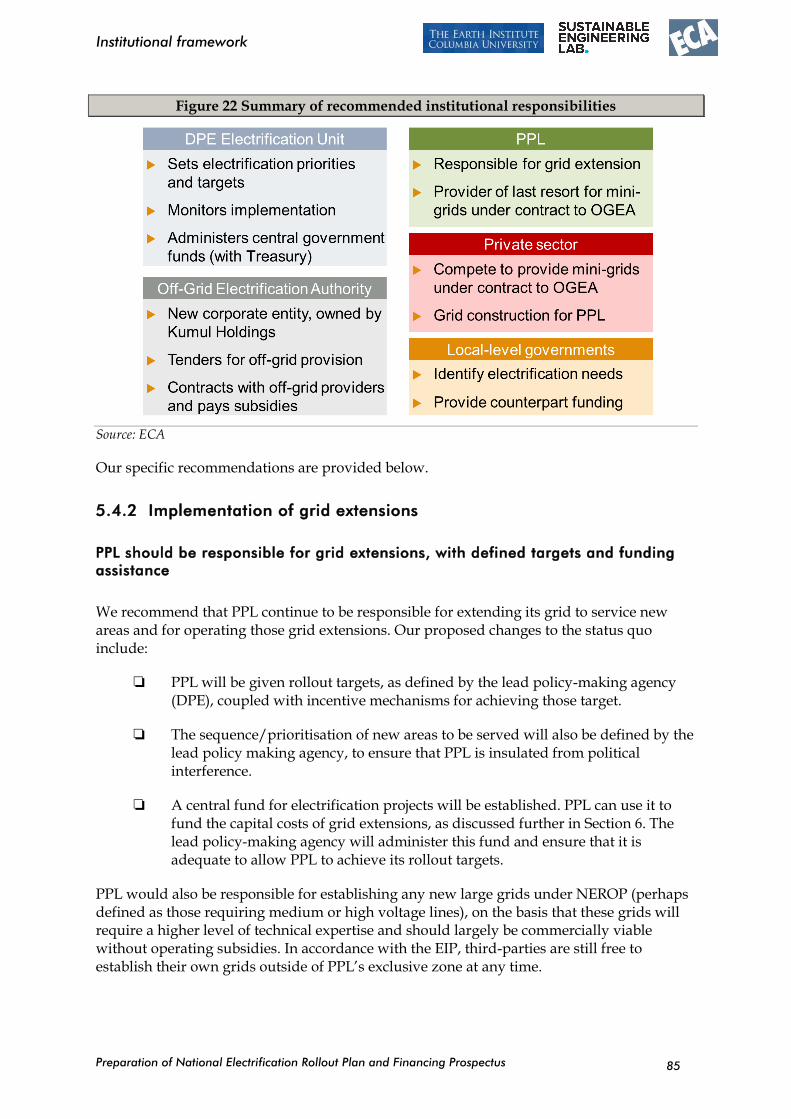
Preparation of National Electrification Rollout Plan and Financing Prospectus
Institutional framework
85
Figure 22 Summary of recommended institutional responsibilities
Source: ECA
Our specific recommendations are provided below.
5.4.2 Implementation of grid extensions
PPL should be responsible for grid extensions, with defined targets and funding
assistance
We recommend that PPL continue to be responsible for extending its grid to service new areas and for operating those grid extensions. Our proposed changes to the status quo include:
PPL will be given rollout targets, as defined by the lead policy-making agency (DPE), coupled with incentive mechanisms for achieving those target.
The sequence/prioritisation of new areas to be served will also be defined by the lead policy making agency, to ensure that PPL is insulated from political interference.
A central fund for electrification projects will be established. PPL can use it to fund the capital costs of grid extensions, as discussed further in Section 6. The lead policy-making agency will administer this fund and ensure that it is adequate to allow PPL to achieve its rollout targets.
PPL would also be responsible for establishing any new large grids under NEROP (perhaps defined as those requiring medium or high voltage lines), on the basis that these grids will require a higher level of technical expertise and should largely be commercially viable without operating subsidies. In accordance with the EIP, third-parties are still free to establish their own grids outside of PPL’s exclusive zone at any time.
Preparation of National Electrification Rollout Plan and Financing Prospectus
Institutional framework
86
PPL will in theory also be eligible for operational subsidies for its grids if needed for affordability, as per the mechanism described below for mini-grids. We discuss affordability in more detail in Section 6.
PPL will need to rely heavily on the private sector contractors to carry out the grid extensions, given constraints on the capacity of PPL’s internal technical teams and procurement rules imposed on PPL.
PPL should receive significant technical assistance, in particular to boost its Rural Electrification team’s ability to procure, manage, and monitor private sector led grid extensions.
If the ability of PPL to competently procure and manage private sector led grid extensions continued to be a serious concern going forward, a fall back option could be for the Off-Grid Electrification Authority (described below) to procure and manage construction of all grid extensions (in addition to mini-grids), and then turn over their ownership and operation to PPL. We do not recommend OGEA leading all procurement as the preferred approach because, in our view, it is more important to focus on improving PPL’s procurement capacity than finding ways to circumvent it. If PPL is unable to procure low and medium voltage grid extensions effectively or efficiently, then there seems little hope that it could implement new generating capacity and high voltage transmission line projects, both of which are also vital to the success of a large scale rural electrification program.
5.4.3 Implementation of off-grid solutions
What is the Off-Grid Electrification Authority and what is its main role in NEROP?
We recommend that the private sector be responsible for establishing new off-grid solutions via a new Off-Grid Electrification Authority (OGEA). We propose that OGEA be established as a sister company to PPL, with Kumul Consolidated Holdings as its shareholder. OGEA will be the owner and licensed operator of all off-grid solutions. OGEA will not directly construct or operate systems, all services would be contracted out to either the private sector or PPL. It will effectively be a procurement authority/asset manager. This ensures that the limited technical and operational capacity within PNG is not spread too thinly.
There are numerous international examples of dedicated rural electrification agencies, including Philippines, Nepal, Thailand, Ethiopia, Kenya, Tanzania, Uganda, Mozambique, Guinea, Mali and Burkina Faso26. Of these examples, Philippines and Mali are probably the best example of a rural electrification agency contracting services out to the private sector.
Only some of these international examples (including Ethiopia, Mozambique, Guinea, and Nepal) have a dedicated off-grid agency, due to the fact that off-grid plays a much smaller role in most countries than in PNG. PNG is reasonably unique in that off-grid is likely to play a more prominent role (approximately 30% of households) than in other countries. This is due to a combination of reasons, including the geography of PNG, the density and distribution of the population, and the costs of supply. This means that the OGEA will be
26 The report Review of Experiences with Rural Electrification Agencies Lessons for Africa (Wolfgang Mostert) provides a particularly good overview of different international approaches and the reasons for their successes and failures: http://www.mostert.dk/pdf/Experiences%20with%20Rural%20Electrification%20Agencies.pdf
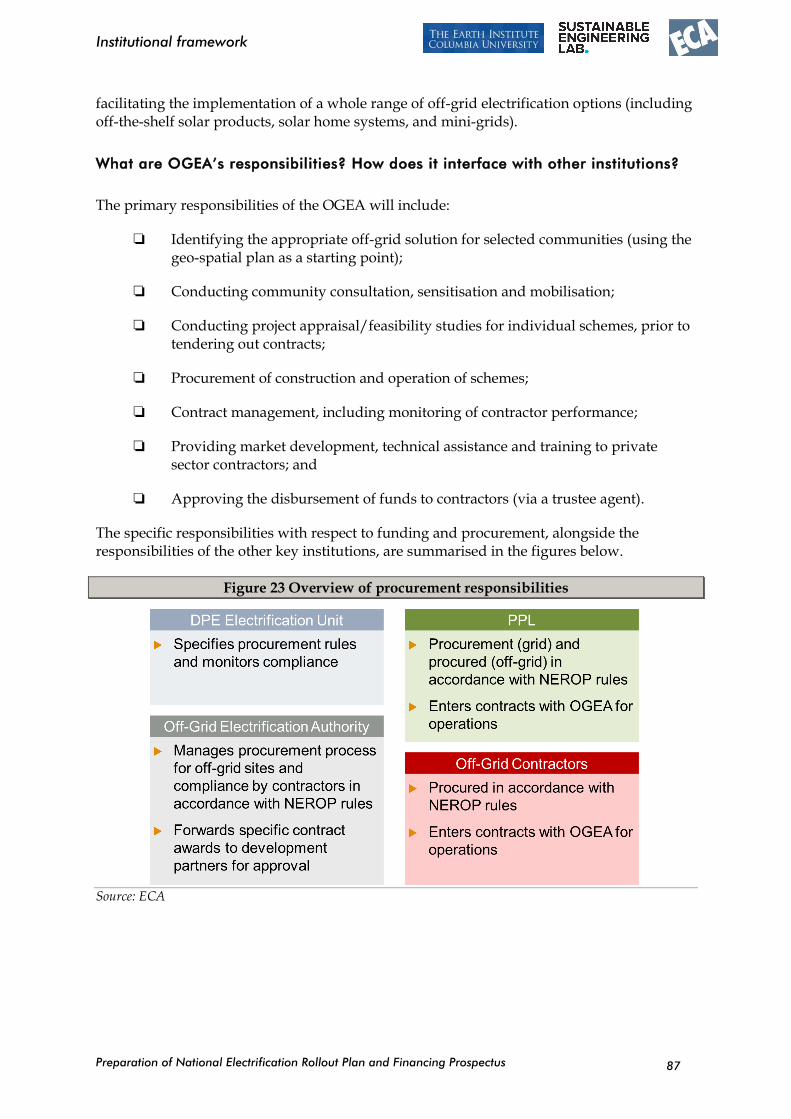
Preparation of National Electrification Rollout Plan and Financing Prospectus
Institutional framework
87
facilitating the implementation of a whole range of off-grid electrification options (including off-the-shelf solar products, solar home systems, and mini-grids).
What are OGEA’s responsibilities? How does it interface with other institutions?
The primary responsibilities of the OGEA will include:
Identifying the appropriate off-grid solution for selected communities (using the geo-spatial plan as a starting point);
Conducting community consultation, sensitisation and mobilisation;
Conducting project appraisal/feasibility studies for individual schemes, prior to tendering out contracts;
Procurement of construction and operation of schemes;
Contract management, including monitoring of contractor performance;
Providing market development, technical assistance and training to private sector contractors; and
Approving the disbursement of funds to contractors (via a trustee agent).
The specific responsibilities with respect to funding and procurement, alongside the responsibilities of the other key institutions, are summarised in the figures below.
Figure 23 Overview of procurement responsibilities
Source: ECA
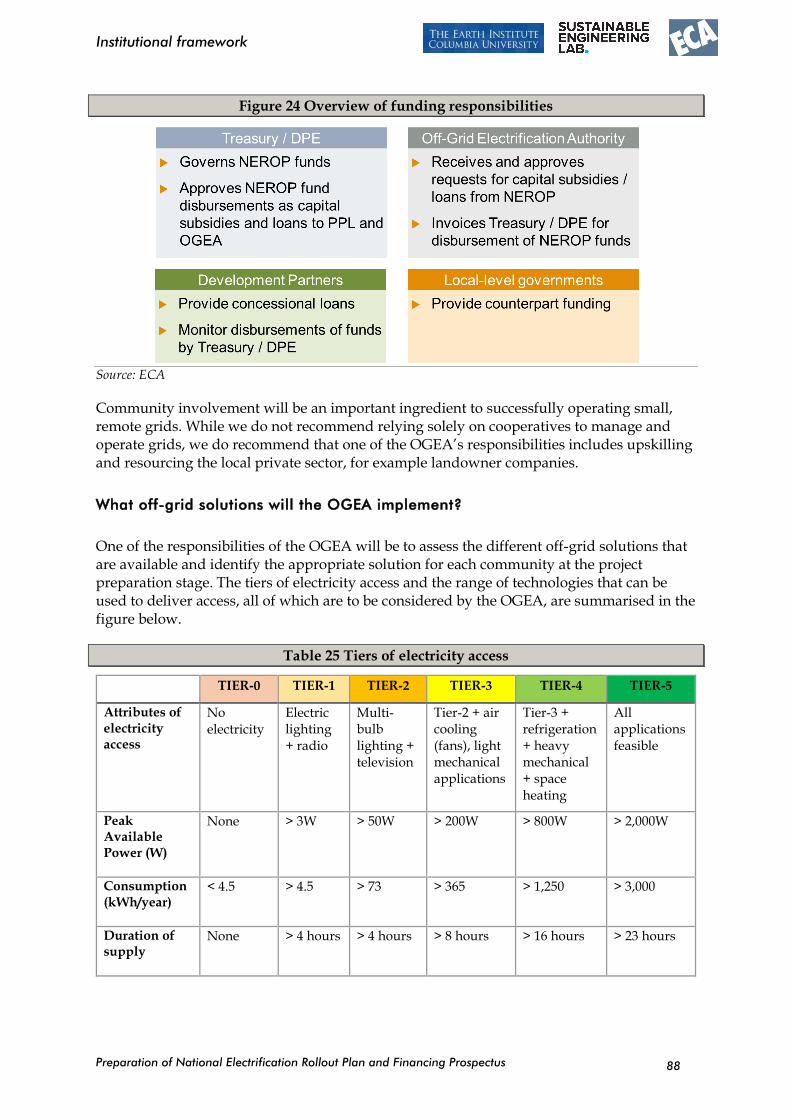
Preparation of National Electrification Rollout Plan and Financing Prospectus
Institutional framework
88
Figure 24 Overview of funding responsibilities
Source: ECA
Community involvement will be an important ingredient to successfully operating small, remote grids. While we do not recommend relying solely on cooperatives to manage and operate grids, we do recommend that one of the OGEA’s responsibilities includes upskilling and resourcing the local private sector, for example landowner companies.
What off-grid solutions will the OGEA implement?
One of the responsibilities of the OGEA will be to assess the different off-grid solutions that are available and identify the appropriate solution for each community at the project preparation stage. The tiers of electricity access and the range of technologies that can be used to deliver access, all of which are to be considered by the OGEA, are summarised in the figure below.
Table 25 Tiers of electricity access
TIER-0 TIER-1 TIER-2 TIER-3 TIER-4 TIER-5
Attributes of electricity access
No electricity
Electric lighting + radio
Multi-bulb lighting + television
Tier-2 + air cooling (fans), light mechanical applications
Tier-3 + refrigeration + heavy mechanical + space heating
All applications feasible
Peak Available Power (W)
None > 3W > 50W > 200W > 800W > 2,000W
Consumption (kWh/year)
< 4.5 > 4.5 > 73 > 365 > 1,250 > 3,000
Duration of supply
None > 4 hours > 4 hours > 8 hours > 16 hours > 23 hours
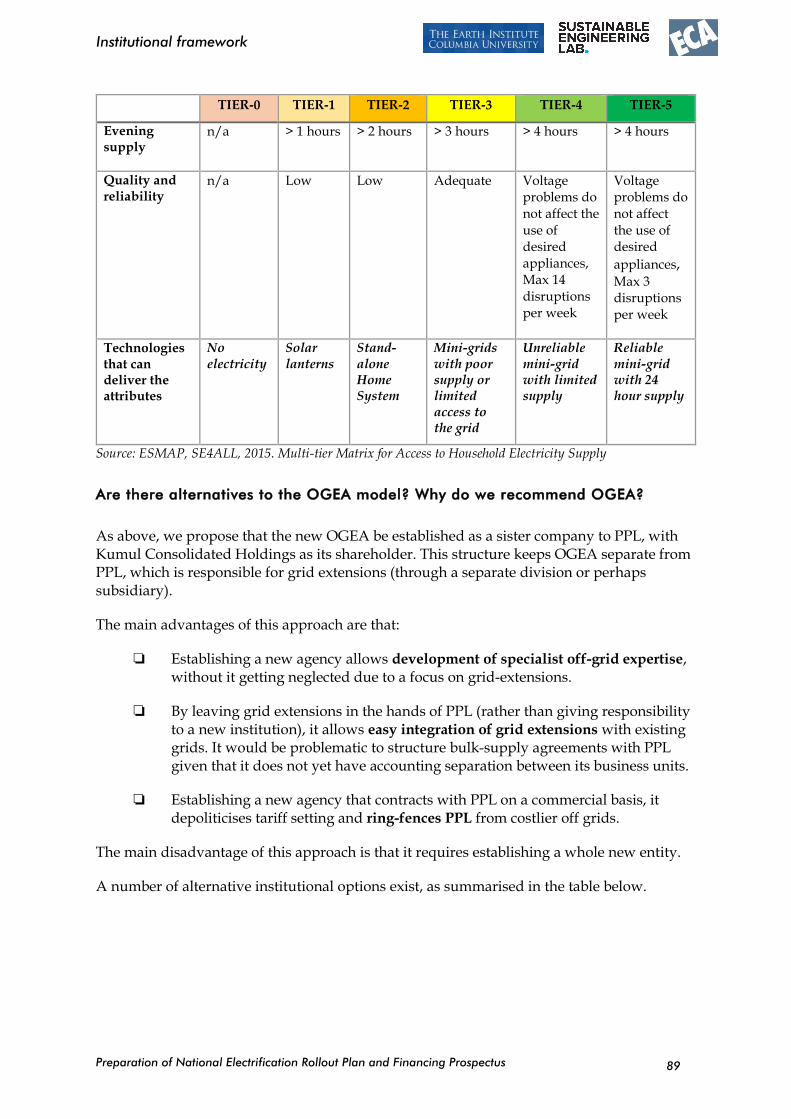
Preparation of National Electrification Rollout Plan and Financing Prospectus
Institutional framework
89
TIER-0 TIER-1 TIER-2 TIER-3 TIER-4 TIER-5
Evening supply
n/a > 1 hours > 2 hours > 3 hours > 4 hours > 4 hours
Quality and reliability
n/a Low Low Adequate Voltage problems do not affect the use of desired appliances, Max 14 disruptions per week
Voltage problems do not affect the use of desired
appliances, Max 3 disruptions per week
Technologies that can deliver the attributes
No electricity
Solar lanterns
Stand-alone Home System
Mini-grids with poor supply or limited access to the grid
Unreliable mini-grid with limited supply
Reliable mini-grid with 24 hour supply
Source: ESMAP, SE4ALL, 2015. Multi-tier Matrix for Access to Household Electricity Supply
Are there alternatives to the OGEA model? Why do we recommend OGEA?
As above, we propose that the new OGEA be established as a sister company to PPL, with Kumul Consolidated Holdings as its shareholder. This structure keeps OGEA separate from PPL, which is responsible for grid extensions (through a separate division or perhaps subsidiary).
The main advantages of this approach are that:
Establishing a new agency allows development of specialist off-grid expertise, without it getting neglected due to a focus on grid-extensions.
By leaving grid extensions in the hands of PPL (rather than giving responsibility to a new institution), it allows easy integration of grid extensions with existing grids. It would be problematic to structure bulk-supply agreements with PPL given that it does not yet have accounting separation between its business units.
Establishing a new agency that contracts with PPL on a commercial basis, it depoliticises tariff setting and ring-fences PPL from costlier off grids.
The main disadvantage of this approach is that it requires establishing a whole new entity.
A number of alternative institutional options exist, as summarised in the table below.
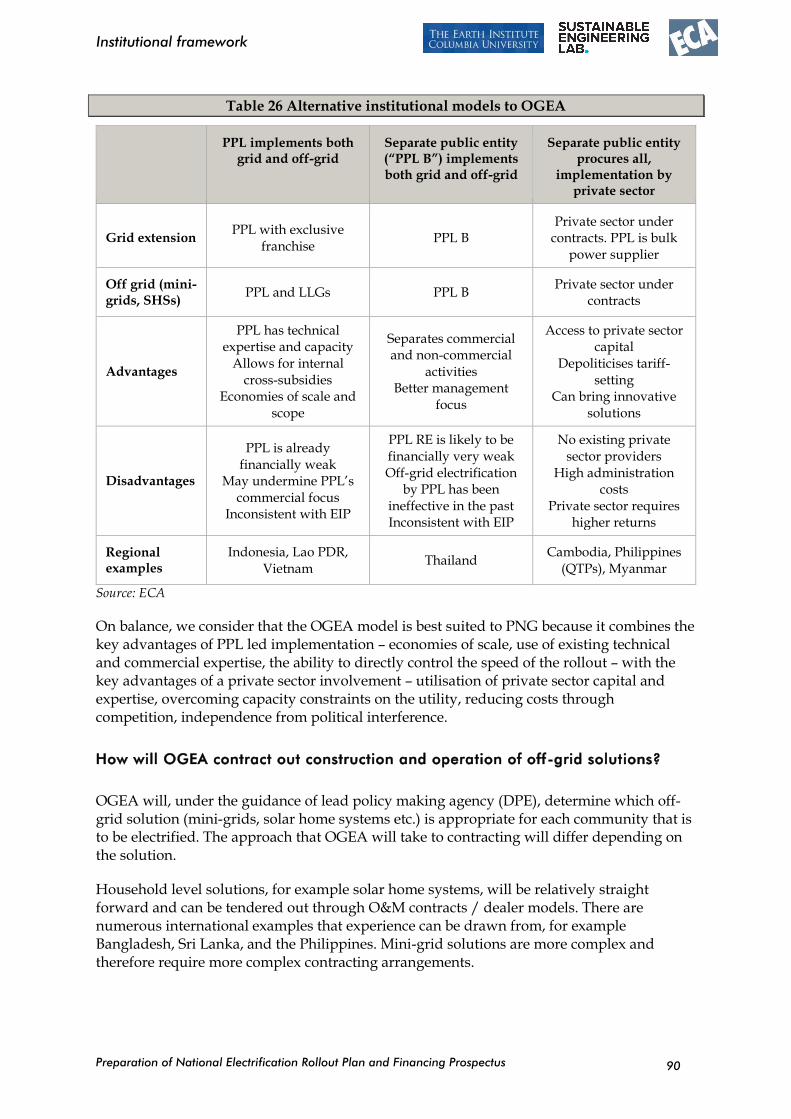
Preparation of National Electrification Rollout Plan and Financing Prospectus
Institutional framework
90
Table 26 Alternative institutional models to OGEA
PPL implements both grid and off-grid
Separate public entity (“PPL B”) implements both grid and off-grid
Separate public entity procures all,
implementation by private sector
Grid extension PPL with exclusive
franchise PPL B
Private sector under contracts. PPL is bulk
power supplier
Off grid (mini-grids, SHSs)
PPL and LLGs PPL B Private sector under
contracts
Advantages
PPL has technical expertise and capacity
Allows for internal cross-subsidies
Economies of scale and scope
Separates commercial and non-commercial
activities Better management
focus
Access to private sector capital
Depoliticises tariff-setting
Can bring innovative solutions
Disadvantages
PPL is already financially weak
May undermine PPL’s commercial focus
Inconsistent with EIP
PPL RE is likely to be financially very weak Off-grid electrification
by PPL has been ineffective in the past Inconsistent with EIP
No existing private sector providers
High administration costs
Private sector requires higher returns
Regional examples
Indonesia, Lao PDR, Vietnam
Thailand Cambodia, Philippines
(QTPs), Myanmar
Source: ECA
On balance, we consider that the OGEA model is best suited to PNG because it combines the key advantages of PPL led implementation – economies of scale, use of existing technical and commercial expertise, the ability to directly control the speed of the rollout – with the key advantages of a private sector involvement – utilisation of private sector capital and expertise, overcoming capacity constraints on the utility, reducing costs through competition, independence from political interference.
How will OGEA contract out construction and operation of off-grid solutions?
OGEA will, under the guidance of lead policy making agency (DPE), determine which off-grid solution (mini-grids, solar home systems etc.) is appropriate for each community that is to be electrified. The approach that OGEA will take to contracting will differ depending on the solution.
Household level solutions, for example solar home systems, will be relatively straight forward and can be tendered out through O&M contracts / dealer models. There are numerous international examples that experience can be drawn from, for example Bangladesh, Sri Lanka, and the Philippines. Mini-grid solutions are more complex and therefore require more complex contracting arrangements.

Preparation of National Electrification Rollout Plan and Financing Prospectus
Institutional framework
91
We expect that OGEA will tender out construction and operation of new mini-grids as either Build Operate Transfer (BOT) or Design Build Operate (DBO) contracts. Interested parties will compete for the contract by either by bidding the size of capital subsidy required to make the scheme financially viable (under a BOT) or the lease-fee it is willing to pay for the rights to operate the system (under a DBO). These are described in more detail below:
BOT contracts – Private sector builds and operates the off-grid scheme and at the end of the contract transfers ownership back to the Government. The private sector would compete for the contract by bidding the size of capital subsidy to be contributed by Government (administered by DPE and Treasury) and development partners. The contract would specify a cap on tariffs, likely just for the initial years (e.g. 5) of the contract. In the later years, the tariff could be set on a cost-recovery basis by the regulator (ICCC), which allows flexibility for future changes in costs to ensure affordability. If cost-recovery tariffs are higher than the cap, the operator is eligible for an operational subsidy that is administered by DPE.
Design Build Operate: Similar to the BOT model, with the key difference being that the public sector fully finances the initial construction of the grid. The private sector therefore faces significantly less risk, and procurement is simpler, essentially comprising a turn-key + operating contract. Private sector entities would bid on the basis of a lease fee, i.e. an annual payment to the public sector as compensation for the rights to use (and earn revenue from) the system assets.
PPL will be allowed to compete with the private sector for OGEA tendered contracts, on the same terms. In the event that there is insufficient interest in a contract, the obligation would fall back on PPL as the operator of last resort under a DBO contract. Importantly, PPL would fully recover all of its costs under the contract. In other words, PPL will not be forced to cross-subsidise loss-making off-grids.
How might the OGEA be structured?
The organisation of the OGEA should be a matter of further study, but international examples provide an indication of possible suitable structures. One such example, which has similar responsibilities to the proposed OGEA, is the Rural Electrification Agency in Tanzania. Its structure is summarised in the figure below. One possible amendment to this for the OGEA would be to remove the Director of Policy and Research, given that these responsibilities would fall on DPE.
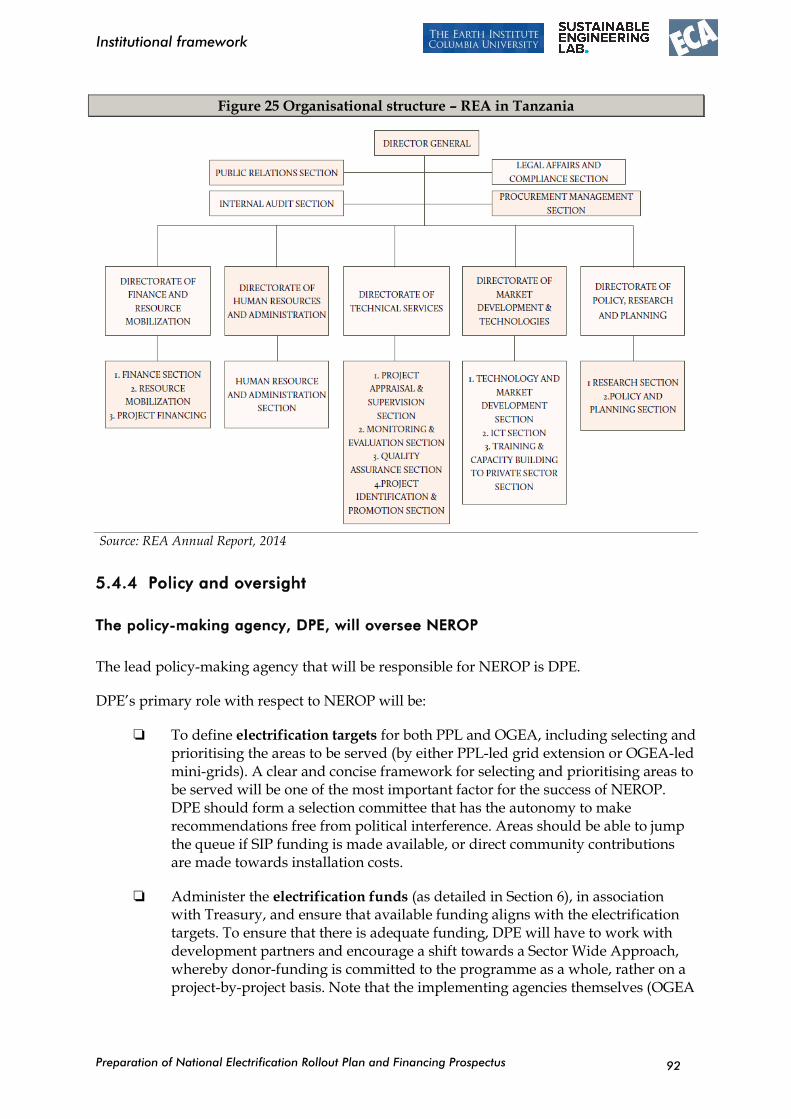
Preparation of National Electrification Rollout Plan and Financing Prospectus
Institutional framework
92
Figure 25 Organisational structure – REA in Tanzania
Source: REA Annual Report, 2014
5.4.4 Policy and oversight
The policy-making agency, DPE, will oversee NEROP
The lead policy-making agency that will be responsible for NEROP is DPE.
DPE’s primary role with respect to NEROP will be:
To define electrification targets for both PPL and OGEA, including selecting and prioritising the areas to be served (by either PPL-led grid extension or OGEA-led mini-grids). A clear and concise framework for selecting and prioritising areas to be served will be one of the most important factor for the success of NEROP. DPE should form a selection committee that has the autonomy to make recommendations free from political interference. Areas should be able to jump the queue if SIP funding is made available, or direct community contributions are made towards installation costs.
Administer the electrification funds (as detailed in Section 6), in association with Treasury, and ensure that available funding aligns with the electrification targets. To ensure that there is adequate funding, DPE will have to work with development partners and encourage a shift towards a Sector Wide Approach, whereby donor-funding is committed to the programme as a whole, rather on a project-by-project basis. Note that the implementing agencies themselves (OGEA
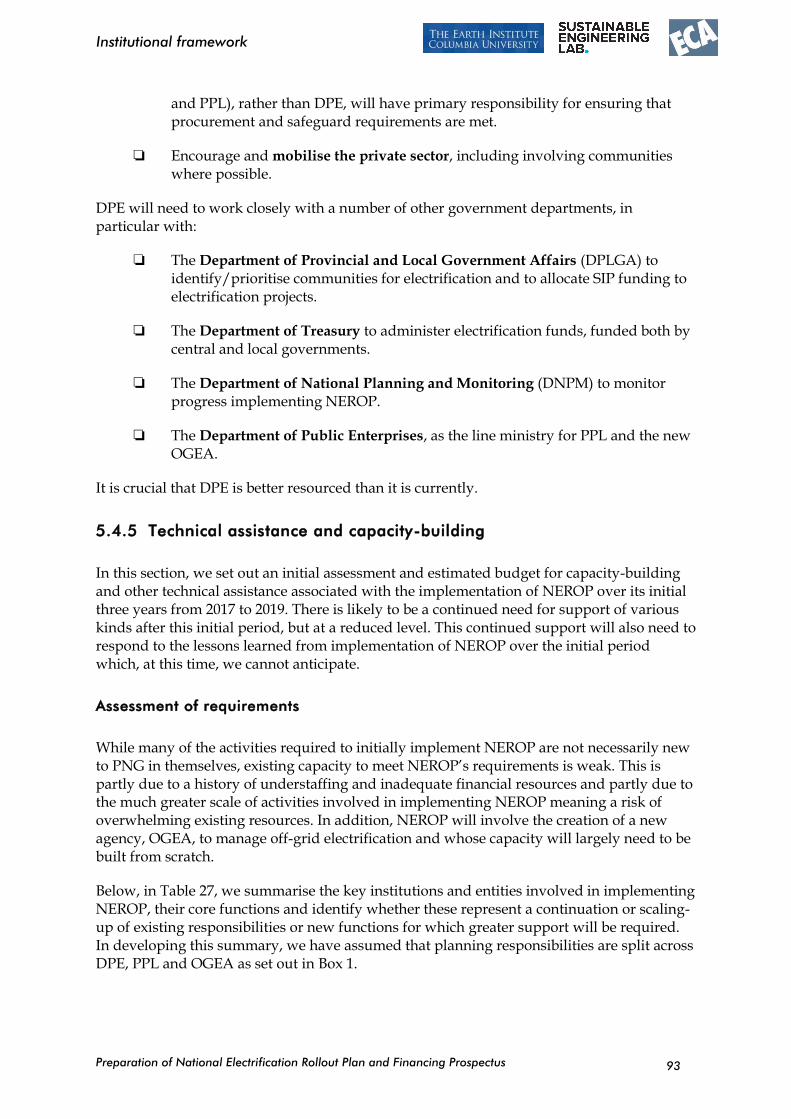
Preparation of National Electrification Rollout Plan and Financing Prospectus
Institutional framework
93
and PPL), rather than DPE, will have primary responsibility for ensuring that procurement and safeguard requirements are met.
Encourage and mobilise the private sector, including involving communities where possible.
DPE will need to work closely with a number of other government departments, in particular with:
The Department of Provincial and Local Government Affairs (DPLGA) to identify/prioritise communities for electrification and to allocate SIP funding to electrification projects.
The Department of Treasury to administer electrification funds, funded both by central and local governments.
The Department of National Planning and Monitoring (DNPM) to monitor progress implementing NEROP.
The Department of Public Enterprises, as the line ministry for PPL and the new OGEA.
It is crucial that DPE is better resourced than it is currently.
5.4.5 Technical assistance and capacity-building
In this section, we set out an initial assessment and estimated budget for capacity-building and other technical assistance associated with the implementation of NEROP over its initial three years from 2017 to 2019. There is likely to be a continued need for support of various kinds after this initial period, but at a reduced level. This continued support will also need to respond to the lessons learned from implementation of NEROP over the initial period which, at this time, we cannot anticipate.
Assessment of requirements
While many of the activities required to initially implement NEROP are not necessarily new to PNG in themselves, existing capacity to meet NEROP’s requirements is weak. This is partly due to a history of understaffing and inadequate financial resources and partly due to the much greater scale of activities involved in implementing NEROP meaning a risk of overwhelming existing resources. In addition, NEROP will involve the creation of a new agency, OGEA, to manage off-grid electrification and whose capacity will largely need to be built from scratch.
Below, in Table 27, we summarise the key institutions and entities involved in implementing NEROP, their core functions and identify whether these represent a continuation or scaling-up of existing responsibilities or new functions for which greater support will be required. In developing this summary, we have assumed that planning responsibilities are split across DPE, PPL and OGEA as set out in Box 1.
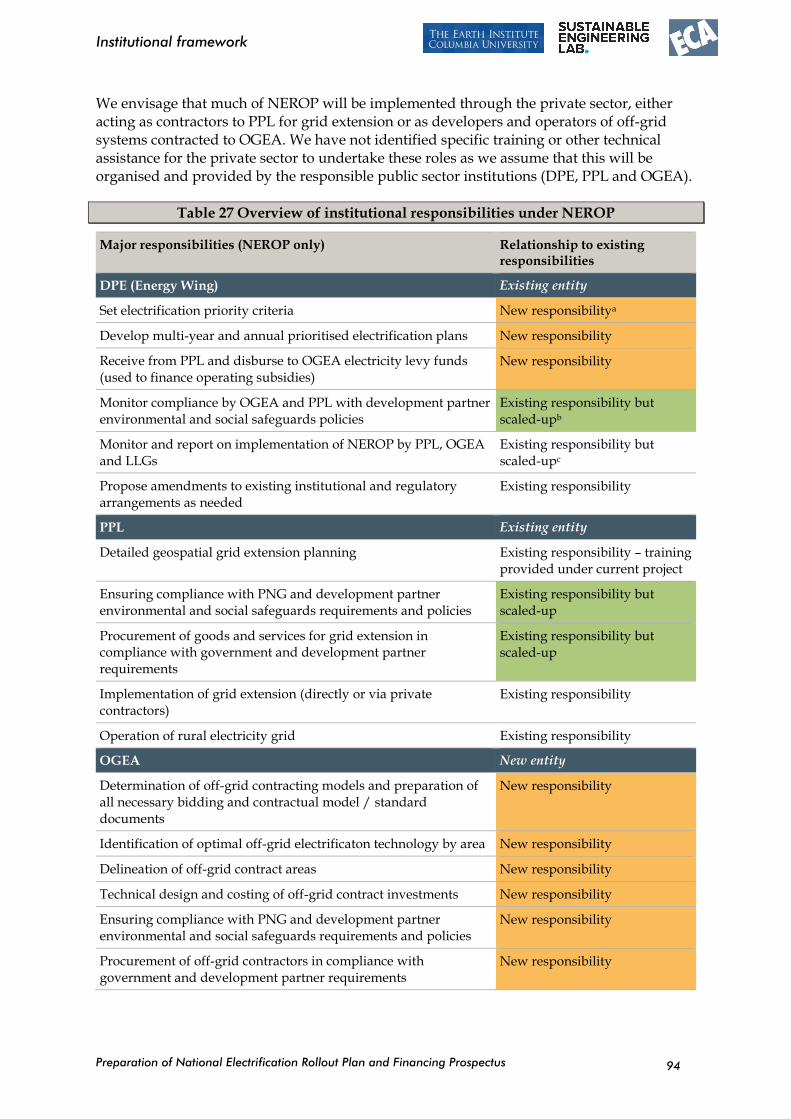
Preparation of National Electrification Rollout Plan and Financing Prospectus
Institutional framework
94
We envisage that much of NEROP will be implemented through the private sector, either acting as contractors to PPL for grid extension or as developers and operators of off-grid systems contracted to OGEA. We have not identified specific training or other technical assistance for the private sector to undertake these roles as we assume that this will be organised and provided by the responsible public sector institutions (DPE, PPL and OGEA).
Table 27 Overview of institutional responsibilities under NEROP
Major responsibilities (NEROP only) Relationship to existing responsibilities
DPE (Energy Wing) Existing entity
Set electrification priority criteria New responsibilitya
Develop multi-year and annual prioritised electrification plans New responsibility
Receive from PPL and disburse to OGEA electricity levy funds (used to finance operating subsidies)
New responsibility
Monitor compliance by OGEA and PPL with development partner environmental and social safeguards policies
Existing responsibility but scaled-upb
Monitor and report on implementation of NEROP by PPL, OGEA and LLGs
Existing responsibility but scaled-upc
Propose amendments to existing institutional and regulatory arrangements as needed
Existing responsibility
PPL Existing entity
Detailed geospatial grid extension planning Existing responsibility – training provided under current project
Ensuring compliance with PNG and development partner environmental and social safeguards requirements and policies
Existing responsibility but scaled-up
Procurement of goods and services for grid extension in compliance with government and development partner requirements
Existing responsibility but scaled-up
Implementation of grid extension (directly or via private contractors)
Existing responsibility
Operation of rural electricity grid Existing responsibility
OGEA New entity
Determination of off-grid contracting models and preparation of all necessary bidding and contractual model / standard documents
New responsibility
Identification of optimal off-grid electrificaton technology by area New responsibility
Delineation of off-grid contract areas New responsibility
Technical design and costing of off-grid contract investments New responsibility
Ensuring compliance with PNG and development partner environmental and social safeguards requirements and policies
New responsibility
Procurement of off-grid contractors in compliance with government and development partner requirements
New responsibility
Preparation of National Electrification Rollout Plan and Financing Prospectus
Institutional framework
95
Major responsibilities (NEROP only) Relationship to existing responsibilities
Receiving and disbursing capital and operating subsidy funds remitted by DPE
New responsibility
Monitoring and enforcement of off-grid contracts New responsibility
ICCC Existing entity
Approve PPL tariffs Existing responsiiblity
Approve initial off-grid tariffs by contractor New responsibility
Approve updated off-grid tariffs by contractor New responsibility
Specify and enforce technical standards for grid electricity Existing responsiiblity but currently outsourced to PPL
Specify and enforce technical standards for off-grid electricity New responsibility
CEPA Existing entity
Approve compliance with PNG environmental and social safeguards requirements for NEROP projects
Existing responsibility for emvironmental safeguards but scaled-up but no experience with social safeguards
Office of the Valuer-General Existing entity
Issue up-to-date compensation values for land and crop loss resulting from NEROP projects
Existing responsibility but only outdated values available
Source: Consultant analysis
Key:
Existing responsibility. No assistance required
Existing responsibility but scaled-up. Training additional resources is required
New responsibility. Assistance in developing mechanisms and training is required
Notes:
a PPL currently uses a hurdle IRR to select electrification projects. We are unsure whether this criterion is determined by DPE or is either an internal PPL decision or determined by other entities than DPE
b DPE has some experience in managing previous and ongoing development partner projects but at a much smaller scale
c We understand that DPE currently reports on electrification progress
d Assumes the PPL has existing internal resources to manage project management activities other than in the specialised fields of procurement and safeguards compliance.
From this assessment, we have derived a high-level list of required technical assistance, capacity-building and additional resourcing activities. The definitions of each activity that we have used for this purpose are as follows:
Technical assistance. Support in the design and introduction of new policies and mechanisms required under NEROP and for which no there are no existing processes and procedures in force in Papua New Guinea.
Capacity-building. Training and guidance for entities in the implementation of procedures and processes required under NEROP. This includes, for example, compliance with relevant development partner policies, rules and regulations.
Preparation of National Electrification Rollout Plan and Financing Prospectus
Institutional framework
96
Additional resourcing. Support from development partners to increase the resources available to public entities in order to address current shortfalls which would otherwise endanger the timely and effective implementation of NEROP. These additional resources would be dedicated to the requirements of NEROP and would be intended as a temporary measure until budget allocations and resources for NEROP implementation can be increased to adequate levels.
Our indicative technical assistance plan is set out in the tables on the following pages. The plan shows the individual activities proposed under each area of responsibility where we have identified a requirement for support to put in place a new responsibility or to scale-up an existing responsibility. We also show the proposed timing of these activities as well as estimates of the resource requirements (expressed in person-months). Only new responsibilities and those existing responsibilities where additional support is required are shown. In assessing requirements for additional resources, we have taken into consideration the challenges of travel and site visits in Papua New Guinea which severely constrain the extent to which any individual can adequately oversee a programme of the scale and scope of NEROP.
Box 1 Electrification planning under NEROP
Planning under NEROP will take place at various levels and for various time periods:
National roll-out plans prepared by DPE. These will be used to determine the total new connections to be delivered under NEROP broken-down into grid extension and off-grid connections and by region. These plans will drive the allocation of funds under NEROP and will also be used to identify requirements for the next funding round. We envisage that these plans will cover the entirety of NEROP out to 2030 at high-level with a more detailed allocation plan for the following three-year period and will be updated annually on the basis of achievements in the preceding year and assessments of the availability of funding.
Region-level grid extension plans prepared by PPL. These will be detailed geo-spatial plans used to determine the grid extension programme under NEROP for the next three year period and will be updated annually. The plans will use the allocated funding as identified by DPE and the approved prioritisation criteria to determine which communities can be connected over the period within each region. They will form the basis for procurement decisions by PPL.
Region-level off-grid electrification plans prepared by OGEA. As with the grid extension plans, these will use the allocated funding and prioritisation criteria defined by DPE to determine in which communities to develop off-grid electrification schemes over the coming three year period. These will be updated annually.
Off-grid contract electrification plans prepared by OGEA. These will follow on from the regional level plans. They will define, for those communities to be electrified through off-grid schemes over the coming year, the delineation of the contracts to be tendered, the detailed technical design of the schemes and the costing of the schemes (used as a basis for subsidy allocation, initial tariff-
Preparation of National Electrification Rollout Plan and Financing Prospectus
Institutional framework
97
setting and tendering). These plans will be prepared as communities are identified and funds allocated through the regional planning process.The plans will then become the basis for tendering of the associated contracts.
Source: Consultants
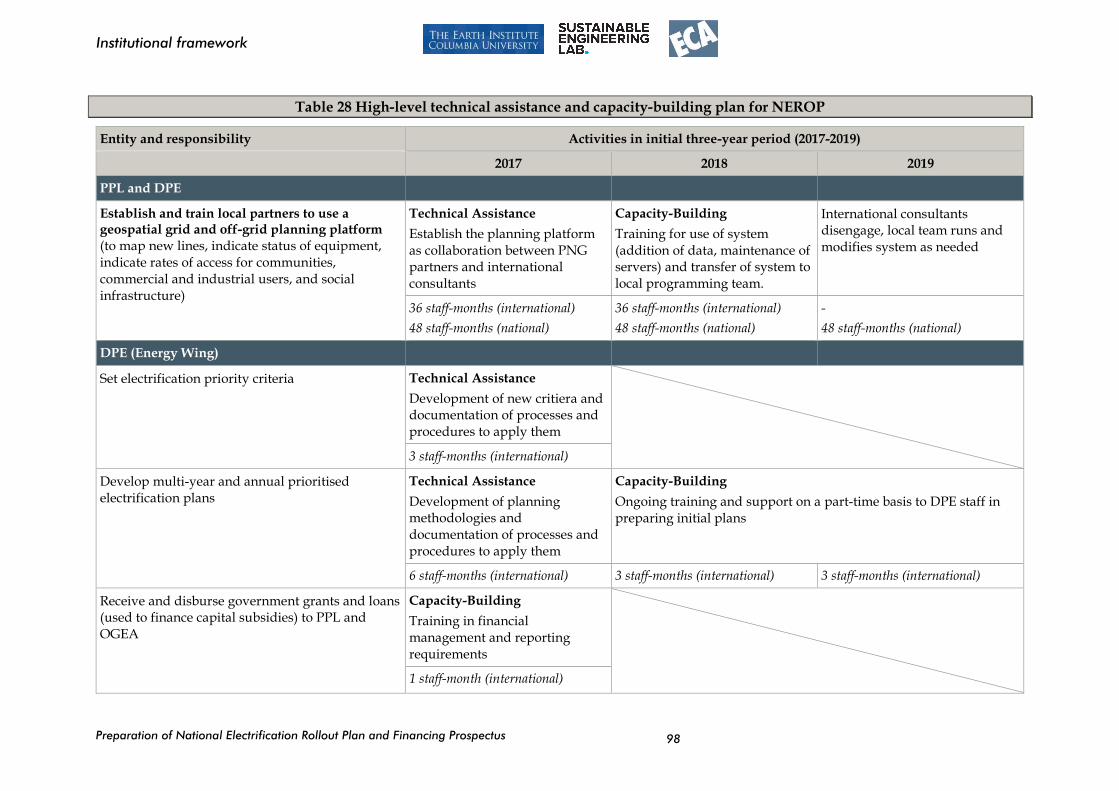
Preparation of National Electrification Rollout Plan and Financing Prospectus
Institutional framework
98
Table 28 High-level technical assistance and capacity-building plan for NEROP
Entity and responsibility Activities in initial three-year period (2017-2019)
2017 2018 2019
PPL and DPE
Establish and train local partners to use a geospatial grid and off-grid planning platform
(to map new lines, indicate status of equipment, indicate rates of access for communities, commercial and industrial users, and social infrastructure)
Technical Assistance
Establish the planning platform as collaboration between PNG partners and international consultants
Capacity-Building
Training for use of system (addition of data, maintenance of servers) and transfer of system to local programming team.
International consultants disengage, local team runs and modifies system as needed
36 staff-months (international)
48 staff-months (national)
36 staff-months (international)
48 staff-months (national)
-
48 staff-months (national)
DPE (Energy Wing)
Set electrification priority criteria Technical Assistance
Development of new critiera and documentation of processes and procedures to apply them
3 staff-months (international)
Develop multi-year and annual prioritised electrification plans
Technical Assistance
Development of planning methodologies and documentation of processes and procedures to apply them
Capacity-Building
Ongoing training and support on a part-time basis to DPE staff in preparing initial plans
6 staff-months (international) 3 staff-months (international) 3 staff-months (international)
Receive and disburse government grants and loans (used to finance capital subsidies) to PPL and OGEA
Capacity-Building
Training in financial management and reporting requirements
1 staff-month (international)
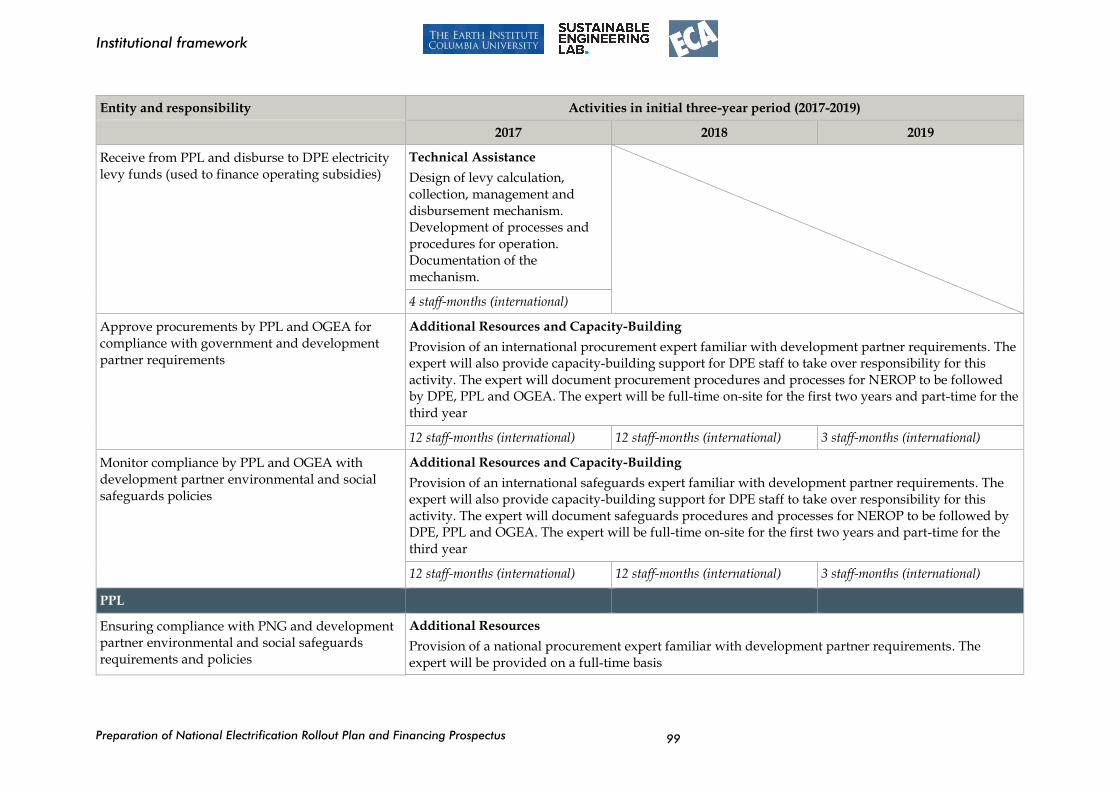
Preparation of National Electrification Rollout Plan and Financing Prospectus
Institutional framework
99
Entity and responsibility Activities in initial three-year period (2017-2019)
2017 2018 2019
Receive from PPL and disburse to DPE electricity levy funds (used to finance operating subsidies)
Technical Assistance
Design of levy calculation, collection, management and disbursement mechanism. Development of processes and procedures for operation. Documentation of the mechanism.
4 staff-months (international)
Approve procurements by PPL and OGEA for compliance with government and development partner requirements
Additional Resources and Capacity-Building
Provision of an international procurement expert familiar with development partner requirements. The expert will also provide capacity-building support for DPE staff to take over responsibility for this activity. The expert will document procurement procedures and processes for NEROP to be followed by DPE, PPL and OGEA. The expert will be full-time on-site for the first two years and part-time for the third year
12 staff-months (international) 12 staff-months (international) 3 staff-months (international)
Monitor compliance by PPL and OGEA with development partner environmental and social safeguards policies
Additional Resources and Capacity-Building
Provision of an international safeguards expert familiar with development partner requirements. The expert will also provide capacity-building support for DPE staff to take over responsibility for this activity. The expert will document safeguards procedures and processes for NEROP to be followed by DPE, PPL and OGEA. The expert will be full-time on-site for the first two years and part-time for the third year
12 staff-months (international) 12 staff-months (international) 3 staff-months (international)
PPL
Ensuring compliance with PNG and development partner environmental and social safeguards requirements and policies
Additional Resources
Provision of a national procurement expert familiar with development partner requirements. The expert will be provided on a full-time basis
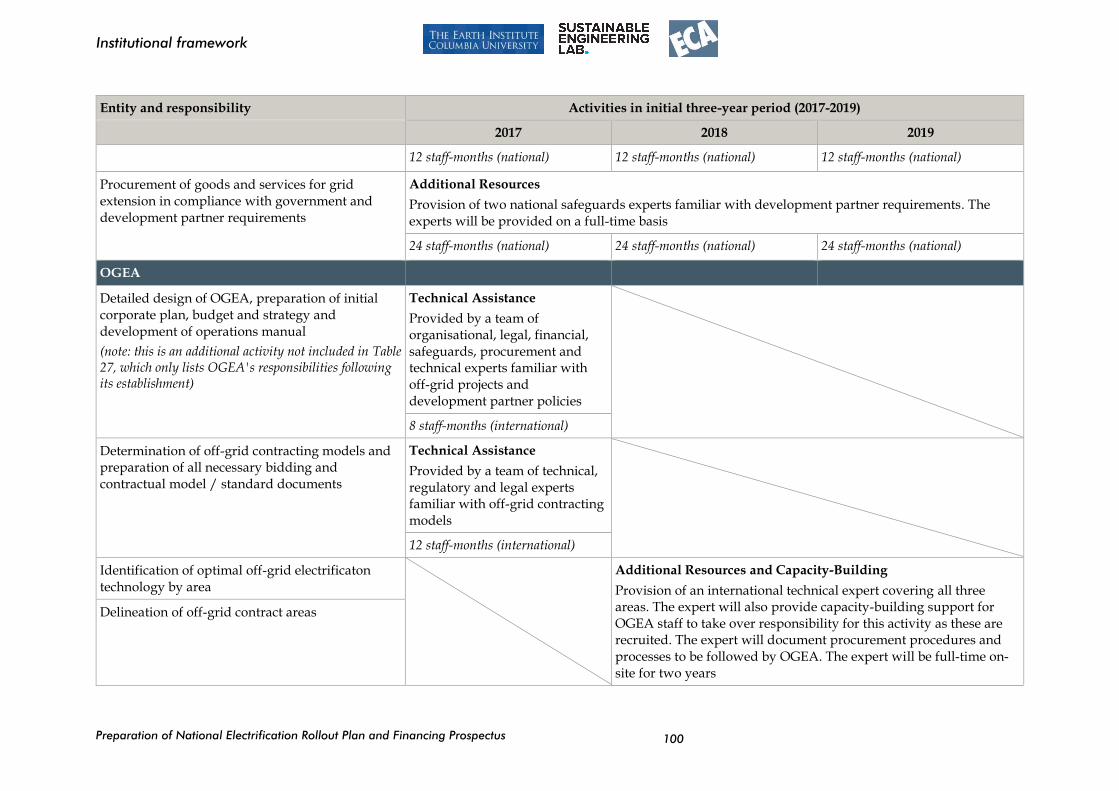
Preparation of National Electrification Rollout Plan and Financing Prospectus
Institutional framework
100
Entity and responsibility Activities in initial three-year period (2017-2019)
2017 2018 2019
12 staff-months (national) 12 staff-months (national) 12 staff-months (national)
Procurement of goods and services for grid extension in compliance with government and development partner requirements
Additional Resources
Provision of two national safeguards experts familiar with development partner requirements. The experts will be provided on a full-time basis
24 staff-months (national) 24 staff-months (national) 24 staff-months (national)
OGEA
Detailed design of OGEA, preparation of initial corporate plan, budget and strategy and development of operations manual
(note: this is an additional activity not included in Table 27, which only lists OGEA's responsibilities following its establishment)
Technical Assistance
Provided by a team of organisational, legal, financial, safeguards, procurement and technical experts familiar with off-grid projects and development partner policies
8 staff-months (international)
Determination of off-grid contracting models and preparation of all necessary bidding and contractual model / standard documents
Technical Assistance
Provided by a team of technical, regulatory and legal experts familiar with off-grid contracting models
12 staff-months (international)
Identification of optimal off-grid electrificaton technology by area
Additional Resources and Capacity-Building
Provision of an international technical expert covering all three areas. The expert will also provide capacity-building support for OGEA staff to take over responsibility for this activity as these are recruited. The expert will document procurement procedures and processes to be followed by OGEA. The expert will be full-time on-site for two years
Delineation of off-grid contract areas
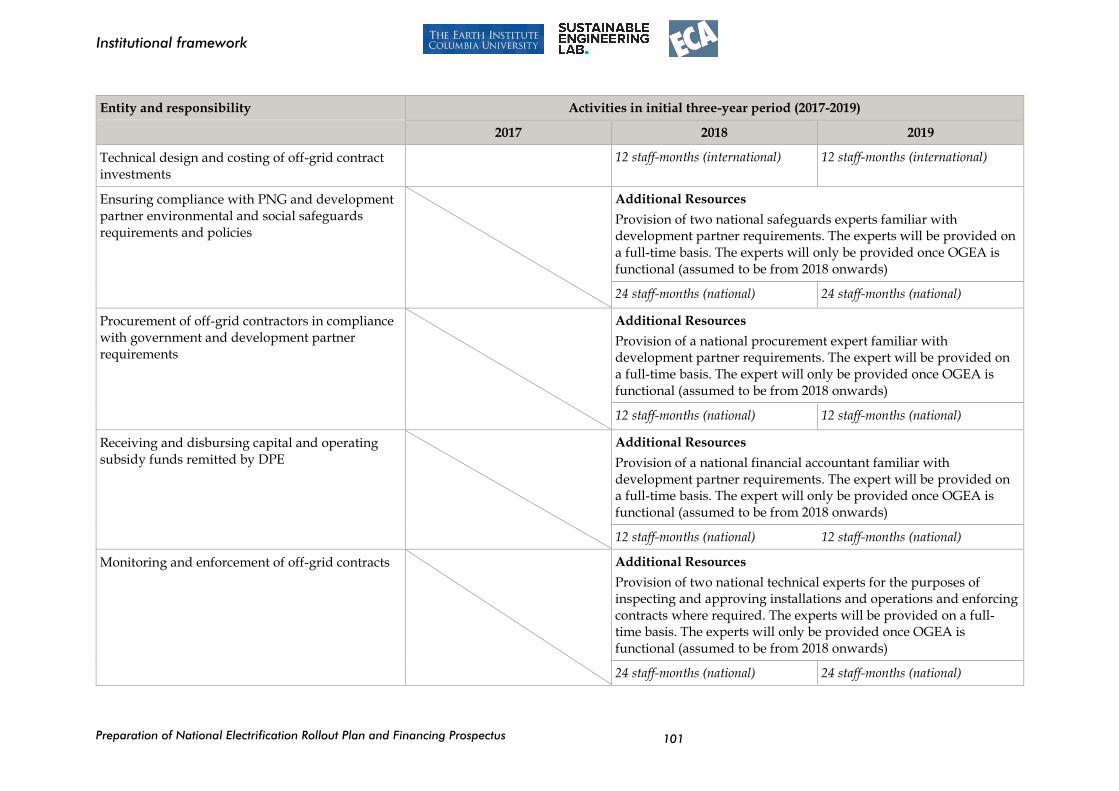
Preparation of National Electrification Rollout Plan and Financing Prospectus
Institutional framework
101
Entity and responsibility Activities in initial three-year period (2017-2019)
2017 2018 2019
Technical design and costing of off-grid contract investments
12 staff-months (international) 12 staff-months (international)
Ensuring compliance with PNG and development partner environmental and social safeguards requirements and policies
Additional Resources
Provision of two national safeguards experts familiar with development partner requirements. The experts will be provided on a full-time basis. The experts will only be provided once OGEA is functional (assumed to be from 2018 onwards)
24 staff-months (national) 24 staff-months (national)
Procurement of off-grid contractors in compliance with government and development partner requirements
Additional Resources
Provision of a national procurement expert familiar with development partner requirements. The expert will be provided on a full-time basis. The expert will only be provided once OGEA is functional (assumed to be from 2018 onwards)
12 staff-months (national) 12 staff-months (national)
Receiving and disbursing capital and operating subsidy funds remitted by DPE
Additional Resources
Provision of a national financial accountant familiar with development partner requirements. The expert will be provided on a full-time basis. The expert will only be provided once OGEA is functional (assumed to be from 2018 onwards)
12 staff-months (national) 12 staff-months (national)
Monitoring and enforcement of off-grid contracts Additional Resources
Provision of two national technical experts for the purposes of inspecting and approving installations and operations and enforcing contracts where required. The experts will be provided on a full-time basis. The experts will only be provided once OGEA is functional (assumed to be from 2018 onwards)
24 staff-months (national) 24 staff-months (national)
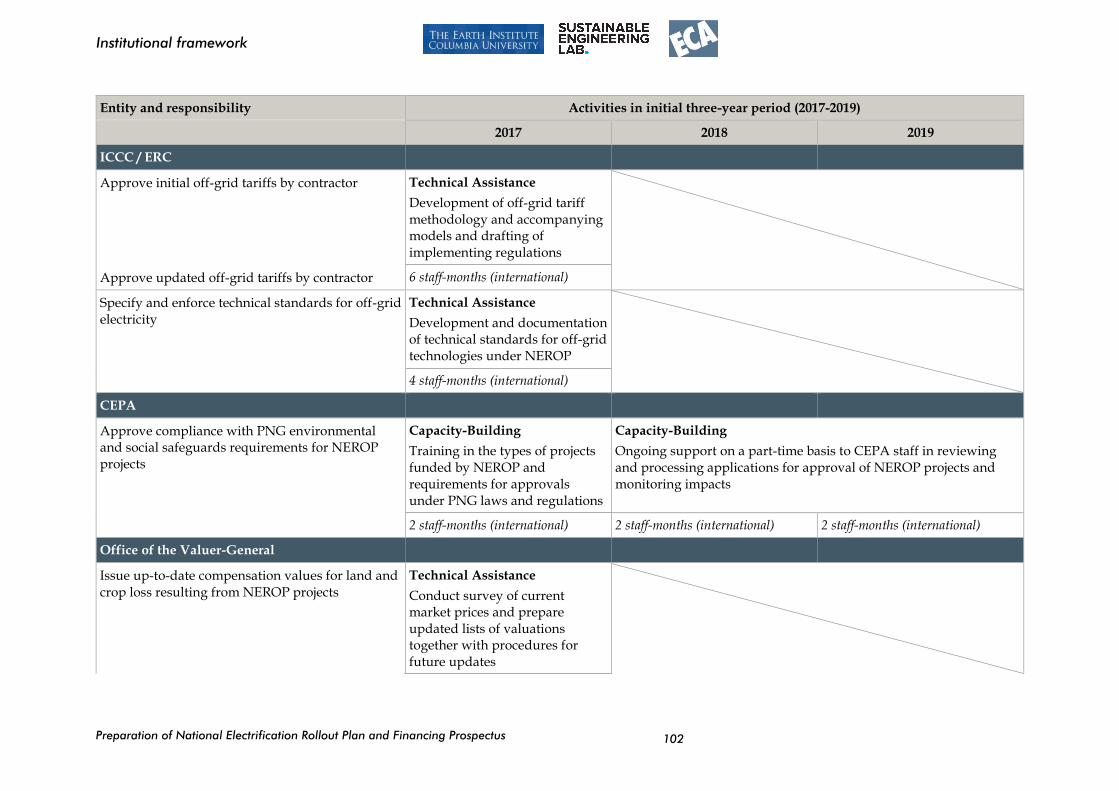
Preparation of National Electrification Rollout Plan and Financing Prospectus
Institutional framework
102
Entity and responsibility Activities in initial three-year period (2017-2019)
2017 2018 2019
ICCC / ERC
Approve initial off-grid tariffs by contractor Technical Assistance
Development of off-grid tariff methodology and accompanying models and drafting of implementing regulations
Approve updated off-grid tariffs by contractor 6 staff-months (international)
Specify and enforce technical standards for off-grid electricity
Technical Assistance
Development and documentation of technical standards for off-grid technologies under NEROP
4 staff-months (international)
CEPA
Approve compliance with PNG environmental and social safeguards requirements for NEROP projects
Capacity-Building
Training in the types of projects funded by NEROP and requirements for approvals under PNG laws and regulations
Capacity-Building
Ongoing support on a part-time basis to CEPA staff in reviewing and processing applications for approval of NEROP projects and monitoring impacts
2 staff-months (international) 2 staff-months (international) 2 staff-months (international)
Office of the Valuer-General
Issue up-to-date compensation values for land and crop loss resulting from NEROP projects
Technical Assistance
Conduct survey of current market prices and prepare updated lists of valuations together with procedures for future updates
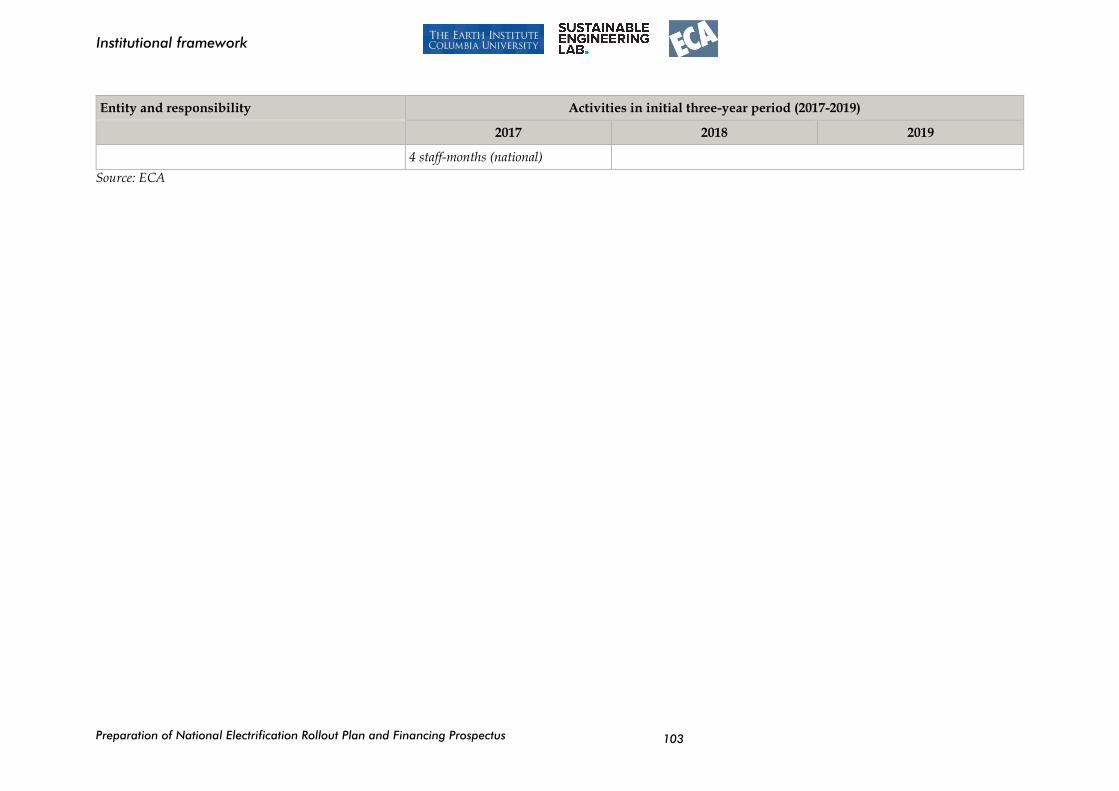
Preparation of National Electrification Rollout Plan and Financing Prospectus
Institutional framework
103
Entity and responsibility Activities in initial three-year period (2017-2019)
2017 2018 2019
4 staff-months (national)
Source: ECA
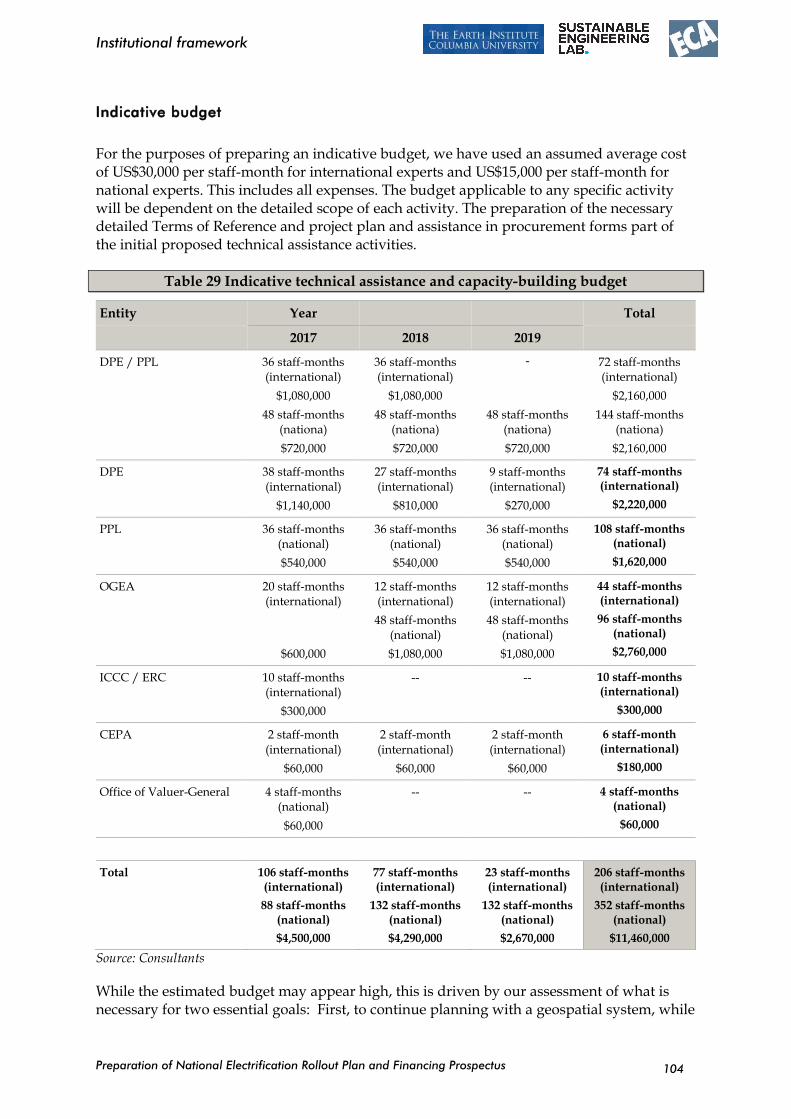
Preparation of National Electrification Rollout Plan and Financing Prospectus
Institutional framework
104
Indicative budget
For the purposes of preparing an indicative budget, we have used an assumed average cost of US$30,000 per staff-month for international experts and US$15,000 per staff-month for national experts. This includes all expenses. The budget applicable to any specific activity will be dependent on the detailed scope of each activity. The preparation of the necessary detailed Terms of Reference and project plan and assistance in procurement forms part of the initial proposed technical assistance activities.
Table 29 Indicative technical assistance and capacity-building budget
Entity Year Total
2017 2018 2019
DPE / PPL 36 staff-months (international)
$1,080,000
48 staff-months (nationa)
$720,000
36 staff-months (international)
$1,080,000
48 staff-months (nationa)
$720,000
-
48 staff-months (nationa)
$720,000
72 staff-months (international)
$2,160,000
144 staff-months (nationa)
$2,160,000
DPE 38 staff-months (international)
$1,140,000
27 staff-months (international)
$810,000
9 staff-months (international)
$270,000
74 staff-months (international)
$2,220,000
PPL 36 staff-months (national)
$540,000
36 staff-months (national)
$540,000
36 staff-months (national)
$540,000
108 staff-months (national)
$1,620,000
OGEA 20 staff-months (international)
$600,000
12 staff-months (international)
48 staff-months (national)
$1,080,000
12 staff-months (international)
48 staff-months (national)
$1,080,000
44 staff-months (international)
96 staff-months (national)
$2,760,000
ICCC / ERC 10 staff-months (international)
$300,000
-- -- 10 staff-months (international)
$300,000
CEPA 2 staff-month (international)
$60,000
2 staff-month (international)
$60,000
2 staff-month (international)
$60,000
6 staff-month (international)
$180,000
Office of Valuer-General 4 staff-months (national)
$60,000
-- -- 4 staff-months (national)
$60,000
Total 106 staff-months (international)
88 staff-months (national)
$4,500,000
77 staff-months (international)
132 staff-months (national)
$4,290,000
23 staff-months (international)
132 staff-months (national)
$2,670,000
206 staff-months (international)
352 staff-months (national)
$11,460,000
Source: Consultants
While the estimated budget may appear high, this is driven by our assessment of what is necessary for two essential goals: First, to continue planning with a geospatial system, while

Preparation of National Electrification Rollout Plan and Financing Prospectus
Institutional framework
105
monitoring and evaluating progress toward achieving NEROP (in the case of the geospatial planning platform); and, second, to ensure that NEROP is able to fully comply with the various procurement and safeguards policies of the Government and development partners from its inception. Of the total estimated technical assistance and capacity-building requirements budget of $11.5 million, around $4.4 million will provide for geospatial data and systems experts, while $4.6 million is represented by the contracting of international and national procurement and safeguards experts. For a programme of NEROP’s magnitude, this represents a relatively small part of total costs and provides assurances that allocated funds will be targeted toward disbursed in a timely fashion while remaining compliant with all relevant policies and procedures of development partners and of Papua New Guinea.
In addition to the above, it may also be desirable for development partners to support at least the initial set-up and administrative costs of OGEA in order to ensure that funding constraints do not delay its establishment. These costs would include an agency director, office manager, administrative assistants, drivers and security guards, rent of an office and provision of office equipment and transport. We have not estimated the costs of such support for the purposes of this indicative budget.
Preparation of National Electrification Rollout Plan and Financing Prospectus
Funding mechanisms
106
6 Funding mechanisms
6.1 Introduction
In this section we review the existing framework for funding implementation of NEROP. We evaluate the existing framework and use lessons from international experience to recommend improvements to the framework.
The funding framework and the institutional framework are inevitably interlinked, but we primarily discuss the institutional framework in Section 5 above.
Terms of reference
Key excerpts from the terms of reference for Task 8 relating to the review of the funding framework, are provided below:
“present options and recommendations – informed by international good
practices - for a sustainable financing policy platform and framework for syndicating, on a programmatic basis, the annual financing requirements that are acceptably shared across the main stakeholder beneficiaries”
“may include connections charge paid by beneficiaries, within sector cross-
subsidies, utility/service provider share of overall program financing requirements (self-financing from revenues), Federal Government contributions
via CSO and other subsidy schemes, Provincial/local budget contributions, earmarked revenues from other sources such as, sovereign funds, earmarked levies on extractive industry sales for exports and development partners.”
“The analysis should also recommend appropriate options for reducing the projected financing gap that can be brought about by changes in key policy and
technical variables and institutional framework, informed by good practice experience from successful and recognized national electrification programs in other countries. These include subsidy and cross-subsidy and tariff policy, and potential efficiency gains targeted within the sector, such as adoption of technical measures and designs to lower the unit costs of network”
“Ensuring affordability of access to the poor (connection charges and monthly bills to avoid exclusion) consistent with Government policy and the EIP”
“role of the Department of Treasury and Finance in the oversight and the certification process to be utilized for verifying payments of subsidy to qualifying access scale up”
“Maintaining financial/commercial viability of service delivery agents and businesses involved”
Preparation of National Electrification Rollout Plan and Financing Prospectus
Funding mechanisms
107
Structure of this section
This section is structured as follows:
Section 6.2 describes the existing mechanisms in PNG.
Section 6.3 describes and evaluates the main funding options for implementing NEROP.
Section 6.4 summarises our recommendations.
6.2 Existing mechanisms
PPL currently relies on cross-subsidies, by applying a uniform tariff, to operate
expensive off-grid systems
Cross-subsidies are implicit in PPL’s current uniform tariffs. The costs of supply power in some mini-grids is significantly higher than the electricity tariff PPL charges, with this difference being recovered from the main urban centers where costs are lower than the tariff.
PPL’s regulatory contract entitles it to recover its prudent costs through a weighted average tariff. The key excerpt from PPL’s regulatory contract is provided in the box below.
PPL Electricity Regulatory Contract 2013-2017:
“As of the Commencement Date and during the term of this Contract, the tariff to be applied by PPL for each Regulatory Year the tariff for any customer category in any service area may be less than, equal to, or greater than, the MWAP, provided however that the weighted average of all PPL’s tariffs for all customer categories in all service areas taken together shall not exceed the MWAP.”
PPL has not increased tariffs in recent years and i ts financial capacity is limited,
which makes further funding further electrification projects difficult
As described in Section 5.2.1, ICCC approved tariff increases in 2013, but PPL has not implemented them, presumably due to media statements by senior politicians. This effectively means that PPL is charging below cost-recovery levels and is running down its existing assets in order to cover operational costs. This has put significant strain on PPL’s financial position, which was further weakened in 2015 by El Nino hydrology – low hydro inflows meant that PPL’s was forced to operate its more expensive diesel generation more often.
PPL is going to have to undertake significant investments in its system just to meet the demand of its existing grids and to improve operational efficiency27. NEROP is going to add a significant additional burden. With PPL’s borrowing capacity already strained, it is safe to
27 Grid Development Rapid Review, ECA, February 2016.
Preparation of National Electrification Rollout Plan and Financing Prospectus
Funding mechanisms
108
assume that NEROP investments incurred by PPL will have to be funded by development partners and central government.
PPL is allowed to charge different tariffs in different service areas, but has kept a
uniform tariff
PPL’s Electricity Regulatory Contract explicitly allows for its tariffs to vary by service area (i.e. grid), in accordance with the EIP, which directed a move away from a nationally uniform tariff.
In practice PPL has not applied for such a tariff, nor has ICCC enforced one (they have the option to). This is presumably for political reasons, as moving away from a uniform tariff would require significant political support or PPL risk facing backlash from its customers.
Key excerpts from the relevant policy documents are provided in the box below.
Electricity Industry Policy, 2011:
“the ICCC (as the regulator of electricity price) will implement a commercial price regulation model that features price flexibilities reflecting on the costs of investments to ensure the incentives exist in both higher cost and lower cost areas of investments”
PPL Electricity Regulatory Contract 2013-2017:
“If, PPL wishes to vary prices (tariffs) by their service area, then PPL shall apply to the Regulator at the time of the annual price adjustment and shall supply a cost based justification for making the change, supported by evidence that costs are different and the rational for making the change. The Regulator may consider the proposal in terms of its effect upon future investment and the overall efficiency of the industry and the impact the price change may have on the implementation of government electricity industry policy”
The EIP envisages that future grid extensions to unprofitable areas are be funded
through up-front subsidies and grid-specific tariffs
The EIP envisages that future grid extensions will be funded by a combination of up-front capital subsidies and grid-specific tariffs. In other words, it expects that tariffs in these new areas will be set at cost-recovery levels, i.e. cover operational costs, replacement of assets, and a return on capital. The up-front capital subsidy is used to keep this cost-recovery tariff affordable for consumers.
The capital subsidies are to be funded by the national Community Service Obligation mechanism, which was updated in 2014 in the form of the CSO Policy and Guidelines. We discuss this in more detail later in this section.
The EIP explicitly rules out operational cross-subsidies, which could in theory be funded through the CSO mechanisms or via a national electricity levy.
There is an open question as to whether cost-recovery tariffs in remote areas will be affordable, even with up-front capital subsidies. The operating costs of isolated systems (run
Preparation of National Electrification Rollout Plan and Financing Prospectus
Funding mechanisms
109
largely on diesel) are likely to be so high that cost-recovery tariffs will not be socially or politically acceptable. We discuss this in more detail in Section 6.3.
Key excerpts from the EIP are provided in the box below.
Electricity Industry Policy, 2011:
“Where a CSO is identified, costed and delivered by the Government, through capital subsidies under the competitive tender process, the ICCC will enforce a form of price cap regulation on the service provider delivering the Government’s CSO to achieve efficiency in the subsidy injection (by precluding the service provider from earning rents) whilst (at the same time) enabling it a healthy commercial operation.”
“Where a CSO is identified, costed and delivered by the Government, through capital subsidies under the competitive tender process, the ICCC will enforce a form of price cap regulation on the service provider delivering the Government’s CSO to achieve efficiency in the subsidy injection (by precluding the service provider from earning rents) whilst (at the same time) enabling it a healthy commercial operation.”
“A new CSO framework for the electricity sector in PNG should ‘incentivise’ the providers of electricity service to take up investments in high cost areas of investment by disposing of the cost burden on capital investment on service providers (targeted at the project capex of private sector investments) to enable them to comfortably recover the costs of investments and make healthy profits in an electricity price regime of uniform tariffs”
“Whilst a levy can be appropriate in some circumstances, the introduction of a levy effectively increases the tax burden on electricity users and any decision on the appropriate level of taxation needs to be taken in the context of the broader fiscal strategy”
The national CSO framework has not yet been fully implemented and therefore
no centralised funding is available at present
The CSO Policy and Guidelines define a framework for providing CSO funding to PPL and other service providers. Unlike the EIP, the CSO Policy is not explicit about how funding is provided, but rather lets it be decided on a case-by-case basis for each industry, although it does express a preference for direct budget allocations.
At present the CSO Policy has not been implemented for any state-owned enterprises due to a shortage of funding. Department of Treasury have however put PPL on a short list of SOEs to be used for piloting the new CSO approach. All CSO funding must be approved by the NEC and DNPM.
Key excerpts from the relevant policy documents are provided in the box below.
Electricity Industry Policy, 2011:
Electricity Industry Policy, 2011: “CSOs are most appropriately paid for through the national budget. This will entail the application for budgetary allocations for CSOs in the electricity sector by the responsible Department to the Departments of Treasury and Finance.”
Preparation of National Electrification Rollout Plan and Financing Prospectus
Funding mechanisms
110
PNG Community Service Obligation Policy for State Owned Enterprises, 2012:
“The CSO Policy shall only apply to the provision of CSOs by SOEs.”
“Any part of the cost of delivering the CSO that can be recovered through User Fees or from any third party, including local or regional government, donors or any other source, shall be deducted from the amount payable by the Government to the SOE”
Community Service Obligation Guidelines, 2012:
“SOE should clearly establish how it has accounted for capital and operating costs within its costings and provide full reasons and justifications where it seeks to recover capital and/or operating costs as part of the CSO funding”
“Applicants should, as part of the CSO application process, identify the funding method most preferred and reasons for electing that method.”
“The Ministers for Treasury, Public Enterprises & State Investments and National Planning and Monitoring (DNPM) must jointly approve the submission of any application to NEC for the approval of and funding for a CSO.”
“IPBC will establish and maintain the Register of CSOs provided by SOEs.”
Policy envisages that CSO funding goes into an electrification fund, but this has
also not been implemented
Electricity Industry Policy envisaged an Electricity Trust Fund, which is essentially used to fund centrally planned electrification (presumably either for mini-grid subsidies or for CSO-funded PPL grid extensions).
The fund has not been established to-date.
Key excerpts from the relevant policy documents are provided in the box below.
Electricity Industry Policy, 2011:
“An Electricity Trust Fund (ETF) will be established and the monies in which will be held in trust by the Departments of Finance and Treasury. Funds will only be released on the recommendation of the EMC and subject to the terms of the trust instrument”
“The money that is allocated to the ETF for a given year is expected to be fully exhausted in that year, and will be held in trust otherwise and utilized in the subsequent year.”
“The ETF will remain in the custody of the DoT.”
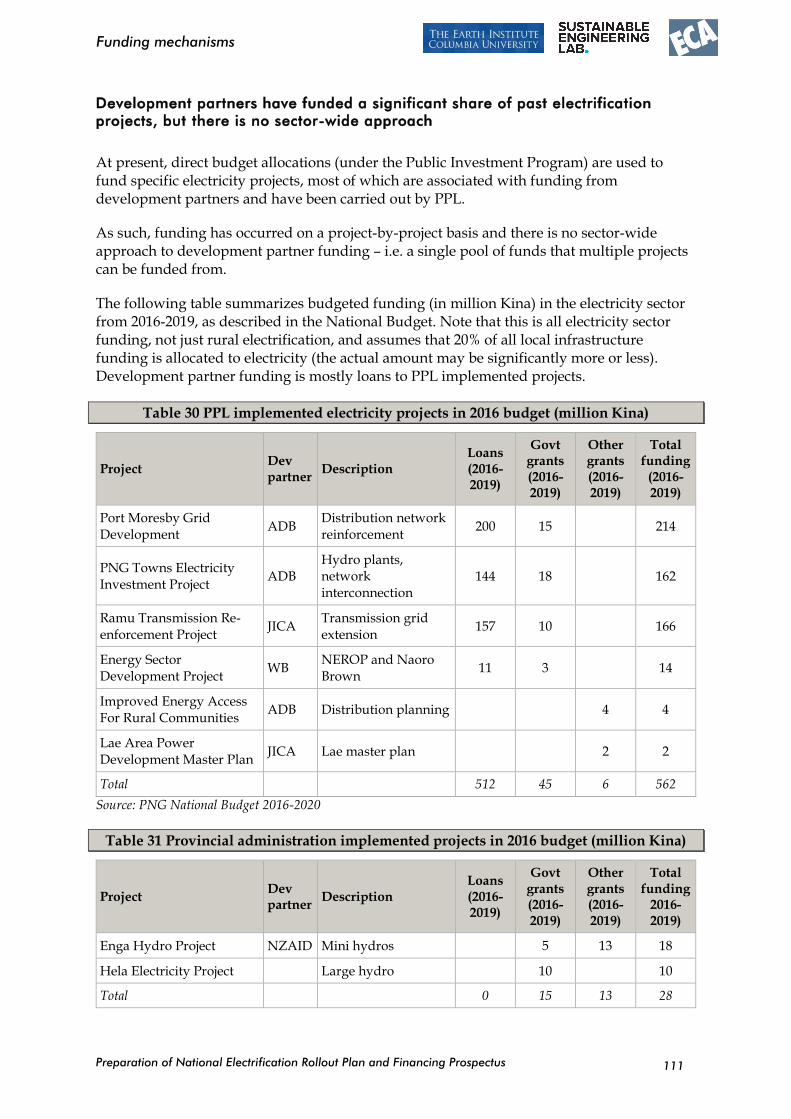
Preparation of National Electrification Rollout Plan and Financing Prospectus
Funding mechanisms
111
Development partners have funded a significant share of past electrification
projects, but there is no sector-wide approach
At present, direct budget allocations (under the Public Investment Program) are used to fund specific electricity projects, most of which are associated with funding from development partners and have been carried out by PPL.
As such, funding has occurred on a project-by-project basis and there is no sector-wide approach to development partner funding – i.e. a single pool of funds that multiple projects can be funded from.
The following table summarizes budgeted funding (in million Kina) in the electricity sector from 2016-2019, as described in the National Budget. Note that this is all electricity sector funding, not just rural electrification, and assumes that 20% of all local infrastructure funding is allocated to electricity (the actual amount may be significantly more or less). Development partner funding is mostly loans to PPL implemented projects.
Table 30 PPL implemented electricity projects in 2016 budget (million Kina)
Project Dev partner
Description Loans (2016-2019)
Govt grants (2016-2019)
Other grants (2016-2019)
Total funding
(2016-2019)
Port Moresby Grid Development
ADB Distribution network reinforcement
200 15 214
PNG Towns Electricity Investment Project
ADB Hydro plants, network interconnection
144 18 162
Ramu Transmission Re-enforcement Project
JICA Transmission grid extension
157 10 166
Energy Sector Development Project
WB NEROP and Naoro Brown
11 3 14
Improved Energy Access For Rural Communities
ADB Distribution planning 4 4
Lae Area Power Development Master Plan
JICA Lae master plan 2 2
Total 512 45 6 562
Source: PNG National Budget 2016-2020
Table 31 Provincial administration implemented projects in 2016 budget (million Kina)
Project Dev partner
Description Loans (2016-2019)
Govt grants (2016-2019)
Other grants (2016-2019)
Total funding
2016-2019)
Enga Hydro Project NZAID Mini hydros 5 13 18
Hela Electricity Project Large hydro 10 10
Total 0 15 13 28
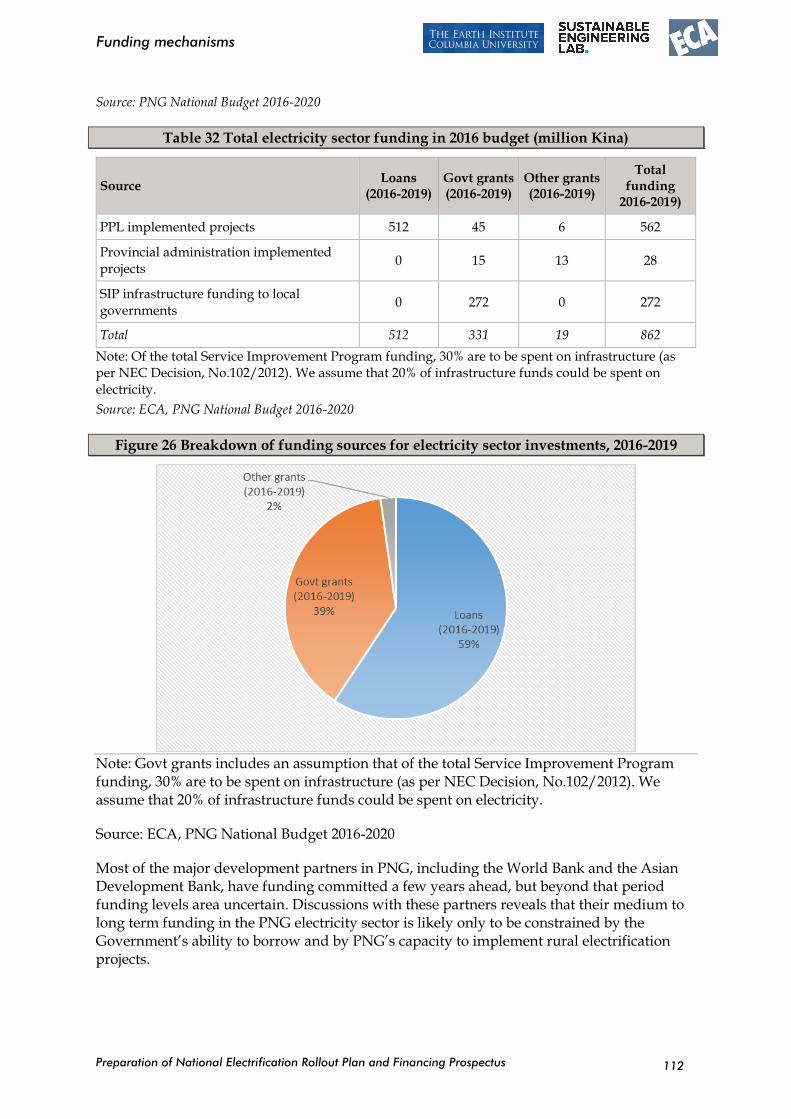
Preparation of National Electrification Rollout Plan and Financing Prospectus
Funding mechanisms
112
Source: PNG National Budget 2016-2020
Table 32 Total electricity sector funding in 2016 budget (million Kina)
Source Loans
(2016-2019) Govt grants (2016-2019)
Other grants (2016-2019)
Total funding
2016-2019)
PPL implemented projects 512 45 6 562
Provincial administration implemented projects
0 15 13 28
SIP infrastructure funding to local governments
0 272 0 272
Total 512 331 19 862
Note: Of the total Service Improvement Program funding, 30% are to be spent on infrastructure (as per NEC Decision, No.102/2012). We assume that 20% of infrastructure funds could be spent on electricity.
Source: ECA, PNG National Budget 2016-2020
Figure 26 Breakdown of funding sources for electricity sector investments, 2016-2019
Note: Govt grants includes an assumption that of the total Service Improvement Program funding, 30% are to be spent on infrastructure (as per NEC Decision, No.102/2012). We assume that 20% of infrastructure funds could be spent on electricity.
Source: ECA, PNG National Budget 2016-2020
Most of the major development partners in PNG, including the World Bank and the Asian Development Bank, have funding committed a few years ahead, but beyond that period funding levels area uncertain. Discussions with these partners reveals that their medium to long term funding in the PNG electricity sector is likely only to be constrained by the Government’s ability to borrow and by PNG’s capacity to implement rural electrification projects.
Preparation of National Electrification Rollout Plan and Financing Prospectus
Funding mechanisms
113
Central government funding is likely to be constrained
The PNG Government is in a tight fiscal situation at present28, and this situation is likely to continue in the face of falling commodity prices. Therefore, while it has shown a strong policy commitment towards achieving the rural electrification target, it remains to be seen whether the government can make sufficient funding available to make it happen.
This is evidenced in the fact that only 60 million Kina out of the total 862 million Kina budgeted for the electricity sector from 2016-2019 comes from the central government allocation. However, a significantly larger amount is made available indirectly through local governments, as discussed below. The lack of funding to implement the recently created CSO mechanism is another example of the fiscal constraints the central government faces.
There is significant potential for funding from local government budgets
There is already funding for electrification via provincial and district governments budget allocations, specifically via the Provincial Support Investment Programs, District Support Investment Programs, and Local-Level Government support. As shown in the table and figure above, this is potentially the biggest pool of government funding made available to the electricity sector. However, the actual amount made available to electricity is at the discretion of local governments. 30% of Support Investment Program (SIP) funds is earmarked for infrastructure, which local governments are free to allocate as they see fit.
Going forward it will be somewhat complex (although achievable, as discussed in Section 6.3) to use these funds to implement an electrification master plan, as they are specific to provinces/districts rather than centrally controlled. As such, a mechanism will need to be defined for prioritising electrification in areas where funding has made available by local level government.
More specifically, there are possible constraints around the use of SIP funds by a central implementing agency (such as the proposed OGEA). For example, our interpretation of the Administrative Guidelines is that29:
Projects need to fit into the district development plan (which may not be the same as NEROP).
The tendering requirements need to be managed at district level and conform to the DSIP rules (which may well differ from OGEA, WB, ADB rules).
Projects cannot be partly funded by SIP. They are either completely funded/implemented by local governments or not at all.
28 http://www.businessadvantagepng.com/2016-will-bring-pressure-on-papua-new-guinea-government-finances-and-currency-says-asian-development-bank/ 29 http://www.pcabii.org/resources/resources/Gov%20Documents/Administrative%20Guidelines%20PSIP%20DSIP%20LLGSIP.pdf
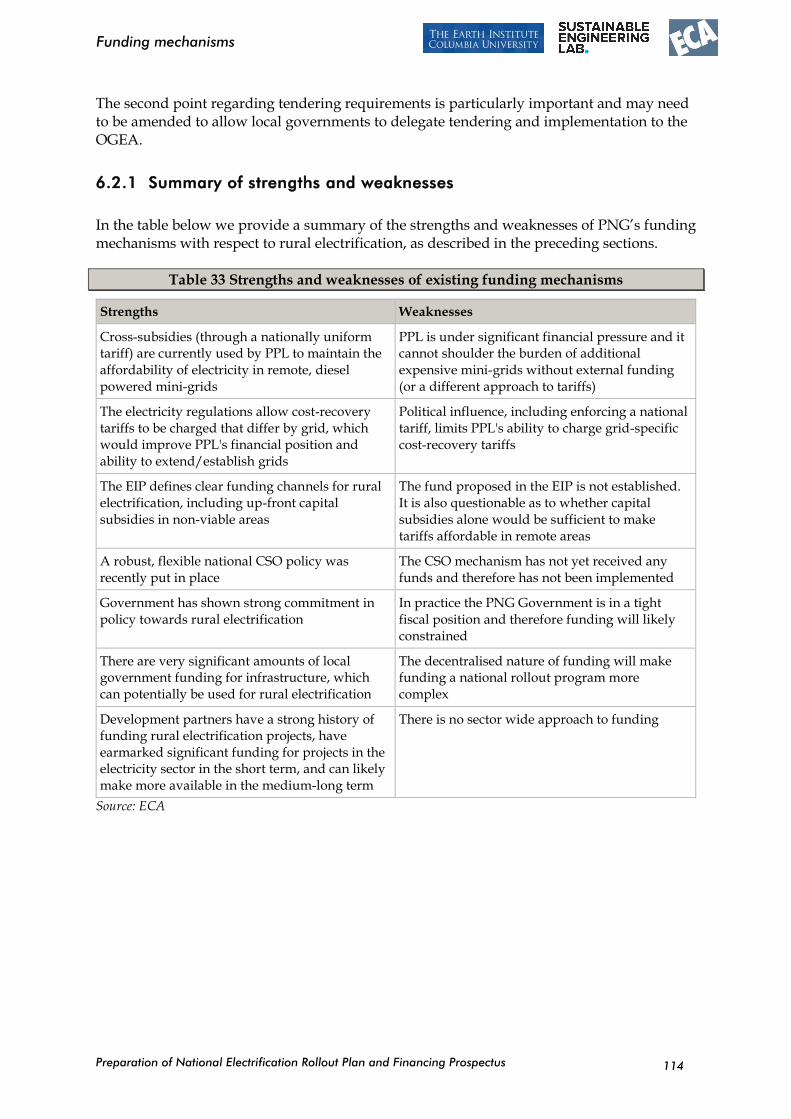
Preparation of National Electrification Rollout Plan and Financing Prospectus
Funding mechanisms
114
The second point regarding tendering requirements is particularly important and may need to be amended to allow local governments to delegate tendering and implementation to the OGEA.
6.2.1 Summary of strengths and weaknesses
In the table below we provide a summary of the strengths and weaknesses of PNG’s funding mechanisms with respect to rural electrification, as described in the preceding sections.
Table 33 Strengths and weaknesses of existing funding mechanisms
Strengths Weaknesses
Cross-subsidies (through a nationally uniform tariff) are currently used by PPL to maintain the affordability of electricity in remote, diesel powered mini-grids
PPL is under significant financial pressure and it cannot shoulder the burden of additional expensive mini-grids without external funding (or a different approach to tariffs)
The electricity regulations allow cost-recovery tariffs to be charged that differ by grid, which would improve PPL's financial position and ability to extend/establish grids
Political influence, including enforcing a national tariff, limits PPL's ability to charge grid-specific cost-recovery tariffs
The EIP defines clear funding channels for rural electrification, including up-front capital subsidies in non-viable areas
The fund proposed in the EIP is not established. It is also questionable as to whether capital subsidies alone would be sufficient to make tariffs affordable in remote areas
A robust, flexible national CSO policy was recently put in place
The CSO mechanism has not yet received any funds and therefore has not been implemented
Government has shown strong commitment in policy towards rural electrification
In practice the PNG Government is in a tight fiscal position and therefore funding will likely constrained
There are very significant amounts of local government funding for infrastructure, which can potentially be used for rural electrification
The decentralised nature of funding will make funding a national rollout program more complex
Development partners have a strong history of funding rural electrification projects, have earmarked significant funding for projects in the electricity sector in the short term, and can likely make more available in the medium-long term
There is no sector wide approach to funding
Source: ECA
Preparation of National Electrification Rollout Plan and Financing Prospectus
Funding mechanisms
115
6.3 Evaluation of options
6.3.1 Introduction
Key ingredients to a successful mechanism
A number of studies30 identify that the adequate funding of electrification programs, including the cost-recovery of individual schemes, is absolutely critical to successful implementation. For example:
“Cost recovery is probably the single most important factor determining the long-term effectiveness of rural electrification programs”
More specifically, the key ingredients to the successful funding of electrification programs include:
Funding should combine government sources with public private
partnerships, to alleviate the burden of large up-front capital investments.
Universal access cannot be achieved without significant external funding
assistance, with a substantial proportion of the capital obtained at concessionary rates or in the form of grants.
Charging a price which broadly reflects the underlying cost of the service is
important to ensuring the sustainability of schemes.
However, affordability (and therefore the sustainability of schemes) is very
challenging, particularly in remote rural areas.
All rural electrification programs worldwide have involved some form of subsidy.
There is no evidence that one form of subsidy is good or bad, given that the forms of subsidies in successful programs have varied substantially, including capital subsidies, subsidy funds based on principles of output based aid, bulk power subsidies, and others.
We use these lessons as a means of recommending funding mechanisms in the following sections.
6.3.2 Tariffs and connection charges
It is highly unlikely that NEROP can be funded by tariffs alone. This is consistent with international experience that all successful electrification programs have involved subsidies.
30 Particularly useful studies, include (1) Achieving Universal Access to Modern Energy in East Asia and the Pacific, The World Bank, 2011 (2) Meeting the Challenge of Rural Electrification in Developing Nations, Douglas F Barnes, 2005, (3) Review of Experiences with Rural Electrification Agencies, Lessons for Africa, EUEI-PDF, 2008, (4) How Small Power Producers and Mini-Grids Can Deliver Electrification and Renewable Energy in Africa, Bernard Tenenbaum et al, 2014
Preparation of National Electrification Rollout Plan and Financing Prospectus
Funding mechanisms
116
Limited funding can be made available from connection charges, but even these will need to be subsidised. We discuss affordability of tariffs for mini-grids and grid extensions in more detail below.
Tariff affordability in mini-grids
While data is difficult to obtain on rural household incomes, it is reasonable to expect that many poorer households will be unable to afford the ongoing costs of electricity supply from isolated mini-grids even if capital costs are fully subsidised.
Our approximate estimate of operating a mini-grid in more remote regions, including fuel costs for a diesel generator, other operation and maintenance costs, and depreciation/replacement costs is $0.50c/kWh (K1.6/kWh). On top of this needs to be added the retail costs/margin of the operator and debt servicing (on concessionary loans), which takes the total recurring cost to something in the order of US$55c/kWh (K1.7/kWh). In Section 1 we test this against affordability limits and determine the operational subsidy required.
Socio-economic surveys conducted for a recent ADB-funded roads program in the Highlands reported average monthly household incomes in three different regions as K955, K819 and K34431. If consuming just 50 kWh per month, then these households would be spending at from 8% to 25% of income on a very basic level of supply and without making any contribution to the capital costs of investing in or replacing the mini-grid.
Tariff affordability in main grids
In principle, affordability for new customers connected to the main grids, in particular the Port Moresby and Ramu grids, should be less problematic than for mini-grids. This is for a number of reasons:
Costs of supply are generally cheaper on the main grids, which have access to hydro power rather than relying on diesel generation and which benefit from economies of scale. These costs may fall further in future as further hydro power opportunities are developed.
There is a reasonably large and relatively well-off32 urban customer base which can be used to cross-subsidise supplies at a lifeline level to rural households.
31 See http://www.adb.org/sites/default/files/project-document/78619/40173-043-png-rp-02.pdf (para. 82), http://www.adb.org/sites/default/files/project-document/78621/40173-043-png-rp-01.pdf (para. 88) and http://www.adb.org/sites/default/files/project-document/78620/40173-043-png-rp-03.pdf (para. 74). 32 While urban households are generally better-off than rural households this should not be taken to mean that electricity tariffs to urban customers can increase indefinitely to fund cross-subsidies. The Resettlement Plan prepared for the ADB-funded Port Moresby Grid Expansion Project reports, for example, that the average monthly income of households affected by the Kilakila substation investment, located in a poorer area of NCD, was K1,560. Assuming average monthly consumption of 100 kWh then these households would already be spending close to 5% of their incomes on electricity. (http://www.adb.org/sites/default/files/linked-documents/43197-013-png-rpab.pdf, para. 39).
Preparation of National Electrification Rollout Plan and Financing Prospectus
Funding mechanisms
117
However, this does not mean that affordability concerns will disappear. As the grid expands, an increasing share of customers will come from poor households. This will tend to increase the need for cross-subsidies from urban areas and create upward pressures on tariffs which are already very high. It may also result in most of the gains from reducing generation costs being allocated to rural customers which could be politically difficult to sustain.
Our estimate is that the recurring costs of grid extensions will average US$0.29/kWh, which is approximately 25% higher than current retail tariffs (US$0.23/kWh) and therefore an increase in tariffs will be required to cover these costs. We discuss this size of the increase required in Section 1.
Regulating tariffs
The introduction of thousands of new off-grid solutions under NEROP will make it infeasible for the regulator to review costs and set tariffs in each case. Instead, the regulator would have to apply different approaches to tariff regulation depending on the size of the community. For example:
Main grids could be subject to a detailed tariff review, as per the current arrangements.
Mini-grids could be subject to a simple price formula, whereby the operator sets tariffs based on a summation of key costs. The regulator would not carefully inspect evidence of these costs, unless complaints from consumers are received.
Micro-grids could be subject to a fixed tariff, unless a special application is made to the regulator.
Solar home systems would not be regulated.
We envisage that when mini-grids are tendered out (under BOT or DBO contracts), the tariff would be specified for the initial years (e.g. 5) of the contract. This gives the investor strong certainty of cost recovery, particularly while it is still servicing its debt. In the later years, the tariff could revert to being set by the regulator, which allows flexibility for future changes in costs.
Operators of multiple grids could be given the option of charging a uniform tariff across its grids, as a way of cross-subsidising its more expensive grids, as per PPL’s current regulatory contract. This approach was successfully used in the Philippines as a way of addressing affordability concerns and has recently been adopted for water supply in Columbia (which has extensive private sector participation).
Regulating the provision of lifeline tariff should also be considered as a means of improving affordability. During Costa Rica’s rural electrification program in the 70s, a tariff was offered at significantly reduced price for the first 30 kWh.
There are various international examples of the successful regulation of mini-grids, which the regulator can use to define an appropriate framework. We discuss capital and operating subsidies in the following sections.
Preparation of National Electrification Rollout Plan and Financing Prospectus
Funding mechanisms
118
Connection charges
Connection and associated costs such as wiring can be a major barrier to increasing electrification even if electricity supplies are affordable. Connection costs, as with other costs in PNG, are noticeably higher being estimated at US$330 (K1,000) which exceeds the monthly income of many rural households.
Achieving the government’s electrification targets implies that connection costs will need to be reduced and/or support provided to households in paying these costs. International experience has shown in many cases that households are willing to pay the full costs of connections if they can do so over time. It is the one-off cash expense of connection that acts as the barrier.
A number of countries have developed innovative programmes to assist in paying connection costs. For example, Lao PDR provides subsidised loans to poorer households to cover connection charges. Targeting is largely based on physical indicators of poverty such as female-headed households, lack of land and animals and insufficient rice crops.
We assume that connection charges in the order of US$150 per household on average. Households will not be asked to pay this upfront, but rather through a series of instalments (for example payments of US$10 per month for 3 years).
6.3.3 Capital cost subsidies
Capital cost subsidies are the primary mechanism for funding rural electrification programs worldwide. By reducing the installation cost of the generators and distribution grid, either through grant funding or concessionary loans, many schemes are then able to charge affordable tariffs that fully cover the remaining costs of operating the system.
Types of capital cost subsidies
The options for disbursing capital cost subsidies depend on the institutional arrangements in each country. In Section 5 we recommend that PPL implement grid extensions and that mini-grids are tendered out under BOT or DBO contracts. This has the following implications:
Grid extensions: These would be eligible for capital subsidies, but only where PPL can demonstrate that the extensions are not commercial viable, in that the future revenues from supplying those new customers does not fully recover the costs of the grid extension (at current tariffs).
Mini-grids: When the grid is tendered out, interested parties bid either the upfront capital subsidy required to make the investment commercially viable (under a BOT, where the private sector finances the remainder of the investment) or they bid a lease fee (under a DBO, where the public sector fully finances the upfront cost).
In both cases, the subsidy could be either a grant or a concessionary loan. This decision can be made at a later date once the lifecycle costs of investments and their attractiveness to the private sector are better understood. Successful rural electrification programs in Costa Rica
Preparation of National Electrification Rollout Plan and Financing Prospectus
Funding mechanisms
119
and Bangladesh both had success utilising concessionary loans. However, in PNG we expect that many of the schemes may be so remote and expensive that a concessionary loan is insufficient to make the investment viable.
Sources of capital cost subsidies
The two main sources for capital cost subsidies are government – both central and local government in PNG’s case – and development partners. Given the projected high costs of NEROP (as detailed in Section 1), both sources are likely to be needed. Central government funding would presumably be channelled through the existing CSO mechanism and into this fund, local government funding would come via the SIP, and development partners would contribute directly.
Electrification fund
To ensure that funds can be disbursed efficiently and without bottlenecks, a central electrification fund can be established that combines funds from all sources. The rules for disbursing from the electrification fund would have to meet development partner requirements, but give the agency who is responsible for administering the fund sufficient autonomy to disburse funds without going through a lengthy approval process each time. This effectively means introducing a sector wide approach to development partner funding, rather than the project-by-project approach that is currently applied.
As per our recommendations in Section 5.3 the electrification fund would be administered by the DPE, the lead policy-making agency.
Local governments could offer to top-up or fully cover the available funding for a particular scheme in their province. By doing so they bring forward the scheme to the top of the queue and relieve the pressures on the central fund.
6.3.4 Operational subsidies
International experience shows that operational subsidies should generally be avoided where possible, because of the risks they pose to the sustainability of schemes and the economic signals that they send to consumers (i.e. pricing electricity too cheaply can encourage over-consumption). However, as discussed in Section 6.3.2, we expect that in PNG operational subsidies may be a necessary evil for many mini-grids tariffs, at least until income generation, and therefore tariff affordability, improves.
Types of operational subsidies
The two possible sources of operational subsidies are:
Government grants, presumably directed through the CSO mechanism, which does not explicitly prohibit funding recurrent costs; or
Other electricity consumers, either implicitly through cross-subsidies (as per the current practice of PPL) or explicitly through an electricity levy. In countries
Preparation of National Electrification Rollout Plan and Financing Prospectus
Funding mechanisms
120
where the electricity sector is unbundled, a cross-subsidy can be implemented through wholesale power purchases prices, as applied in Thailand.
Development partners do not typically fund recurrent costs and are therefore not a possible source of operational subsidies.
International experience shows that there are serious risks to relying on operational subsidies sourced from government budgets. In particular, there is the risk that funding is diverted to other needs and schemes collapse without the subsidy. The fact that for the past two years no funds have been allocated to PNG’s CSO mechanism is a warning sign. The private sector would perceive any investment that relies on ongoing government funding as being very risky.
Electricity levy
Because we recommend that a separate OGEA be established and that the private sector be involved in operating mini-grids, it will not be possible to implicitly cross-subsidise expensive mini-grids with PPL’s main grids. Therefore, an electricity levy would be needed, which is an additional charge (usually per kWh) on consumers’ electricity bills, the revenue from which goes to a central fund.
We propose that the central funds for capital subsidies and operational subsidies are kept separate, given that the both the sources and delivery of the funds is different.
Disbursement of subsidies
Disbursement of subsidies among schemes would likely require setting an affordability cap on tariffs, which is set by the regulator. If the cost-recovery tariff (after capital subsidies are taken account of) exceeds this cap, then the scheme operator would be eligible for a subsidy that makes up the difference.
The electricity levy would be adjusted periodically to ensure that there are sufficient funds to pay operational subsidies. A similar approach is applied in the Philippines.
6.4 Summary of recommendations
International experience clearly demonstrates that cost-recovery is a critical factor in the success of electrification programs. The cost of operating mini-grids in PNG (including capital replacement) is likely to exceed $0.50/kWh in many cases, which will likely not be affordable for many rural households. We therefore expect that capital, operational, and connection subsidies will be needed in many cases to ensure that operators can fully recover their costs.
Our recommended funding mechanisms are summarised in the figures below.
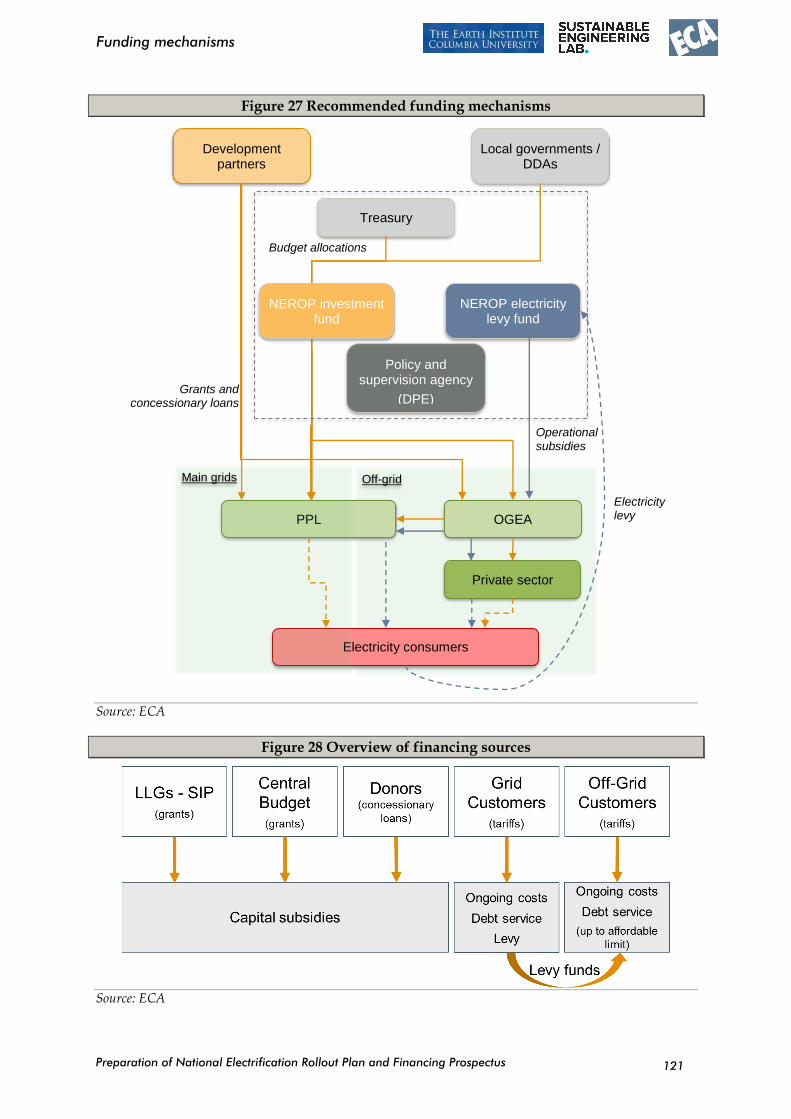
Preparation of National Electrification Rollout Plan and Financing Prospectus
Funding mechanisms
121
Figure 27 Recommended funding mechanisms
Source: ECA
Figure 28 Overview of financing sources
Source: ECA
Off-grid
Policy and supervision agency
(DPE)
Development partners
OGEA
Treasury
Local governments / DDAs
NEROP electricity levy fund
PPL
Private sector
Electricity consumers
Grants and concessionary loans
Operational subsidies
Main grids
Electricity levy
Budget allocations
NEROP investment fund
Preparation of National Electrification Rollout Plan and Financing Prospectus
Funding mechanisms
122
Our specific recommendations are provided below.
Subsidise the upfront capital costs using a central fund
Central government and local government should contribute to an electrification fund, administered jointly by the lead policy making agency (DPE) and Treasury. This fund is used to subsidise the upfront capital costs of:
Grid extensions, where PPL can demonstrate that the extension would otherwise not be commercially viable.
Establishing mini-grids, based on the subsidy bid under the tendering process.
Both capital grants and concessionary loans should be considered as options for providing capital subsidies.
DPE will provide input into PPL’s and OGEA’s prioritisation of areas/schemes (grid extension and off-grid respectively) and jointly administer all central funding with Treasury. Local governments should be able to top-up or fully cover the available funding for a particular scheme in their province. By doing so they bring forward the scheme to the top of the queue and relieve the pressures on the central fund.
Assist opportunities for donors to co-finance projects with capital subsidies
Donors are unwilling to provide funding through a mechanism that is managed by a Government of Papua New Guinea entity. However, they can be encouraged to co-finance investments in specific projects or general areas, e.g. geographic areas.
Both capital grants and concessionary loans should be considered as options for providing capital subsidies.
To the extent possible, transactions costs should be minimised by bundling investment opportunities. Donors are anticipated to prefer providing financial support directly to infrastructure construction by financing contractors for specific works.
Charge an electricity levy that funds operational subsidies for expensive schemes
An electricity levy should be added to consumers’ electricity bills, the revenue from which goes to another central fund that is administered by the lead policy making agency (DPE) and is used to provide operational subsidies in select cases. Schemes would be eligible for an operational subsidy if the cost-recovery tariff is higher than the affordability cap set by the regulator. This arrangement effectively puts in place a cross-subsidy from main grid customers to mini-grid customers.
Subsidise the cost of connecting to the grid
The charges for connecting to the grid should be kept below cost, particularly for rural households who have limited ability to make a large one-off payment. This should ensure that there is strong uptake in services.

Preparation of National Electrification Rollout Plan and Financing Prospectus
Funding mechanisms
123
There are suggestions that the total connection cost for customers should not exceed 50 Kina, and that customers are unlikely to partake in financing/instalment plans, preferring instead to pay their full contribution up front. Different definitions of connection should be explored as a means of targeting subsidies, e.g. a simple ‘ready-box’ connection for the poorer households, that is fully subsidised, or a lower subsidy for higher standard connections with more extensive wiring.
Differ regulation of tariffs depending on the size of the grid
The introduction of thousands of new mini-grids under NEROP will make it infeasible for the regulator to separately review costs and set tariffs for every single grid. Instead, the regulator should apply different approaches to tariff regulation depending on the size grid, for example a full cost of service review for the main grids and light-handed regulation (e.g. a simple price formula) for mini-grids.
To minimise the risks for investors in mini-grids, but also build flexibility into the contract, tariffs should be fixed for the initial years of the contract and be set by the regulator thereafter.
Lifeline tariffs and allowing operators to cross-subsidise between their licensed grids should also be used as tools to improve the affordability of tariffs.
Preparation of National Electrification Rollout Plan and Financing Prospectus
Environmental and social considerations
124
7 Environmental and social considerations
7.1 Introduction
Overview of demographics in PNG
Eighty-seven per cent of Papua New Guinea’s (PNG) approximately eight million people live in rural areas which are represented by a diverse and highly fragmented population with over 800 distinct languages. Population densities outside of major urban centers and the Highlands are very low although relative to the amount of arable land, actual densities are quite high. Even though PNG has experienced very high per capita economic growth rates in excess of 8 percent the benefits are not very widespread as of yet and PNG has poverty rates in excess of 30%. Access to electricity is available to approximately only 12% of all households33, mainly in urban areas while the majority of the population who live in highly spread out country locations do not have any access to electricity. Access to electricity is seen as an important driver of development to improve living standards as a basic social need. Women and children are particularly disadvantaged by this very low access, as electricity is seen as critical for completing basic education and providing competent health facilities.34 The PNG Government recognizes this as a major development objective and this is one of the objectives of the Vision 2050 development plan.
NEROP will address this shortfall and has set a target of increasing access to electricity to 70% of the population by 2030. This will be undertaken as an extension of the existing transmission line system, by isolated grid systems and standalone solar photovoltaic (PV) systems. These will be designed and operated as least cost systems to provide reliable electrical connections to the largest number of communities. The systems will be suitable for both public and private investment.
Terms of reference
This section addresses Task 10 of the ToR for the project which is a high level scoping of the environmental and social implications relating to NEROP. More specifically, it involves reviewing and assessing the various national and international regulatory systems regarding management of environmental and social issues and the impact that they have on the capacity of the PNG organisations to implement NEROP.
33Development Strategic Plan 2010-2030. 34 Evidence from the TEIP is that in some communities while men attached an important priority to electrification women argued that, unless they had access to clean water for all household members, household electrification was a lesser priority. Similar evidence is forthcoming from some other studies but it needs to be kept in mind that a holistic approach to community development would or should explore all priorities and assist potential beneficiaries think through the developmental potentialities.
Preparation of National Electrification Rollout Plan and Financing Prospectus
Environmental and social considerations
125
Structure of this section
The remainder of this section is structured as follows:
Description of the three proposed energy systems
Identification of potential environmental and social impacts associated with the three proposed energy systems.
An outline of the regulatory frameworks that may impact on the environmental and social safeguard assessment and approval of NEROP projects that investors will be required to comply with.
A review of the capacity of the institutions that will be involved in the implementation of social and environmental safeguards for NEROP projects.
A summary of this section
7.2 Description of the different options for delivery access to
electricity
As described in Part 1 of this report, each community is to be electrified by one of three different delivery systems:
1. Extension of PPL’s existing grids;
2. Construction of isolated grids that may include several generation sources including mini hydropower, diesel, and a combination of diesel and photo voltaic systems; or
3. Solar PV systems used for small settlements.
Each of these has different implications for the social and environmental impacts, as discussed below.
PPL grids
PPL have three existing main grids: POM, Ramu, and Gazelle. Extending these grids involves new low and medium voltage distribution lines. New generating capacity for the main grids and new HV transmission lines are outside the scope of NEROP.
Extending PPL’s medium and low voltage distribution network includes the following components:
An easement that may be up to 10 m wide depending on the line capacity and height of surrounding vegetation. The easement is kept clear of high vegetation to maintain safe conductor clearances both vertically and horizontally.
Preparation of National Electrification Rollout Plan and Financing Prospectus
Environmental and social considerations
126
The easement is ratified by an agreement that is arranged between PPL and the communities who are located along the transmission line. This gives PPL rights to maintain the conductors, towers and access roads.
The communities are allowed access to the easement for agricultural activities so long as vegetation is kept within the specified conductor clearances. The communities are paid an annual fee for maintaining the easement by clearing the vegetation along it. No other payments are made to the communities.
A series of poles to string the conductors on with cross arms as required to support the conductors.
Conductors and insulators. The conductors are normally wound stranded aluminium cables that are attached to high quality ceramic insulators located on the cross arms.
An access track as required for maintenance.
Isolated girds
Where it is not practical to extend the grid system, isolated grids will be constructed. Several types of systems may be used, employing a range of generation options (generally diesel, solar photovoltaic, micro- or pico-hydro, hybrid).
Several diesel-powered isolated local grid systems have already been installed in PNG, e.g. Bialla, West New Britain. These are mainly installed and operated by PPL.
Components of isolated grid systems include:
A generation system, which may be diesel, micro-hydro, photovoltaic, or hybrid.
Diesel powered generators may typically be 415 V. The diesel system will require diesel storage that may be up to 1000 L stored in an overhead tank. Depending on access to supply additional diesel may need to be stored in 200 L drums which will then be transferred to the main tank by pumping. The engine, generator and switch gear will be housed in a small secure building with a concrete floor. Additionally, the diesel tank and reserve drums will require a bonded concrete platform for safe diesel storage.
Micro-hydro systems will require a small intake to be built on a water course, leading to a pressure pipe (penstock) and a turbine with a generator normally with a 415 V output. The turbine, generator and switch gear will be housed in a secure building with a concrete floor. Provision for storing lubricants will be required.
Where hybrid systems using photo-voltaic panels are used these will normally be the prime generation source and will be supplemented by diesel power as required to meet the generation gap. The panels will be located close to the diesel generation system and may be placed on roofs or installed as a standalone system of panels grouped on the ground.
Preparation of National Electrification Rollout Plan and Financing Prospectus
Environmental and social considerations
127
Depending on the design the system may or may not require storage batteries.
Distribution lines.
For diesel and micro-hydro systems, a transformer may be required to convert the generator output to supply LV (or MV) distribution lines. The transformer will be placed within the secure fenced area surrounding the generation facility.
For hybrid systems, the PV panels will feed into an inverter to convert DC to AC power and then (perhaps to a transformer) to feed the LV or MV distribution line.
All systems will require road access and have security fencing.
Land acquisition for the micro-hydro will be greater than the other systems whereby secure land ownership may be required for the intake, penstock, and power station. The actual land requirement will not be great but it will vary for each installation depending on the length of the penstock.
Land acquisition for the hybrid systems may also be greater depending on where the PV panels are located. Should this be a rooftop array there is no expected land requirement while a ground array of panels will require additional land requirements.
Solar home systems
Where remote locations with no or limited road access are to be electrified, solar PV systems will likely be installed. They will have limited output and will be used to electrify small remote communities. These are considered to be the most expensive system to install. The components include:
Photovoltaic systems consist of a series of panels. Installations are expected to consist of several panels combined into one installation for ease of operation, rather than as a series of widely dispersed discrete household installations.
A series of storage batteries will be required to meet supply during periods of low sunshine intensity or after sundown. The batteries may be either conventional lead acid or in the future may include the next generation of NiCad or Lithium–ion storage batteries. The batteries and switch gear with an inverter/transformer will be housed in a shed, which may need to be security fenced.
Distribution will include local LV lines, and possibly limited MV lines with transformer.

Preparation of National Electrification Rollout Plan and Financing Prospectus
Environmental and social considerations
128
7.3 Potential environmental and social impacts
Overall, the electrification systems proposed under NEROP will have few adverse environmental impacts. This is largely because the electrification systems being proposed under NEROP are basic and the sub-projects35 will be of a small size. This will reduce the magnitude of the environmental and social impacts.
The particular impacts that are identified for NEROP are expected to be few, of minor significance and are limited to location, construction and operation impacts. Both environmental and social impact significance will depend on the conditions found at each site and will need to be individually determined at the time of project selection. While impacts are expected to be of limited significance the following potential impacts will need to be considered during any standalone project appraisal.
Potential impacts may include any of the following. These are discussed with regard to location, construction and operation for each of the three generation and distribution systems. The identified impacts correspond with those identified in the World Bank Operational Procedures or are identified as Prescribed Activity under the Environment Act 2000.
While the WB OPs are extensively discussed these form the template for other lending organisations safeguards and an understanding of the WB OPs provides a good understanding of the other lenders safeguard requirements.
7.3.1 Location or siting impacts
Acquisition of land and payment of compensation - PPL grids
Land may be owned or occupied within three systems in PNG i.e. (i) customary rights, (ii) state owned or (iii) privately owned.36 Any land that is to be acquired for any of these systems will be determined according to the WB OP 4.12 – Involuntary Resettlement, which
35 NEROP is a project which will consist of numerous smaller sub-projects which will consist of the various generation, transmission and distribution components that are particular to any sub-project. The definition of impacts is made at sub-project level where the impacts from the various components will be discrete and identifiable. It is not rationale environmental practice to discuss the impacts at a project level. Where system is used this connotes any or all of the components of the entire sub-project. 36 It needs to be noted that the state only has eminent domain over 3 per cent of land in PNG and land groups in PNG can be seen as follows: (i) total clan land is the entire land holdings held by a land group over which it has absolute control without reference to any other group; (ii) traditional clan commons are the bush, graun, tais, ruran wara, mountain, etc. that is accessible to all and any member of the land group for hunting of wild animals, collection of non-timber forest products and firewood; (iii) a garden is land that has been taken out of the commons and used by individuals or families. This land is returned after use to the commons to lie fallow until it recovers it fertility. It is reallocated according to local conditions and customs and not necessarily to the same individuals or families; (iv) individual clan land is that has been taken out of the clan commons more or less permanently for the cultivation of coffee, cocoa, coconuts, betel nuts, sago and increasingly rice but only the land use is individual not the land itself; and, (v) private land in some areas such as in the Highlands that for centuries has been permanently removed from the traditional clan commons but it is still handed down and governed by a social contract guided by local custom.
Preparation of National Electrification Rollout Plan and Financing Prospectus
Environmental and social considerations
129
outlines land acquisition and compensation procedures for acquiring land (including customary land) and private property. Payments for plant and tree crops that need to be removed are made according to the latest Compensation Schedule for Trees and Plants issued by the Valuer-General of PNG.
Land take for distribution lines will be minimal and would ideally suit itself to voluntary land donation. This is only likely to be successful if the land owners who provide the land for the distribution lines to pass through and land for location of facilities are included in the connection.
Acquisition of land and payment of compensation - isolated grids
These systems are small and are unlikely to extend more than 1 km from the source. The systems may contain a combination of small-scale generation devices such as micro-hydro, solar PV, and diesel generators. These micro-grids can range from small shared systems designed for a few houses to larger ones for larger communities.
Power from these micro-grids is generally more expensive than from national grids and affordability is an issue. If poorer and more vulnerable households could not benefit but facilities impacted upon their individual garden plots (quite possible with pico-/micro-hydro systems) then some of the problems associated with on-grid systems (e.g. loss of garden land for reservoirs or associated facilities such as generation plants, transmission lines and sub-stations) might occur. If a provider of ODA such as the WB were to be financing this type of technology it would require a greater level of due diligence than for the first two electrification technologies.
Another option is the medium voltage/low voltage connection, which is generally regarded as being more robust and cost-effective without limitation to even cooking and heating appliance.
Acquisition of land and payment of compensation - solar home systems
There will be both individual solar home systems and village-based solar systems. These systems are able to use energy efficient light bulbs and have the charging capacity for electronic equipment, and will allow the use of a radio/small TV set.
For individual solar systems while there will be affordability issues surrounding this type of electrification there are no involuntary resettlement issues because this technology does not require a significant land-based footprint.
Where NEROP identifies, village based solar power system a larger footprint may be created because a photo-voltaic solar system for between 50 and 75 households (average size of many rural villages in PNG) would require approximately 2400 square meters of land (near size of an average rugby league field) that would have to be permanently acquired. If a series of villagers were to be connected via such a system, the footprint would also include distribution poles. A plot of this size is unlikely to require resettlement, however in the rare case that it does, safeguard issues associated with involuntary resettlement as well as Indigenous Peoples will have to be considered. Thus, a PV solar system and more so a village based PV system may, in rare cases, present greater challenges for NEROP.
Preparation of National Electrification Rollout Plan and Financing Prospectus
Environmental and social considerations
130
Siting of NEROP systems in conservation areas
The siting of any NEROP system within nature conservation areas or forested areas will cause loss of forests and habitats.
Should any NEROP sub-project need to be sited within any nature conservation area this will trigger WB OP 4.04 Natural Habitats and/or OP 4.36 Forests while under the PNG Environment Act of 2000 this will be a possible Level 3 Prescribed Activity requiring an EIS. Consequently, it will be best to ensure that no NEROP sub-projects or any of their components are sited within conservation areas that could trigger these safeguards.
Indigenous peoples
The siting of any NEROP sub-project which will affect indigenous people as defined by the WB under OP 4.10 Indigenous Peoples but a standalone IPP is not required. This safeguard will be incorporated into the sub-project design document and will be based on evidence of FPIC and details of whether the access to customary land is agreed upon by all affected households.
Identification of physical cultural resources
Should any physical cultural resources be identified in any NEROP sub-project the design should wherever possible avoid the system impacting on the site. If it is not able to avoid the site and it will be disturbed WB OP 4.11 Physical Cultural Resources will be triggered and the impact mitigated by following the procedures in the OP.
Surface water use (isolated grids)
Where surface water is diverted from water courses for micro-hydro systems the amount of water diverted should be determined and the possible impact determined on any downstream users. This will apply to any dewatered downstream section where all of the stream flow is diverted to the penstock. Should all of the water in a watercourse be diverted away from the water course then the impact of zero or reduced flows on downstream users will be critical. This will need to be determined on a sub-project by sub-project basis since every project will divert differing amounts of runoff and have differing impacts on the hydrology.
Safe transport of diesel fuel on project choice (isolated grids)
As many of these sub-projects will be in seriously remote areas the obvious selection choice will be stand alone PV systems, however should any diesel or supplementary diesel generation be considered the risks and consequences of transporting diesel to site must be considered. In many situations roads may be inadequate and the consequences of diesel spills contaminating water and soil resources from transport accidents will need to be considered. This is especially so should any fuel be required to be transported via a designated conservation area.
Preparation of National Electrification Rollout Plan and Financing Prospectus
Environmental and social considerations
131
7.3.2 Construction Impacts
Normal construction impacts will occur at all sites but as the size of the facilities are small the site disturbance will be small and consequently the expected impacts will also be small. The following more significant impacts may occur during construction for the NEROP projects. Providing the contractor is following a well prepared ESMP that outlines the mitigation procedures to be followed this will minimise construction site impacts.
Clearing of vegetation
Opening of easements and access tracks for transmission and distribution lines may require areas of vegetation to be cleared. Should any of these areas be located within nature reserves or may clear primary forested areas both WB OP 4.04 and OP 4.36 may be triggered and require assessment under OP4.01, while under PNG legislation this may require a Level 3 assessment should any vegetation within nature conservation areas be cleared.
Site stabilisation
Access tracks to transmission and distribution towers will require stabilisation to avoid soil erosion occurring. Mitigation measures that the contractor will be required to address to control soil erosion will need to be stipulated in the EMP.
7.3.3 Operation Impacts
Due to their small size the operation impacts will be fairly minor provided the EMP operation mitigation procedures are followed. The main impacts will arise from fuel storage and disposal of batteries.
Disposal of waste
Waste that is generated during operation may include any of the following; from PV systems this may include used batteries and broken or defective solar panels while for micro hydro and standalone generation systems lubricants may include lubricants, lubricant and diesel drums and maintenance wastes.
Disposal of waste is only a concern for hybrid and PV systems, in particular the disposal of used batteries. Early installations are expected to use lead acid batteries while later installations may use more efficient and environmentally safer NiCd and Lithium ion batteries. All of these batteries will need to be collected and disposed of safely, preferably for recycling. There does not appear to be a suitable battery collection and recycling system in place in PNG and such a system will need to be provided to support NEROP installations. CEPA could provide a lead in directing how a system to recycle used batteries could be developed. This will not only directly assist the disposal of PV system batteries but will also assist in cleaning up village areas where torch batteries and other debris are injudiciously discarded.
Collection, management and disposal of wastes will need to be rigorously addressed in every EMP that is developed for each sub-project.
Preparation of National Electrification Rollout Plan and Financing Prospectus
Environmental and social considerations
132
Handling of Fuel and Lubricants
Where diesel fuel is required for generation in isolated grid systems, fuel will need to be transported to the facility where it will need to be stored prior to use. Both a large 1000 litre overhead storage tank will need to be installed while a storage area for fuel drums may also be required. All fuel storage areas should have concrete floors and be bunded to control any leaks. All refuelling should be carried out so as to minimise spillage. All sites should be equipped with fuel spill clean up kits to prevent any spilt fuel leaving the site and polluting the surrounding ground or water resources.
Transport of fuel to the sites will need to be carefully evaluated. Especially where access roads or bridges may be in poor condition this may result in accidents causing spillage resulting in accidental water and soil pollution.
In the case of micro-hydro systems, some minor amounts of lubricants (oil and grease) will need to be stored at the turbine and generator installation for periodic lubrication. Similarly, care will need to be taken to ensure that these lubricants do not pollute the surrounding ground or water resources.
Disposal of fuel drums
Where fuel for isolated grids is brought in by drums, arrangements need to be made to collect and return the drums to the supplier. Any uncollected drums should not be used for household water storage.
Maintenance of access tracks
Where access tracks have been formed to service transmission towers, regular inspection of the tracks to isolate and repair track instability from excessive soil erosion will be required. This also equally applies to tracks that have been formed to provide access to micro-hydro facilities.
7.4 Legal and regulatory context
The following section details the legal and regulatory environmental and social safeguard instruments that will apply to implementing NEROP sub-projects.
7.4.1 Development partner requirements
Depending on the source of funds investors will be required to meet the requirements outlined in this section.
The GoPNG will be required to meet the requirements of multi-lateral lenders (WB and ADB), aid organisations and also national safeguard regulations (CEPA).
Private investors will need to meet their lenders safeguard policies which may typically be defined by the IFC or the Equator principles.
Preparation of National Electrification Rollout Plan and Financing Prospectus
Environmental and social considerations
133
CEPA national safeguard requirements will apply to all projects irrespective of the source of funding.
Not all multi-lateral and national safeguards are equivalent and where the national safeguards are not equivalent to the international safeguards the international safeguards will be the defining legislation. This will apply to all NEROP sub-projects.
The World Bank
As the World Bank (WB) has the lead role in NEROP funding the WB Operational Procedures (OP) are consequently discussed in detail. Safeguard procedures for other lending agencies are also discussed but as the other lenders have modelled their procedures on the WB procedures an understanding of the WB procedures these are similar to the WB OPs37.
The World Bank has a suite of eight Operational Policies relevant to environmental and social safeguards. Of these it is possible that four environmental and two social safeguard OPs may be triggered by NEROP. These include.
Operational Policy 4.01: Environmental Assessment. This will be triggered by all NEROP sub-projects. The majority of projects are expected to be of very small scale which would place them in the low environmental risk as Category C projects which would normally only require an EMP to be prepared.
Operational Policy 4.04: Natural Habitats. May be triggered should any NEROP projects be located within any natural habitats. If they are then OP 4.04 will need to be applied.
Operational Policy 4.11: Physical Cultural Resources. OP 4.11 applies to both above ground and below ground physical cultural resources (PCR). OP 4.11 “addresses physical cultural resources,1 which are defined as movable or immovable objects, sites, structures, groups of structures, and natural features and landscapes that have archaeological, paleontological, historical, architectural, religious, aesthetic, or other cultural significance.”
Since this also covers places such as churches, graveyards, burial sites, and other ritual or religious sites, sub-project construction may encounter locations within or adjacent to settlements that could trigger the policy. t is unlikely that any above ground physical resources will be encountered. Should any PCR be encountered consideration should first be given to relocating the component to avoid any conflict with the PCR.
Operational Policy 4.36: Forests. This may be triggered by transmission lines that may be required to traverse forest areas that will (i) affect the health and quality of forests; (ii) create effects on the rights and welfare of people who have established a dependence on the forest resources; and (iii) actions that may bring about changes in the management, protection or utilization of natural forests or plantations.
37 The WB OPs have also established the standard followed by many of the aid agencies.

Preparation of National Electrification Rollout Plan and Financing Prospectus
Environmental and social considerations
134
Operational Policy 4.10: Indigenous Peoples. Since NEROP will cover an extensive area with a diverse range of cultures and ethnicities OP 4.10 will be triggered. Indigenous people are identified should they meet any of the following definitions.
Self-identification as members of a distinct indigenous cultural group that is recognised by other members of the community.
Collective attachment to geographically distinct habitats or ancestral territories or have access to specific natural resources in these habitats or territories.
Customary cultural, economic, social, or political institutions that are separate and distinctly different from the dominant surrounding community.
An indigenous language that is different to the official language of the region.
Importantly where a group has lost collective attachment to geographically distinct habitats or ancestral territories due to conflict, government resettlement programs, dispossession from the lands, natural calamities, or incorporation into an urban area (typically defined as being legally designated as such, high population density and high proportion of non-agricultural activities relative to agricultural activities) they remain eligible for coverage under OP4.10. Where this has occurred in PNG, such as in the Autonomous Region of Bougainville this will need to be an important issue to be understood and thoroughly documented.
Operation Policy 4.12: Involuntary Resettlement. The issue triggering OP4.12 is not whether involuntary resettlement will be required but whether the involuntary acquisition of land (which may or may not entail involuntary resettlement) is required. Thus, rather than simply focussing on land acquisition NEROP needs to understand the issue of access to land, which can and should) involve other approaches rather than the involuntary acquisition of land.
In PNG access to customary land can take place through three arrangements as follows:
Option 1: The Minister of Lands on behalf of the GoPNG (i) purchases such land from the customary landowners for a public purpose (which includes power generation and transmission) through a “compulsory acquisition” and (ii) leases such land to the project implementing NEROP;
Option 2: The Minister of Lands on behalf of the GoPNG negotiates and enters into “lease-lease back” arrangements with the customary land owners under the Land Act of 1996, which results in the State leasing land from the customary landowners and on leasing that land to the project under a “State Lease”; and
Option 3: (i) The customary landowners establish a legal entity known as the “Incorporated Land Group” (ILG) under the Incrporated Land Group Act of 1974, (ii) the ILG applies to the Lands Department of registration of, and obtains, title in its name over the portion of the land included in the Project site, and (iii) the ILG leases land directly or indirectly to the project.
Preparation of National Electrification Rollout Plan and Financing Prospectus
Environmental and social considerations
135
Options 2 and 3 are preferred because the purchase of Customary Land through compulsory acquisition can take several years or even longer if there are competing claims to this Customary land.
Another option that NEROP should consider is to pursue in the context of small-scale sub-projects the voluntary provision of access to land by the community for such purposes. However, this needs to be undertaken through a socially inclusive consultation process that is required by OP4.12 where individual affected households (and that includes women not just men) do in fact agree to such an arrangement. OP4.12 requires full documentation of the agreement has been reached.
Where it is necessary to pay compensation and other allowances (such as transitional allowances to PAP severely affected by the loss of income due to more than 10 percent of land acquired) usually a Land Acquisition and Resettlement Framework (LARF) is prepared. This is similar to the WB’s RPF described above. The main objective of the LARF is similar to that of the RPF and inter alia it is designed to ensure PAP regardless of tenure status will be assisted, where appropriate to improve or at least restore their living conditions, incomes, earnings and production capacity to pre-project levels, or, where appropriate, to provide for the payment of fair compensation that recognizes the loss of social capital of the landowning group and its participant clans, sub-clans, households and individuals.38
However, the WB also requires the investor to undertake a detailed census of people residing in a project-impacted area and an inventory of loss (IOL) based on a detailed measurement survey (DMS) – which may or may not be undertaken during initial project design but is required before the WB will approve any sub-project involving involuntary resettlement - detailing all involuntary physical and economic resettlement impacts and then a cut-off date is established and after this date people who were not included in the census (this does not mean that absentee clan members are not to be included) cannot be considered PAPs eligible for compensation. When the project reaches, detailed design stage the WB requires that a DMS based on the IOL is either undertaken or updated and that replacement costs for assets acquired reflect updated market prices.
Issues that cause the most concern are related to what constitutes fair compensation and replacement cost. Generally in PNG - and the WB is in agreement - that fair compensation means that where land and the use of land and the use of plants and trees and other vegetation growing on the land or other features of the habitat that are part of the rights and entitlements of the customary owner or owners is removed from their use or possession the compensation paid will be assessed as fair according to the customs, norms and standards of the customary owners: hence the need for transparently facilitated consultations. Replacement cost means the value determined to be fair compensation for the replacement cost of the houses and structures (current fair market price for building materials and labor without depreciation or deductions for salvaged building material) and the value of crops,
38 Experience in PNG and elsewhere has demonstrated that denial of project benefits to communities where specific projects are located is a recipe for exacerbating existing social and political tensions. Better practice increasingly recognizes that all communities located in the footprint of a public infrastructure project, especially related to energy, water and transport, need to benefit. If they cannot directly benefit for whatever reason it is prudent to develop some form of benefit sharing mechanism. For NEROP projects the best solution would be to ensure that all communities benefit via household electricity connections.
Preparation of National Electrification Rollout Plan and Financing Prospectus
Environmental and social considerations
136
trees and other commodities according to the Valuer-General’s Compensation Schedule for Trees and Plants, All Regions.
A resettlement plan that meets the requirements of the WB (there is an established format that must be followed) is required for all operations that entail involuntary resettlement unless otherwise specified such as where they are minor (if affected people are not physically displaced and less than 10 percent of their productive assets are lost) or fewer than 200 people are displaced.
A resettlement policy framework (RPF) is required for operations associated with sector investments, financial intermediary operations, and WB assisted projects with multiple subprojects. Such operations also require a satisfactory resettlement plan that is consistent with the policy framework that must be submitted to the WB for its approval prior to financing. The WB may agree in writing that subproject resettlement plans may be approved by the project implementing agency or a responsible government agency or financial intermediary if such an agency can demonstrate to the WB is possesses the demonstrated institutional capacity to review resettlement plans and ensure their consistency with this policy39.
For projects requiring restriction of access to legally designated parks and protected areas resulting in adverse impacts on the livelihoods of DPs the borrower is required to provide the WB with a draft process framework that conforms to the relevant provisions of OP4.12. During implementation, the borrower is required to prepare a plan of action that is acceptable to the WB describing the specific measures to be undertaken to assist DPs and arrangements for implementation. This plan of action could take the form of a natural resources management plan prepared for the project. However, it is strongly advised that NEROP avoid such projects unless it can be demonstrated that the environmental impacts are limited because a full EIA would be necessary.
NEROP should be aiming to support projects that can be approved by a competent authority or authorities within PNG that is/are acceptable to the WB rather than having to submit RPs to the WB each time approval is sought. For most off-grid solutions that require little or no land acquisition or other loss of income and physical displacement this is likely to be a low cost feasible solution to involuntary resettlement impacts that are for the most part quite minor in nature. Of course, if off-grid solutions were to result in significant impacts they should be rejected.
Asian Development Bank40
The ADB requirements are established within the overall Safeguards Policy Statement of 2009. This encompasses three safeguard policy areas;
39 This is contingent on (a) adequate staffing anf capacity building within the implementing PNG authority and (b) initial sub-project plans being submitted to WB until the WB is confident that the implementing PNG authority has the capacity to develop adequate plans. Subsequent WB supervision missions would then verify that the capacity continues and sub-prject plans are in compliance with WB requirements. 40 The requirements of the newly established Asian Infrastructure Investment Bank (AIIB) – which has entered into an energy financing agreement with the WB - have not been included in this review
Preparation of National Electrification Rollout Plan and Financing Prospectus
Environmental and social considerations
137
Environmental safeguards
Involuntary resettlement safeguards
Indigenous Peoples safeguards
The ADB and WB policies and requirements are quite similar and many of the ADB policies follow the release of an earlier WB policy.41
Assessments either as EIAs or as IEEs all require; assessment of environmental and social impacts, determination of impacts and mitigation measures; public consultation and disclosure, provision of a grievance redress mechanism and an EMP with a monitoring program. Assessment of the implementing agencies capacity is also required.
Similarly, the social safeguards (Involuntary resettlement and Indigenous Peoples) require public consultation and information disclosure, development of grievance redress mechanisms and monitoring programs. The capacity of the implementing agency is also assessed.
Formats for preparing the various ADB safeguard reports are provided in the annexes attached to the Safeguards Policy Statement, 2009.
Environmental safeguards
Environmental Categorisation - Screening of projects: ADB requires the initial screening of projects and allocates them to three categories; A, B, and C depending on the level of assessed environmental risk associated with the project. Thus projects classified as Cat A requires an EIA, Cat B requires an Initial Environmental Examination (IEE), while Cat C does not require any environmental assessment.
NEROP sub-projects will generally be expected to create low environmental impact classified as Cat B projects requiring an IEE.
EMPs are required for all Cat A and Cat B projects.
Involuntary resettlement
ADB requires that all projects be screened for involuntary resettlement requirements. For a project requiring involuntary resettlement a resettlement plan will be prepared that is commensurate with the extent and degree of resettlement required. This is determined by (i) the scope of physical and economic displacement and (ii) the vulnerability of the affected persons.
although recently it prepared its first Environmental and Social Management Framework (ESMF) which has partly been prepared based on the experience of the WB. 41 It should be noted that the WB is in the process of reviewing and updating its environmental and social safeguards and the latest outcomes were published in the middle of March this year. Generally speaking, there do not appear to be very significant changes although borrowers will be expected to assume more responsibility for managing safeguards and will also be expected to conduct more socially inclusive and extensive consultations than are required at present.

Preparation of National Electrification Rollout Plan and Financing Prospectus
Environmental and social considerations
138
Indigenous peoples
ADB requires that all projects be screened to determine whether or not they have any impacts on Indigenous Peoples (IP). Where IPs will be affected an Indigenous Peoples Plan (IPP) will be prepared. The need for an IPP is determined by evaluating (i) the magnitude of the impact on IPs customary rights of use and access to land and natural resources; socio-economic status; cultural and community integrity; health, education, livelihood systems, and social status; or indigenous knowledge; and (ii) the vulnerability of the affected IP to any of these impacts.
Equator principles
Equator Principles Financial Institutions (EPFIs) have adopted the Equator Principles as a financial industry benchmark for determining, assessing and managing environmental and social risk in projects that they finance. The Equator Principles applies to a range of financial projects including project finance with total project capital costs in excess of US$10 million or more. The EFPI will only provide such finance that meets the following principles:
Equator Principle 1: Review and categorization using the same categories (A: potential significant environmental and social risks; B: limited adverse environmental and social risks and/or impacts; C: minimal or no adverse environmental and social risks and/or impacts) as both the WB and ADB
Equator Principle 2: For Category A and B projects an Environmental and Social Assessment is required and for Category C projects (more typical of NEROP Projects) a limited or focused environmental or social assessment is necessary
Equator Principle 3: Necessary to address applicable environmental and social standards that differentiate between projects located in non-designated countries the evaluates compliance with applicable IFC Performance Standards on Environmental and Social Sustainability and the WB Group Environmental, Health and Safety Guidelines OR in designated countries, of which PNG is one, the assessment process evaluated compliance with relevant host country laws, regulations and permits that pertain to environmental and social issues. These host countries must meet the requirements of environmental and/or social assessments, stakeholder engagement and grievance mechanisms
Equator Principle 4: For all Category A and B projects the EFPI requires the client to develop or maintain an Environmental and Social Management System (ESMS) and this generally requires the client to prepare an Environmental and Social Management Plan (ESMP)
Equator Principle 5: Stakeholder Engagement is necessary and must be fully documented including in the local language and in a culturally appropriate manner. Where Indigenous Peoples are adversely impacted it is necessary to secure their Free, Prior and Informed Consent
Equator Principle 6: For all Category A and, as appropriate Category B projects, the EFPI requires the clients, as part of the ESMS, to establish a grievance

Preparation of National Electrification Rollout Plan and Financing Prospectus
Environmental and social considerations
139
mechanism designed to receive and facilitate resolution of concerns and grievances about the project’s environmental and social performance
Equator Principle 7: For all Category A and, as appropriate Category projects, an Independent Environmental and Social Consultant, not directly associated with the client, will carry out an independent review of assessment documentation including the ESMPs, ESMS and Stakeholder Engagement process documentation
Equator Principle 8: Covenants linked to compliance with all host country environmental and social laws, regulations and permits in all material respects will form part of the financing documentation
Equator Principle 9: Independent monitoring and reporting via an Independent Environmental and Social Consultant must be appointed or the client will be required to retain qualified and experienced external experts to verify its monitoring information which would be shared with the EFPI
Equator Principle 10: For all Category A and, as appropriate Category B projects, the client will ensure that, at a minimum, a summary of the ESIA is accessible and available online except where the client does not have internet access. The EFPI will report publicly, at least annually, on Equator Principles implementation processes and experiences taking into account confidentiality considerations.
It can be noted here that for NEROP there should be no Category A projects and it is unlikely there will be any Category B projects: most of them being Category C projects. However, the above principles have been incorporated into this document to enable NEROP stakeholders to understand what would be the safeguard requirements of EFPIs.
IFC principles
The International Finance Corporation (IFC) has developed eight performance standards that it directs towards its clients, providing guidance on how to identify risks and impacts, and are designed to help avoid, mitigate, and manage risks and impacts as a way of doing business in a sustainable way, including stakeholder engagement and disclosure obligations of the client in relation to project-level activities. They are as follows:
Performance Standard 1: Assessment and Management of Environmental and Social Risks and Impacts. This PS defines the scope, requirement to identify risks and impacts, management program, organizational capacity and competency, monitoring and review, stakeholder engagement, information disclosure, informed consultation and participation, Indigenous Peoples, private sector responsibilities, external communications and grievance mechanisms
Performance Standard 2: Labor and Working Conditions. This PS defines the scope of application (direct, contracted and supply chain workers) and working conditions and management of worker relationships (human resources and policies, working conditions and terms of employment, workers’ organization, non-discrimination and equal opportunity, retrenchment, grievance mechanism and social protection)

Preparation of National Electrification Rollout Plan and Financing Prospectus
Environmental and social considerations
140
Performance Standard 3: Resource Efficiency and Pollution Prevention. This PS defines the scope of application (identified as a result of the environmental and social risk assessment), resource efficiency (greenhouse gasses and water consumption, and pollution prevention (wastes, hazardous materials management, pesticide use and management)
Performance Standard 4: Community Health, Safety, and Security. As with PS3 it defines the scope of the application and requirements (community health and safety, infrastructure and equipment design and safety, hazardous materials management and safety, ecosystem services, community response to disease and emergency preparedness and response
Performance Standard 5: Land Acquisition and Involuntary Resettlement. This PS defines the scope of the application similarly to the WB and makes it explicit that it also applies to PAPs with customary or traditional land tenure. There are a number of requirements but general requirements are to ensure project design ensures that land to be acquired or people displaced is minimized, that compensation and benefits for displaced people reflect full replacement cost and that assistance be provided to help these DPs improve or at least restore their living standards, community engagement ensures socially inclusive participation, a grievance mechanism is established and resettlement and livelihood restoration planning and implementation is undertaken (only considered complete when adverse impacts have been addressed). In relation to displacement it defines who the PS applies to (including DPs without recognizable legal right or claim to the land or assets they occupy or use) and differentiates between physical and economic displacement. It also identifies private sector responsibilities under government managed resettlement.
Performance Standard 6: Biodiversity Conservation and Sustainable Management of Living Natural Resources. This PS defines the scope that would apply to projects that are (i) located in modified, natural and critical habitats; (ii) potentially impact on or are dependent on ecosystem services over which the client has direct management control or significant influence; or (iii) include the production of living natural resources (e.g. agriculture, animal husbandry, fisheries and forestry). In relation to the protection and conservation of biodiversity this PS addresses modified habitats, natural habitats, critical habitats, legally protected and internationally recognized areas, and invasive alien species. The PS also addresses the actual management of ecosystem services, sustainable management of living natural resources and the supply chain.
Performance Standard 7: Indigenous Peoples. This PS is identical to OP4.10 and requires the avoidance of adverse impacts, participation and consent of IPs and the circumstances requiring free, prior and informed consent including impacts on lands and natural resources subject to traditional ownership or under customary use, relocation of IPs from these lands and natural resources, critical cultural heritage, mitigation and development benefits and private sector responsibilities where government is responsible for managing IPs issues.
Performance Standard 8: Cultural Heritage. This PS refers to cultural heritage as (i) tangible forms of cultural heritage, such as tangible moveable or immovable

Preparation of National Electrification Rollout Plan and Financing Prospectus
Environmental and social considerations
141
objects, property, sites, structures, or groups of structures, having archaeological (prehistoric), paleontological, historical, cultural, artistic, and religious values; (ii) unique natural features or tangible objects that embody cultural values, such as sacred groves, rocks, lakes, and waterfalls, and (iii) certain instances of intangible forms of culture that are proposed to be used for commercial purposes, such as cultural knowledge, innovations, and practices of communities embodying traditional lifestyles. Requirements cover chance find procedures, consultation, community access, removal of replicable and non-replicable cultural heritage, critical cultural heritage and the project’s use of cultural heritage.
How these IFC Performance Standards would apply to NEROP would be dependent primarily on Performance Standard 1 but it is most unlikely as with the other environmental and social safeguards that either a Category A or B would typify the projects to be considered.
7.4.2 Key legislation and regulations in PNG
This section establishes the applicable PNG legislation and regulations that will apply to NEROP sub-projects. While the national environmental legislation is closely equivalent to the WB and ADB procedures, the existing social safeguard legislation concerning land and asset compensation is poorly aligned with international safeguard procedures.
Especially relevant is the lack of requirement that payments for compensation and other allowances to affected people (any juridical person whether an individual, household, a private form, a landowning group, or a part of such a landowning group that (i) have the right, title or interest in any house (including residential, garden, agricultural, forestry, grazing land and land owned in common by a customary landowning group) or any other fixed or movable asset acquired or possessed, in full or in part, permanently or temporarily or (II) business, occupation, work, place of residence or habitat adversely affected or (iii) standard of living adversely affected be paid in full prior to the commencement of civil works.
There is no national legislation that specifically recognises how indigenous peoples’ concerns should be addressed during project design. While the 1975 Constitution recognizes ethnic diversity it does not recognize IPs in the same way that they are defined in the WB OPs, specifically their collective attachment to geographically distinct habitats or ancestral territories in the project area and to the natural resources in these habitats and territories. Nor is there any provision to identify and involve vulnerable persons defined by both the WB and ADB but also other providers of ODA42 to include people living in poverty, women (especially female-headed households), the elderly, youth, displaced persons, and physically and intellectually (otherwise able) impaired persons.43
42 Typically, other providers of ODA such as JICA, AusAID (now subsumed by DFAT), NZAID (MFAT), ADF, KfW and KOICA (although not USAID at present because it relies on the Millennium Challenge Corporation as its project investment vehicle) channel their assistance through either the WB or ADB: the latter more so in the Asia-Pacific region. 43 The WB’s OP 4.20 Gender and Development must not be overlooked because the WB and indeed other providers of ODA generally are seeking to assist recipients of ODA to reduce poverty and enhance economic growth, human well-being, and development effectiveness by addressing the
Preparation of National Electrification Rollout Plan and Financing Prospectus
Environmental and social considerations
142
Environmental Legislation
Environmental safeguards in PNG are administered under the Environment Act, 2000 (the Act), the Environment (Prescribed Activities) Regulation, 2002 and various Information Bulletins and Guidelines to assist in implementing the Act and Regulation.
The Act and its attendant instruments is administered by the Conservation and Environment Protection Authority (CEPA) which was created in 2015 from and supersedes the Department of Environment and Conservation (DEC). Unlike DEC, CEPA has been established as a self-funding authority and now recovers fees from charging for its services. The enabling legislation for establishing CEPA’s fee rates is the Conservation and Environment Protection Authority (Environment Management Fee) Regulation 2015.
The Environment Act, 2000 is the defining legislation and contains significant detail of the process to be followed in environmental assessment.44
The Regulation establishes the type of environmental assessment based on the assessment of the proposed activities environmental risk where it is listed as a “prescribed activity”.
The Environment (Prescribed Activities) Regulation 200245
Prescribed activities are activities that have been identified as having various levels of environmental risk associated with their operation. Based on the level of environmental risk the Regulation defines three levels of environmental assessment with risk rising from Level 1 to Level 3 activities. Only Level 2 and 3 activities are identified as being prescribed activities which are listed as a series of activities within Schedules 1 and 2 of the Regulation. CEPA defines its fees based on the categorization of Levels 2 and 3 into sub-levels. Thus Level 2 prescribed activities incorporate categories 2.1 – 2.4 while Level 3 prescribed activities are similarly ranked from 3.1 – 3.4. The higher the sub-level, the higher the perceived environmental risk, and the higher the fee project investors would be required to pay.
Level 2 and 3 prescribed activities require an Environmental Permit (EP) to be issued by CEPA before the development can commence.
Non-prescribed (Level 1) activities do not require an EP to operate but are still required to be notified to CEPA for validation as a Level 1 activity.
gender disparities and inequalities that are barriers to development, and by assisting member countries in formulating their gender and development goals. The ADB has a specific Gender Checklist that applies to Energy Projects as does an ODA provider such as USAID. It can also be noted here that good practice on a contemporary basis also means being aware of inter-generational issues. 44 It also some significant implications for land acquisition issues because in the national interest this Act can be used to acquire land independent of the actual Land Act or other GoPNG policies. 45 This section is presented in detail as overall there is a poor appreciation of environmental safeguards and compliance requirements throughout the PNG public and private sectors. CEPA has been recently formed and has introduced charges to recover the application costs which is of concern to DPE and developers. This section was built up with extensive consultation with CEPA who also wished to see this presented as a serious section to ensure that all the NEROP actors comply with the Environmental Act requirements. This section will clarify the requirements for investors, operators and contractors alike.
Preparation of National Electrification Rollout Plan and Financing Prospectus
Environmental and social considerations
143
Prescribed Activities applicable to NEROP
Depending on the type of energy system adopted the following activities are notified as Prescribed Activities within Schedules 1and 2 of the Regulation and may apply to NEROP.
Below is a list of prescribed activities extracted from Schedules 1 and 2.
Level 1 Activities
Should a project not be identified in Schedules 1 and/or 2 of the Prescribed Activities the activity is classified as a Level 1 Activity.
As NEROP will focus on small energy projects it is expected that all or the majority of the projects could be classified as Level 1 activities which will not require an Environmental Permit to be issued by CEPA. However, CEPA will still need to be notified of the project to confirm that the project is in fact a Level 1 activity.
Level 2 Activities
Level 2 prescribed activities are identified within Schedules 1 and 2. Level 2 activities require a less rigorous environmental assessment for an Environmental Permit than Level 3 activities.
The prescribed activities are identified according to the Level, the Type of Activity e.g. 10.1, and the fee category e.g. (2.3).
Level 2: Category 10: Energy Production
10.1 (2.3) Operation of hydroelectric plants with a capacity of more than 2 MW.
10.2 (2.2) Operation of fuel burning power stations with a capacity of more than 5MW, but not including emergency generators.
Category 12: Infrastructure
12.6 (2.3) Construction of electricity transmission lines or pipelines greater than 10km in length.
Category 13: Other Activities
13.1 (2.1) Damming or diversion of rivers and streams.
Level 3 Activities
As NEROP will not invest in major infrastructure it is unlikely that any sub-projects will be constructed that may be classified as a Level 3 prescribed activity. However, NEROP needs to be cognisant of the other prescribed activities such as transmission lines being routed through nature conservation areas which will become a prescribed activity. Level 3 prescribed activities have high degrees of environmental risk associated with them and require a detailed EIS.
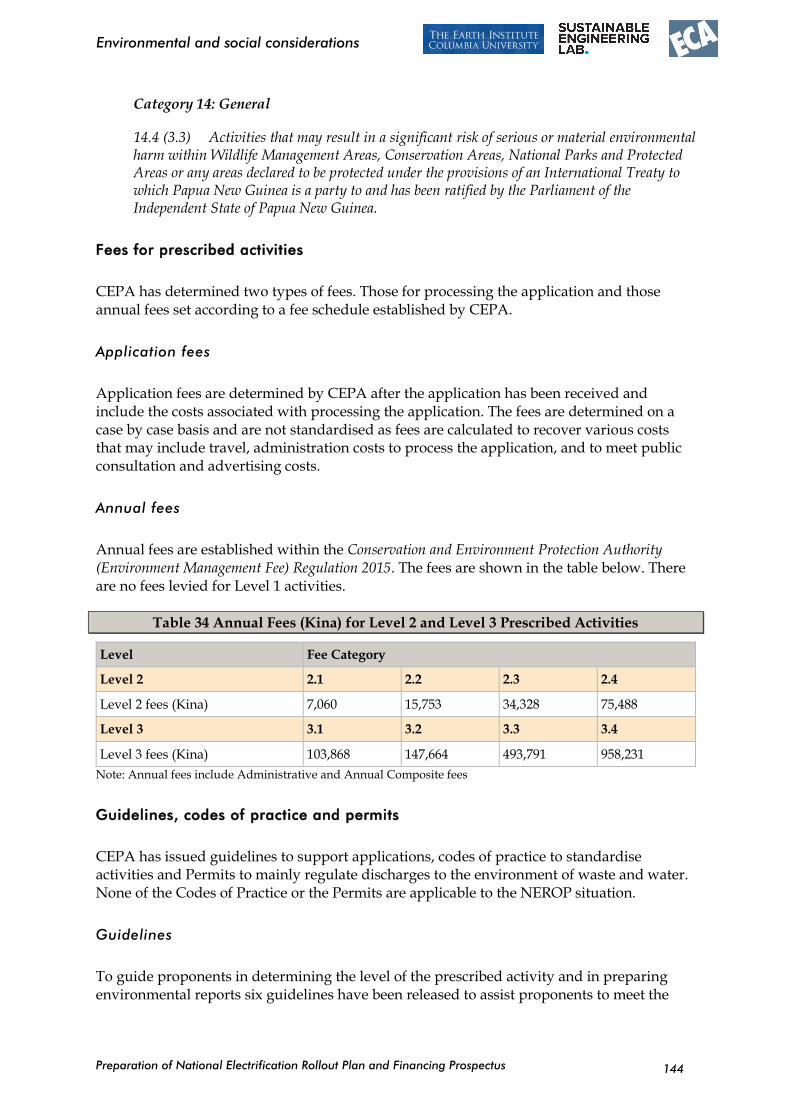
Preparation of National Electrification Rollout Plan and Financing Prospectus
Environmental and social considerations
144
Category 14: General
14.4 (3.3) Activities that may result in a significant risk of serious or material environmental harm within Wildlife Management Areas, Conservation Areas, National Parks and Protected Areas or any areas declared to be protected under the provisions of an International Treaty to which Papua New Guinea is a party to and has been ratified by the Parliament of the Independent State of Papua New Guinea.
Fees for prescribed activities
CEPA has determined two types of fees. Those for processing the application and those annual fees set according to a fee schedule established by CEPA.
Application fees
Application fees are determined by CEPA after the application has been received and include the costs associated with processing the application. The fees are determined on a case by case basis and are not standardised as fees are calculated to recover various costs that may include travel, administration costs to process the application, and to meet public consultation and advertising costs.
Annual fees
Annual fees are established within the Conservation and Environment Protection Authority (Environment Management Fee) Regulation 2015. The fees are shown in the table below. There are no fees levied for Level 1 activities.
Table 34 Annual Fees (Kina) for Level 2 and Level 3 Prescribed Activities
Level Fee Category
Level 2 2.1 2.2 2.3 2.4
Level 2 fees (Kina) 7,060 15,753 34,328 75,488
Level 3 3.1 3.2 3.3 3.4
Level 3 fees (Kina) 103,868 147,664 493,791 958,231
Note: Annual fees include Administrative and Annual Composite fees
Guidelines, codes of practice and permits
CEPA has issued guidelines to support applications, codes of practice to standardise activities and Permits to mainly regulate discharges to the environment of waste and water. None of the Codes of Practice or the Permits are applicable to the NEROP situation.
Guidelines
To guide proponents in determining the level of the prescribed activity and in preparing environmental reports six guidelines have been released to assist proponents to meet the
Preparation of National Electrification Rollout Plan and Financing Prospectus
Environmental and social considerations
145
requirements of the Environment Act 2000. The following two guidelines may apply to NEROP sub-projects:
Guideline for Notification of Preparatory Works on Level 2 and Level 3 Activities
Guideline for Preparation of an Environmental Management Plan.
The following three guidelines apply to Level 3 projects but are unlikely to be triggered by any NEROP sub-project:
Guideline for Preparation of Environmental Inception Report.
Guideline for Conduct of Environmental Impact Assessment and Preparation of Environmental Impact Statement.
Guideline for Preparation of an Environmental Impact Statement for Hydropower Development.
Copies of the Guidelines are available on request from CEPA.
Regulatory approval process
The regulatory framework CEPA uses initially screens projects into three levels that are based on the potential of the activity to cause environmental harm. Activities are classified as Level 1, 2 or 3, with environmental risk increasing from Level 1 to Level 3.
The regulatory process is shown as a flow chart in the figure overleaf.
Level 1 activities are exempted from an Environmental Permit (EP) but are subject to the appropriate Code of Practice and Regulations. Depending on the activity CEPA may request the proponent to provide an EMP. Level 1 approvals are required to be made within 30 days
Small NEROP sub-projects which do not reach the prescribed activity criteria of Category 10 Energy Projects will be Level 1 activities.
Level 2 activities consist of two approval streams; (i) Level 2.1 and (ii) Level 2.2, 2.2, 2.3 and 2.4 activities46. Following the lodgement of the Permit Application by the proponent CEPA confirms whether the activity will be either a 2.1 activity or in the next activity category 2.2 to 2.4. Level 2.1 approvals are to be made within 30 days while Level 2.2, 2.3 and 2.4 approvals are to be made within 90 days.
All NEROP sub-projects will be required to be assessed to establish whether any will fall into the 2.2 or 2.3 activity levels.
46The split is based on the fee structure that recognizes that Level 2.1 activities are a lower risk than Levels 2.2, 2.3 and 2.4 (2.4 being the highest level of environmental risk).
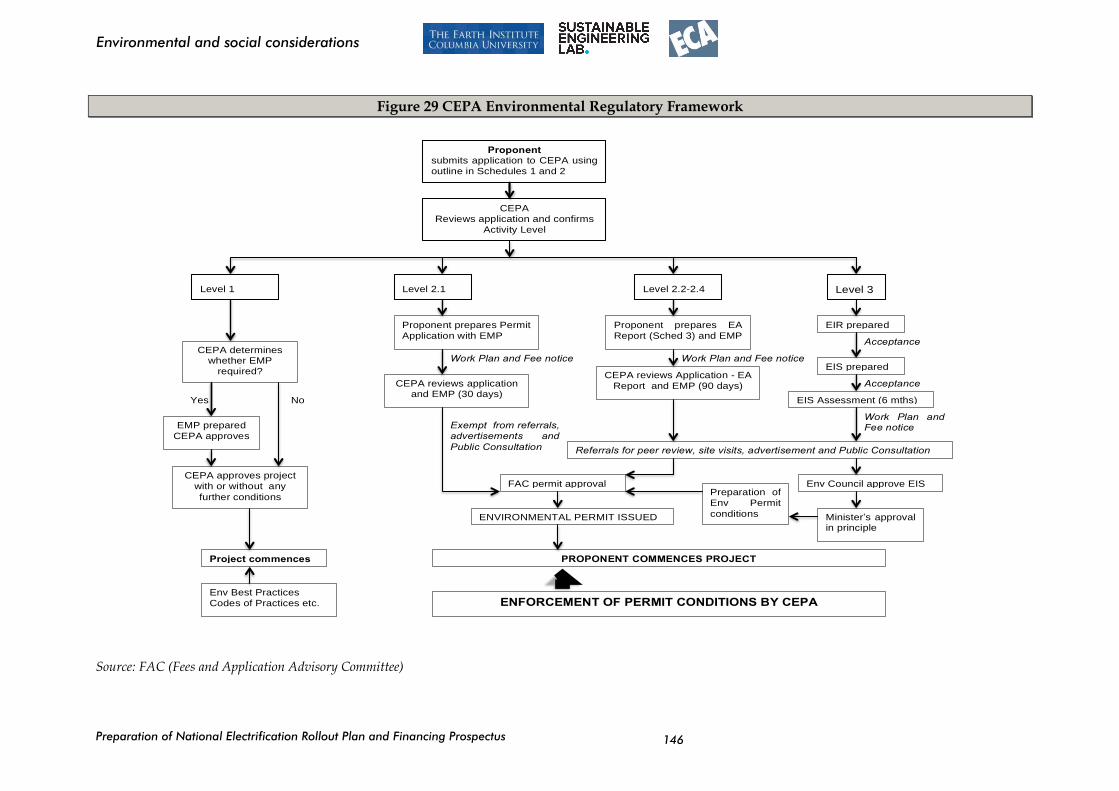
Preparation of National Electrification Rollout Plan and Financing Prospectus
Environmental and social considerations
146
Figure 29 CEPA Environmental Regulatory Framework
Source: FAC (Fees and Application Advisory Committee)
Proponent submits application to CEPA using
outline in Schedules 1 and 2
CEPA Reviews application and confirms
Activity Level
Level 1 Level 2.1 Level 2.2-2.4 Level 3
CEPA determines whether EMP
required?
EMP prepared
CEPA approves
No
CEPA approves project
with or without any
further conditions
Proponent prepares Permit
Application with EMP
CEPA reviews application and EMP (30 days)
ENFORCEMENT OF PERMIT CONDITIONS BY CEPA
FAC permit approval
ENVIRONMENTAL PERMIT ISSUED
Exempt from referrals,
advertisements and
Public Consultation
Proponent prepares EA
Report (Sched 3) and EMP
CEPA reviews Application - EA
Report and EMP (90 days)
Referrals for peer review, site visits, advertisement and Public Consultation
EIR prepared
Acceptance
EIS prepared
Acceptance
EIS Assessment (6 mths)
Env Council approve EIS
Minister’s approval in principle
Yes
PROPONENT COMMENCES PROJECT Project commences
Env Best Practices
Codes of Practices etc.
Work Plan and Fee notice Work Plan and Fee notice
Preparation of
Env Permit
conditions
Work Plan and Fee notice
Preparation of National Electrification Rollout Plan and Financing Prospectus
Environmental and social considerations
147
Level 1 approval process
The environmental regulatory approval process for Level 1 activities consists of the following.
Project screening
Proponent submits an Application to CEPA based on Application for an Environmental Permit Form obtained from CEPA.
The following documents are available from CEPA to assist the proponent in this initial step:
Information Requirements for Permit Applications and Registration of Intention to Carry out Preparatory Work - Operational Procedures Directive.
Application for an Environmental Permit - Schedule 1 with the list of Prescribed Activities.
Additional Information for Schedule 1 Environment Permit Application Form – Schedule 2.
The proponent prepares an application or otherwise known as registering of intent and submits the form to CEPA.
Approval
CEPA reviews the Application and if in agreement validates the activity as a Level 1 Activity. CEPA then notifies the Proponent whether an EMP is required for the Activity. If an EMP is required, the proponent submits the EMP for approval. If no EMP is required, the activity is approved by CEPA. If an EMP is required and following its approval by CEPA the activity is then approved.
The proponent is now able to commence the activity but is subject to environmental best practices and any Codes of Practices that CEPA advise the proponent to follow.
Level 1 activities may be elevated to Level 2 activities should CEPA consider that there are special reasons for moving the activity to a higher environmental risk level.
Level 2.1 and 2.2 – 2.4 approval process
The environmental regulatory process for applying for an Environment Permit for Level 2.1 and 2.2 – 2. 4 activities is shown in the figure above. The permit application is normally a two-step process and commences with project screening The second step is assessment of the application which results in the issuing of an Environmental Permit.
Preparation of National Electrification Rollout Plan and Financing Prospectus
Environmental and social considerations
148
Project screening
Proponent submits Application – Registration of Intent (applies to both 2.1 and 2.2-2.4 activities).
The following documents are available from CEPA to assist the proponent in this initial step:
Information Requirements for Permit Applications and Registration of Intention to Carry out Preparatory Work- Operational Procedures Directive.
Application for an Environmental Permit - Schedule 1 with the list of Prescribed Activities.
Additional Information for Schedule 1 Environment Permit Application Form – Schedule 2.
The proponent prepares an application or otherwise known as registering of intent and submits the forms to CEPA. Schedule 1 also contains the list of Prescribed Activities and the proponent choses the appropriate Activity Level from the list which is entered in the Application Form. (Schedule 1).
CEPA reviews the Application and validates the Activity Level.
CEPA notifies the Proponent of the Activity Level. The proponent then follows the steps to complete the assessment according to the Activity Level.
This completes the screening of the project.
Environment permit application
This commences the project’s environmental assessment and the extent of the requirements depends on the Activity Level that has been confirmed by CEPA. The proponent then prepares supporting documents including the EMP that will allow CEPA to assess the environmental risk of the project and determine the conditions for issuing the Environmental Permit.
For Level 2.1 activities the Proponent’s Permit Application which was prepared during screening is used as the basic document to assess the approval for an Environmental Permit. Additionally, the proponent prepares an EMP according to the EMP Guideline which is submitted to CEPA for appraisal together with the original Application.
The following documents guide both Level 2.1 and Level 2.2 - 2.4 activities:
Guideline for the Preparation of an Environmental Management Plan 0?/2013.
The following document guides Level 2.2 - 2.4 activities:
General Guidelines on the Additional Information Required to Support a Permit Application for Level 2.2, 2.3 and 2.4 Activities Schedule 3.
The process is as follows:
Preparation of National Electrification Rollout Plan and Financing Prospectus
Environmental and social considerations
149
For Level 2.2 – 2.4 projects the proponent prepares an Environment Assessment Report according to Schedule 3 together with an EMP according to the Guideline. This is submitted to CEPA for appraisal.
Acceptance of Environment Permit Application (applies to Level 2.1 and 2.2 - 2.4 activities):
For Level 2.1 activities CEPA reviews and appraises the documentation and if satisfied then issues a Work Plan and a Fee Notice. The proponent is required to pay the fee at this stage before the Permit Application proceeds any further.
For Level 2.2 – 2.4 activities CEPA reviews and appraises the submitted documentation against the Schedules and Guideline requirements. If CEPA is satisfied with the Permit Application, CEPA requests the proponent to submit 20 additional copies for referral to both internal and external reviewers. CEPA also issues a Work Plan and Fee Notice. The proponent is required to pay the fee at this stage before the Permit Application proceeds any further.
Following receipt of payment, the application is then processed:
For Level 2.1 activities following approval CEPA will issue an approval generally with conditions allowing the proponent to commence the project. This completes the processing for Level 2.1 activities. Level 2.1 activities are to be assessed and approvals given in 1 month (30 days).Depending on the complexity of the application these time frames may be extended by the Director as required.
For Level 2.2 – 2.4 activities CEPA will commence assessment and will arrange review of the documentation (referral both internal and external), advertisement and conference of interested parties. The costs of these review and assessment activities are met from the fee that is determined by CEPA. Level 2.2 -2.4 assessment is to be completed within 2-3 months (60 days). Depending on the complexity of the application these time frames may be extended by the Director as required.
Referral of Environment Permit Application (applies to 2.2 – 2.4 activities):
CEPA refers the Application to relevant persons and government agencies for comment.
Advertisement of Environment Permit Application (applies to 2.2 – 2.4 activities):
CEPA notifies the proponent of its intention to conduct a public review of the Application. CEPA also provides an Advertisement Notice.
CEPA publishes the Advertisement Notice.
Conference of Interested Parties (applies to 2.2 – 2.4activities):
Preparation of National Electrification Rollout Plan and Financing Prospectus
Environmental and social considerations
150
CEPA receives comments from Public Review including recommendations and objections on the Application. If there are objections CEPA directs the Proponent to make a presentation of the Application to the Conference of Interested Parties that is scheduled by CEPA.
Decision on Environment Permit Application (applies to both 2.1 and 2.2 – 2.4 activities).
CEPA accepts the Environment Permit Application and publishes an Advertisement Notice announcing approval of Environmental Permit.
CEPA issues the Environmental Permit(EP) and advises proponent of their environmental obligations. The EP may include provisions for monitoring, carrying out an audit at periodic intervals and the submission of an Environment Improvement Plan.
Applications for 2.1 activities should be processed within 30 days while 2.2 – 2. 4 activities are required to be processed within 60 days. These time frames may be extended by the Director as required.
Level 3 approval process
It is unlikely that any of the NEROP activities will require a Level 3 assessment apart from where the location of any sub-project component may trigger a Level 3 activity such as transmission lines being routed through nature conservation area. This will then become a prescribed activity
Level 3 activities are major projects with large anticipated environmental impacts. Accordingly, the Level 3 approval process requires the preparation of an EIR (Environmental Inception Report), and an EIS (Environmental Impact Statement). The following guidelines are used to guide the preparation of these documents:
Guideline for Preparation of an Environmental Inception Report, 2004
Guideline for Conduct of Environmental Impact Assessment and Preparation of an Environmental Inception Statement, 2004.
The process for undertaking an approving a Level 3 activity is shown in Figure 29 above. Approval for a Level 3 activity may take 3-6 months (90 days).
7.4.3 Other relevant legislation in PNG
Land Act (1996)
The Land Act 1996 is an act that relates to land to consolidate and amend previous legislation that relates to land and to repeal various statutes that were in place under the colonial administration. The Land Act (1996) relates to matters of national interest, and is also consistent with section 29 of the Organic Law on Provincial Government and section 41 of the Organic law on Provincial and Local Level Governments.
Preparation of National Electrification Rollout Plan and Financing Prospectus
Environmental and social considerations
151
For the purpose of the WSSDP sub-projects, the relevant provisions in the Lands Act are covered in Division 10 section 103, which deals with Urban Development Leases.
Where there is an urban development lease on the proposed sub-project site and the road easement and allotments are clearly marked and identified, the land is confirmed to be under state or private ownership and therefore there is no infringement on customary land ownership which would otherwise trigger World Bank OP 4.12 on Land Acquisition and Resettlement.
The Land Act (1996) also deals with compulsory acquisition of customary land and acquisition of land by agreement. This is dealt with under Parts III and IV of the act.
Acquisition of land
Part III, Division 3 of the Act, shows that the Minister for Lands on behalf of the State may acquire customary land on such terms and conditions as are agreed between the Minister and the customary landowners. There is provision for compensation under this arrangement in Division 4 which deals with acquisition of customary land for the grant of Special Agriculture and Business lease. This allows the Minister to lease customary land for purpose of granting business and agriculture leases of the land. Division 5 Acquisition by Compulsory Process is undertaken for public purposes such as roads, bridges, and for purposes that serve the public and common good. This could be invoked as required for NEROP projects.
Compensation payments
Compensation is dealt with under Part IV of the Act. Section 14 (1) and (2) provides for compensation claims when a notice of acquisition is applied to land or chattel. However, the Act does not include any provision on compensation for food crops (including those produced in gardens) and economic trees. Section 19 relates to jurisdiction with regard to customary land, which includes the order and basis of compensation. Division 2 deals with the process for claiming compensation, while Division 3 provides principles on which compensation is to be assessed. The Valuer General within the National Department of Lands provides a list of asset values for compensation on customary land. Crop compensation costs are presented in Valuer-General’s Compensation for Trees and Plants: All Regions, which was prepared in 2013. This assessment of values is now out of date and in the opinion of the Valuer-General is no longer an accurate reflection of actual replacement cost.
Land Groups Incorporation Act 1974
The purpose of this act is to provide for greater participation by customarly landowners in the PNG economy through the more effective use of and management of land via greater certainity of land title and resolution of land-related disputes. The act provides for legal recognition of the corporate status of customary groups and confers on them as corporate entities the power to acquire, hold, dispose, manage and lease land.
Preparation of National Electrification Rollout Plan and Financing Prospectus
Environmental and social considerations
152
Land Disputes Settlement Act 1975
The purpose of this act is to provide just, efficient and effective machinery for the settlement of disputes in relation to interests in customary land by:
Encouraging self-reliance through the involvement of the people in the settlement of their own disputes
Using principles underlying the traditional dispute settlement processes.
It is envisaged that most of the disputes on NEROP projects will be settled this way, especially those involving off-the-grid projects in local communities.
Village Courts Act 1989
These operate alongside existing local and district courts and their functions are to “ensure peace and harmony” in the village and have jurisdiction over all residents. They primarily deal with acts of violence, blemishing reputations, damage to property, public drunkenness and failure to perform customary duties and obligations. They also involve where inter-village conflicts arise a joint sitting of the respective village courts. In practice they are often seen as a last resort when all other attempts at mediation have broken down. Only persons subject to customary law jurisdiction have the right to appear in both formal and informal village courts. NEROP would have no right to be a party to an action in this context and legal representation is not permitted in village courts.
These courts47 can adjudicate on matters relating to land acquisition and the payment of compensation if PAPs are dissatisfied with the project.48 Typically the Provincial Government District Lands Officer attempts to mediate and settle claims for payments for customary owned land according to the Land Act’s procedures and processes. If this fails PAPs may lodge complaints and grievances directly to the project or also through an independent committee that may consist of (i) the President of the Local Government Council; (ii) the Ward member for the affected area; and, (iii) a Village Court Magistrate.
If lodging complaints (refer to issues related to some aspect of project implementation such as failure to disclose entitlements) and grievance (refers to a situation whereby a PAP is not receiving their full entitlement or similar) with the independent committee produces an unsatisfactory outcome for a PAP the latter may request a formal village court hearing. The project has the duty to cooperate on a transparent basis with both the independent committee and village court and provide all information required to assist either or both of these entities to reach a decision. If the decision of the village court is unsatisfactory (as it
47 As village courts can act as a medium to help solve grievances and disputes arising from compulsory land acquisition and compensation they provide a suitable grievance and dispute resolution process for WB and ADB projects which require the establishment of a formal grievance and dispute resolution process. 48 This is related to monitoring to ensure (a) a baseline survey of PAPs is carried out, damaged assets have been valued, and compensation paid in accordance with the resettlement planning instrument; (b) the delivery of compensation payments and other allowances (if applicable) are timely and fair; and, (c) assessing the implementation and functioning of the grievance mechanisms. This will include monitoring the nature of the grievances lodged to identify trends, monitoring stakeholder satisfaction with outcomes, and tracking the responsiveness, and expedient resolution of grievance.
Preparation of National Electrification Rollout Plan and Financing Prospectus
Environmental and social considerations
153
may well be on a complicated compensation issue) the PAP may appeal to the Magistrate Court for a hearing. GoPNG legislation does not allow for all costs associated with such an appeal to the Magistrate Court but WB and ADB require that the project pay all costs involved.
Climate Change Act 2015
The Climate Change (Management) Act (the Act) was assented to in 2015. The Act is the overarching national law that deals with and regulates all emission contributing sectors in PNG. The Act consists of 11 Parts. The relevant parts include:
Part II established the Climate Change and Development Authority (CCDA) as the responsible organisation for administering climate change in PNG.
Part IV Measuring, Reporting and Verification Section 53 identifies ten regulated sectors of which electricity generation is one of the sectors.
Part V Mitigation: Section 65 requires all of the regulated sectors to provide an annual Emission Reduction Plan (ERP) on how they intend to reduce their GHG emissions or to capture CO2 for the coming year.
This will require DPE to each year lodge an ERP for all energy activities including electricity generation to CCDA. This will also affect PPL as the main electricity provider while NEROP activities will also need to be considered as a part of the ERP to be submitted by DPE.
NEROP and Climate Change
PNG is a signatory to the UN Convention on Climate Change (1992) and has developed a series of policies and legislation to meet climate change challenges. This includes a situation status report Climate-compatible development for Papua New Guinea issued in 2010 which outlined various development scenarios to abate carbon emissions within the context of the Vision 2050 development goals. This was followed by the National Climate Compatible Development Management Policy in 2014 and the Climate Change Management Act in 2015. A CDM guideline Clean Development Interim Approval Guide has also been issued which is designed to assist investors and project developers in developing CDM projects in PNG.
Climate change was initially administered by the Department of Environment and Conservation (DEC). This is now the responsibility of the Climate Change and Development Authority (CCDA) which was formed as the regulating body in 2015.
CCDA are also responsible for administering the REDD+49 scheme. This incorporates the Clean Development Mechanism (CDM) which establishes a system of tradeable carbon credits that can be bought by carbon emitters to offset their emissions.
The renewable energy generation components in NEROP meet the sustainable development goals outlined as a part of Vision 2050. The Climate-compatible Report (2010) shows that NEROP will assist in meeting the carbon reduction goals under the heading “Sustainable
49 While the activity is called REDD+ the acronym translates as Reducing Emissions from Deforestation and Forest Degradation + Conservation Management of Forests and Carbon Stock Enhancement.
Preparation of National Electrification Rollout Plan and Financing Prospectus
Environmental and social considerations
154
rural electrification through a combination of solar micro-hydro and photovoltaic technologies, p.30”, to provide access to electricity for households and critical community services such as schools, health centres and airstrips. The report identified DPE as the lead agency in planning to meet this need.
However, access to the CDM for NEROP is hindered by (i) the overall small size of the installed systems and (ii) complexities in determining reductions in emissions where small PV systems may be used. Presently there is no agreed methodology to assess likely reduction in in emissions from renewables where it will replace use of fuel wood, since it is considered that there is unlikely to be a significant reduction in fuel wood use following initial electrification. However, where diesel generation may be replaced by PV or micro-hydro technology, the emission reduction can be readily calculated. Similarly, for large hydropower installations the additionality50 of the benefit can be determined. At this stage it is not practical to calculate additionality benefits for small renewable systems.
The carbon market is also waiting for further confirmation from UNFCC as to what changes may emanate from the Paris Accord of 2015. It is possible that the CDM mechanism may be phased out and a new mechanism created, until this is known the carbon market continues to be mainly unresponsive.
It would appear that due to the expected small size of the majority of the renewable energy projects that will define NEROP there will be little advantage to private investors who may want to seek CDM carbon credits.
Under the Climate Change (Management) Act, Sections 53 and 65 of the Act will require NEROP activities to be reported as a regulated activity. This will require DPE to annually file an Emission Mitigation Plan Report (EMPR) to CCDA.
Water Resources Act 1982
The Act principally provides for the management and conservation of water resources and defines the right to take and use water.
Part V deals with the Applications for Water Use Permits, etc. This states that when an application is submitted to the Board, the Board is to advise the Minister responsible for environmental matters. Applications must be made in accordance with the Environment Act2000, whereby CEPA have been delegated this authority to approve Water Permits.
Micro-hydro facilities under 2MW can be treated as a Level 1 activity which will not require approval for operation on a water course. Thus unless NEROP install hydropower facilities greater than 2MW NEROP installations are unlikely to trigger any requirement for a Water Permit under the Environment Act, 2000.
50Additionality is defined as whether an emissions reduction or removal would have occurred in the absence of new incentives, such as a payment for emissions reductions. http://theredddesk.org/markets-standards/design-features/additionality
Preparation of National Electrification Rollout Plan and Financing Prospectus
Environmental and social considerations
155
7.4.4 Reporting Requirements
In most situations two reports will be required, one to address the WB OPs51 and the other to meet CEPA requirements.
Where the national safeguards are not equivalent to the WB OPs the WB procedures will take precedence. This will mainly concern the requirements for timely public consultation with a wide audience that includes women, assessment of compensation for land acquisition and standing crops, the assessment of Indigenous Peoples requirements, the establishment of a grievance redress mechanism and adequate public disclosure of the completed safeguard documents.
Reports should initially be prepared to meet the more rigorous requirements of the WB OP which will ensure that all OP requirements are initially covered. At the time of commencing the WB studies an Application to establish the Prescribed Activity Level should also be submitted to CEPA so that the initial steps of determining the Activity Level is already underway.
At the completion of the WB reports these can be re-edited and transferred to the CEPA format and then submitted to CEPA for approval.
7.5 Assessment of institutional capacity
This section deals with the roles, capacity and strengthening requirements of the implementing agencies to effectively undertake their role in implementing the environmental and social safeguards that will be required for NEROP.
Department of Petroleum and Energy
Capacity strengthening is required in the NEROP implementing unit (IU) where two safeguards staff (one social and one environmental safeguards) will be needed These persons will be responsible for ensuring that all of the projects have been assessed and have received CEPA approval as part of the project design and approval process. The safeguard staff will also ensure that the contractor is able to comply with the conditions of the ESMP and if necessary a LARP (or similar if necessary) and they will facilitate this by providing a training program for every contractor prior to commencing work. The staff will also supervise compliance with the EMP and LARP (or similar of necessary) safeguards during construction. During operation the staff will also monitor and supervise the operational requirements of the EMP. Additionally these staff will be required to meet CCDA requirements in terms of preparing annual EMPRs for submission to CCDA.
The estimated cost of meeting the two positions within the IU is $120,000/year to cover salary and training costs. Other support costs such as travel and per diem to supervise the various projects will be met from the consolidated IU budget. The positions should be
51 The use of the term (WB OP) also implies that the safeguard assessment and approval requirements of other multilateral lending agencies, financiers or aid agencies are applied as required by each organisation.
Preparation of National Electrification Rollout Plan and Financing Prospectus
Environmental and social considerations
156
created as part of the process of establishing the IU and be advertised within the first stage of recruitment for the IU.
Conservation and Environment Protection Authority
As part of the environmental assessments that are submitted for Level 2.3 – 2.4 and Level 3 projects CEPA are also required to assess the socio-economic sections of the assessments. While CEPA environmental safeguards have been recently strengthened by an ADB TA52 this did not include any strengthening of the socio-economic safeguards. In discussions that were held with CEPA management this was identified as an issue that they were facing and it is recommended that a small TA be set up and funded as part of the NEROP loan to strengthen the application of social safeguards within CEPA. This could be based on a review of the current social safeguards situation, identify gaps in the application of the safeguards and recommend how these could be addressed by a series of programs e.g. strengthening legislation and regulations, training, issuing of guidelines etc.
The estimated cost of strengthening CEPA’s socio-economic section is estimated at $100,000. The program should commence at the beginning of the NEROP roll out and be completed within the first year.
PPL
PPL have one Environmental Specialist located within the Environment Health and Safety Unit whose role it is to manage environmental safeguards for PPL projects.53 With both the number of projects increasing and the increased awareness of the need to include environmental safeguards within the project approval and management process the role of this person is now continuously extending. It has now reached the stage whereby this person is now concentrating on daily project management issues rather than undertaking some of the regulatory tasks such as monitoring environmental permit requirements and reporting to CEPA.
A further two staff are proposed to be added to the PPL structure to meet NEROP requirements as PPL will be carrying additional NEROP tasks especially in the construction and extension of transmission lines and the maintenance of the existing NEROP projects at the community level. One person will address social safeguards while the other will address the environmental safeguards. Additionally, these staff will be required to meet CCDA requirements in terms of preparing annual EMPRs.
NEROP will meet the support of the two additional staff persons for two years after which PPL is to formalise the positions as a regular PPL staff within the Environment Health and Safety Unit. The NEROP TA will meet the staff salary, and training costs, while the NEROP management budget will meet travel and per diem costs for project implementation. The cost of this support to PPL for two years is estimated as $120,000. The appointment should be made as soon as NEROP commences so that this person is available to assist PPL in project identification and preparation.
52TA 7566-REG: Strengthening and Use of Country Safeguard Systems 53 On a project specific basis PPL also has a social development specialist that deals with land acquisition and resettlement, Indigenous Peoples and gender issues.
Preparation of National Electrification Rollout Plan and Financing Prospectus
Environmental and social considerations
157
Department of the Valuer General
The Department of the Valuer General (DVG) establishes compensation rates for payment of loss of ground and tree crops. These values were last established in 2013 and are now no longer realistic with regard to current values.
NEROP will be required to assess and pay compensation for the removal of standing crops particularly along easements and will require an updated list of payments to make for such crops. To address this situation a small TA is to be established within DVG to update the Compensation Schedule for Trees and Plants. This was identified as an issue in discussions with the Director General and is supported by the DG. The cost of this is estimated at $50,000. The TA should commence as soon as possible.
Department of District Administration (DDA)
DDA is primarily an administrative organisation and consequently has limited capacity to manage projects which is instead normally delegated to the LLG. As NEROP project implementation will be managed by the NEROP Implementation Unit thus there is no need to address any safeguard capacity shortfalls in either DDA or the LLG.
Contractors
Construction of the NEROP systems will be most likely be undertaken by PNG contractors. Overall experience of PNG contractors work practices shows that often they have little appreciation of the environmental and social safeguard requirements as detailed in the ESMP and carried through into the contract documents.
To strengthen contractor’s compliance with the contractual requirements of meeting the ESMP conditions a training program is required that will be organised by the IU safeguards staff. It will be a requirement for all contractors to attend prior to commencing construction.
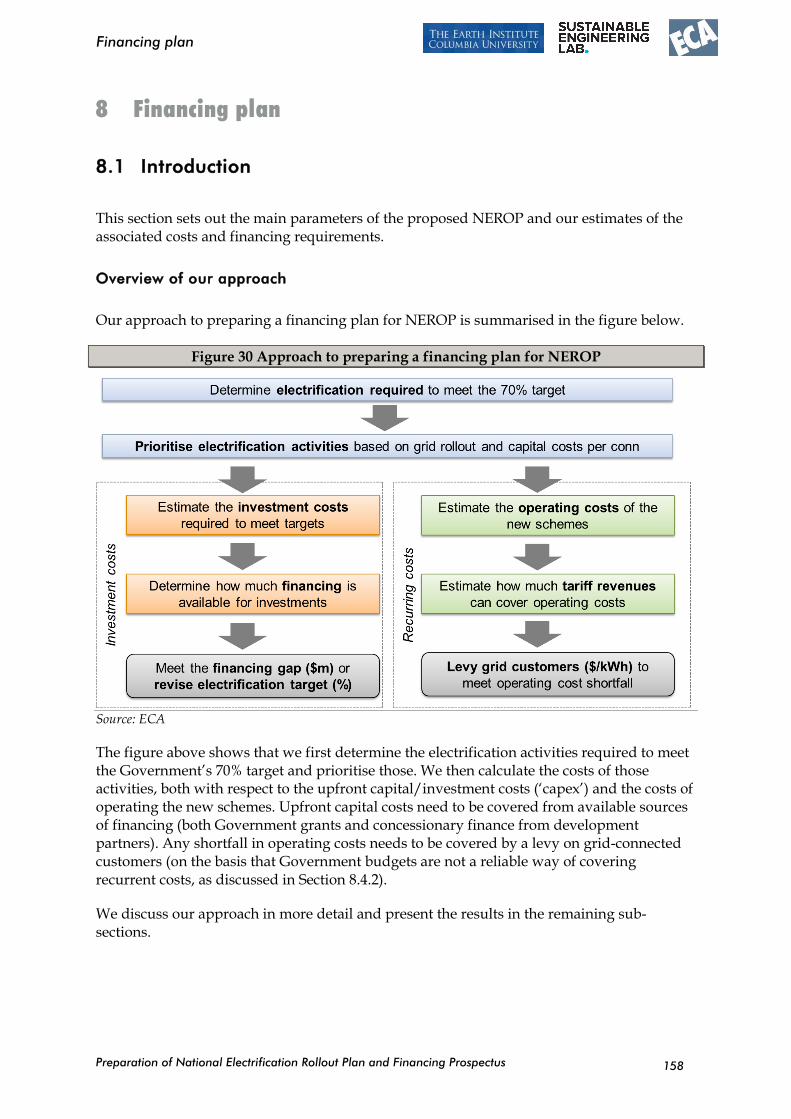
Preparation of National Electrification Rollout Plan and Financing Prospectus
Financing plan
158
8 Financing plan
8.1 Introduction
This section sets out the main parameters of the proposed NEROP and our estimates of the associated costs and financing requirements.
Overview of our approach
Our approach to preparing a financing plan for NEROP is summarised in the figure below.
Figure 30 Approach to preparing a financing plan for NEROP
Source: ECA
The figure above shows that we first determine the electrification activities required to meet the Government’s 70% target and prioritise those. We then calculate the costs of those activities, both with respect to the upfront capital/investment costs (‘capex’) and the costs of operating the new schemes. Upfront capital costs need to be covered from available sources of financing (both Government grants and concessionary finance from development partners). Any shortfall in operating costs needs to be covered by a levy on grid-connected customers (on the basis that Government budgets are not a reliable way of covering recurrent costs, as discussed in Section 8.4.2).
We discuss our approach in more detail and present the results in the remaining sub-sections.
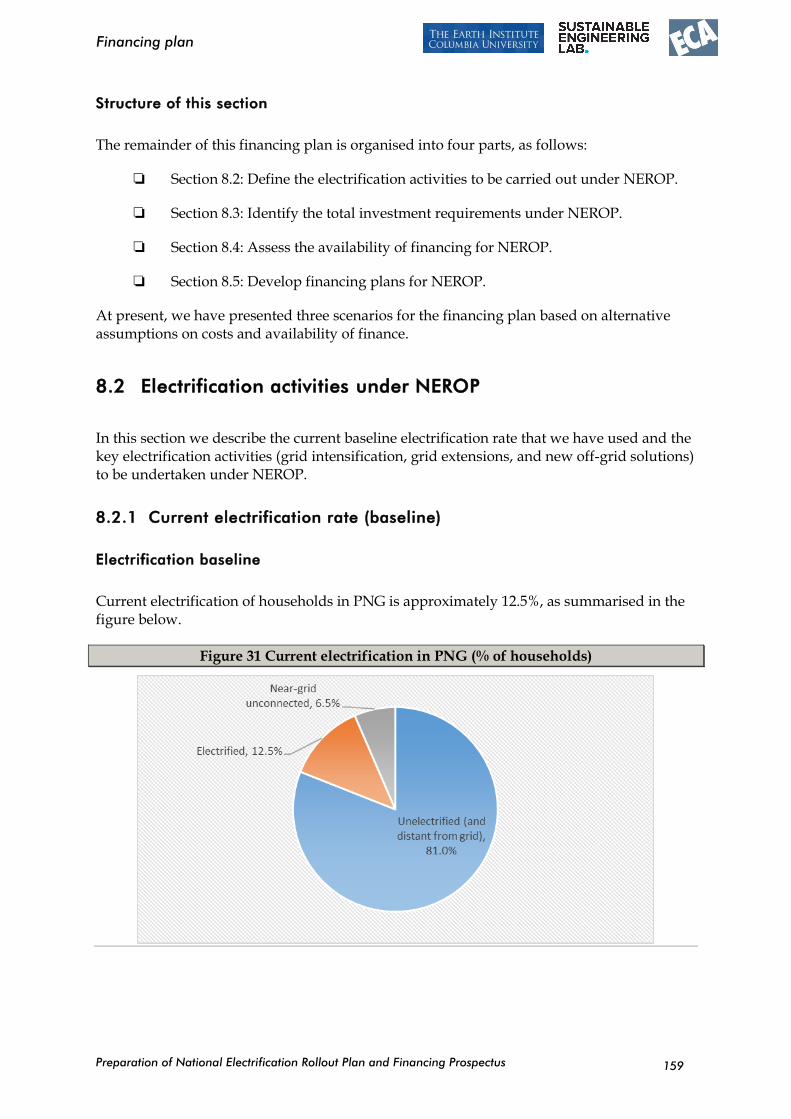
Preparation of National Electrification Rollout Plan and Financing Prospectus
Financing plan
159
Structure of this section
The remainder of this financing plan is organised into four parts, as follows:
Section 8.2: Define the electrification activities to be carried out under NEROP.
Section 8.3: Identify the total investment requirements under NEROP.
Section 8.4: Assess the availability of financing for NEROP.
Section 8.5: Develop financing plans for NEROP.
At present, we have presented three scenarios for the financing plan based on alternative assumptions on costs and availability of finance.
8.2 Electrification activities under NEROP
In this section we describe the current baseline electrification rate that we have used and the key electrification activities (grid intensification, grid extensions, and new off-grid solutions) to be undertaken under NEROP.
8.2.1 Current electrification rate (baseline)
Electrification baseline
Current electrification of households in PNG is approximately 12.5%, as summarised in the figure below.
Figure 31 Current electrification in PNG (% of households)

Preparation of National Electrification Rollout Plan and Financing Prospectus
Financing plan
160
Baseline sources
The sources of electrified, unelectrified, and near-grid connected households is described as follows:
Unelectrified households: The Least-Cost Geospatial National Electrification Plan prepared for Papua New Guinea (PNG) addresses electrification of all communities located in excess of 1 km from an existing grid transformer and are therefore assumed to be currently unconnected. The plan estimates that, based on census data and geospatial mapping of the existing grid, these communities constitute approximately 81% of all households. We refer to these as ‘unelectrified households’.
Electrified households: We assume that approximately 12.5% of all households are already electrified, based on the Government’s baseline as reported in the DSP 2030 (page 77). The official HIES reports 16.7% of households use grid-based electricity as their source of lighting, while an additional 2.8% use private generated electricity. Other analysis of HIES data54 indicates 12.48% of households as being supplied with grid electricity. We have used the rounded value of a 12.5% grid electrification rate as the baseline, which is broadly in line with PNG Power Ltd’s best estimate of current electrification.
Near-grid unconnected households: With 12.5% electrified but 19% (100% less 81%) within 1km of the existing grid, this leaves a further 6.5% of households who are located near to the grid but apparently not connected to it. We refer to these as ‘near-grid unconnected’ households.
Uncertainties over baseline
We note that based on the DSP, 12.5% of customers are electrified, yet this figure is different from that derived from summary tables of the HIES (16.7%). It is also very different from PPL’s records of connected customers to total households. The Asian Development Bank-funded National Grid Expansion Plan55 (Table 125) reports that PPL currently supplies 102,850 domestic customers out of a total of 1,505,403 households or an electrification rate of just 6.8%.
These differences might be explained by:
Errors in PPL’s billing database and/or large numbers of illegal connections. However, while both of these appear to be issues in PNG, we find it unlikely that either PPL only records half of all connections in its database or that there are equal numbers of legal and illegal connections.
Large numbers of households being supplied through non-PPL grids. This also appears to be unlikely. While there is a total of 98 off-grid solutions located in C-centres under the control of local governments, anecdotal reports suggest that there are almost entirely non-operational. The isolated grid formerly developed
54 Including the Pacific Island Population Estimates and Projections, 2013, Secretariat of the Pacific Community 55 PNG Power Limited, May 2016, National Distribution Grid Expansion Plan: Final Report.
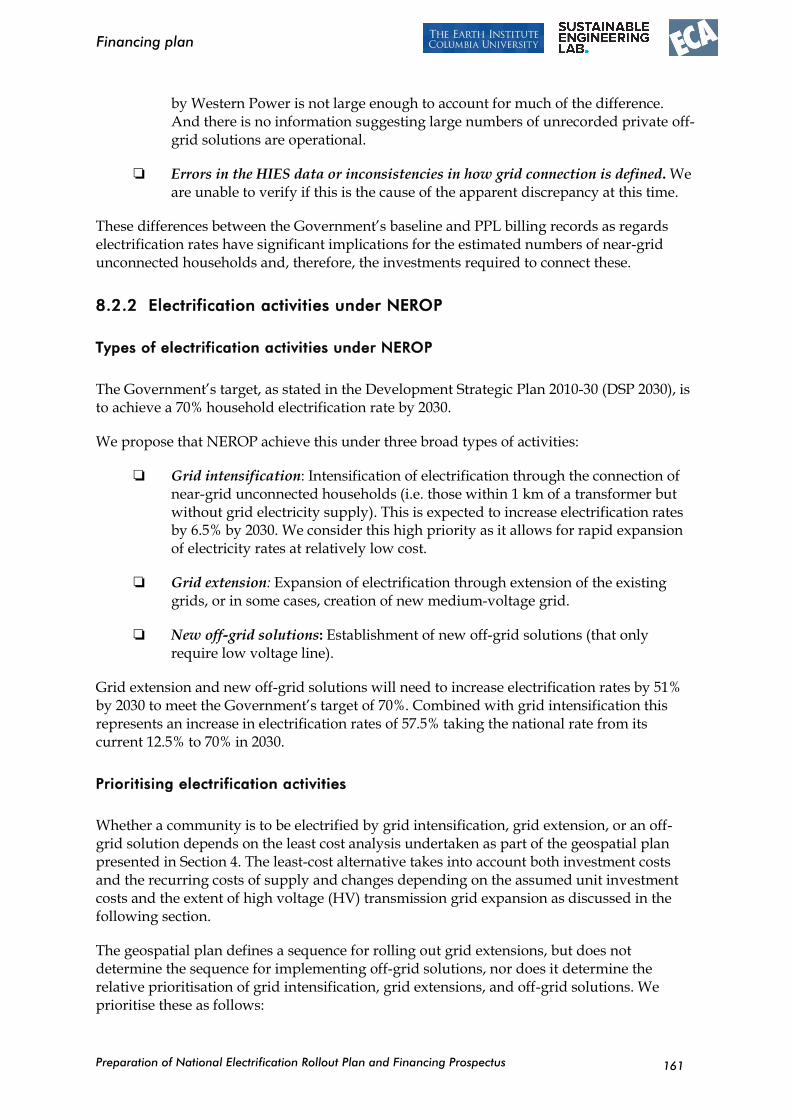
Preparation of National Electrification Rollout Plan and Financing Prospectus
Financing plan
161
by Western Power is not large enough to account for much of the difference. And there is no information suggesting large numbers of unrecorded private off-grid solutions are operational.
Errors in the HIES data or inconsistencies in how grid connection is defined. We are unable to verify if this is the cause of the apparent discrepancy at this time.
These differences between the Government’s baseline and PPL billing records as regards electrification rates have significant implications for the estimated numbers of near-grid unconnected households and, therefore, the investments required to connect these.
8.2.2 Electrification activities under NEROP
Types of electrification activities under NEROP
The Government’s target, as stated in the Development Strategic Plan 2010-30 (DSP 2030), is to achieve a 70% household electrification rate by 2030.
We propose that NEROP achieve this under three broad types of activities:
Grid intensification: Intensification of electrification through the connection of near-grid unconnected households (i.e. those within 1 km of a transformer but without grid electricity supply). This is expected to increase electrification rates by 6.5% by 2030. We consider this high priority as it allows for rapid expansion of electricity rates at relatively low cost.
Grid extension: Expansion of electrification through extension of the existing grids, or in some cases, creation of new medium-voltage grid.
New off-grid solutions: Establishment of new off-grid solutions (that only require low voltage line).
Grid extension and new off-grid solutions will need to increase electrification rates by 51% by 2030 to meet the Government’s target of 70%. Combined with grid intensification this represents an increase in electrification rates of 57.5% taking the national rate from its current 12.5% to 70% in 2030.
Prioritising electrification activities
Whether a community is to be electrified by grid intensification, grid extension, or an off-grid solution depends on the least cost analysis undertaken as part of the geospatial plan presented in Section 4. The least-cost alternative takes into account both investment costs and the recurring costs of supply and changes depending on the assumed unit investment costs and the extent of high voltage (HV) transmission grid expansion as discussed in the following section.
The geospatial plan defines a sequence for rolling out grid extensions, but does not determine the sequence for implementing off-grid solutions, nor does it determine the relative prioritisation of grid intensification, grid extensions, and off-grid solutions. We prioritise these as follows:
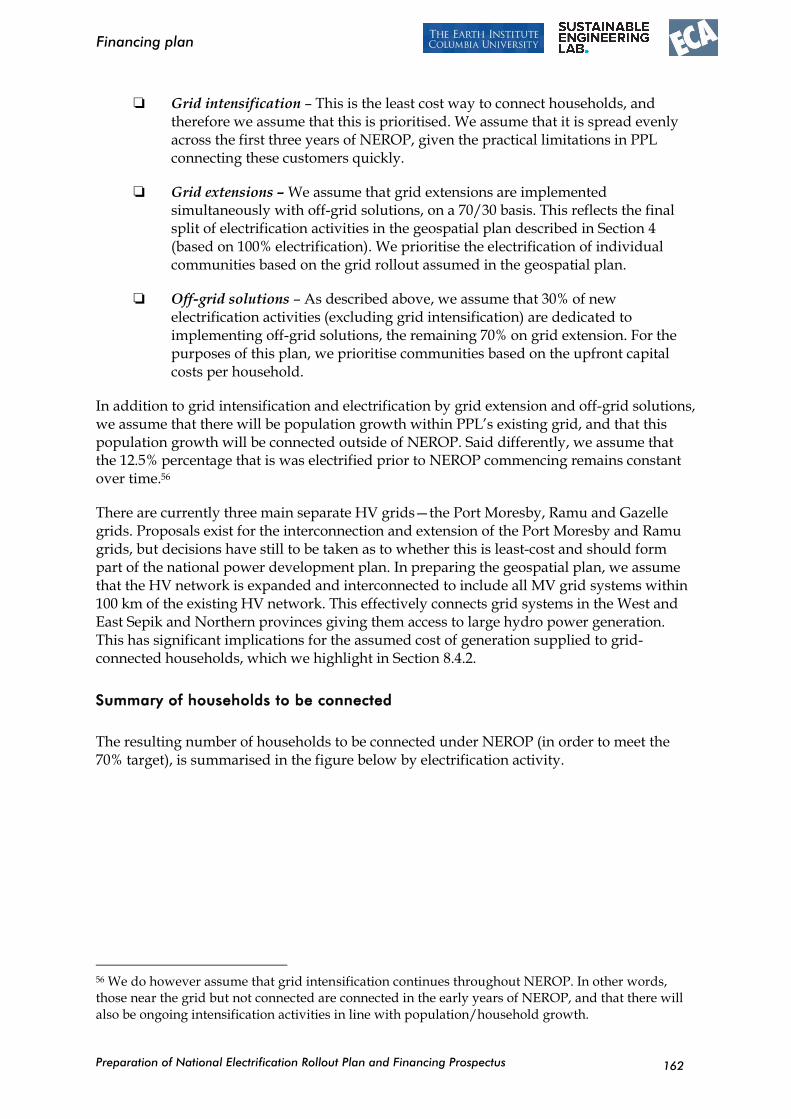
Preparation of National Electrification Rollout Plan and Financing Prospectus
Financing plan
162
Grid intensification – This is the least cost way to connect households, and therefore we assume that this is prioritised. We assume that it is spread evenly across the first three years of NEROP, given the practical limitations in PPL connecting these customers quickly.
Grid extensions – We assume that grid extensions are implemented simultaneously with off-grid solutions, on a 70/30 basis. This reflects the final split of electrification activities in the geospatial plan described in Section 4 (based on 100% electrification). We prioritise the electrification of individual communities based on the grid rollout assumed in the geospatial plan.
Off-grid solutions – As described above, we assume that 30% of new electrification activities (excluding grid intensification) are dedicated to implementing off-grid solutions, the remaining 70% on grid extension. For the purposes of this plan, we prioritise communities based on the upfront capital costs per household.
In addition to grid intensification and electrification by grid extension and off-grid solutions, we assume that there will be population growth within PPL’s existing grid, and that this population growth will be connected outside of NEROP. Said differently, we assume that the 12.5% percentage that is was electrified prior to NEROP commencing remains constant over time.56
There are currently three main separate HV grids—the Port Moresby, Ramu and Gazelle grids. Proposals exist for the interconnection and extension of the Port Moresby and Ramu grids, but decisions have still to be taken as to whether this is least-cost and should form part of the national power development plan. In preparing the geospatial plan, we assume that the HV network is expanded and interconnected to include all MV grid systems within 100 km of the existing HV network. This effectively connects grid systems in the West and East Sepik and Northern provinces giving them access to large hydro power generation. This has significant implications for the assumed cost of generation supplied to grid-connected households, which we highlight in Section 8.4.2.
Summary of households to be connected
The resulting number of households to be connected under NEROP (in order to meet the 70% target), is summarised in the figure below by electrification activity.
56 We do however assume that grid intensification continues throughout NEROP. In other words, those near the grid but not connected are connected in the early years of NEROP, and that there will also be ongoing intensification activities in line with population/household growth.
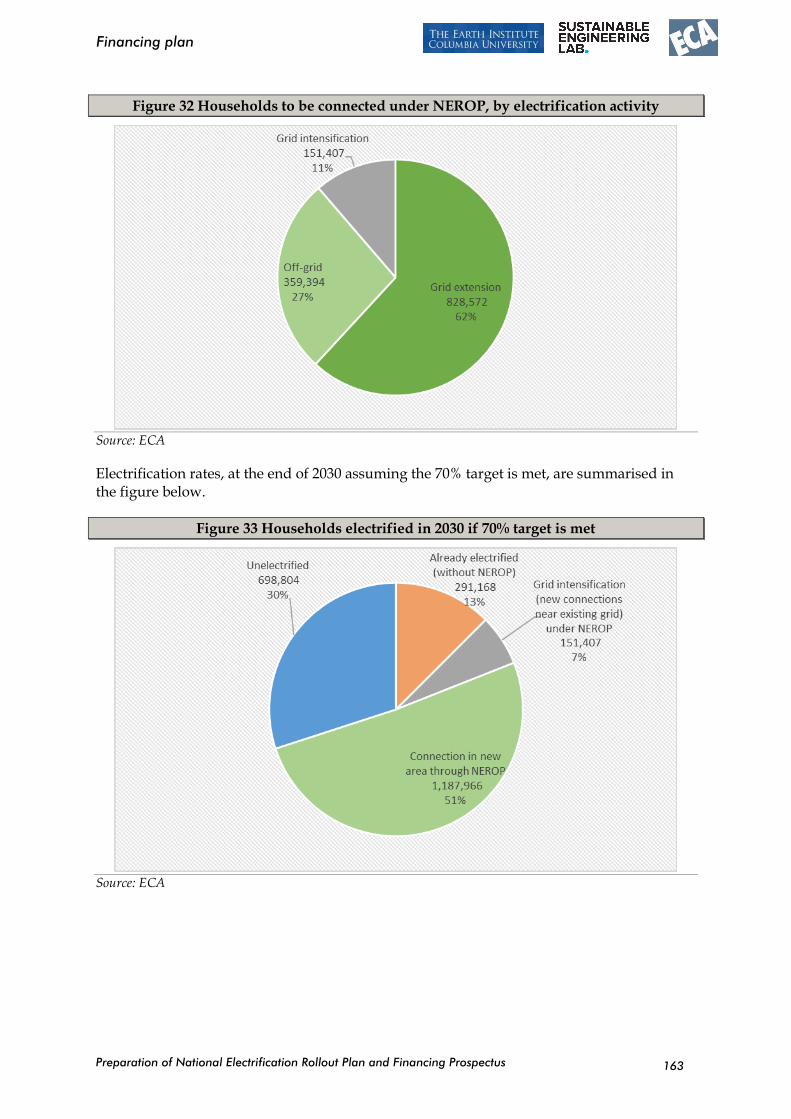
Preparation of National Electrification Rollout Plan and Financing Prospectus
Financing plan
163
Figure 32 Households to be connected under NEROP, by electrification activity
Source: ECA
Electrification rates, at the end of 2030 assuming the 70% target is met, are summarised in the figure below.
Figure 33 Households electrified in 2030 if 70% target is met
Source: ECA
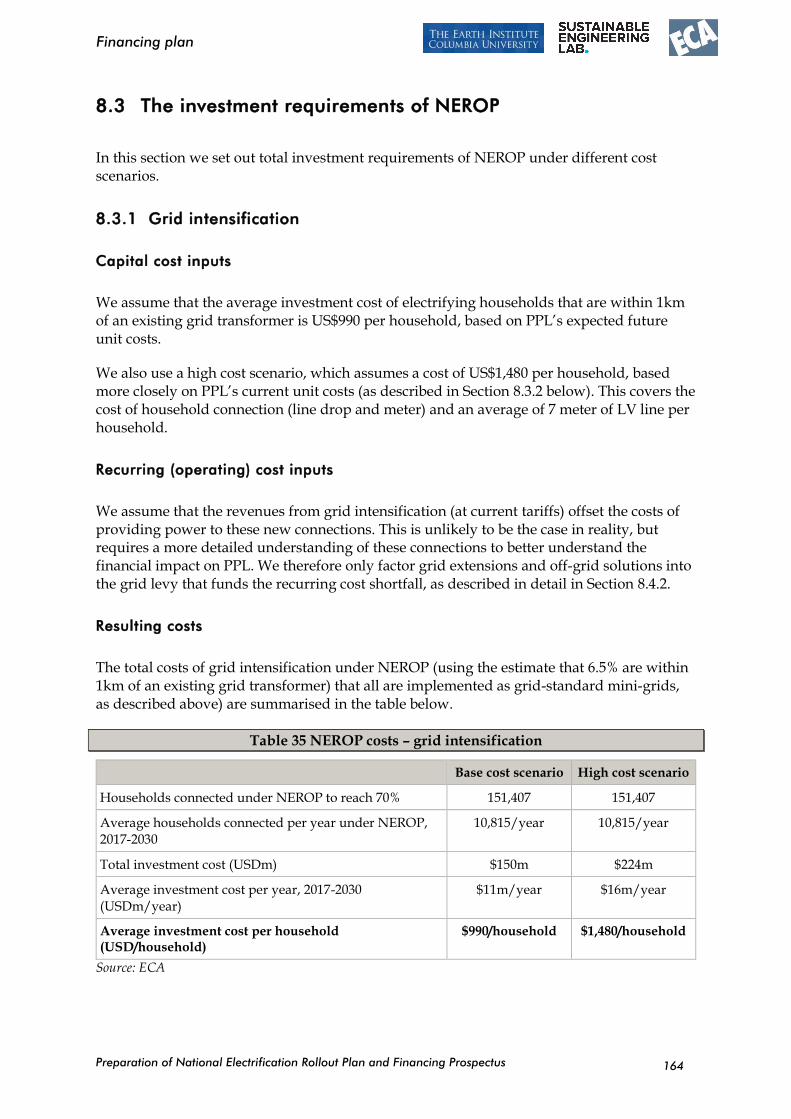
Preparation of National Electrification Rollout Plan and Financing Prospectus
Financing plan
164
8.3 The investment requirements of NEROP
In this section we set out total investment requirements of NEROP under different cost scenarios.
8.3.1 Grid intensification
Capital cost inputs
We assume that the average investment cost of electrifying households that are within 1km of an existing grid transformer is US$990 per household, based on PPL’s expected future unit costs.
We also use a high cost scenario, which assumes a cost of US$1,480 per household, based more closely on PPL’s current unit costs (as described in Section 8.3.2 below). This covers the cost of household connection (line drop and meter) and an average of 7 meter of LV line per household.
Recurring (operating) cost inputs
We assume that the revenues from grid intensification (at current tariffs) offset the costs of providing power to these new connections. This is unlikely to be the case in reality, but requires a more detailed understanding of these connections to better understand the financial impact on PPL. We therefore only factor grid extensions and off-grid solutions into the grid levy that funds the recurring cost shortfall, as described in detail in Section 8.4.2.
Resulting costs
The total costs of grid intensification under NEROP (using the estimate that 6.5% are within 1km of an existing grid transformer) that all are implemented as grid-standard mini-grids, as described above) are summarised in the table below.
Table 35 NEROP costs – grid intensification
Base cost scenario High cost scenario
Households connected under NEROP to reach 70% 151,407 151,407
Average households connected per year under NEROP, 2017-2030
10,815/year 10,815/year
Total investment cost (USDm) $150m $224m
Average investment cost per year, 2017-2030 (USDm/year)
$11m/year $16m/year
Average investment cost per household (USD/household)
$990/household $1,480/household
Source: ECA
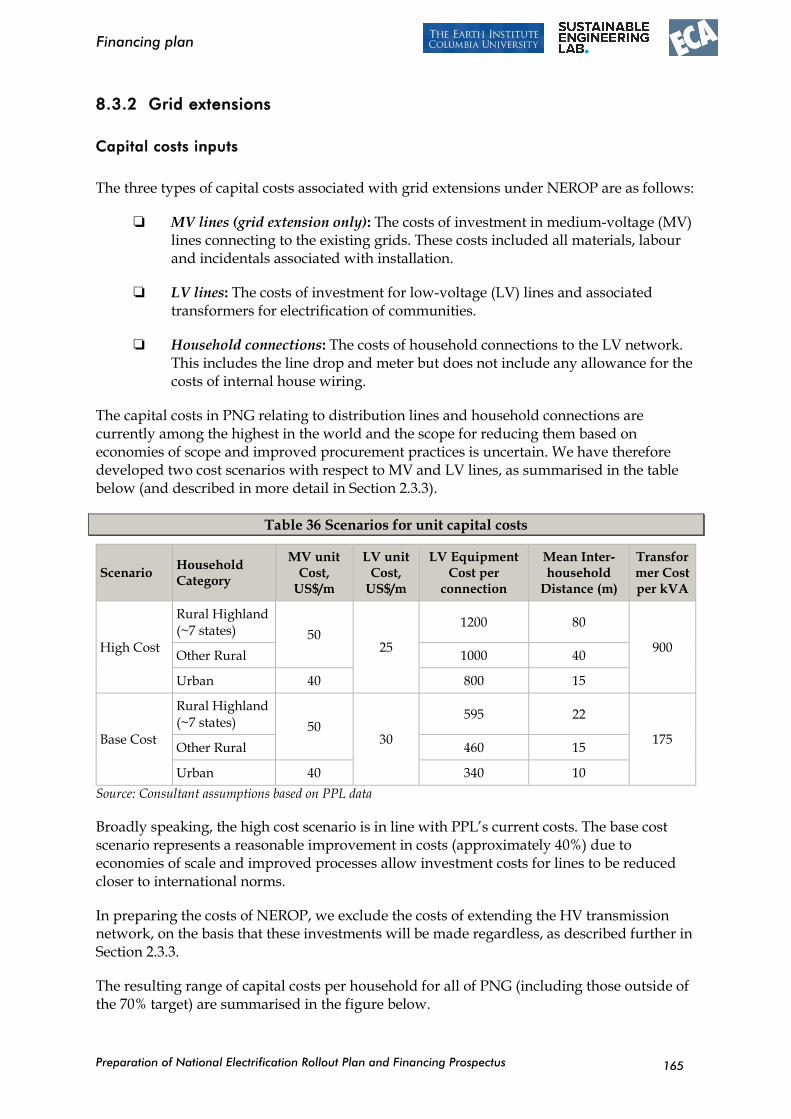
Preparation of National Electrification Rollout Plan and Financing Prospectus
Financing plan
165
8.3.2 Grid extensions
Capital costs inputs
The three types of capital costs associated with grid extensions under NEROP are as follows:
MV lines (grid extension only): The costs of investment in medium-voltage (MV) lines connecting to the existing grids. These costs included all materials, labour and incidentals associated with installation.
LV lines: The costs of investment for low-voltage (LV) lines and associated transformers for electrification of communities.
Household connections: The costs of household connections to the LV network. This includes the line drop and meter but does not include any allowance for the costs of internal house wiring.
The capital costs in PNG relating to distribution lines and household connections are currently among the highest in the world and the scope for reducing them based on economies of scope and improved procurement practices is uncertain. We have therefore developed two cost scenarios with respect to MV and LV lines, as summarised in the table below (and described in more detail in Section 2.3.3).
Table 36 Scenarios for unit capital costs
Scenario Household Category
MV unit Cost,
US$/m
LV unit Cost,
US$/m
LV Equipment Cost per
connection
Mean Inter-household
Distance (m)
Transformer Cost per kVA
High Cost
Rural Highland (~7 states) 50
25
1200 80
900 Other Rural 1000 40
Urban 40 800 15
Base Cost
Rural Highland (~7 states) 50
30
595 22
175 Other Rural 460 15
Urban 40 340 10
Source: Consultant assumptions based on PPL data
Broadly speaking, the high cost scenario is in line with PPL’s current costs. The base cost scenario represents a reasonable improvement in costs (approximately 40%) due to economies of scale and improved processes allow investment costs for lines to be reduced closer to international norms.
In preparing the costs of NEROP, we exclude the costs of extending the HV transmission network, on the basis that these investments will be made regardless, as described further in Section 2.3.3.
The resulting range of capital costs per household for all of PNG (including those outside of the 70% target) are summarised in the figure below.
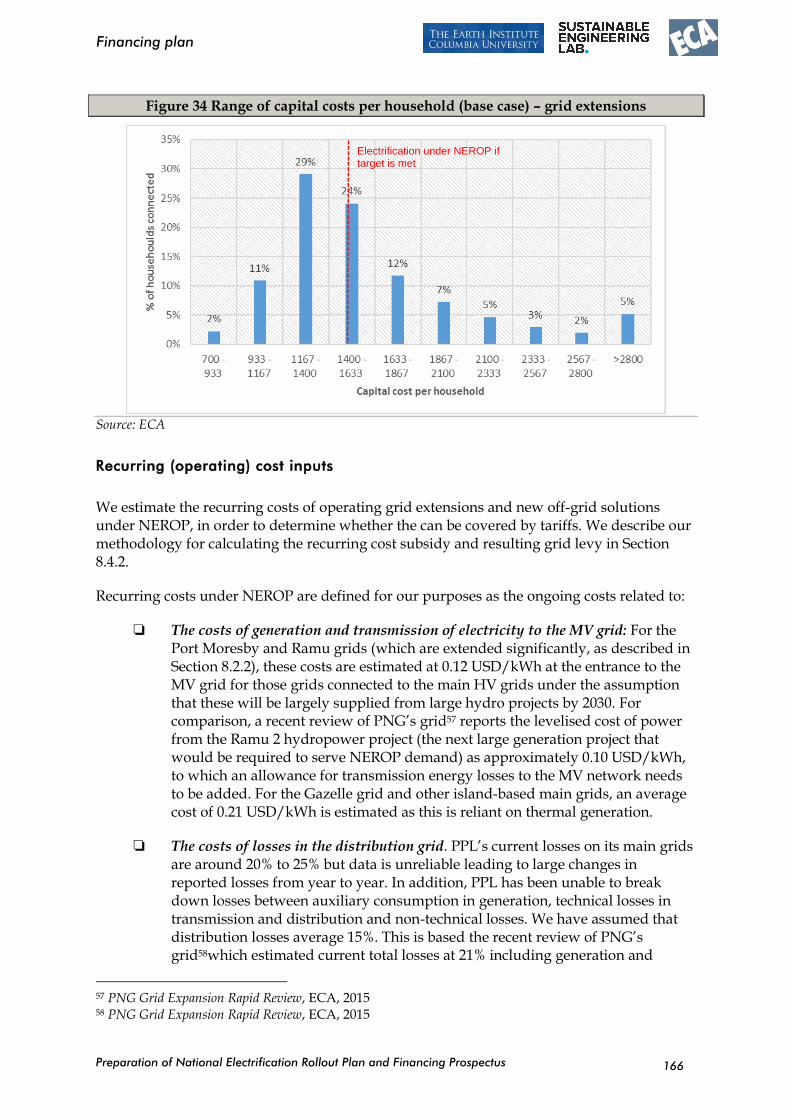
Preparation of National Electrification Rollout Plan and Financing Prospectus
Financing plan
166
Figure 34 Range of capital costs per household (base case) – grid extensions
Source: ECA
Recurring (operating) cost inputs
We estimate the recurring costs of operating grid extensions and new off-grid solutions under NEROP, in order to determine whether the can be covered by tariffs. We describe our methodology for calculating the recurring cost subsidy and resulting grid levy in Section 8.4.2.
Recurring costs under NEROP are defined for our purposes as the ongoing costs related to:
The costs of generation and transmission of electricity to the MV grid: For the Port Moresby and Ramu grids (which are extended significantly, as described in Section 8.2.2), these costs are estimated at 0.12 USD/kWh at the entrance to the MV grid for those grids connected to the main HV grids under the assumption that these will be largely supplied from large hydro projects by 2030. For comparison, a recent review of PNG’s grid57 reports the levelised cost of power from the Ramu 2 hydropower project (the next large generation project that would be required to serve NEROP demand) as approximately 0.10 USD/kWh, to which an allowance for transmission energy losses to the MV network needs to be added. For the Gazelle grid and other island-based main grids, an average cost of 0.21 USD/kWh is estimated as this is reliant on thermal generation.
The costs of losses in the distribution grid. PPL’s current losses on its main grids are around 20% to 25% but data is unreliable leading to large changes in reported losses from year to year. In addition, PPL has been unable to break down losses between auxiliary consumption in generation, technical losses in transmission and distribution and non-technical losses. We have assumed that distribution losses average 15%. This is based the recent review of PNG’s grid58which estimated current total losses at 21% including generation and
57 PNG Grid Expansion Rapid Review, ECA, 2015 58 PNG Grid Expansion Rapid Review, ECA, 2015
Electrification under NEROP if target is met
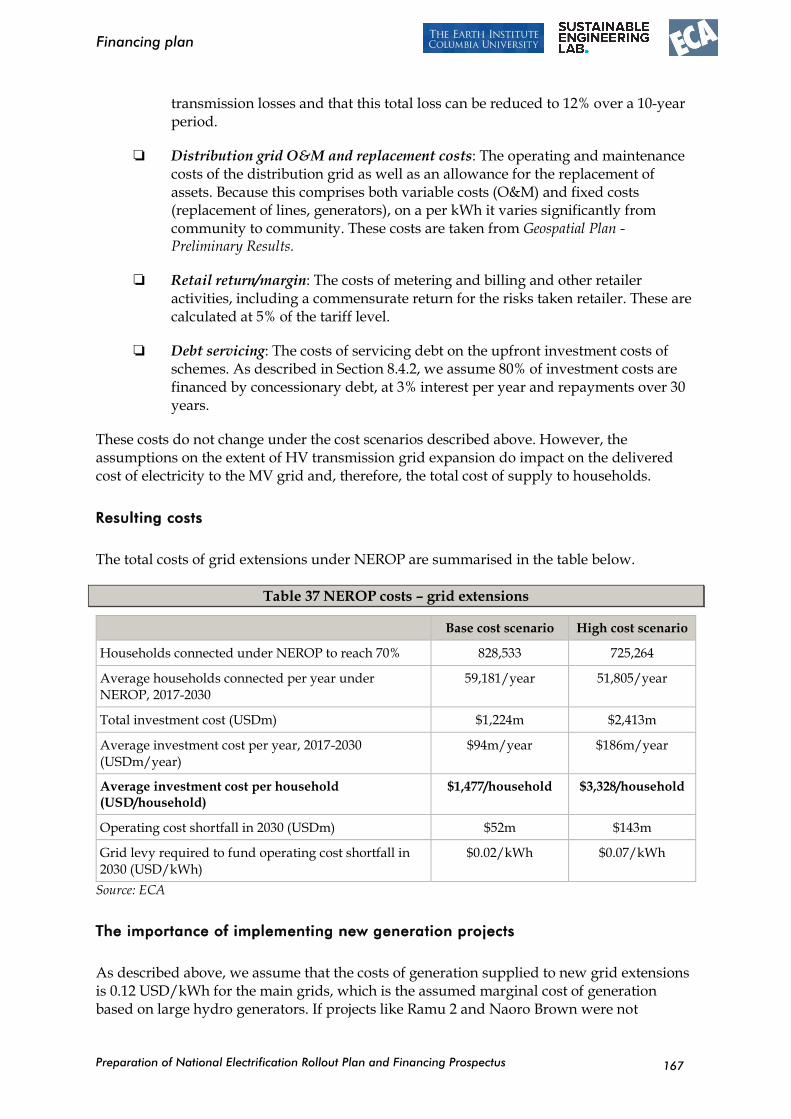
Preparation of National Electrification Rollout Plan and Financing Prospectus
Financing plan
167
transmission losses and that this total loss can be reduced to 12% over a 10-year period.
Distribution grid O&M and replacement costs: The operating and maintenance costs of the distribution grid as well as an allowance for the replacement of assets. Because this comprises both variable costs (O&M) and fixed costs (replacement of lines, generators), on a per kWh it varies significantly from community to community. These costs are taken from Geospatial Plan - Preliminary Results.
Retail return/margin: The costs of metering and billing and other retailer activities, including a commensurate return for the risks taken retailer. These are calculated at 5% of the tariff level.
Debt servicing: The costs of servicing debt on the upfront investment costs of schemes. As described in Section 8.4.2, we assume 80% of investment costs are financed by concessionary debt, at 3% interest per year and repayments over 30 years.
These costs do not change under the cost scenarios described above. However, the assumptions on the extent of HV transmission grid expansion do impact on the delivered cost of electricity to the MV grid and, therefore, the total cost of supply to households.
Resulting costs
The total costs of grid extensions under NEROP are summarised in the table below.
Table 37 NEROP costs – grid extensions
Base cost scenario High cost scenario
Households connected under NEROP to reach 70% 828,533 725,264
Average households connected per year under NEROP, 2017-2030
59,181/year 51,805/year
Total investment cost (USDm) $1,224m $2,413m
Average investment cost per year, 2017-2030 (USDm/year)
$94m/year $186m/year
Average investment cost per household (USD/household)
$1,477/household $3,328/household
Operating cost shortfall in 2030 (USDm) $52m $143m
Grid levy required to fund operating cost shortfall in 2030 (USD/kWh)
$0.02/kWh $0.07/kWh
Source: ECA
The importance of implementing new generation projects
As described above, we assume that the costs of generation supplied to new grid extensions is 0.12 USD/kWh for the main grids, which is the assumed marginal cost of generation based on large hydro generators. If projects like Ramu 2 and Naoro Brown were not
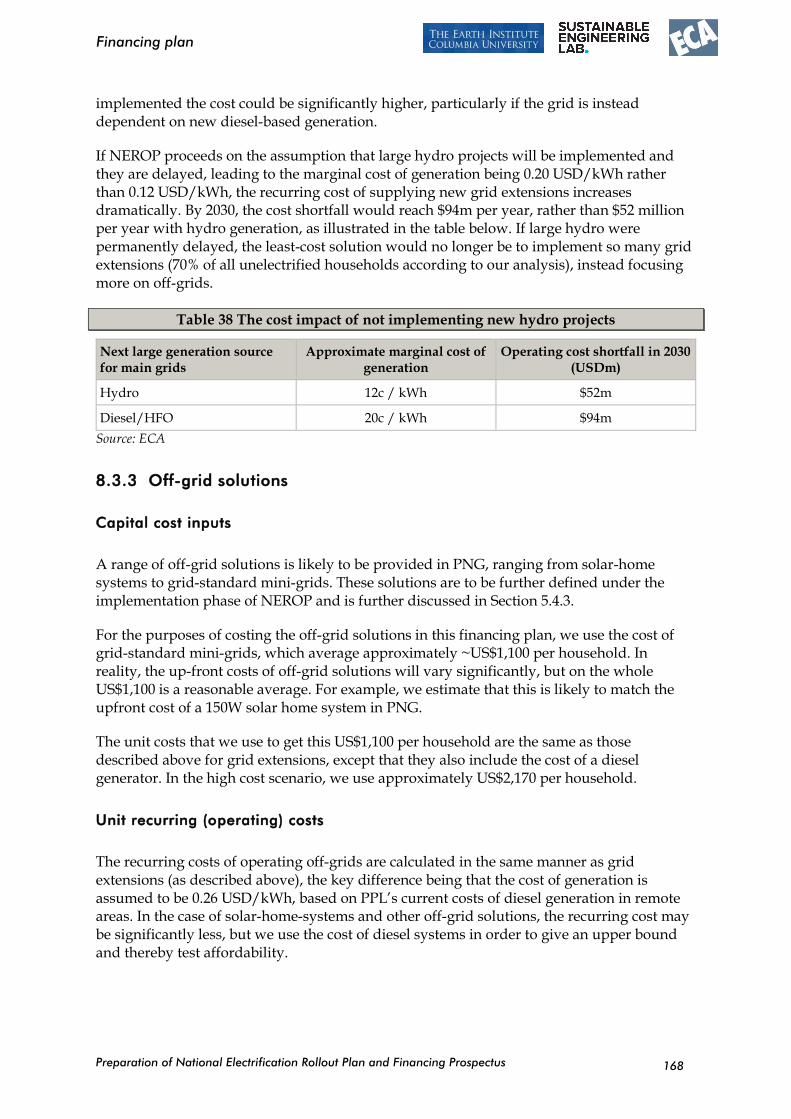
Preparation of National Electrification Rollout Plan and Financing Prospectus
Financing plan
168
implemented the cost could be significantly higher, particularly if the grid is instead dependent on new diesel-based generation.
If NEROP proceeds on the assumption that large hydro projects will be implemented and they are delayed, leading to the marginal cost of generation being 0.20 USD/kWh rather than 0.12 USD/kWh, the recurring cost of supplying new grid extensions increases dramatically. By 2030, the cost shortfall would reach $94m per year, rather than $52 million per year with hydro generation, as illustrated in the table below. If large hydro were permanently delayed, the least-cost solution would no longer be to implement so many grid extensions (70% of all unelectrified households according to our analysis), instead focusing more on off-grids.
Table 38 The cost impact of not implementing new hydro projects
Next large generation source for main grids
Approximate marginal cost of generation
Operating cost shortfall in 2030 (USDm)
Hydro 12c / kWh $52m
Diesel/HFO 20c / kWh $94m
Source: ECA
8.3.3 Off-grid solutions
Capital cost inputs
A range of off-grid solutions is likely to be provided in PNG, ranging from solar-home systems to grid-standard mini-grids. These solutions are to be further defined under the implementation phase of NEROP and is further discussed in Section 5.4.3.
For the purposes of costing the off-grid solutions in this financing plan, we use the cost of grid-standard mini-grids, which average approximately ~US$1,100 per household. In reality, the up-front costs of off-grid solutions will vary significantly, but on the whole US$1,100 is a reasonable average. For example, we estimate that this is likely to match the upfront cost of a 150W solar home system in PNG.
The unit costs that we use to get this US$1,100 per household are the same as those described above for grid extensions, except that they also include the cost of a diesel generator. In the high cost scenario, we use approximately US$2,170 per household.
Unit recurring (operating) costs
The recurring costs of operating off-grids are calculated in the same manner as grid extensions (as described above), the key difference being that the cost of generation is assumed to be 0.26 USD/kWh, based on PPL’s current costs of diesel generation in remote areas. In the case of solar-home-systems and other off-grid solutions, the recurring cost may be significantly less, but we use the cost of diesel systems in order to give an upper bound and thereby test affordability.
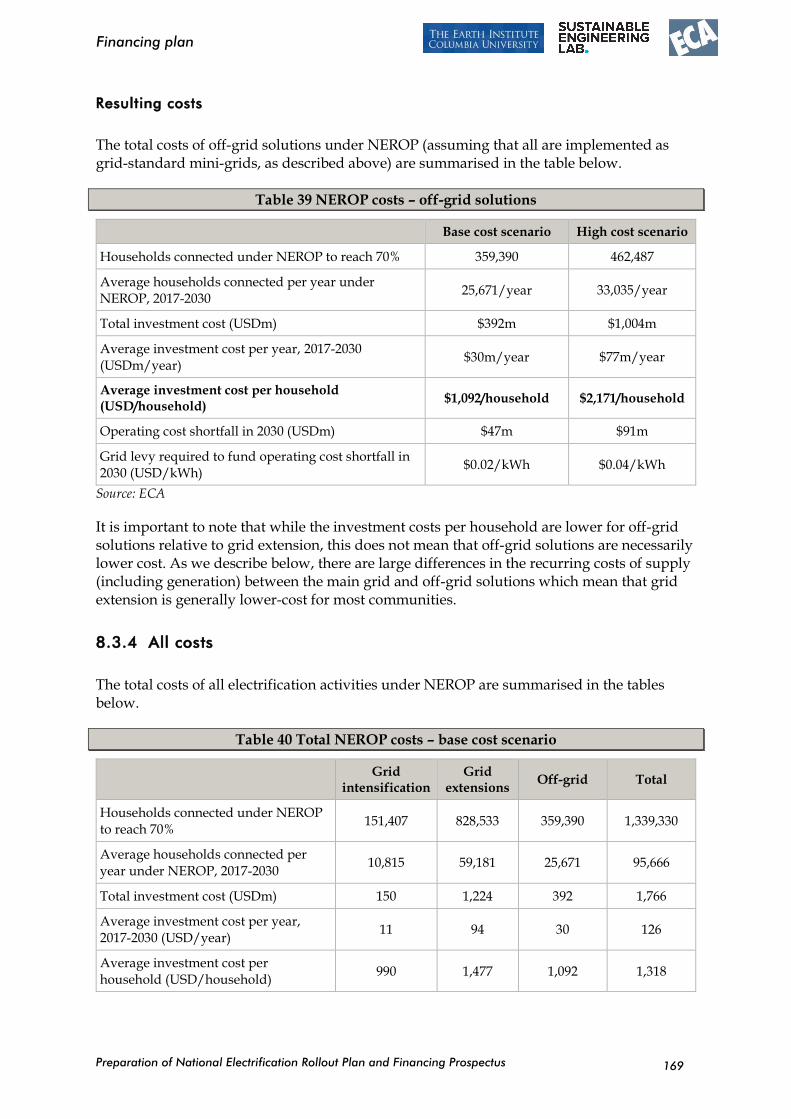
Preparation of National Electrification Rollout Plan and Financing Prospectus
Financing plan
169
Resulting costs
The total costs of off-grid solutions under NEROP (assuming that all are implemented as grid-standard mini-grids, as described above) are summarised in the table below.
Table 39 NEROP costs – off-grid solutions
Base cost scenario High cost scenario
Households connected under NEROP to reach 70% 359,390 462,487
Average households connected per year under NEROP, 2017-2030
25,671/year 33,035/year
Total investment cost (USDm) $392m $1,004m
Average investment cost per year, 2017-2030 (USDm/year)
$30m/year $77m/year
Average investment cost per household (USD/household)
$1,092/household $2,171/household
Operating cost shortfall in 2030 (USDm) $47m $91m
Grid levy required to fund operating cost shortfall in 2030 (USD/kWh)
$0.02/kWh $0.04/kWh
Source: ECA
It is important to note that while the investment costs per household are lower for off-grid solutions relative to grid extension, this does not mean that off-grid solutions are necessarily lower cost. As we describe below, there are large differences in the recurring costs of supply (including generation) between the main grid and off-grid solutions which mean that grid extension is generally lower-cost for most communities.
8.3.4 All costs
The total costs of all electrification activities under NEROP are summarised in the tables below.
Table 40 Total NEROP costs – base cost scenario
Grid intensification
Grid extensions
Off-grid Total
Households connected under NEROP to reach 70%
151,407 828,533 359,390 1,339,330
Average households connected per year under NEROP, 2017-2030
10,815 59,181 25,671 95,666
Total investment cost (USDm) 150 1,224 392 1,766
Average investment cost per year, 2017-2030 (USD/year)
11 94 30 126
Average investment cost per household (USD/household)
990 1,477 1,092 1,318
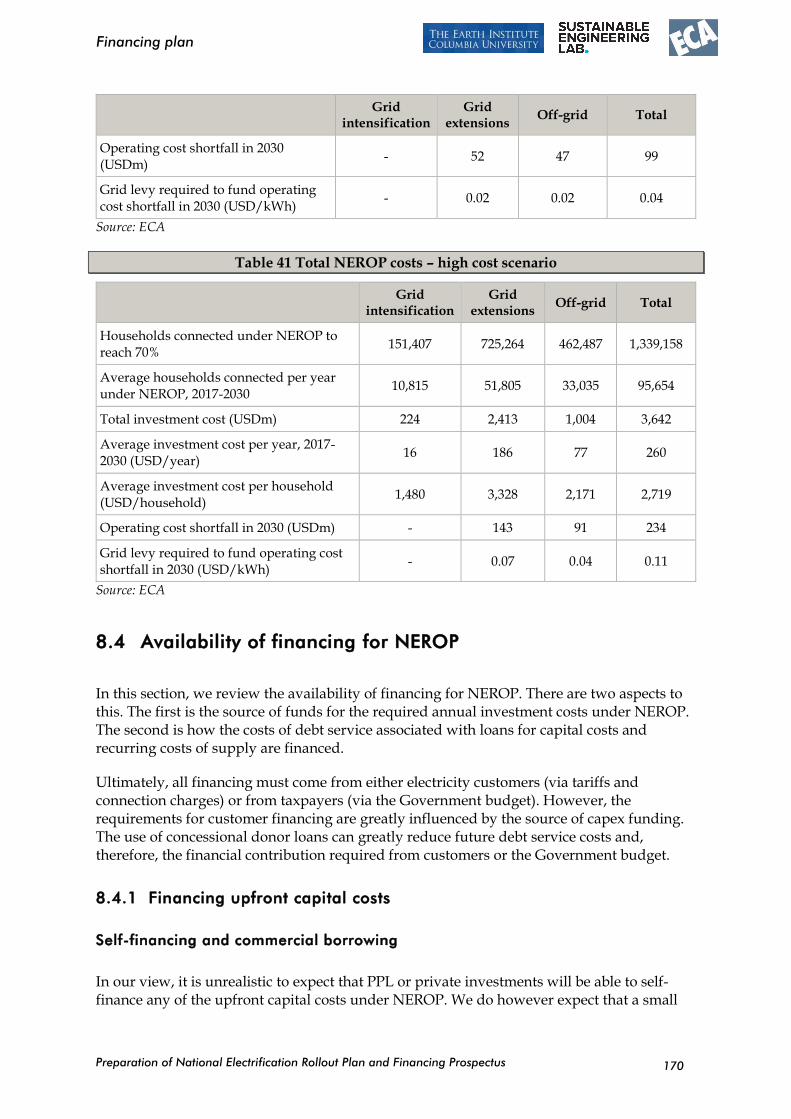
Preparation of National Electrification Rollout Plan and Financing Prospectus
Financing plan
170
Grid intensification
Grid extensions
Off-grid Total
Operating cost shortfall in 2030 (USDm)
- 52 47 99
Grid levy required to fund operating cost shortfall in 2030 (USD/kWh)
- 0.02 0.02 0.04
Source: ECA
Table 41 Total NEROP costs – high cost scenario
Grid intensification
Grid extensions
Off-grid Total
Households connected under NEROP to reach 70%
151,407 725,264 462,487 1,339,158
Average households connected per year under NEROP, 2017-2030
10,815 51,805 33,035 95,654
Total investment cost (USDm) 224 2,413 1,004 3,642
Average investment cost per year, 2017-2030 (USD/year)
16 186 77 260
Average investment cost per household (USD/household)
1,480 3,328 2,171 2,719
Operating cost shortfall in 2030 (USDm) - 143 91 234
Grid levy required to fund operating cost shortfall in 2030 (USD/kWh)
- 0.07 0.04 0.11
Source: ECA
8.4 Availability of financing for NEROP
In this section, we review the availability of financing for NEROP. There are two aspects to this. The first is the source of funds for the required annual investment costs under NEROP. The second is how the costs of debt service associated with loans for capital costs and recurring costs of supply are financed.
Ultimately, all financing must come from either electricity customers (via tariffs and connection charges) or from taxpayers (via the Government budget). However, the requirements for customer financing are greatly influenced by the source of capex funding. The use of concessional donor loans can greatly reduce future debt service costs and, therefore, the financial contribution required from customers or the Government budget.
8.4.1 Financing upfront capital costs
Self-financing and commercial borrowing
In our view, it is unrealistic to expect that PPL or private investments will be able to self-finance any of the upfront capital costs under NEROP. We do however expect that a small
Preparation of National Electrification Rollout Plan and Financing Prospectus
Financing plan
171
amount can be covered by connection charges, which will be subsidised significantly to encourage households connect.
PPL follows the National Planning and Development criteria for public sector investment by adopting a policy that only projects which provide a financial internal rate of return of a minimum of 10% are to proceed if financed from PPL’s own cash flows and from commercial borrowing. Where this criterion is not met but a wider socio-economic analysis indicates it will meet a 10% threshold for an economic internal rate of return, a subsidy may (in theory) be applied for from central Government. The threshold can be reduced where PPL is able to access concessional financing.
PPL is currently facing financial difficulties and challenges just to meet the demands related to its existing operations. With its borrowing capacity strained, there is doubt over whether in practice PPL is even able to undertake investments which meet its IRR threshold. Most electrification projects do not achieve the required rate of return due to the inability of consumers to pay the required tariffs. Therefore, PPL would not be able to proceed with these even if it could access commercial funding.
In section 5, we recommend that the private sector should be eligible to develop off-grid solutions in line with the Electricity Industry Policy. However, it is also unlikely that these will be able to make any substantial contribution to capital costs of these off-grid solutions. The projected off-grid solutions are expected to be too small to interest international commercial investors. There is little or no experience in PNG of lending on a project cash flow basis. Therefore, local commercial banks can be expected to only advance short-term loans secured against assets such as property. This will effectively restrict funding of capital expenditures by private investors to their existing cash and whatever can be raised by loans against existing assets.
We assume that on average households will contribute US$150 to the cost of connection. Households will not be asked to pay this upfront, but rather through a series of instalments (for example payments of US$10 per month for 3 years).
Government budget
As noted above the Government of PNG has a policy to subsidise capital expenditures associated with electrification where a project is not deemed to be financially attractive but offers significant socio-economic benefits. However, this policy is currently ineffective due to funding shortages.
Potential sources of Government funds for NEROP include:
Central Government grants to the power sector over the next four years average about US$5 million (15 million Kina) per year (as per the National Budget 2016-2020). Only a small share of this is specifically for electrification activities.
Local Government grants, via the Support Investment Program (SIP) funds, is also significant. 30% of SIP funds are earmarked for infrastructure. Assuming that 20% of this infrastructure funding were made available for electrification activities under NEROP, this amounts to approximately US$22 million (68 million Kina) per year (as per the National Budget 2016-2020).
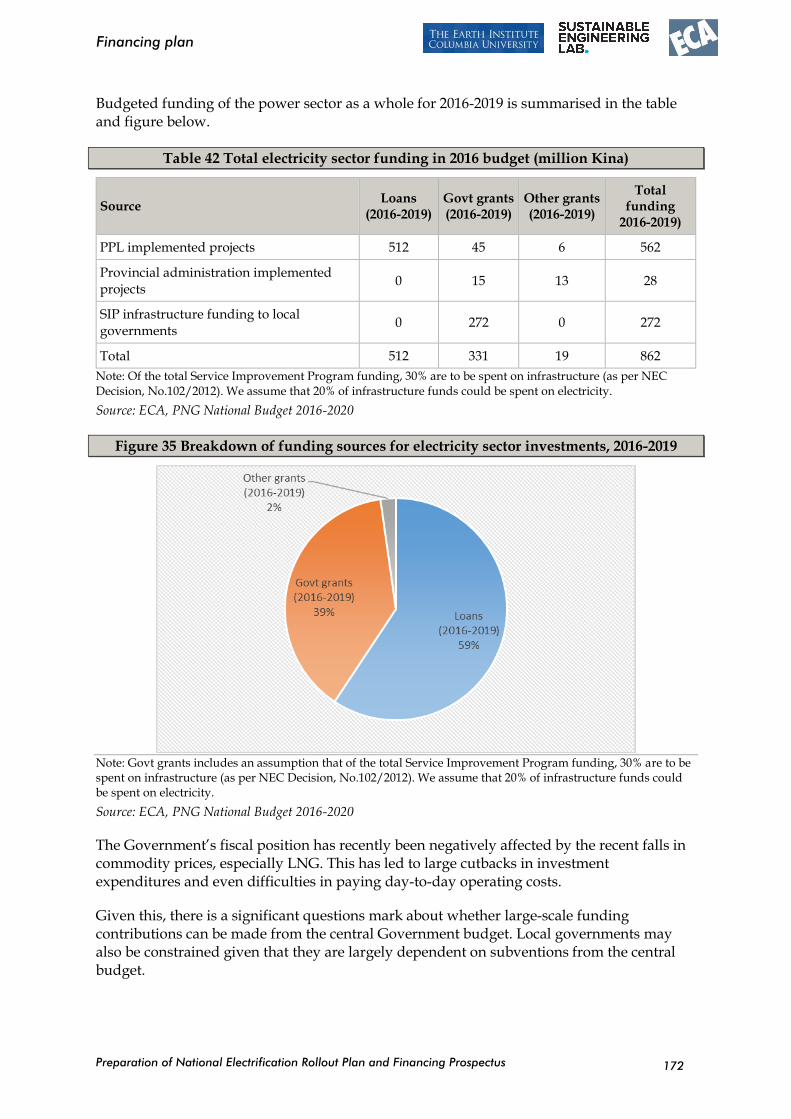
Preparation of National Electrification Rollout Plan and Financing Prospectus
Financing plan
172
Budgeted funding of the power sector as a whole for 2016-2019 is summarised in the table and figure below.
Table 42 Total electricity sector funding in 2016 budget (million Kina)
Source Loans
(2016-2019) Govt grants (2016-2019)
Other grants (2016-2019)
Total funding
2016-2019)
PPL implemented projects 512 45 6 562
Provincial administration implemented projects
0 15 13 28
SIP infrastructure funding to local governments
0 272 0 272
Total 512 331 19 862
Note: Of the total Service Improvement Program funding, 30% are to be spent on infrastructure (as per NEC Decision, No.102/2012). We assume that 20% of infrastructure funds could be spent on electricity.
Source: ECA, PNG National Budget 2016-2020
Figure 35 Breakdown of funding sources for electricity sector investments, 2016-2019
Note: Govt grants includes an assumption that of the total Service Improvement Program funding, 30% are to be spent on infrastructure (as per NEC Decision, No.102/2012). We assume that 20% of infrastructure funds could be spent on electricity.
Source: ECA, PNG National Budget 2016-2020
The Government’s fiscal position has recently been negatively affected by the recent falls in commodity prices, especially LNG. This has led to large cutbacks in investment expenditures and even difficulties in paying day-to-day operating costs.
Given this, there is a significant questions mark about whether large-scale funding contributions can be made from the central Government budget. Local governments may also be constrained given that they are largely dependent on subventions from the central budget.
Preparation of National Electrification Rollout Plan and Financing Prospectus
Financing plan
173
Additionally, amendments to the Administrative Guidelines of the SIPs may be necessary before they can be used to fund projects that are implemented by a central agency (such as the proposed OGEA), as discussed in Section 6.2.
Multilateral financing institutions and donors
PNG’s development partners have been and remain heavily committed to expanding electricity access. We expect that this will be the main source of investment funds for NEROP.
The level of available financing is obviously uncertain. In its PNG Country Operation Business Plan (COBP) for 2016-2018, the ADB allocates USD 122.7 million (20% of its total COBP forecasted financing) to improving energy access to a more reliable and affordable energy supply or around USD 40 million annually. The National Distribution Grid Expansion Plan, prepared with ADB support, envisages an investment programme of approximately USD 1.2 billion between 2017 and 2031 or approximately USD 80 million per year. Given ADB’s support to the development of this plan, this might be taken as an indication of expected future contributions. Therefore, we expect that ADB financing may contribute between USD 40 million and USD 80 million per year to NEROP.
The World Bank group has similarly recognised the need for supporting electrification efforts in its Country Partnership Strategy for 2013-2016. While not explicitly allocating financing for investing in extending distribution networks, this document earmarked a total approximately USD 400 million of indicative financing over the four-year period with USD 40 million allocated to renewable energy investments and a further USD 138 million allocated to infrastructure investment or guarantees.
The other main development partner that is active in the electricity sector in PNG is NZAID, although its budget is significantly smaller.
It is unrealistic to expect that development partners will be willing to finance 100% of NEROP’s investment costs. It is our understanding from discussions with development partners in PNG that multilateral financing institutions such as the World Bank and ADB are likely to require at least a 20% contribution to total investment costs by the Government (the contribution is closer to 30% when including contribution from customers in the form of connection charges). In our experience from other electrification programs, this is about the minimum that development partners are likely to accept.
We provide a detailed plan of financing, including providing a break down by source (i.e. connection charge revenues, Government, and development partner loans) in Section 8.5.
8.4.2 Financing recurring costs
We assume that the recurring costs (including debt servicing) associated with NEROP are entirely financed from customers via tariffs. This is discussed in more detail Section 6.3.4 above.
We assess the ability of customer tariffs to fund these costs as follows:
Preparation of National Electrification Rollout Plan and Financing Prospectus
Financing plan
174
Determine the maximum affordable tariff: We estimate this as 1.19 K/kWh (0.38 USD/kWh) for off-grid solutions. The same affordable tariff is applied for both grid and off-grid connections. Our approach to estimating the affordable tariff is described in the box below.
Calculate the difference between revenues and costs: We calculate the difference between tariff revenues and the sum of debt service payments and recurring costs in each year. The difference is carried over to the grid levy (see below). For off-grid solutions, we assume that tariffs are set at the maximum affordable level (0.38 USD/kWh), given that in general most will not be able to cover costs even at this tariff. For grid extensions59, we assume tariffs are set at the average current household tariff of 0.71 K/kWh (0.23 USD/kWh). Because off-grid tariffs will not cover costs, the deficit adds to the required grid levy. In the case of grid extensions, some will cover costs at current tariffs, others not, with some and therefore some serve to decrease the required grid levy, while others add to it.
Calculate the grid levy required to make up the cost shortfall: We assume that, in the absence of Government budget subsidies, any shortfall between total costs (debt service plus recurring costs) and tariff revenues from customers electrified under NEROP must be recovered from a levy on grid-connected customers. For PPL grid-connected customers, this levy is implicit in the form of a uniform tariff which represents a cross-subsidy from existing urban customers to new higher-cost rural customers electrified under NEROP. For off-grid customers, this would be an explicit transfer with PPL charging a levy on grid-connected customers and channelling this via the OGEA to off-grid operators. The sum of the implicit and explicit grid levy is calculated by taking the total shortfall identified under the preceding steps and dividing by total grid-connected sales to both NEROP and non-NEROP customers.
Determine whether the grid levy makes grid tariffs unaffordable: Where the sum of the current tariff and levy exceeds the affordable tariff then the levy is inadequate to cover total costs of NEROP and the programme will need to be scaled-back. The available head-room for the levy is estimated at 0.48 K/kWh or 0.15 USD/kWh (an affordable tariff or 1.19 K/kWh less the average current tariff of 0.71 K/kWh).
Under our current estimates of NEROP costs, as shown in Section 8.5, this headroom is not exceeded and, therefore, there is no requirement for scaling-back of the programme due to concerns over affordability. This conclusion does depend on a levy or similar transfer mechanism from grid to off-grid customers being put in place and that grid tariffs are allowed to rise from current levels by the amounts required to subsidise NEROP.
Average recurring costs relative to tariffs are summarised in the figure below.
59 As described in Section 8.3.1, we do not include customers served through grid intensification in this calculation.
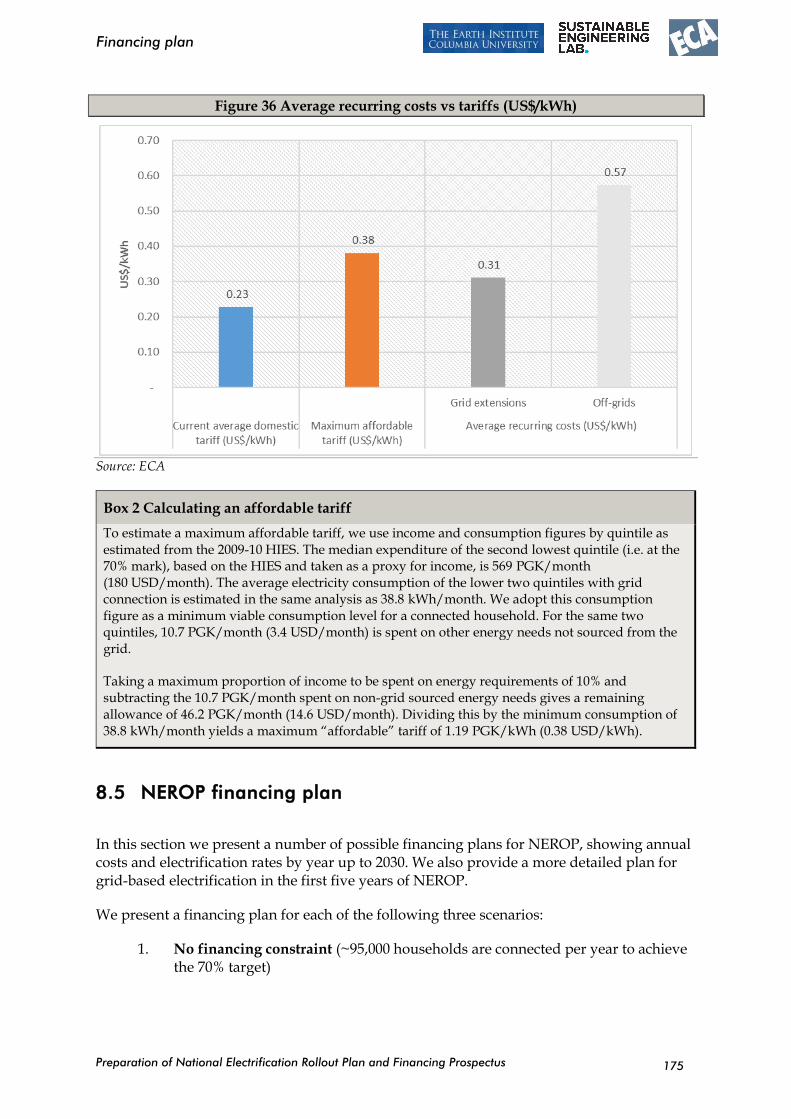
Preparation of National Electrification Rollout Plan and Financing Prospectus
Financing plan
175
Figure 36 Average recurring costs vs tariffs (US$/kWh)
Source: ECA
Box 2 Calculating an affordable tariff
To estimate a maximum affordable tariff, we use income and consumption figures by quintile as estimated from the 2009-10 HIES. The median expenditure of the second lowest quintile (i.e. at the 70% mark), based on the HIES and taken as a proxy for income, is 569 PGK/month (180 USD/month). The average electricity consumption of the lower two quintiles with grid connection is estimated in the same analysis as 38.8 kWh/month. We adopt this consumption figure as a minimum viable consumption level for a connected household. For the same two quintiles, 10.7 PGK/month (3.4 USD/month) is spent on other energy needs not sourced from the grid.
Taking a maximum proportion of income to be spent on energy requirements of 10% and subtracting the 10.7 PGK/month spent on non-grid sourced energy needs gives a remaining allowance of 46.2 PGK/month (14.6 USD/month). Dividing this by the minimum consumption of 38.8 kWh/month yields a maximum “affordable” tariff of 1.19 PGK/kWh (0.38 USD/kWh).
8.5 NEROP financing plan
In this section we present a number of possible financing plans for NEROP, showing annual costs and electrification rates by year up to 2030. We also provide a more detailed plan for grid-based electrification in the first five years of NEROP.
We present a financing plan for each of the following three scenarios:
1. No financing constraint (~95,000 households are connected per year to achieve the 70% target)
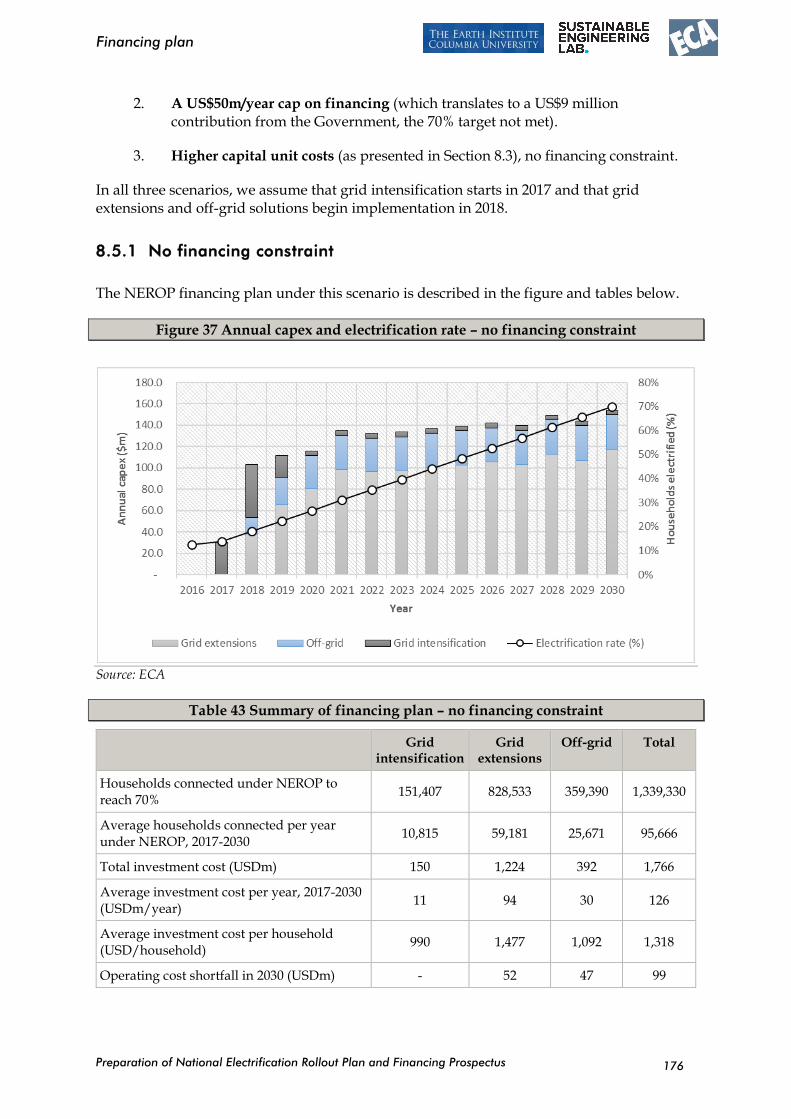
Preparation of National Electrification Rollout Plan and Financing Prospectus
Financing plan
176
2. A US$50m/year cap on financing (which translates to a US$9 million contribution from the Government, the 70% target not met).
3. Higher capital unit costs (as presented in Section 8.3), no financing constraint.
In all three scenarios, we assume that grid intensification starts in 2017 and that grid extensions and off-grid solutions begin implementation in 2018.
8.5.1 No financing constraint
The NEROP financing plan under this scenario is described in the figure and tables below.
Figure 37 Annual capex and electrification rate – no financing constraint
Source: ECA
Table 43 Summary of financing plan – no financing constraint
Grid intensification
Grid extensions
Off-grid Total
Households connected under NEROP to reach 70%
151,407 828,533 359,390 1,339,330
Average households connected per year under NEROP, 2017-2030
10,815 59,181 25,671 95,666
Total investment cost (USDm) 150 1,224 392 1,766
Average investment cost per year, 2017-2030 (USDm/year)
11 94 30 126
Average investment cost per household (USD/household)
990 1,477 1,092 1,318
Operating cost shortfall in 2030 (USDm) - 52 47 99
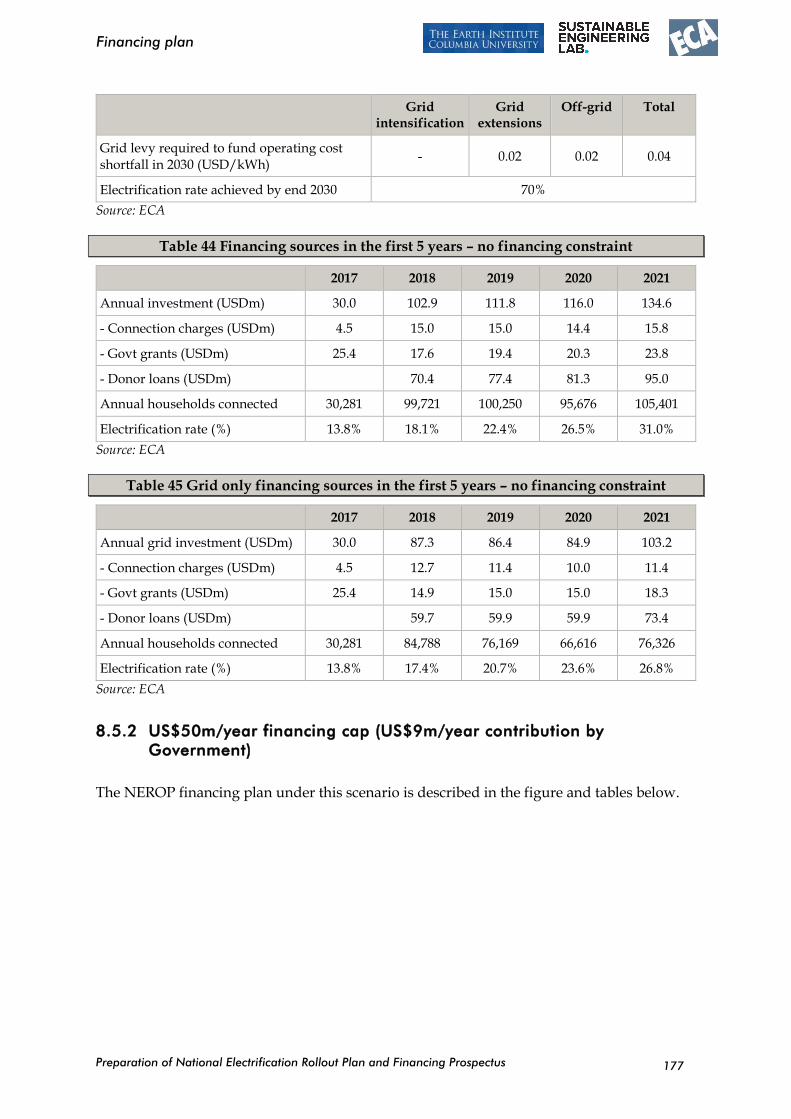
Preparation of National Electrification Rollout Plan and Financing Prospectus
Financing plan
177
Grid intensification
Grid extensions
Off-grid Total
Grid levy required to fund operating cost shortfall in 2030 (USD/kWh)
- 0.02 0.02 0.04
Electrification rate achieved by end 2030 70%
Source: ECA
Table 44 Financing sources in the first 5 years – no financing constraint
2017 2018 2019 2020 2021
Annual investment (USDm) 30.0 102.9 111.8 116.0 134.6
- Connection charges (USDm) 4.5 15.0 15.0 14.4 15.8
- Govt grants (USDm) 25.4 17.6 19.4 20.3 23.8
- Donor loans (USDm) 70.4 77.4 81.3 95.0
Annual households connected 30,281 99,721 100,250 95,676 105,401
Electrification rate (%) 13.8% 18.1% 22.4% 26.5% 31.0%
Source: ECA
Table 45 Grid only financing sources in the first 5 years – no financing constraint
2017 2018 2019 2020 2021
Annual grid investment (USDm) 30.0 87.3 86.4 84.9 103.2
- Connection charges (USDm) 4.5 12.7 11.4 10.0 11.4
- Govt grants (USDm) 25.4 14.9 15.0 15.0 18.3
- Donor loans (USDm) 59.7 59.9 59.9 73.4
Annual households connected 30,281 84,788 76,169 66,616 76,326
Electrification rate (%) 13.8% 17.4% 20.7% 23.6% 26.8%
Source: ECA
8.5.2 US$50m/year financing cap (US$9m/year contribution by
Government)
The NEROP financing plan under this scenario is described in the figure and tables below.
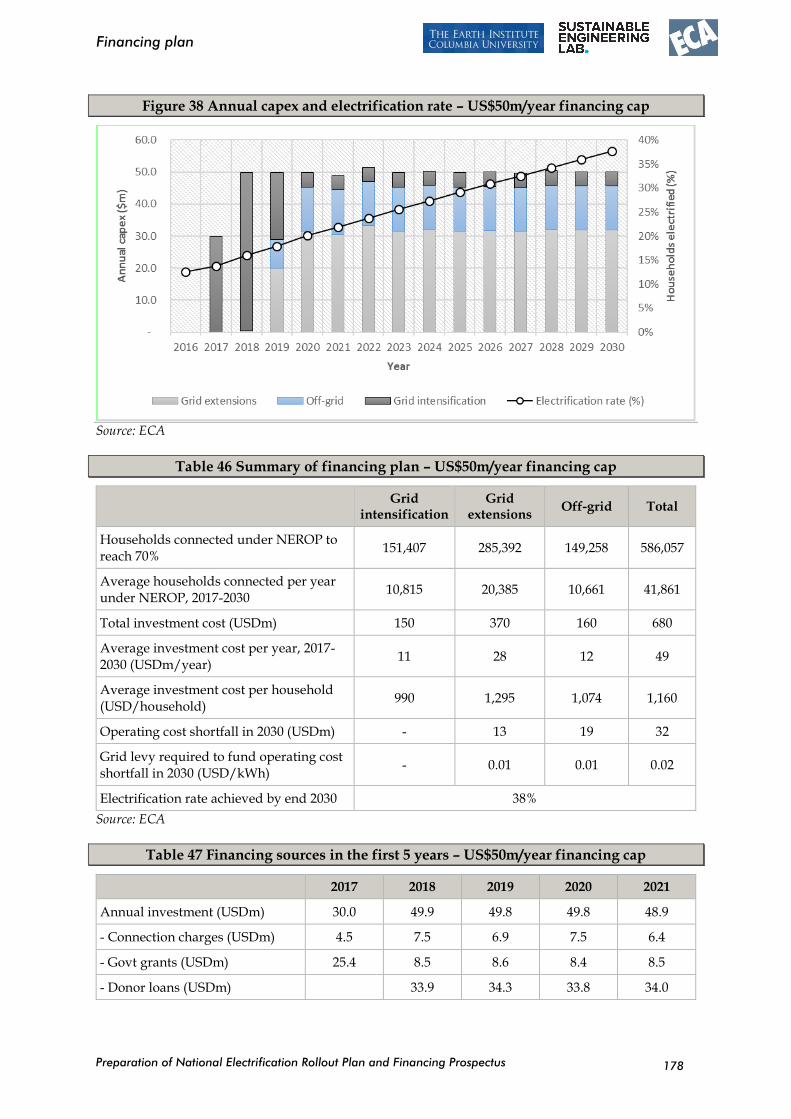
Preparation of National Electrification Rollout Plan and Financing Prospectus
Financing plan
178
Figure 38 Annual capex and electrification rate – US$50m/year financing cap
Source: ECA
Table 46 Summary of financing plan – US$50m/year financing cap
Grid intensification
Grid extensions
Off-grid Total
Households connected under NEROP to reach 70%
151,407 285,392 149,258 586,057
Average households connected per year under NEROP, 2017-2030
10,815 20,385 10,661 41,861
Total investment cost (USDm) 150 370 160 680
Average investment cost per year, 2017-2030 (USDm/year)
11 28 12 49
Average investment cost per household (USD/household)
990 1,295 1,074 1,160
Operating cost shortfall in 2030 (USDm) - 13 19 32
Grid levy required to fund operating cost shortfall in 2030 (USD/kWh)
- 0.01 0.01 0.02
Electrification rate achieved by end 2030 38%
Source: ECA
Table 47 Financing sources in the first 5 years – US$50m/year financing cap
2017 2018 2019 2020 2021
Annual investment (USDm) 30.0 49.9 49.8 49.8 48.9
- Connection charges (USDm) 4.5 7.5 6.9 7.5 6.4
- Govt grants (USDm) 25.4 8.5 8.6 8.4 8.5
- Donor loans (USDm) 33.9 34.3 33.8 34.0
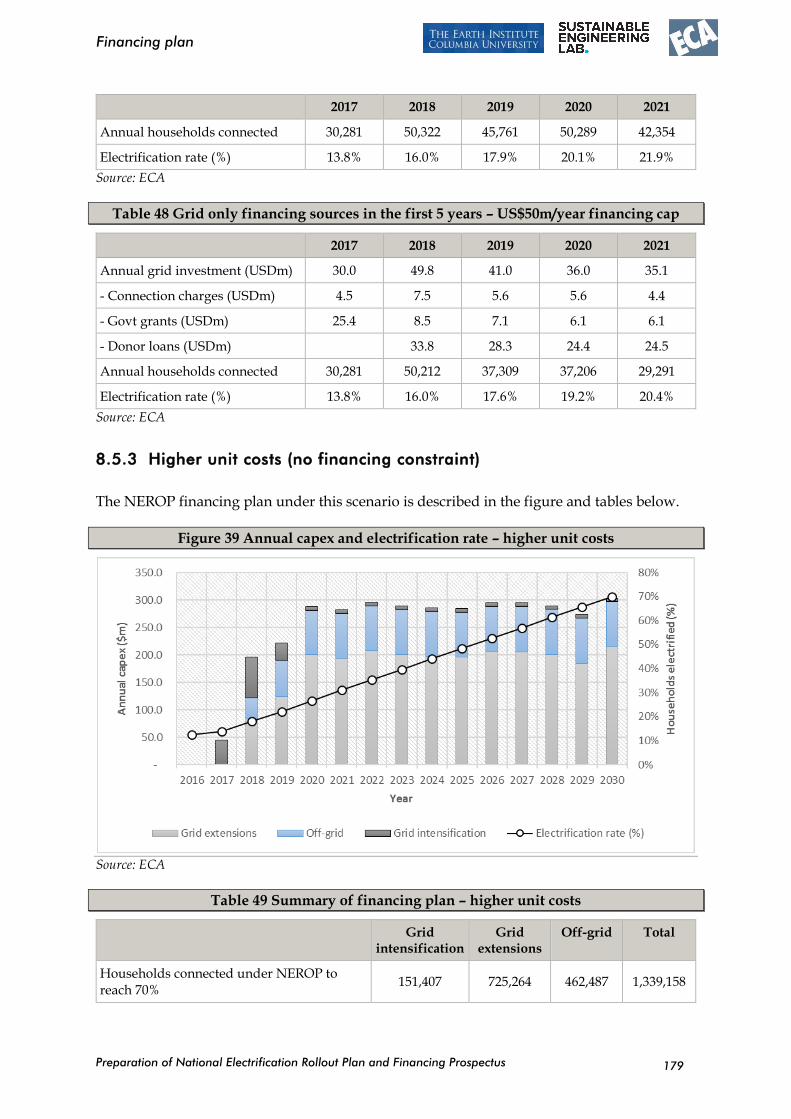
Preparation of National Electrification Rollout Plan and Financing Prospectus
Financing plan
179
2017 2018 2019 2020 2021
Annual households connected 30,281 50,322 45,761 50,289 42,354
Electrification rate (%) 13.8% 16.0% 17.9% 20.1% 21.9%
Source: ECA
Table 48 Grid only financing sources in the first 5 years – US$50m/year financing cap
2017 2018 2019 2020 2021
Annual grid investment (USDm) 30.0 49.8 41.0 36.0 35.1
- Connection charges (USDm) 4.5 7.5 5.6 5.6 4.4
- Govt grants (USDm) 25.4 8.5 7.1 6.1 6.1
- Donor loans (USDm) 33.8 28.3 24.4 24.5
Annual households connected 30,281 50,212 37,309 37,206 29,291
Electrification rate (%) 13.8% 16.0% 17.6% 19.2% 20.4%
Source: ECA
8.5.3 Higher unit costs (no financing constraint)
The NEROP financing plan under this scenario is described in the figure and tables below.
Figure 39 Annual capex and electrification rate – higher unit costs
Source: ECA
Table 49 Summary of financing plan – higher unit costs
Grid intensification
Grid extensions
Off-grid Total
Households connected under NEROP to reach 70%
151,407 725,264 462,487 1,339,158
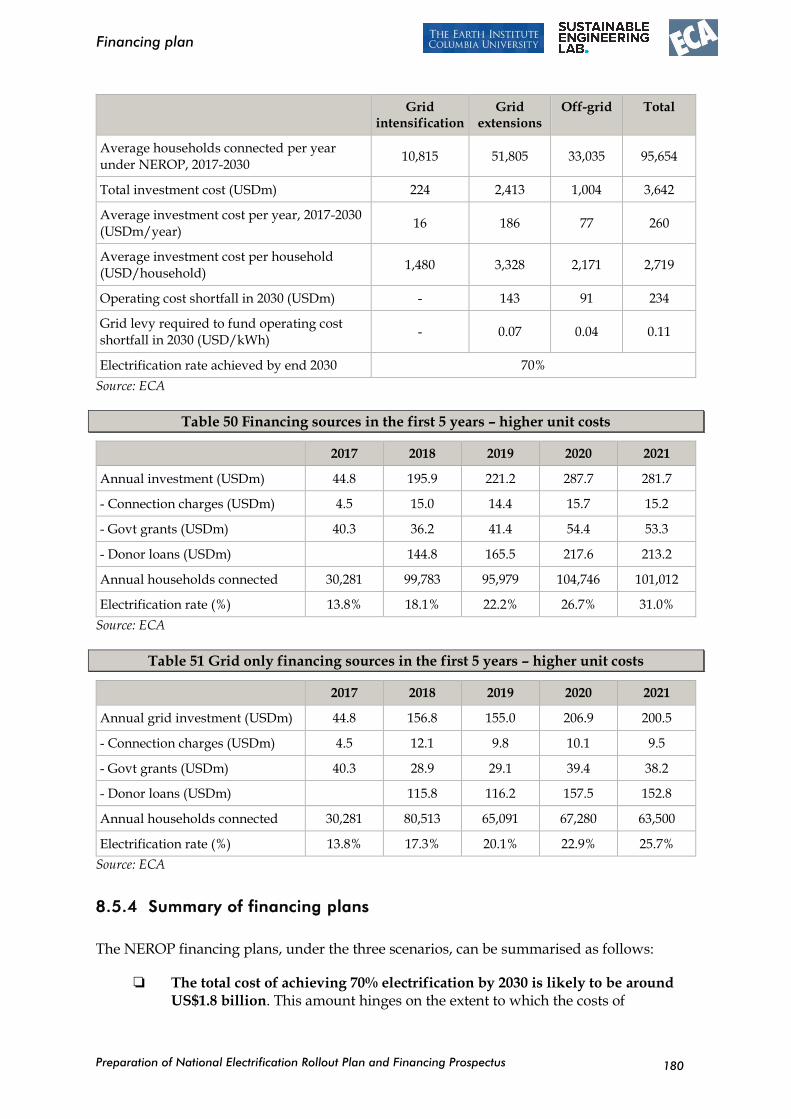
Preparation of National Electrification Rollout Plan and Financing Prospectus
Financing plan
180
Grid intensification
Grid extensions
Off-grid Total
Average households connected per year under NEROP, 2017-2030
10,815 51,805 33,035 95,654
Total investment cost (USDm) 224 2,413 1,004 3,642
Average investment cost per year, 2017-2030 (USDm/year)
16 186 77 260
Average investment cost per household (USD/household)
1,480 3,328 2,171 2,719
Operating cost shortfall in 2030 (USDm) - 143 91 234
Grid levy required to fund operating cost shortfall in 2030 (USD/kWh)
- 0.07 0.04 0.11
Electrification rate achieved by end 2030 70%
Source: ECA
Table 50 Financing sources in the first 5 years – higher unit costs
2017 2018 2019 2020 2021
Annual investment (USDm) 44.8 195.9 221.2 287.7 281.7
- Connection charges (USDm) 4.5 15.0 14.4 15.7 15.2
- Govt grants (USDm) 40.3 36.2 41.4 54.4 53.3
- Donor loans (USDm) 144.8 165.5 217.6 213.2
Annual households connected 30,281 99,783 95,979 104,746 101,012
Electrification rate (%) 13.8% 18.1% 22.2% 26.7% 31.0%
Source: ECA
Table 51 Grid only financing sources in the first 5 years – higher unit costs
2017 2018 2019 2020 2021
Annual grid investment (USDm) 44.8 156.8 155.0 206.9 200.5
- Connection charges (USDm) 4.5 12.1 9.8 10.1 9.5
- Govt grants (USDm) 40.3 28.9 29.1 39.4 38.2
- Donor loans (USDm) 115.8 116.2 157.5 152.8
Annual households connected 30,281 80,513 65,091 67,280 63,500
Electrification rate (%) 13.8% 17.3% 20.1% 22.9% 25.7%
Source: ECA
8.5.4 Summary of financing plans
The NEROP financing plans, under the three scenarios, can be summarised as follows:
The total cost of achieving 70% electrification by 2030 is likely to be around US$1.8 billion. This amount hinges on the extent to which the costs of
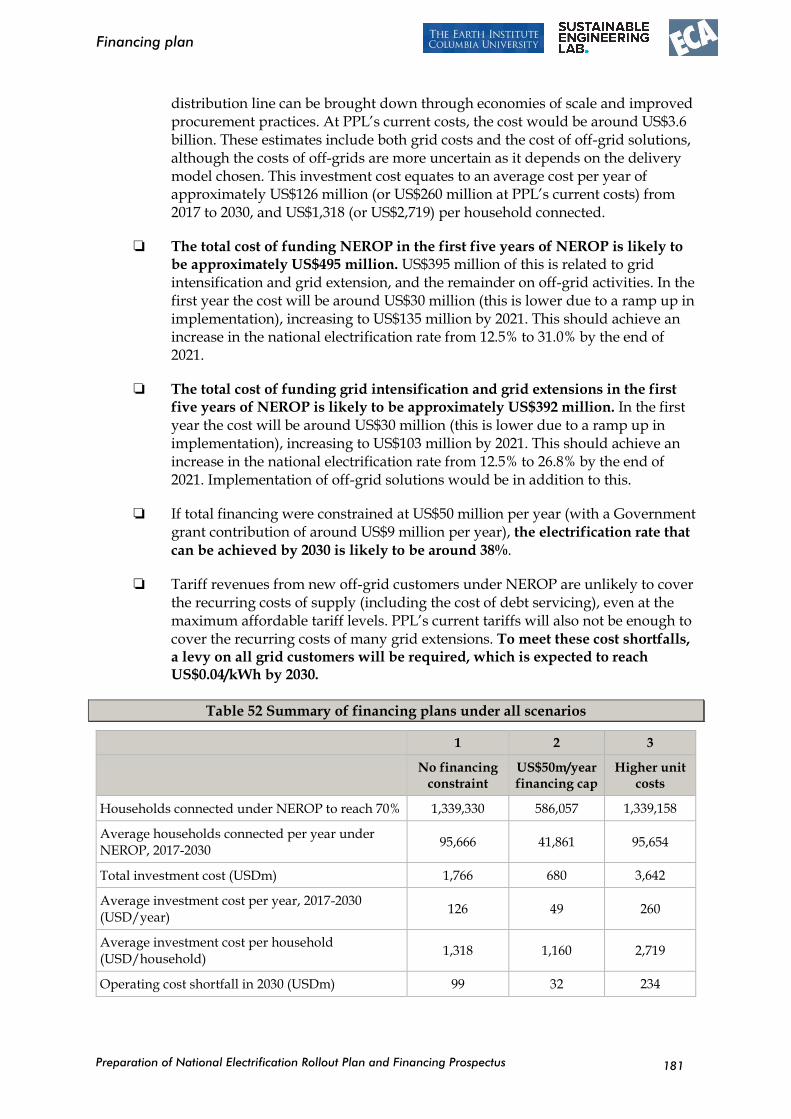
Preparation of National Electrification Rollout Plan and Financing Prospectus
Financing plan
181
distribution line can be brought down through economies of scale and improved procurement practices. At PPL’s current costs, the cost would be around US$3.6 billion. These estimates include both grid costs and the cost of off-grid solutions, although the costs of off-grids are more uncertain as it depends on the delivery model chosen. This investment cost equates to an average cost per year of approximately US$126 million (or US$260 million at PPL’s current costs) from 2017 to 2030, and US$1,318 (or US$2,719) per household connected.
The total cost of funding NEROP in the first five years of NEROP is likely to be approximately US$495 million. US$395 million of this is related to grid intensification and grid extension, and the remainder on off-grid activities. In the first year the cost will be around US$30 million (this is lower due to a ramp up in implementation), increasing to US$135 million by 2021. This should achieve an increase in the national electrification rate from 12.5% to 31.0% by the end of 2021.
The total cost of funding grid intensification and grid extensions in the first five years of NEROP is likely to be approximately US$392 million. In the first year the cost will be around US$30 million (this is lower due to a ramp up in implementation), increasing to US$103 million by 2021. This should achieve an increase in the national electrification rate from 12.5% to 26.8% by the end of 2021. Implementation of off-grid solutions would be in addition to this.
If total financing were constrained at US$50 million per year (with a Government grant contribution of around US$9 million per year), the electrification rate that
can be achieved by 2030 is likely to be around 38%.
Tariff revenues from new off-grid customers under NEROP are unlikely to cover the recurring costs of supply (including the cost of debt servicing), even at the maximum affordable tariff levels. PPL’s current tariffs will also not be enough to cover the recurring costs of many grid extensions. To meet these cost shortfalls, a levy on all grid customers will be required, which is expected to reach US$0.04/kWh by 2030.
Table 52 Summary of financing plans under all scenarios
1 2 3
No financing constraint
US$50m/year financing cap
Higher unit costs
Households connected under NEROP to reach 70% 1,339,330 586,057 1,339,158
Average households connected per year under NEROP, 2017-2030
95,666 41,861 95,654
Total investment cost (USDm) 1,766 680 3,642
Average investment cost per year, 2017-2030 (USD/year)
126 49 260
Average investment cost per household (USD/household)
1,318 1,160 2,719
Operating cost shortfall in 2030 (USDm) 99 32 234
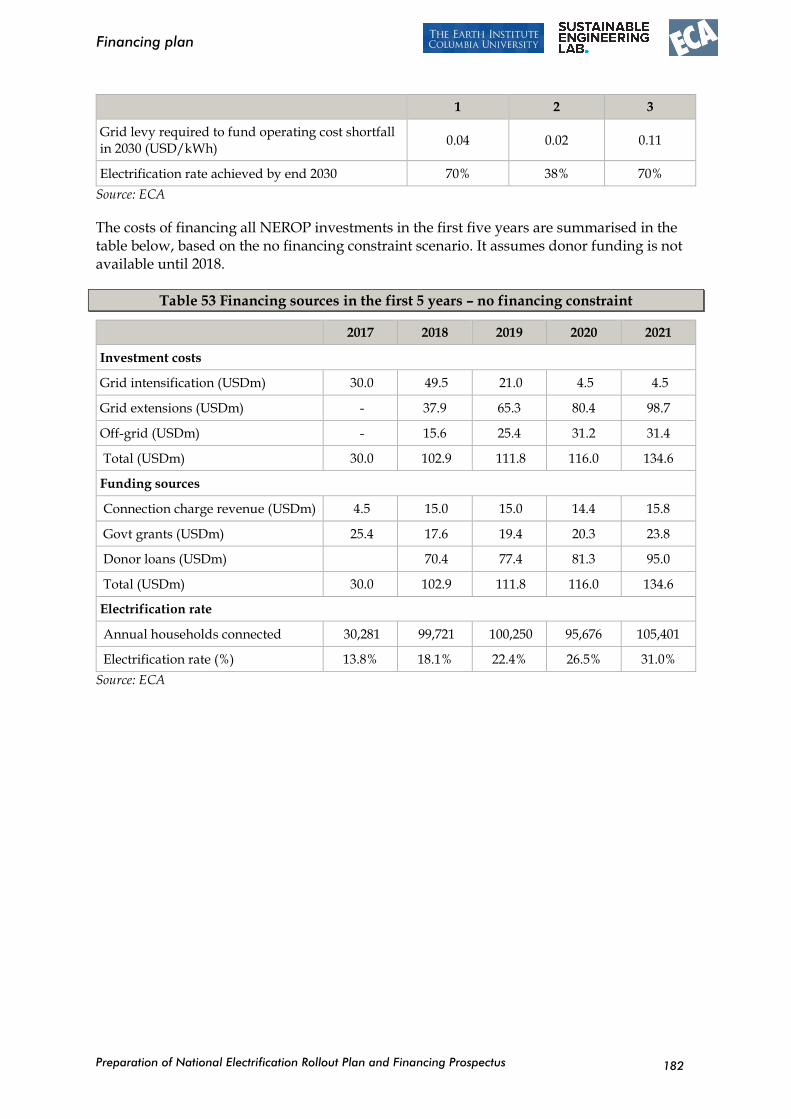
Preparation of National Electrification Rollout Plan and Financing Prospectus
Financing plan
182
1 2 3
Grid levy required to fund operating cost shortfall in 2030 (USD/kWh)
0.04 0.02 0.11
Electrification rate achieved by end 2030 70% 38% 70%
Source: ECA
The costs of financing all NEROP investments in the first five years are summarised in the table below, based on the no financing constraint scenario. It assumes donor funding is not available until 2018.
Table 53 Financing sources in the first 5 years – no financing constraint
2017 2018 2019 2020 2021
Investment costs
Grid intensification (USDm) 30.0 49.5 21.0 4.5 4.5
Grid extensions (USDm) - 37.9 65.3 80.4 98.7
Off-grid (USDm) - 15.6 25.4 31.2 31.4
Total (USDm) 30.0 102.9 111.8 116.0 134.6
Funding sources
Connection charge revenue (USDm) 4.5 15.0 15.0 14.4 15.8
Govt grants (USDm) 25.4 17.6 19.4 20.3 23.8
Donor loans (USDm) 70.4 77.4 81.3 95.0
Total (USDm) 30.0 102.9 111.8 116.0 134.6
Electrification rate
Annual households connected 30,281 99,721 100,250 95,676 105,401
Electrification rate (%) 13.8% 18.1% 22.4% 26.5% 31.0%
Source: ECA
Preparation of National Electrification Rollout Plan and Financing Prospectus
Annexes
183
ANNEXES
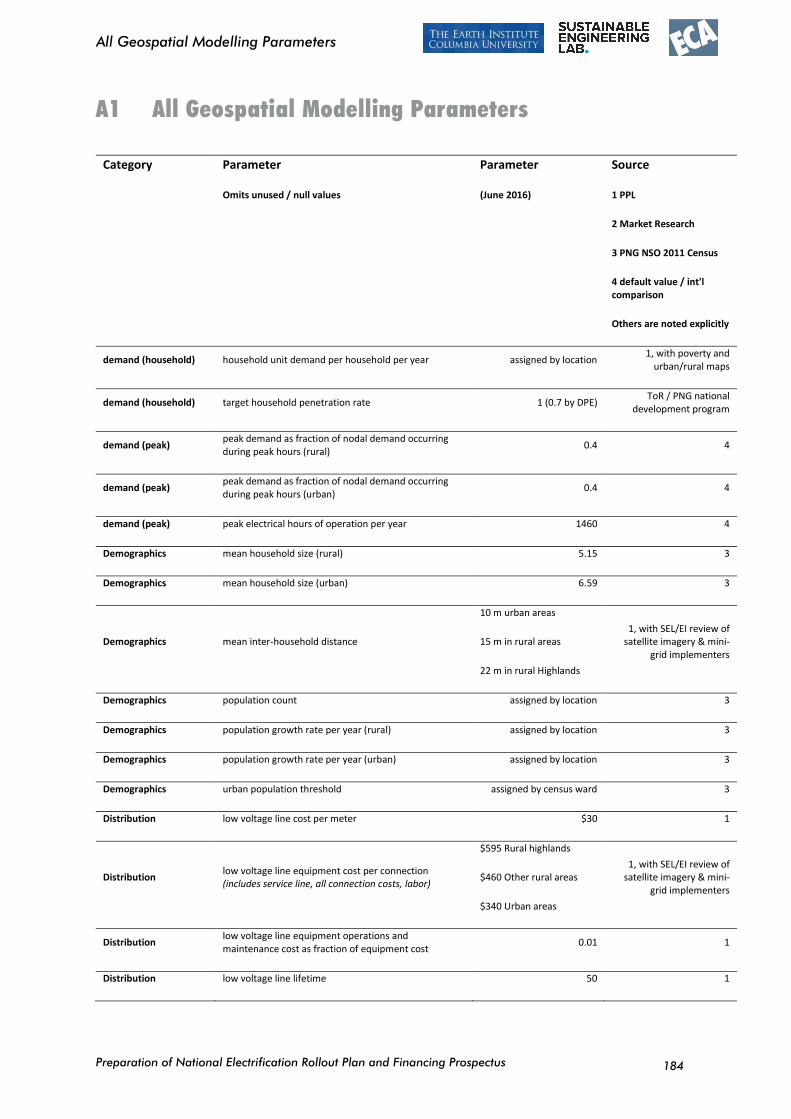
Preparation of National Electrification Rollout Plan and Financing Prospectus
All Geospatial Modelling Parameters
184
A1 All Geospatial Modelling Parameters
Category Parameter Parameter Source
Omits unused / null values (June 2016) 1 PPL
2 Market Research
3 PNG NSO 2011 Census
4 default value / int'l comparison
Others are noted explicitly
demand (household) household unit demand per household per year assigned by location 1, with poverty and
urban/rural maps
demand (household) target household penetration rate 1 (0.7 by DPE) ToR / PNG national
development program
demand (peak) peak demand as fraction of nodal demand occurring during peak hours (rural)
0.4 4
demand (peak) peak demand as fraction of nodal demand occurring during peak hours (urban)
0.4 4
demand (peak) peak electrical hours of operation per year 1460 4
Demographics mean household size (rural) 5.15 3
Demographics mean household size (urban) 6.59 3
Demographics mean inter-household distance
10 m urban areas
15 m in rural areas
22 m in rural Highlands
1, with SEL/EI review of satellite imagery & mini-
grid implementers
Demographics population count assigned by location 3
Demographics population growth rate per year (rural) assigned by location 3
Demographics population growth rate per year (urban) assigned by location 3
Demographics urban population threshold assigned by census ward 3
Distribution low voltage line cost per meter $30 1
Distribution low voltage line equipment cost per connection (includes service line, all connection costs, labor)
$595 Rural highlands
$460 Other rural areas
$340 Urban areas
1, with SEL/EI review of satellite imagery & mini-
grid implementers
Distribution low voltage line equipment operations and maintenance cost as fraction of equipment cost
0.01 1
Distribution low voltage line lifetime 50 1
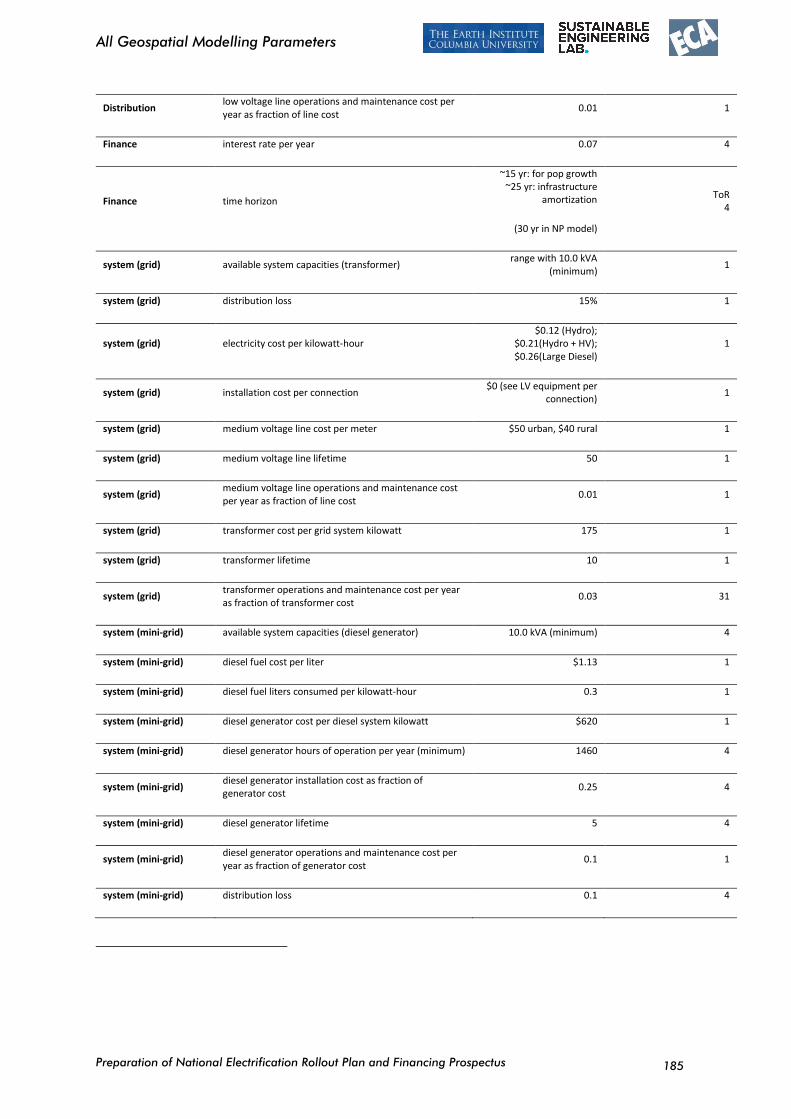
Preparation of National Electrification Rollout Plan and Financing Prospectus
All Geospatial Modelling Parameters
185
Distribution low voltage line operations and maintenance cost per year as fraction of line cost
0.01 1
Finance interest rate per year 0.07 4
Finance time horizon
~15 yr: for pop growth ~25 yr: infrastructure
amortization
(30 yr in NP model)
ToR 4
system (grid) available system capacities (transformer) range with 10.0 kVA
(minimum) 1
system (grid) distribution loss 15% 1
system (grid) electricity cost per kilowatt-hour $0.12 (Hydro);
$0.21(Hydro + HV); $0.26(Large Diesel)
1
system (grid) installation cost per connection $0 (see LV equipment per
connection) 1
system (grid) medium voltage line cost per meter $50 urban, $40 rural 1
system (grid) medium voltage line lifetime 50 1
system (grid) medium voltage line operations and maintenance cost per year as fraction of line cost
0.01 1
system (grid) transformer cost per grid system kilowatt 175 1
system (grid) transformer lifetime 10 1
system (grid) transformer operations and maintenance cost per year as fraction of transformer cost
0.03 31
system (mini-grid) available system capacities (diesel generator) 10.0 kVA (minimum) 4
system (mini-grid) diesel fuel cost per liter $1.13 1
system (mini-grid) diesel fuel liters consumed per kilowatt-hour 0.3 1
system (mini-grid) diesel generator cost per diesel system kilowatt $620 1
system (mini-grid) diesel generator hours of operation per year (minimum) 1460 4
system (mini-grid) diesel generator installation cost as fraction of generator cost
0.25 4
system (mini-grid) diesel generator lifetime 5 4
system (mini-grid) diesel generator operations and maintenance cost per year as fraction of generator cost
0.1 1
system (mini-grid) distribution loss 0.1 4
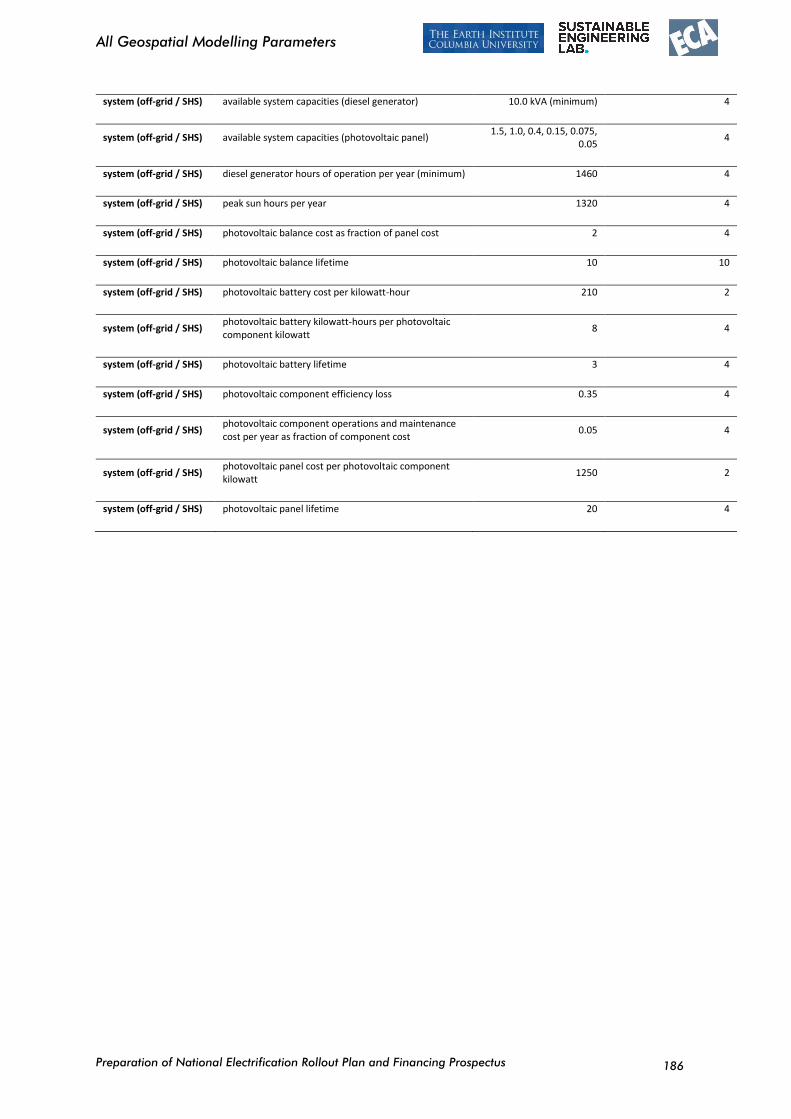
Preparation of National Electrification Rollout Plan and Financing Prospectus
All Geospatial Modelling Parameters
186
system (off-grid / SHS) available system capacities (diesel generator) 10.0 kVA (minimum) 4
system (off-grid / SHS) available system capacities (photovoltaic panel) 1.5, 1.0, 0.4, 0.15, 0.075,
0.05 4
system (off-grid / SHS) diesel generator hours of operation per year (minimum) 1460 4
system (off-grid / SHS) peak sun hours per year 1320 4
system (off-grid / SHS) photovoltaic balance cost as fraction of panel cost 2 4
system (off-grid / SHS) photovoltaic balance lifetime 10 10
system (off-grid / SHS) photovoltaic battery cost per kilowatt-hour 210 2
system (off-grid / SHS) photovoltaic battery kilowatt-hours per photovoltaic component kilowatt
8 4
system (off-grid / SHS) photovoltaic battery lifetime 3 4
system (off-grid / SHS) photovoltaic component efficiency loss 0.35 4
system (off-grid / SHS) photovoltaic component operations and maintenance cost per year as fraction of component cost
0.05 4
system (off-grid / SHS) photovoltaic panel cost per photovoltaic component kilowatt
1250 2
system (off-grid / SHS) photovoltaic panel lifetime 20 4
Preparation of National Electrification Rollout Plan and Financing Prospectus
Assessment of Inter-Household Distance
187
A2 Assessment of Inter-Household Distance
The SEL analysis used freely available satellite imagery to assess distances between households and other structures and to estimate low voltage line requirements per connection. The survey covered 60 locations throughout all provinces, and employed three main techniques which were each performed for all locations:
Visually estimating the length of Open Wire and Aerial Bundled Cable (or service line) needed to reach all structures (“OW+ABC”)
Calculating the distance between households based on the visually estimated total area of the human settlement (“area-based”)
Linking all visible structures by a single line and calculating the average distance between them (“single wire”)
These methods employ a somewhat similar approach in that all propose a method for estimating some aggregate length or distance, then dividing this value by a number of connections to be made. A critical aspect of this investigation is that it is not generally feasible to make a highly accurate estimate of the number of households from satellite imagery. This is for a few reasons: the difficulty in distinguishing types of structures (e.g. food storage structures vs. homes vs. kitchens); the difficulty in assessing whether a structure is residential in any way, whether it is inhabited at all, and if so, by how many families. For this reason, the SEL/EI analysis used two numbers as a basis for estimating the number of connections that would be needed for a given locality: one key source of information is the number of households listed in the census data for that location (NSO, 2011 Census); the other was a visual count of structure (essentially rooftops) evident in the satellite imagery considered for this work. For this reason, data for distances between connections are reported in two ways: distances between households (when referring to census unit data) and distances between “structures” (when referring to the data produced by review of satellite imagery).
While it is understood that there are multiple sources of error in this approach – inaccuracies in the census data, out-of-date satellite imagery, differences in visual interpretation of imagery by varying individual reviewers, etc. – it is assumed that these errors will be minimized by the relatively large sample size (greater than 50 locations identified by random sample, from all provinces nationwide) and multi-reviewer approach (three SEL/EI employees undertook this review) used.
The three methods used for assessing distances between connections are described in more detail below with reference to a single sample rural community for illustrative purposes. This community has the following location details:
Census Unit Name: Agamtauip
Province: West Sepik (Sandaun) Province
District: Telefomin District
LLG: Telefomin Rural LLG
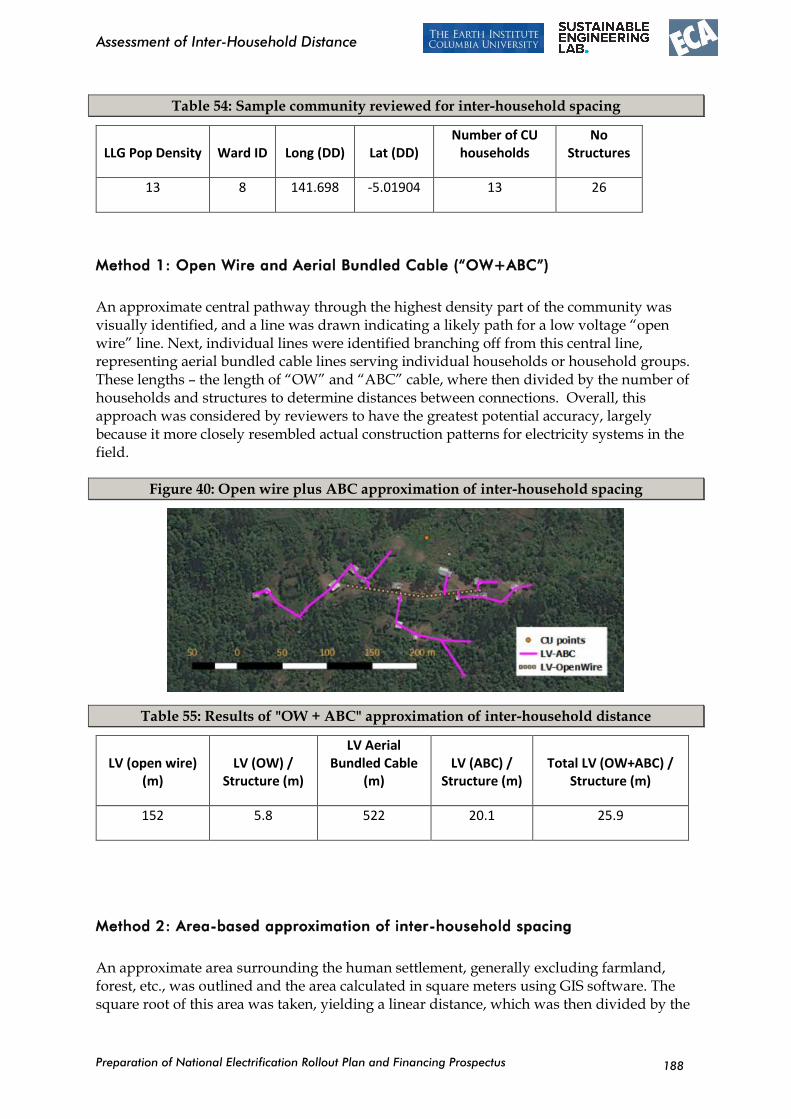
Preparation of National Electrification Rollout Plan and Financing Prospectus
Assessment of Inter-Household Distance
188
Table 54: Sample community reviewed for inter-household spacing
LLG Pop Density Ward ID Long (DD) Lat (DD) Number of CU
households No
Structures
13 8 141.698 -5.01904 13 26
Method 1: Open Wire and Aerial Bundled Cable (“OW+ABC”)
An approximate central pathway through the highest density part of the community was visually identified, and a line was drawn indicating a likely path for a low voltage “open wire” line. Next, individual lines were identified branching off from this central line, representing aerial bundled cable lines serving individual households or household groups. These lengths – the length of “OW” and “ABC” cable, where then divided by the number of households and structures to determine distances between connections. Overall, this approach was considered by reviewers to have the greatest potential accuracy, largely because it more closely resembled actual construction patterns for electricity systems in the field.
Figure 40: Open wire plus ABC approximation of inter-household spacing
Table 55: Results of "OW + ABC" approximation of inter-household distance
LV (open wire) (m)
LV (OW) / Structure (m)
LV Aerial Bundled Cable
(m) LV (ABC) /
Structure (m) Total LV (OW+ABC) /
Structure (m)
152 5.8 522 20.1 25.9
Method 2: Area-based approximation of inter-household spacing
An approximate area surrounding the human settlement, generally excluding farmland, forest, etc., was outlined and the area calculated in square meters using GIS software. The square root of this area was taken, yielding a linear distance, which was then divided by the
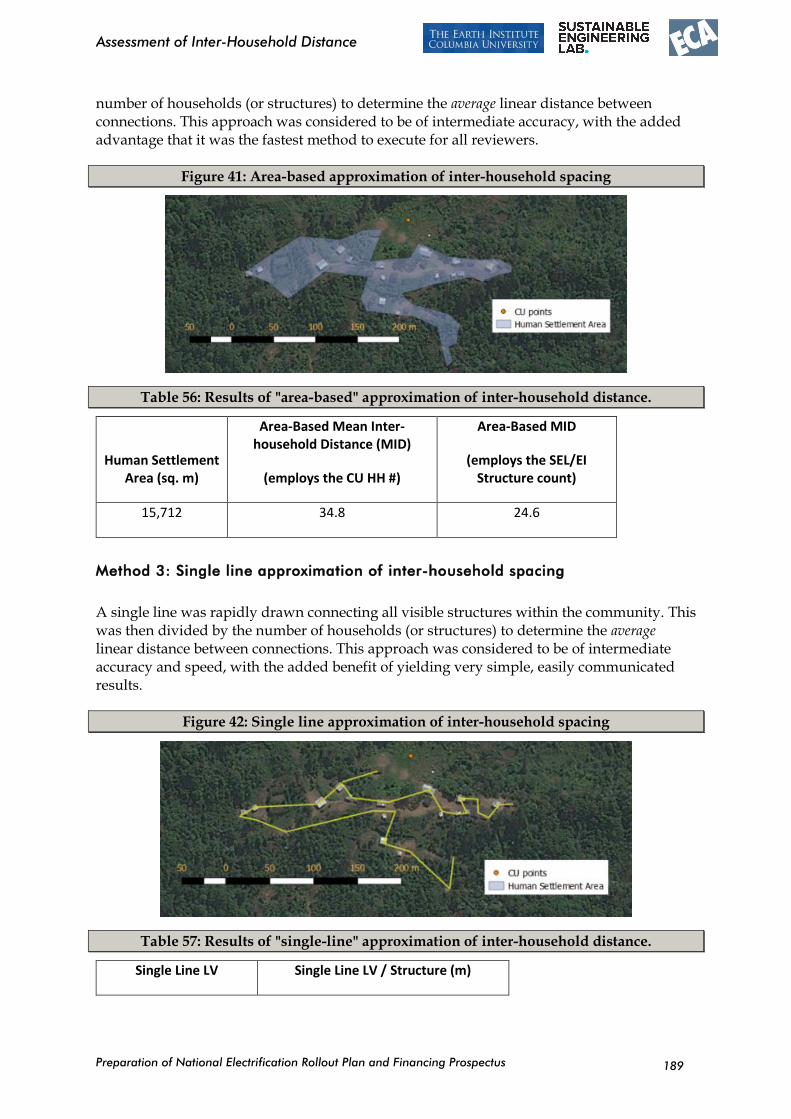
Preparation of National Electrification Rollout Plan and Financing Prospectus
Assessment of Inter-Household Distance
189
number of households (or structures) to determine the average linear distance between connections. This approach was considered to be of intermediate accuracy, with the added advantage that it was the fastest method to execute for all reviewers.
Figure 41: Area-based approximation of inter-household spacing
Table 56: Results of "area-based" approximation of inter-household distance.
Human Settlement Area (sq. m)
Area-Based Mean Inter-household Distance (MID)
(employs the CU HH #)
Area-Based MID
(employs the SEL/EI Structure count)
15,712 34.8 24.6
Method 3: Single line approximation of inter-household spacing
A single line was rapidly drawn connecting all visible structures within the community. This was then divided by the number of households (or structures) to determine the average linear distance between connections. This approach was considered to be of intermediate accuracy and speed, with the added benefit of yielding very simple, easily communicated results.
Figure 42: Single line approximation of inter-household spacing
Table 57: Results of "single-line" approximation of inter-household distance.
Single Line LV Single Line LV / Structure (m)
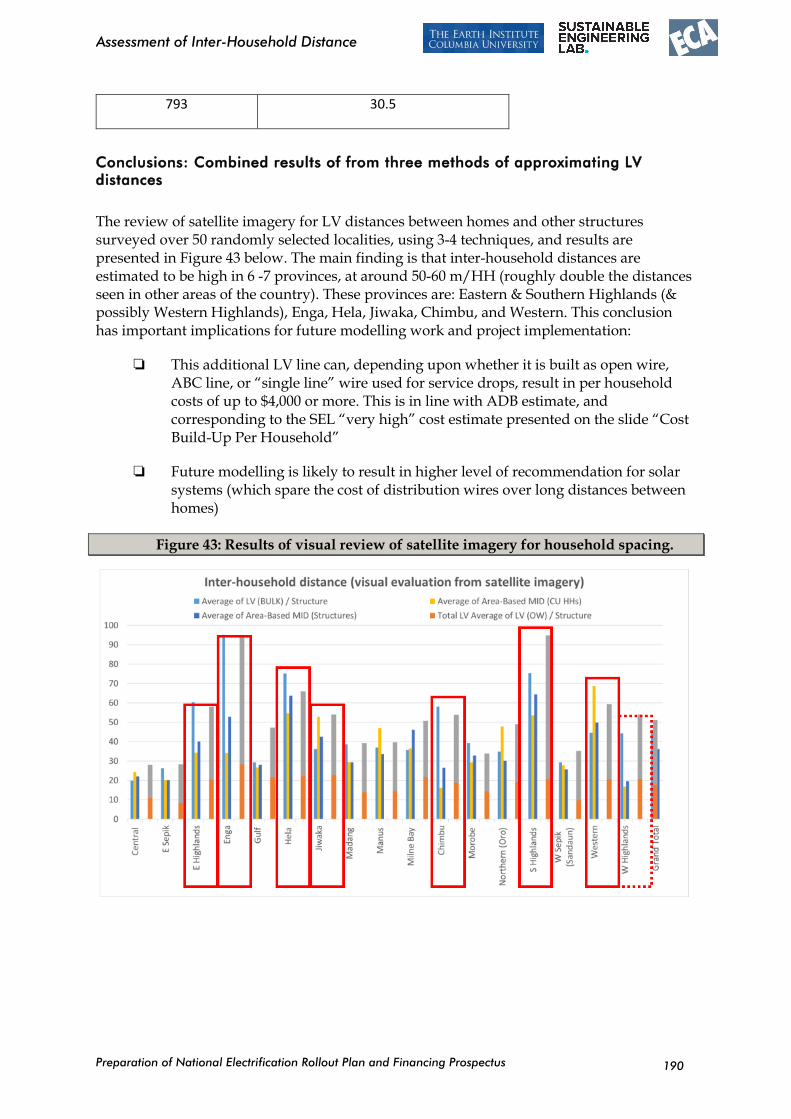
Preparation of National Electrification Rollout Plan and Financing Prospectus
Assessment of Inter-Household Distance
190
793 30.5
Conclusions: Combined results of from three methods of approximating LV
distances
The review of satellite imagery for LV distances between homes and other structures surveyed over 50 randomly selected localities, using 3-4 techniques, and results are presented in Figure 43 below. The main finding is that inter-household distances are estimated to be high in 6 -7 provinces, at around 50-60 m/HH (roughly double the distances seen in other areas of the country). These provinces are: Eastern & Southern Highlands (& possibly Western Highlands), Enga, Hela, Jiwaka, Chimbu, and Western. This conclusion has important implications for future modelling work and project implementation:
This additional LV line can, depending upon whether it is built as open wire, ABC line, or “single line” wire used for service drops, result in per household costs of up to $4,000 or more. This is in line with ADB estimate, and corresponding to the SEL “very high” cost estimate presented on the slide “Cost Build-Up Per Household”
Future modelling is likely to result in higher level of recommendation for solar systems (which spare the cost of distribution wires over long distances between homes)
Figure 43: Results of visual review of satellite imagery for household spacing.
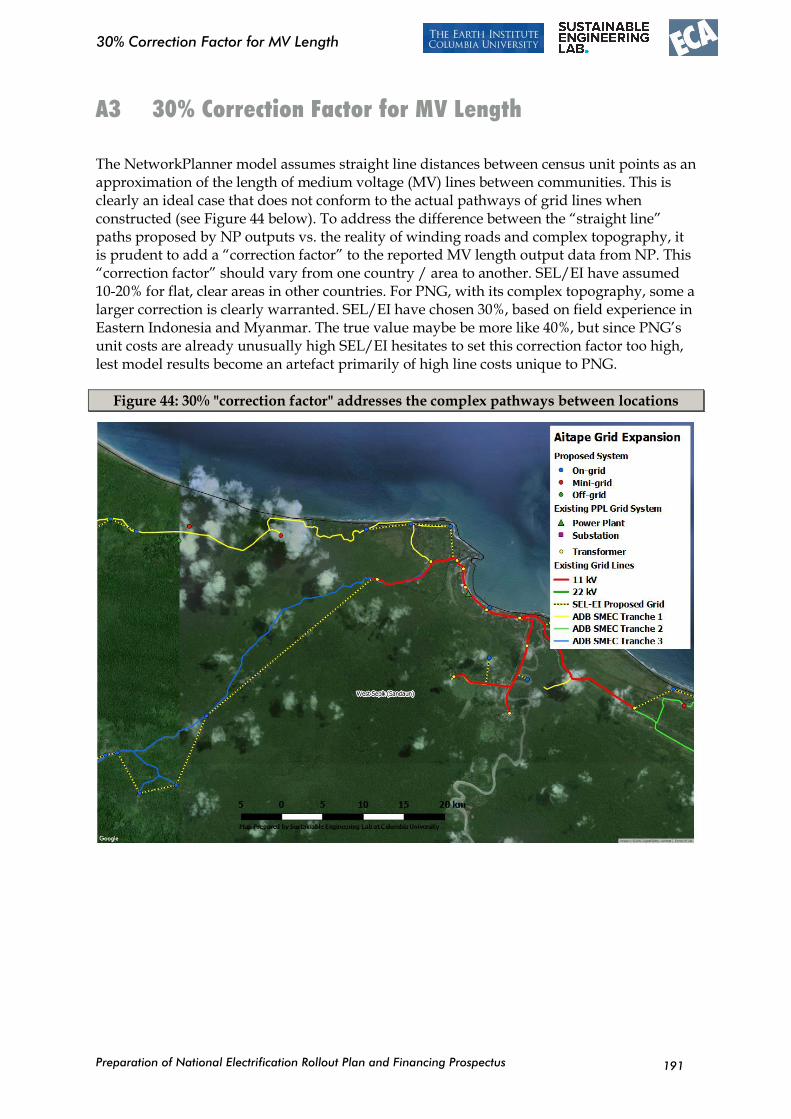
Preparation of National Electrification Rollout Plan and Financing Prospectus
30% Correction Factor for MV Length
191
A3 30% Correction Factor for MV Length
The NetworkPlanner model assumes straight line distances between census unit points as an approximation of the length of medium voltage (MV) lines between communities. This is clearly an ideal case that does not conform to the actual pathways of grid lines when constructed (see Figure 44 below). To address the difference between the “straight line” paths proposed by NP outputs vs. the reality of winding roads and complex topography, it is prudent to add a “correction factor” to the reported MV length output data from NP. This “correction factor” should vary from one country / area to another. SEL/EI have assumed 10-20% for flat, clear areas in other countries. For PNG, with its complex topography, some a larger correction is clearly warranted. SEL/EI have chosen 30%, based on field experience in Eastern Indonesia and Myanmar. The true value maybe be more like 40%, but since PNG’s unit costs are already unusually high SEL/EI hesitates to set this correction factor too high, lest model results become an artefact primarily of high line costs unique to PNG.
Figure 44: 30% "correction factor" addresses the complex pathways between locations
assumes straight line distances between CU points, clearly an ideal case.
• It’s prudent to add a “correction factor” to account for the need for real wires to follow winding roads, topography, etc.
• This “correction factor” should vary from one country / area to another. We assume 10-
Preparation of National Electrification Rollout Plan and Financing Prospectus
Geospatial Plan: Sensitivity Analysis
192
A4 Geospatial Plan: Sensitivity Analysis
The modelling work undertaken by SEL/EI explored many electrification scenarios with a wide range of cost and technical settings. From this large set, three scenarios were chosen for presentation here which represent distinct sets of cost assumptions that effectively probe the sensitivity of the model’s outputs to variations in key inputs. These specific scenarios are regarded by SEL/EI, in consultation with ECA, to be plausible, given foreseeable conditions in PNG now and in the next 10-20 years, and meaningful in that changes in these input values has a significant impact on the resulting electrification recommendations and related costs. The main assumptions that this sensitivity analysis explored relate to changing costs of grid line construction, specifically 22 and 11 kV medium voltage lines and 415 V low voltage lines, including materials, labor, transport, design costs, etc. For multiple reasons – including low population density, difficult terrain, the small size of the PNG market, and others – the domestic cost of constructing MV and LV lines is unusually high. An important aspect of this preliminary work was to explore the impact of changes in these line costs on both the relative fraction of recommended electrification systems (grid vs. off-grid) for locations throughout the country, as well as total costs and costs per connection. This factor was varied among these scenarios in the following manner:
One assumption related to the cost of grid lines (MV & LV cost per km) is that costs remain high, in line with the costs reported in discussions with PPL planning specialists, and in line with private sector estimates. For reference, the specific line costs for this high cost assumption are:
180,000 Kina per km (US$60,000) for 22 kV lines;
150,000 Kina per km (US$50,000) for 11 kV lines;
and 120,000 Kina per km (US$40,000) for 415 V low voltage “open wire” lines.
A contrasting assumption related to the cost of grid lines (MV & LV cost per km) is that costs will be reduced dramatically, but within a plausible range, based on the upper-bound of line costs seen through international comparison. Note that the exact method for reducing costs is not specified or restricted here, and could be achieved in a number of ways, including: bulk procurement of materials on international markets; competitive bidding for large projects domestically; efforts to reduce the “soft costs” of grid extension that currently comprise around half of PPL’s construction cost; implementation of single wire earth return (SWER) technology, or perhaps a combination of these and other cost-saving measures. The main point that significant savings – in the range of 40-50% – are considered a realistic possibility that should be considered since they would bring PNG unit costs to match the high range of international costs. For reference, the specific line costs for this reduced cost assumption are:
120,000 Kina per km (US$40,000) for 22 kV lines;
90,000 Kina per km (US$30,000) for 11 kV lines;
Preparation of National Electrification Rollout Plan and Financing Prospectus
Geospatial Plan: Sensitivity Analysis
193
and 60,000 Kina per km (US$20,000) for 415 V low voltage “open wire” lines.
A third set of assumptions simply chose a mid-point between these cost limits, under the assumption that some, but perhaps not all, of the possible cost savings measures might be implemented. These cost assumptions became:
150,000 Kina per km (US$50,000) for 22 kV lines;
120,000 Kina per km (US$40,000) for 11 kV lines;
and 90,000 Kina per km (US$30,000) for 415 V low voltage “open wire” lines.
Summary model outputs for the four scenarios of the sensitivity analysis are presented in Table 58 below. The primary outcome, which is very robust across all cost profiles, is that the dominant recommendation is for electricity access is grid connectivity. Grid connections are recommended for 70% of homes in the “Base Case” scenario, as well as most households (65-80%) in scenarios with other varying assumptions. Other key outcomes are presented below:
Reducing line costs (MV & LV) favors more grid connectivity:
reduces average initial costs per household by around US$300 (reduction of ~25-30%)
increases penetration of the grid by ~125,000 households (increase of ~15%)
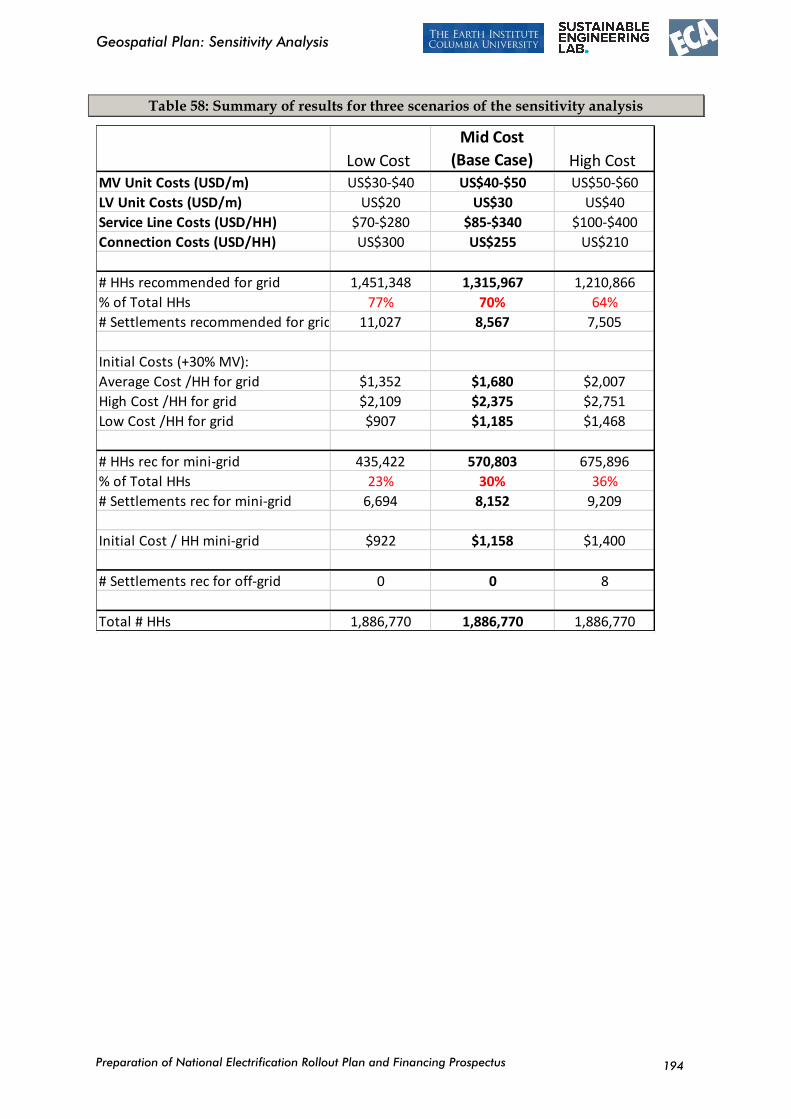
Preparation of National Electrification Rollout Plan and Financing Prospectus
Geospatial Plan: Sensitivity Analysis
194
Table 58: Summary of results for three scenarios of the sensitivity analysis
Low Cost
Mid Cost
(Base Case) High Cost MV Unit Costs (USD/m) US$30-$40 US$40-$50 US$50-$60
LV Unit Costs (USD/m) US$20 US$30 US$40
Service Line Costs (USD/HH) $70-$280 $85-$340 $100-$400
Connection Costs (USD/HH) US$300 US$255 US$210
# HHs recommended for grid 1,451,348 1,315,967 1,210,866
% of Total HHs 77% 70% 64%
# Settlements recommended for grid 11,027 8,567 7,505
Initial Costs (+30% MV):
Average Cost /HH for grid $1,352 $1,680 $2,007
High Cost /HH for grid $2,109 $2,375 $2,751
Low Cost /HH for grid $907 $1,185 $1,468
# HHs rec for mini-grid 435,422 570,803 675,896
% of Total HHs 23% 30% 36%
# Settlements rec for mini-grid 6,694 8,152 9,209
Initial Cost / HH mini-grid $922 $1,158 $1,400
# Settlements rec for off-grid 0 0 8
Total # HHs 1,886,770 1,886,770 1,886,770
Preparation of National Electrification Rollout Plan and Financing Prospectus
International case studies on electrification
195
A5 International case studies on electrification
A5.1 Centralised approaches
Box 3 Utility led electrification in Lao PDR
Overview of approach:
Over a 15-year period, Lao successfully expanded its electricity grid from 15% coverage in 1995 to 70% coverage in 2010. EDL, the national power company, has been a key entity in the rural electrification program as 97% of electric connections to date have been connected by EDL. The high success factor of the program is mostly due to the least-cost strategy adopted for grid expansion. The strategy included village-screening, prioritization and deployment of cost-cutting technological innovations. New connections made by EDL were all by extending the existing grid to new villages who were deemed feasible under the screening and prioritization framework. Only a small part of the current electricity is provided under SHS or off-grid solutions. This strategy ensured a fast and stable extension of the grid but the least-cost plan and prioritization meant that the most feasible expansions were installed first. Areas with pre-existing infrastructure, such as clinics, schools and irrigation systems were prioritized due to the high economic growth potential. To ensure continuous demand growth, EDL provided the residents with information on how electrification could increase their household income and productivity.
The least-cost prioritization of the program meant that connections became more expensive development advanced, due to low population density and difficult terrain. EDL had to alter the installation strategy by increasing the offer of solutions such as SHS-systems, off-grid distribution and cheaper transmission and distribution lines. In order to focus the effort on the remaining areas, EDL established a separate subsidiary which is solely responsible for the remaining electrification program. Lao PDR's current national target is to achieve 90% national electrification rate by 2020.
Key lessons learned:
Lao PDR's program faced different challenges than PNG, as the population density is higher (27 people/km2 compared to 16 people/km2 of PNG) and the national utility had sufficient financial strength to undertake the task with the help of the government. However, some key lessons can be applied to PNG's REP, such as:
Adopting a strict framework for grid expansions, prioritizing the least-cost option, taking into account economic growth potential.
Setting clear and credible targets for the program and dedicate an institution to be responsible for the program. EDL, as the national utility, is responsible for the program's success.
EDL's approach in the later stages of the program can be adopted to PNG's program. As installation costs increased, EDL created a subsidiary whose only responsibility is the
Preparation of National Electrification Rollout Plan and Financing Prospectus
International case studies on electrification
196
remaining unelectrified areas. This way, they were able to implement a cheaper set of standards and different material, and focus on implementing different technologies.
Box 4 State led electrification in Vietnam
Overview of approach:
Vietnam´s success in rural electrification is remarkable as the program increased households with electricity from 2.5% in 1975 to 96% in 2009. Despite this success, the government did not implement a single unified master plan until the mid-1990s. Before that time, communities were being served by regional or communal distributors. Customers had to live with frequent power cuts and distribution networks operated on very high losses.
During the 1990s, the government, with the help of international donor agencies, issued an energy sector reform and created a long-term plan for rural electrification. The reform included setting an electrification target and dividing responsibilities among public entities. The state generation, transmission and distribution companies were merged into Vietnam Electricity (EVN) who was to lead the rural electrification program through strengthening of the transmission grid and construction of new generation capacity. The first phase of the long-term plan focused on rapid rural electrification. It enjoyed great success and in 2004 about 93% of the population had access to electricity, up from just over 50% seven years earlier. Electrification rates became an indicator for socio-economic development in Vietnam and there was high demand for electrification in rural areas.
As the program advanced, priorities shifted from increasing electrification rates to higher quality of supply and stricter regulation in the energy market. In 1999 EVN was able to charge cost-reflective tariffs, which encouraged them to invest in distribution systems and start supplying rural areas directly. Earlier, the rural areas had mostly been served by regional or communal suppliers who bought electricity from EVN. Rural electrification rates in Vietnam are currently at 99% and a uniform national tariff was established in 2009.
Key lessons learned:
Experiences from Vietnam highlight the importance of local and governmental support. In Vietnam electrification rates where used as key indices for socio-economic growth and politicians experienced very strong demand from regions without electricity. Suppliers could expand to new areas knowing that demand would be high and provide a more stable revenue stream. Due to the high communal demand, there were more possibilities of sharing costs and responsibilities.
Having a strong utility such as EVN was vital to the success of the program, as it was able to increase generation capacity, expand transmission grids and provide technical assistance to local and regional utilities.
The flexible plan adopted by the government in the early stages of the rural electrification plan led to a very high growth electrification rates and providing electricity was prioritized, rather than quality of supply. Once electrification rates had grown to an
Preparation of National Electrification Rollout Plan and Financing Prospectus
International case studies on electrification
197
acceptable level, focus shifted towards increasing quality and later to a uniform national tariff.
Box 5 Rural electrification office in Morocco
Overview of approach:
Morocco's 10-year plan for rural electrification was very successful, as in 2007, at the end of the program, rural electrification rates had been increased from 18% to 95%. The program followed a centralized approach with Office National de l'Electricité (ONE) made responsible for the implementation. A dedicated rural electrification office was created within ONE to coordinate the program. ONE is a publicly owned, vertically integrated utility supplying about 50% electricity in Morocco. The program combined grid expansions with off-grid solutions where expansion was deemed too expensive. Grid planning and operation was all under ONE's responsibility and to lower costs, contractors outside the region were allowed to compete for projects. Expansion of the grid was the main driver of the program but when the cost of connecting a household reached a predetermined cut-off cost, an off-grid solution was tendered out under a fee-for-service delivery model. The chosen solution was tailored to the resources available in the area and included SHS-systems and wind power. The ONE electrification model was therefore able to bring in private investor and municipalities to serve areas with off-grid
connections. ONE set the cut-off costs at €2,500 per household.
The financing of the program was split between three major stakeholders. ONE would bear the burden of the costs and would typically pay 55% of the connection costs. Local municipalities would offer about 20% of financing costs and supply all permits, facilities and be in charge of local communications. The connected households would be charged with the remaining 25% of financing costs, but were offered to pay as instalments.
Morocco had already achieved good progress on their national electrification and unlike Lao PDR, were on the later stages of electrification. Morocco already had 62% electrification rates and ONE had the financial stability to undertake the task of rural electrification, with the help of beneficiaries and local municipalities. Furthermore, ONE implemented a levy on all electricity charges to finance the expansion.
The program proved to be hugely successful and as the program nears its completion has allowed ONE to export their experience to neighbouring countries.
Key lessons learned:
By defining a clear cut-off cost for connecting new households, ONE was able to make sure it wouldn't get overrun with connection costs and limit political interference with the program.
The multi-stakeholder financing model made sure all levels of connection were engaged with the program and due to the high demand of connection, households were willing to pay a share in the connection fees.
ONE standardized equipment specifications and design which mostly prevented unpredictable installation costs. Furthermore, they tendered out construction and allowed
Preparation of National Electrification Rollout Plan and Financing Prospectus
International case studies on electrification
198
bids from neighbouring countries. This lowered installation costs and made sure that limited technical capacity was never an issue.
A5.2 Decentralised approaches
Box 6 Private sector participation in Chile
Overview of approach:
Chile has a long history of rural electrification as local cooperatives were formed as early as the 1930s to support agricultural development. The national distribution companies were split up and privatized in the 1980s but did not hold an exclusive right to serve customers. Electrification rates increased gradually under private ownership and in 1990 rural coverage reached just under 50% of households. The Chile Rural Electrification Program (PER) aimed at increasing rural electrification was implanted in 1994 and was supposed to increase rural electrification coverage from 50% to 75% by the year 2000. The program offered governmental subsidies to private entities in order to incentivise rural electrification. PER was given sufficient authority to develop and guide the policy initiative and long-term governmental goals were established. A strict project selection method was created and built on top of the already stable private distribution companies and cooperatives. The goal of 75% electrification was reached in 1999 and due to the program's success a goal of 90% electrification by the year 2005 was set.
The project selection methodology ruled out all projects which were assumed to have a positive IRR as it provided sufficient incentive for the private market to develop. The selection method accounted for economic benefits of electrification within the region and projects and utilities rated based on the lowest subsidy required per user. In some cases, this created a competition among the private utilities to find innovative ways of reducing operational costs to receive the contract. This helped lower the cost of rural electrification in some areas. In others, where no competition existed, the private utility sometimes deliberately underestimated some underlying assumptions to increase potential profit. As a response, PER adopted standard measures, based on local data, for subsidy calculations.
The aid offered by PER was constructed in a way to help utilities during the first stages of implementation, and then decrease with time. Due to Chile's long history with private utilities, a clear set of rules and standards for infrastructure was already in place. This eased the transition into subsidised rural electrification projects as most problems and disputes could be resolved by referring to standards and precedents. The Chilean National Energy Commission (CNE) was the central entity responsible for the design of PER and allocation of funds to regional governments who then allocated them on a project basis.
Key lessons learned:
The need for a clear and transparent project assessment methodology is vital to this type of a program. It limits political and commercial influence on the program and makes sure projects are ranked on merit basis.
Preparation of National Electrification Rollout Plan and Financing Prospectus
International case studies on electrification
199
Governmental support is very important to the credibility of a program. CNE’s role in PER was vital as it provided a leadership and monitoring role while maintaining authority within the regional governments. CNE built enough public and political momentum for the program to continue across administrations and shifts in Chile’s political landscape.
By adopting construction and material standards, construction costs can be kept at a minimum.
PER's subsidy structure incentivised the construction of new connections and underestimated load-growth within the subsidy calculations. The utilities did therefore spend very little effort in promoting load growth and instead focused on expanding the network to continue receiving the subsidies, decreasing the economic benefit for the local communities and running into operational problems when subsidies decreased.
Box 7 Decentralised electrification in Burkina Faso
Overview of approach:
Burkina Faso approached rural electrification in a decentralized manner, working with community cooperative utilities to sign construction and O&M contracts with local installers. In 2007 the national electrification rate was about 17% with 75% of the urban population having electricity while only 3% of the rural population enjoyed the same service. The national utility, SONABEL, was not able to cover its costs due to a politically fixed tariff. It's expansion capabilities were therefore stifled and it barely managed to invest in maintaining their own equipment. Despite its fragile financial state, it operated in a stable manner and had the country’s best technical experts. It expanded the transmission grid at a steady, but slow growth rate.
Burkina Faso’s rural electrification program encourages the formation of cooperatives in order to serve communities. The Department of Energy (DGE) and later the Rural Electrification Fund (FDE) were responsible for organisation and allocation of the funds. Once a potential site had been allocated, representatives from DGE/FDE visited the communities and encouraged them to form a Cooperative and apply for funding from the FDE to perform a feasibility study for the community. Once feasibility studies were finished, the cooperative would send an application to FDE for the required funding for construction of infrastructure. The cooperative holds the concession for the distribution license for the project, is the employer for the construction and owner of the distribution and generation infrastructure. However, it was not the operator of the system, but was required to hire a private entity on a O&M contract. Due to the limited technical capacity in Burkina Faso it was envisaged that the entity responsible for construction would also be the O&M partner. This set-up led to operators not acquiring any economies of scale and installation and operation costs remaining very high. According to the World Energy Outlook database, Burkina Faso has not achieved any significant success in increasing the rate of electrification and currently stands at 16% national electrification rate.
Key lessons learned:
Preparation of National Electrification Rollout Plan and Financing Prospectus
International case studies on electrification
200
The overly complicated process of getting FDE funding for a cooperative led to costs being very high. Installers had to have separate staff for each system they operated and therefore received very little benefits from economies of scale.
The need for a clear leadership and accountability is apparent when analysing Burkina Faso's electricity sector. Many difficulties arose due to differences in planning between SONABEL, FDE and DGE. DGE makes the official strategic planning for the energy sector but SONABEL often disregarded their plans and developed their own plans. This factor was made especially important due to the fact that SONABEL had the countries best technical experts.
The possibility of re-financing needs to be available for installers/operators. FDE assumed that private entities would have the possibility of scaling up their operations, once cash flows and experience had been established. However, the operators ran into problems securing private funding, as banks and financial institutions were unwilling to provide loans.
A5.3 Hybrid approaches
Box 8 Qualified third party model in the Philippines
Overview of approach:
Rural electrification in the Philippines has been largely undertaken by cooperatives established with central funding for capital investments and support. These cooperatives are given exclusive supply franchises in return for which they assume responsibility for electrifying all households within their franchise area.
Inevitably, as electrification has expanded to poorer and more remote regions, it has become increasingly difficult for cooperatives to deliver complete electrification. In particular, many areas are unviable, which is defined as the ongoing cost of supply exceeding the existing tariff (which is proposed by the cooperative and approved by the regulator leading to an inevitable bias towards avoiding increases to fund supplies for households who are not yet cooperative members).
To address this, the Qualified Third Party (QTP) model was introduced. Under this, a cooperative (or private distribution utility) can declare an area as being unviable to supply at current tariffs. The Department for Energy will then conduct a competitive tender to select a third party to supply the area under a concession agreement. The third party applies the same tariffs as the surrounding cooperative (which addresses equity and affordability concerns) with the difference between this and the tendered cost of supply being covered from a central fund which is financed from a universal levy on all electricity sales.
Experience with the QTP model has been mixed. The initial schemes were where there were existing third parties and so no tender was held and instead costs and subsidies were negotiated. Cooperatives also appear to have been reluctant to cede parts of their franchise area to other entities even if they consider them currently unviable. In part, this
Preparation of National Electrification Rollout Plan and Financing Prospectus
International case studies on electrification
201
reflects their historic mission to deliver complete electrification rather than rely on others to do so. However, the pace of QTP introduction has increased more recently.
Box 9 Rural electrification in Ethiopia
Overview of approach:
Ethiopia’s rural electrification plan is split between two entities, Ethiopian Electric Power Corporation (EEPCo), the public utility, and the Rural Electrification Fund (REF). EEPCo is responsible for all national grid extension projects while REF supports private off-grid electrification. The REF has no permanent staff but consultants working on 1-year contracts while receiving ad hoc assistance from other institutions. The REF is the primary source of loans for off-grid investments while EEPCo is responsible for grid extensions.
Future investments in grid expansions are unified under the Universal Electrification Access Program (UEAP) and decided through long-term master plans and by involving various institutions:
the Energy Bureaus of the Regional Governments propose new investments,
the Ministry of Mines and Energy (MME) who analyse the proposals and screen out the ones where population demand and financing requirements are not met, and
EEPCo who rate the proposals approved by MME on economic feasibility and publish a list of investments in the next phase.
Off-grid investments are based on proposals submitted by the Rural Electrification Executive Secretariat (REES) and presented to prospective investor, after environmental and socio-economic analysis have been done. In Ethiopia the investors tend to be cooperatives where communities have saved up for the required 15% equity requirement.
The Development Bank of Ethiopia (DBE) was selected through a public tender and performs all due diligence and is the Trust Agent of the Rural Electrification Fund. The REF can also call for technical consulting from EEPCo and other public institutions. Donor funding is the largest revenue stream of the REF but funding is not accumulated in the REF and then distributed, but individual donors fund specific parts of the investment plan. The government’s contribution to the REF is providing office space and access to expertise within public institutions without any charge.
Key lessons learned:
The lack of technical knowledge is rural Ethiopia is the biggest hurdle for the rural electrification program. The cooperatives are supposed to contract local professionals for installation and operation, but the limited technical capacity in rural areas has proven difficult. During operation, the cooperatives can draw on technical consultation from their local Energy Bureau but in many cases the lack of managerial potential has made the cooperatives unstable.
Preparation of National Electrification Rollout Plan and Financing Prospectus
International case studies on electrification
202
The purpose and structure of REF is clear and great care has been taken to minimize overlap between institutions. However, in some cases EEPCo has initiated expansions into areas where an application has been submitted to REF or construction has already begun. The structure of off-grid investments is a good example how many public institutions and the private sector can work together in a clear and transparent manner.
Cost-recovery tariffs need to be set for cooperatives to remain financially stable and their reliance on diesel price volatility can be difficult for customers. Since the cooperatives receive no other subsidy than used for the installation cost they are especially vulnerable when tariffs are set too low.
A5.4 Community approaches
Box 10 Community involvement in Bangladesh
Overview of approach:
Bangladesh’s rural electrification strategy was to engage community engagement through cooperatives (PBS). In 1977, at the start of the cooperative program, national electrification rates where below 10%. The Rural Electricity Board (REB) was formed as an agency under the Ministry of Energy and Hydrocarbons. The REB manages all incoming loans and grants from donor agencies, and offers long- and short-term financing for PBS investments. They are also responsible for planning new investments, regulating tariffs, monitoring performance, and offering technical consultation to existing PBSs.
REB’s activities are divided among three directorates, finance, PBS oversight and training, and engineering. All services provided by REB fit within these three directorates. Engineering is in charge of expansion by analysing potential sites and do feasibility studies. If expansion is considered feasible, REB starts construction of the required infrastructure and generation. Once construction is complete, an interim manager is appointed by REB who trains local community members to take place as the cooperative management board. Throughout the process, community involvement is prioritised to make sufficient load growth will ensue. Once a PBS has been established, REB holds regular meetings with customers and keeps them informed of development within the grid and ways to use electricity for their own economic growth.
Despite PBS being autonomous entities, REB retains much financial control of the cooperatives and sets performance goals, regulates tariffs and allocates annual bonuses. REB has developed strict standards for design, equipment use and materials, which has helped lower the cost of installing and construction of new infrastructure.
Key lessons learned:
REB’s tight grip on the PBSs, along with clear performance-based measurements has helped ensure the operational viability of the PBSs. The heavily centralised decision making during the early stages of a PBS provides very little room for error but might
Preparation of National Electrification Rollout Plan and Financing Prospectus
International case studies on electrification
203
result in slower overall implementation of cooperatives. The limited technical capacity of the rural areas in Bangladesh led to need for constant training and oversight by the REB.
REB enforced very strict bill collection practices and implemented corruption-preventive methods such as rotating meter reading routes. Furthermore, they contracted rural banks to act as centralised collection points. To create a feeling of shared responsibility, REB keeps the customers involved with operations. These measures have resulted in collection rates exceeding 95%.
As many successful rural electrification systems, Bangladesh created a master plan to prioritise investment options. Although not exempt from political pressure, it has remained autonomous overall.
A5.5 Funding
Box 11 Wholesale power subsidies in Thailand
Overview of approach:
One of the most successful example of cross subsidies is that of Thailand. The electricity sector is fully public with the Electric Generating Authority of Thailand (EGAT) being the main power generator, the Metropolitan Electricity Authority (MEA) being in charge of distribution in metropolitan areas, and the Provincial Electricity Authority (PEA) supplying the remaining areas. From the start of the rural electrification program it was decided that a uniform national tariff would be offered.
In order for the two agencies to charge the same tariff, a cross-subsidy from MEA to PEA through EGAT was established. PEA was to be given electricity at up to 30% lower price than what MEA paid, furthermore, PEA was to receive an even lower price for bulk purchases. This led to PEA and MEA being able to charge under the same retail tariff structure. As demand grew under PEA and consumption surpassed that of MEA, the cross-subsidy was discontinued. PEA did continue to have higher operating costs, due to the higher proportion of rural customer. To make up for the difference, the cross-subsidy was substituted by a cash transfer from the government.
Key lessons learned:
Thailand and PNG vary greatly in population density (Thailand – 131 people/km2, PNG – 16 people/km2) which affects the ability to cross-subsidise from urban to rural areas. Thailand’s success in cross-subsidising was in the way the tariffs areas were divided. Not only did MEA subsidise PEA but the big urban cities served by PEA subsidised the rural areas.
Box 12 Franchise areas in the Philippines
Overview of approach:
Preparation of National Electrification Rollout Plan and Financing Prospectus
International case studies on electrification
204
The tariff levels in the Philippines offer an example of the variations in tariffs between suppliers. Once the cooperatives were granted the franchise to serve a specific area, they had to limit themselves to charge their customers under the same tariff structure. While still being a cross-subsidy within the franchise area, it allows the supplier to charge a higher tariff in franchise areas where conditions are on average more difficult. One of the major causes of the cooperatives’ crisis was their inability to charge cost-reflective tariffs. This led to worsening financial stability and eventually, entire sector reform. Once cost-reflective tariffs were established, cooperatives could start strengthening their operational base, improve service levels and continue expansion of their grid.
Key lessons learned:
This example provides many valuable lessons for PNG as some cooperatives share many similarities to PNG’s rural areas. Even though cost-reflective tariffs might be higher than uniform national tariffs, they represent actual costs more accurately, and therefore might lead to electrification of areas not feasible under a uniform tariff.
By bundling rural and small cities and villages together under a franchise area allows the operator to service a greater range of customers. When grid expansion had reached its feasibility limitations, the cooperatives could apply for a subsidy to continue expanding.
Box 13 Capital subsidies in Peru
Overview of approach:
The approach taken by Peru when it comes to rural electrification subsidies is mostly through subsidising capital costs while allowing suppliers to set cost-recovery tariffs. In some cases, an operational subsidy is required for tariffs to remain at an acceptable level.
The capital subsidy can be used for different aspects of rural electrification, such as transmission grid expansion, rural mini-grids or small grid-connected distribution systems. The subsidies are usually funded through government grants or international donor agencies.
Key lessons learned:
The approach to capital subsidies in Peru is a common approach to capital costs. They are the single biggest cost of rural electrification and can be a huge threshold for mini-grids and rural electrification.
By accompanying capital costs with cost-recovery tariffs the operator can start working towards improving service, paying back loans or expanding the grid. The suppliers receiving a capital cost subsidy will need to be regulated in order to make sure the profit made through the subsidies is re-invested into the grid.

Preparation of National Electrification Rollout Plan and Financing Prospectus
205
Box 14 Operational subsidies in Peru
Overview of approach:
Along with subsidising capital costs (Box 13), Peru offers a subsidy for the rural grids where operational costs are the highest. Without subsidy the required tariffs would be too high for the locals to pay. The government therefore resolved to offering an operational subsidy funded through a levy.
The subsidy is not high enough for tariffs to be the same as urban tariffs, but enough to make it affordable. In some cases, the subsidy can lead to a 60% reduction in tariffs among customers using below 30 kWh per month. The subsidy is entirely funded by a 3% surcharge on all customers with consumption of 100 kWh or higher per month.
Key lessons learned:
Implementing a levy on consumption is a common way of raising funds for a subsidy. The difference from a cross-subsidy is that a specific set of customers can be targeted.