Premier oil results 2014
31
2014 Annual Results Presentation 26 February 2015
-
Upload
company-spotlight -
Category
Investor Relations
-
view
2.661 -
download
1
Transcript of Premier oil results 2014
2014 Annual Results
Presentation26 February 2015
Forward looking statements
This presentation may contain forward-looking statements and information that
both represents management's current expectations or beliefs concerning future
events and are subject to known and unknown risks and uncertainties.
A number of factors could cause actual results, performance or events to differ
materially from those expressed or implied by these forward-looking statements.
February 2015 | P1

Agenda
Introduction
Indonesia
Vietnam
Falkland Islands
Finance
Outlook
Tony Durrant
Roberto Lorato
Phil MacLaurin
Neil Hawkings
Richard Rose
Tony Durrant
February 2015 | P2
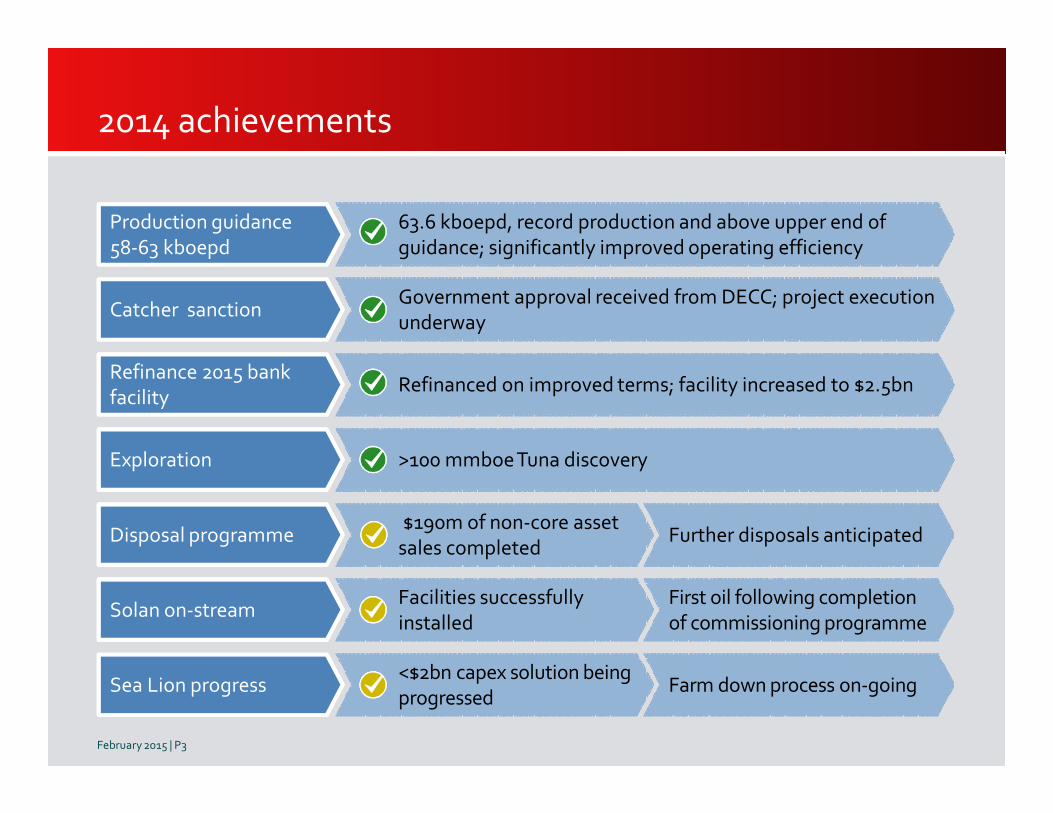
2014 achievements
Government approval received from DECC; project execution underway
Production guidance58-63 kboepd
Catcher sanction
Refinance 2015 bank facility
Exploration
Disposal programme
Solan on-stream
Sea Lion progress
63.6 kboepd, record production and above upper end of guidance; significantly improved operating efficiency
Refinanced on improved terms; facility increased to $2.5bn
>100 mmboeTuna discovery
$190m of non-core asset sales completed
Further disposals anticipated
Facilities successfully installed
First oil following completion of commissioning programme
<$2bn capex solution being progressed
Farm down process on-going
February 2015 | P3

Solan project status
• Tank, jacket and topsides installed September 2014
• Initial drilling phase and subsea work completed October 2014
• Mechanical completion and commissioning adversely affected by weather (December – February)
• Subsea work to tie-in P1 and W1 scheduled for March
• Optimising use of flotel/rig capacity to complete remaining work scope
• Drilling rig contracted for P2 and W2 programme
February 2015 | P4
Targeting
plateau rate of
20-25 kbopd
by year-end
IndonesiaRoberto Lorato
Indonesia Business Unit Manager
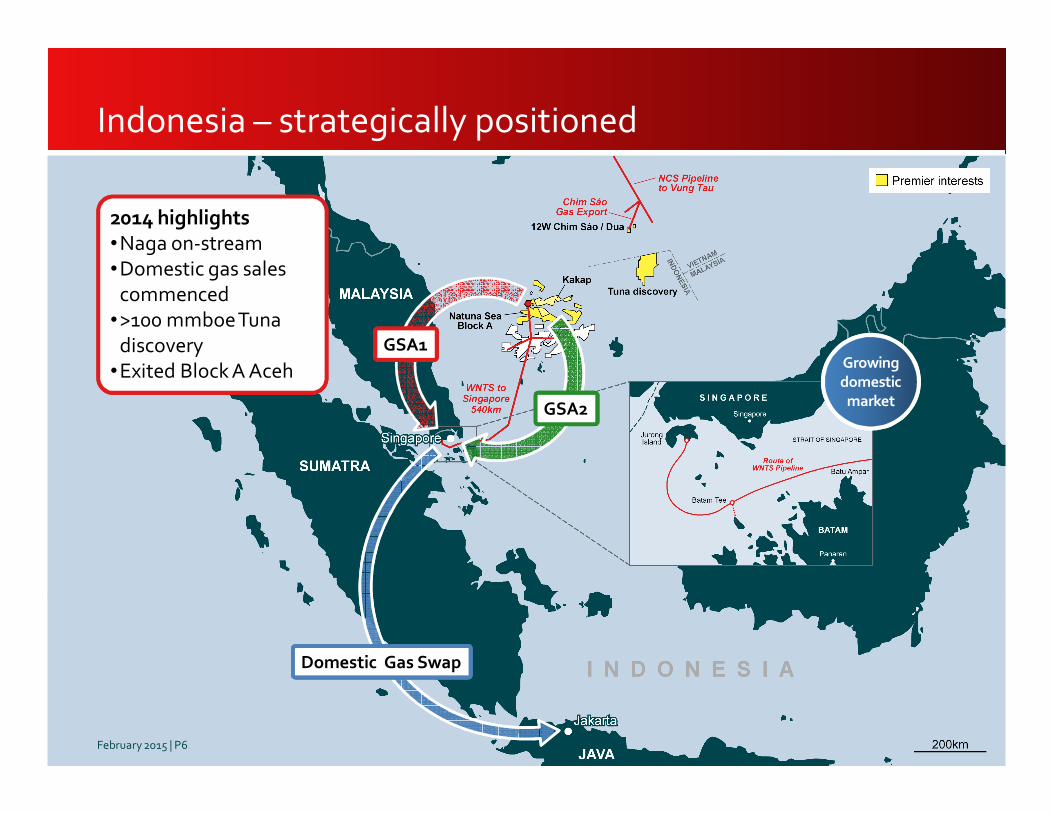
Indonesia – strategically positioned
2014 highlights•Naga on-stream•Domestic gas sales
commenced •>100 mmboeTuna
discovery•Exited Block A Aceh
GSA2
Domestic Gas Swap
GSA1Growing
domestic
market
February 2015 | P6
Natuna Sea Block A (NSBA) –high performing cash generator
Opex• Targeting opex of $9/boe
Revenue • 14.4 kboepd in 2014; 45% share of GSA1 above
contractual share of 39.4%
• Take or pay contracts
• PSC regime
• 20% of 2015 Indonesian gas hedged at $90/boe
Cash flow• 2014 net operating cash flow of $170m
Low capex• Re-phasing discretionary spend
• $40m in 2015
96%
operating
efficiency
Record
cash flow
in 2014
February 2015 | P7
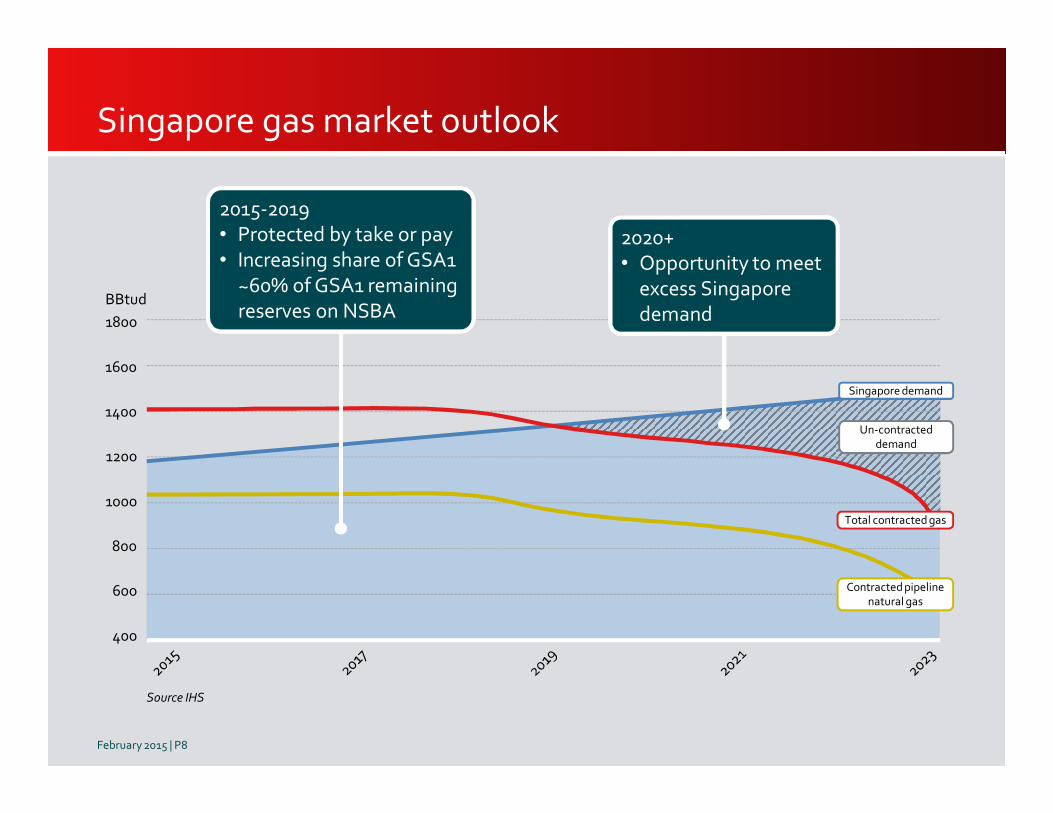
Singapore gas market outlook
1800
1600
1400
1200
1000
800
600
400
Source IHS
BBtud
Singapore demand
Contracted pipelinenatural gas
Total contracted gas
Un-contracteddemand
2015-2019• Protected by take or pay• Increasing share of GSA1
~60% of GSA1 remaining reserves on NSBA
2020+ • Opportunity to meet
excess Singapore demand
February 2015 | P8
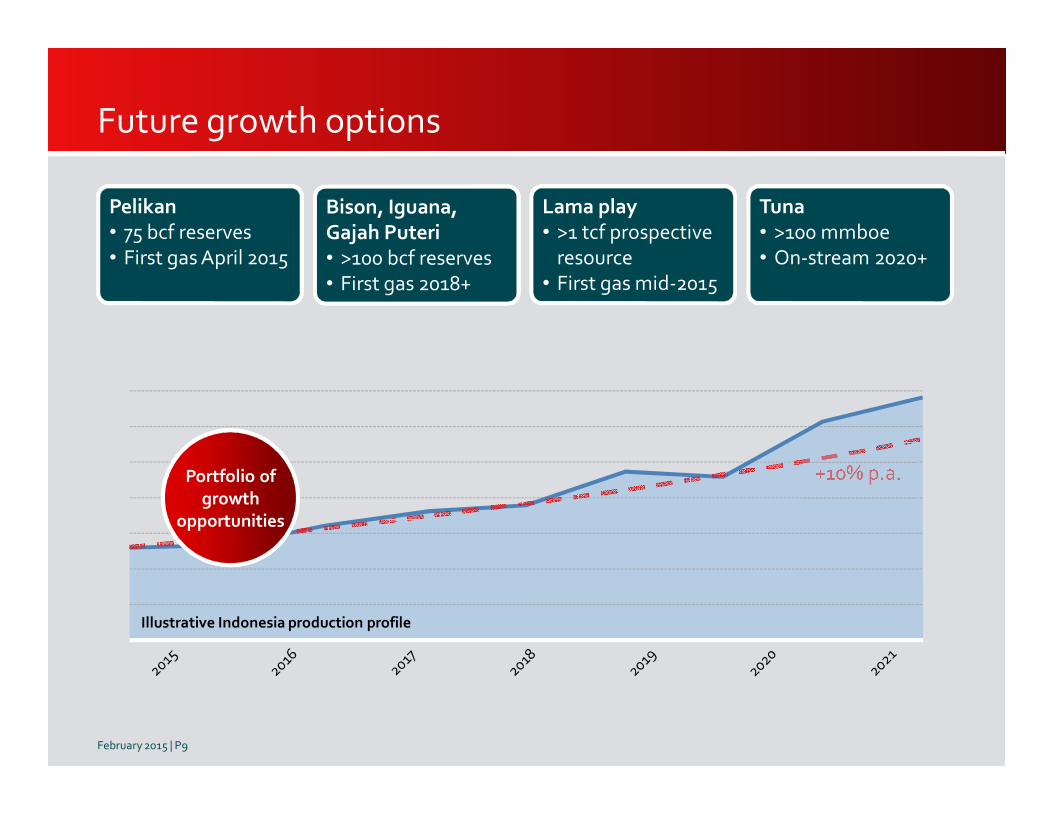
Future growth options
Pelikan• 75 bcf reserves• First gas April 2015
Lama play• >1 tcf prospective
resource• First gas mid-2015
Bison, Iguana, Gajah Puteri• >100 bcf reserves • First gas 2018+
Tuna• >100 mmboe• On-stream 2020+
Illustrative Indonesia production profile
Portfolio of
growth
opportunities
February 2015 | P9

VietnamPhil MacLaurin
Vietnam Business Unit Manager
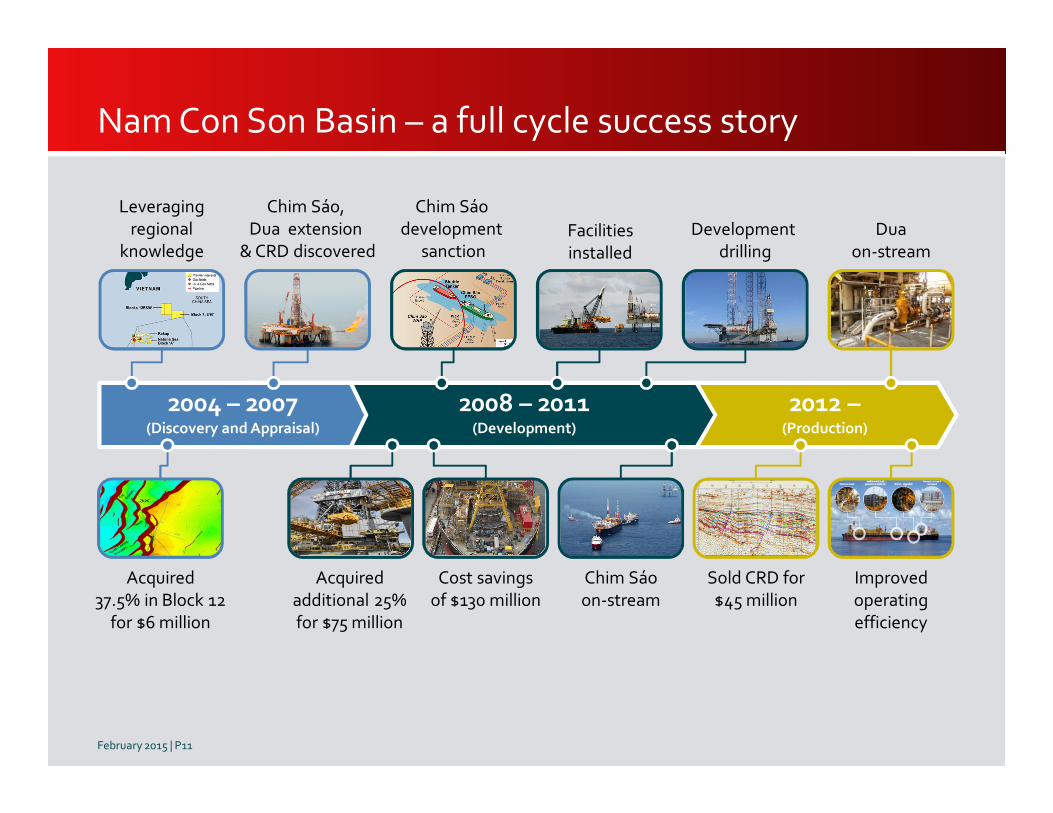
2004 – 2007(Discovery and Appraisal)
2008 – 2011(Development)
Leveraging
regional
knowledge
Chim Sáo,
Dua extension
& CRD discovered
Acquired
additional 25%
for $75 million
Facilities
installed
Cost savings
of $130 million
Chim Sáo
development
sanctionDevelopment
drilling
Improved
operating
efficiency
Dua
on-stream
2012 –(Production)
Acquired
37.5% in Block 12
for $6 million
Chim Sáo
on-stream
Sold CRD for
$45 million
Nam Con Son Basin – a full cycle success story
February 2015 | P11
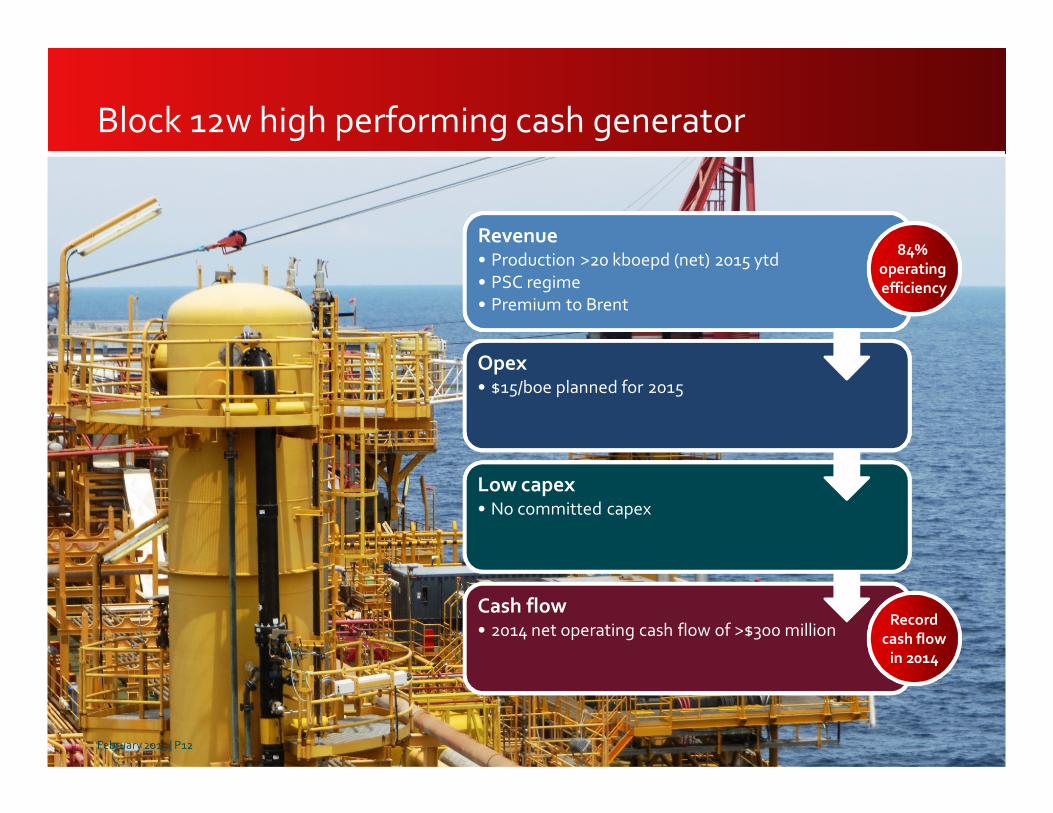
Block 12w high performing cash generator
Cash flow• 2014 net operating cash flow of >$300 million
Low capex• No committed capex
Opex• $15/boe planned for 2015
Revenue• Production >20 kboepd (net) 2015 ytd
• PSC regime
• Premium to Brent
84%
operating
efficiency
Record
cash flow
in 2014
February 2015 | P12
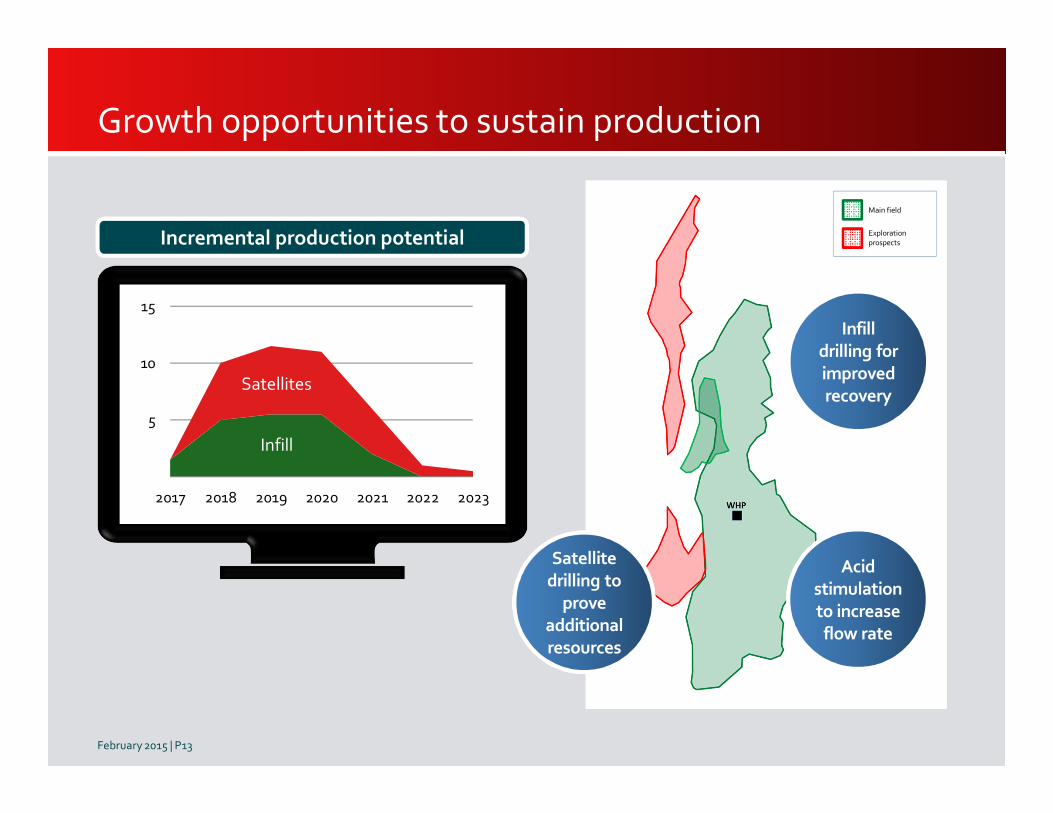
Growth opportunities to sustain production
Main field
Exploration
prospects
Satellite
drilling to
prove
additional
resources
Infill
drilling for
improved
recovery
Acid
stimulation
to increase
flow rate
Incremental production potential
February 2015 | P13
0
5
10
15
2017 2018 2019 2020 2021 2022 2023
Infill
Satellites
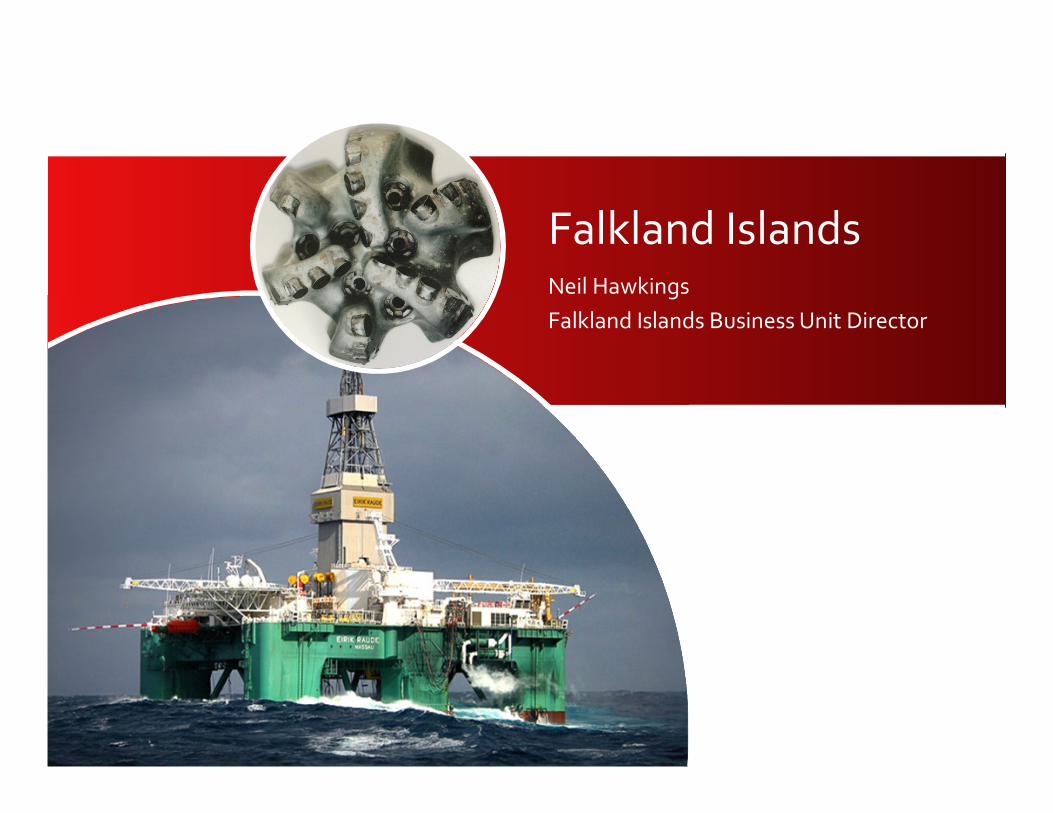
Falkland IslandsNeil Hawkings
Falkland Islands Business Unit Director
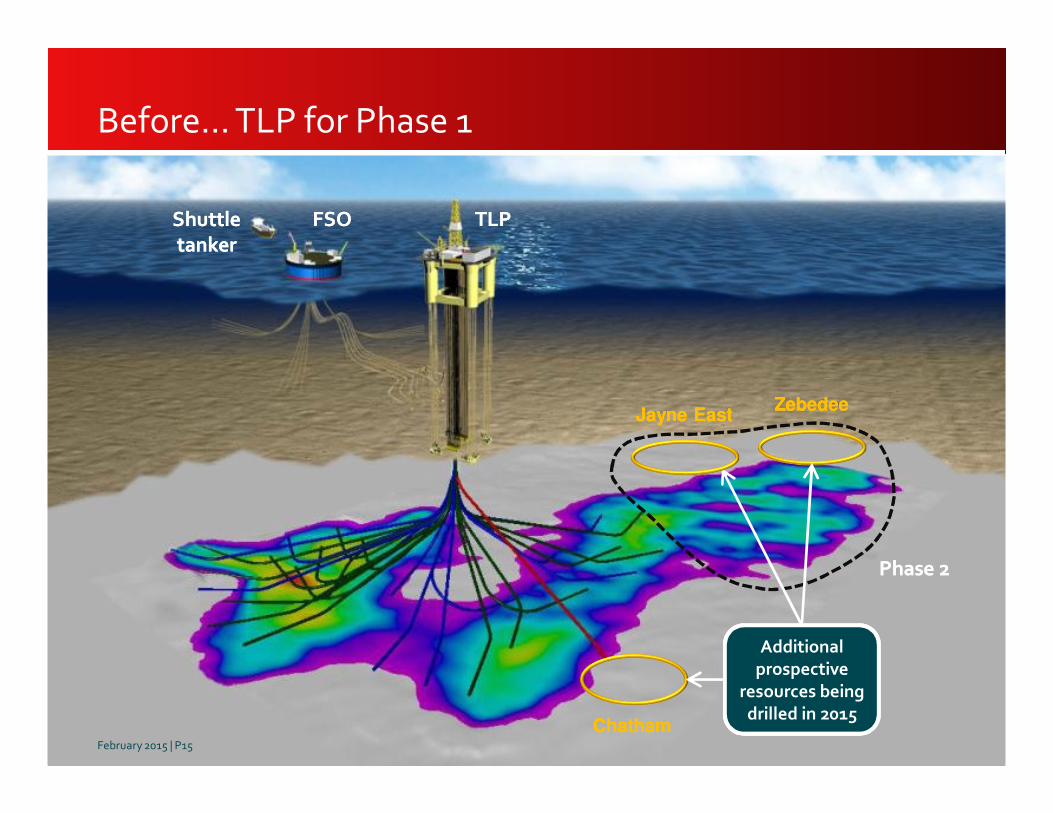
Before… TLP for Phase 1
TLPTLPFSOFSOShuttletanker
Shuttletanker
ChathamChatham
Phase 2Phase 2
ZebedeeZebedeeJayne EastJayne East
Additional
prospective
resources being
drilled in 2015
February 2015 | P15
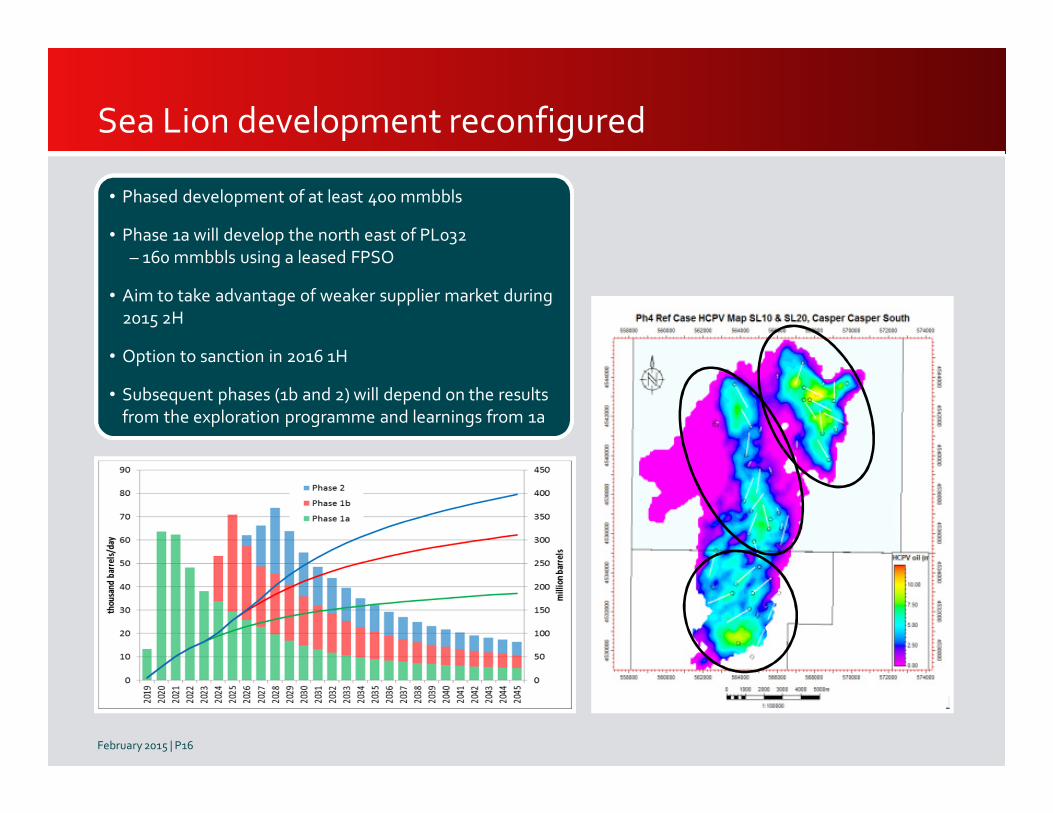
Sea Lion development reconfigured
• Phased development of at least 400 mmbbls
• Phase 1a will develop the north east of PL032
– 160 mmbbls using a leased FPSO
• Aim to take advantage of weaker supplier market during
2015 2H
• Option to sanction in 2016 1H
• Subsequent phases (1b and 2) will depend on the results
from the exploration programme and learnings from 1a
February 2015 | P16

Now… Phase 1a
Subseadrill centre
Subseadrill centre
FPSOFPSO
Shuttletanker
Shuttletanker
ChathamChatham
ZebedeeZebedeeJayne EastJayne East
• 14 development wells
– 8 producers
– 5 water injectors
– 1 gas producer / injector
– 9 pre-drilled
• 160 mmbbls over 15 years
February 2015 | P17
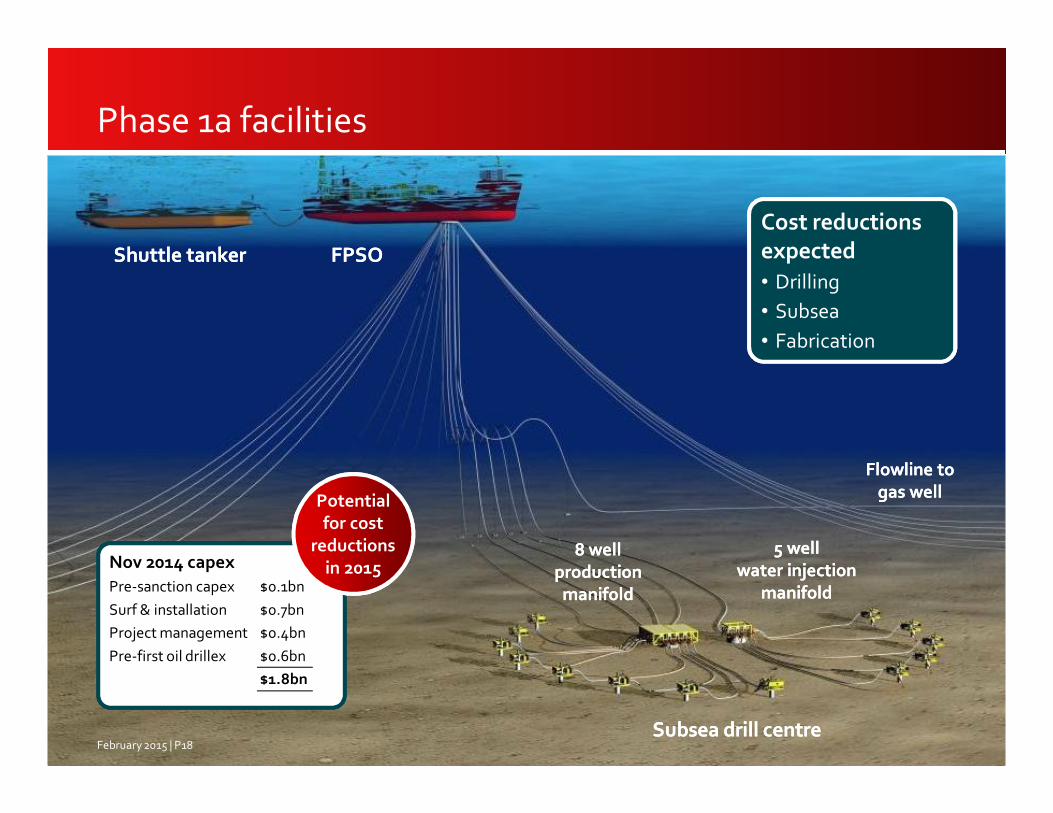
Phase 1a facilities
Subsea drill centreSubsea drill centre
FPSOFPSOShuttle tankerShuttle tanker
8 well
production
manifold
8 well
production
manifold
5 well
water injection
manifold
5 well
water injection
manifold
Flowline to
gas well
Flowline to
gas well
Nov 2014 capex
Pre-sanction capex $0.1bn
Surf & installation $0.7bn
Project management $0.4bn
Pre-first oil drillex $0.6bn
$1.8bn
Potential Potential
for cost
reductions
in 2015
Cost reductions
expected
• Drilling
• Subsea
• Fabrication
February 2015 | P18
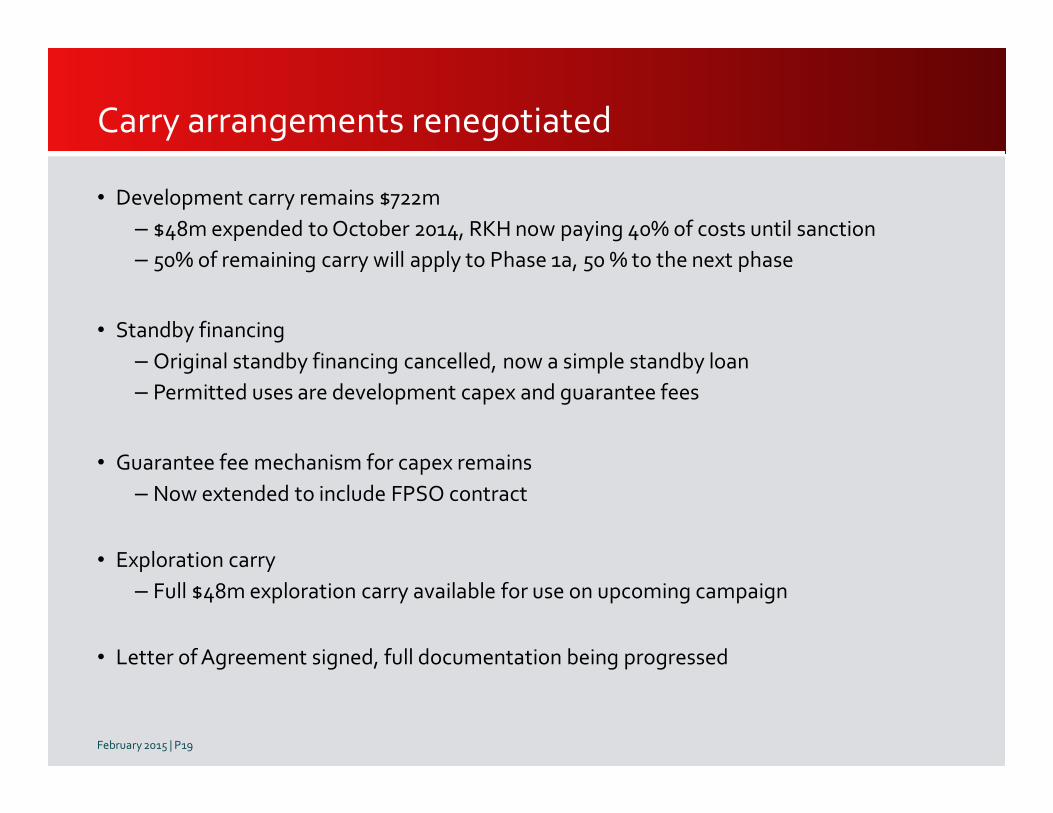
Carry arrangements renegotiated
• Development carry remains $722m
– $48m expended to October 2014, RKH now paying 40% of costs until sanction
– 50% of remaining carry will apply to Phase 1a, 50 % to the next phase
• Standby financing
– Original standby financing cancelled, now a simple standby loan
– Permitted uses are development capex and guarantee fees
• Guarantee fee mechanism for capex remains
– Now extended to include FPSO contract
• Exploration carry
– Full $48m exploration carry available for use on upcoming campaign
• Letter of Agreement signed, full documentation being progressed
February 2015 | P19
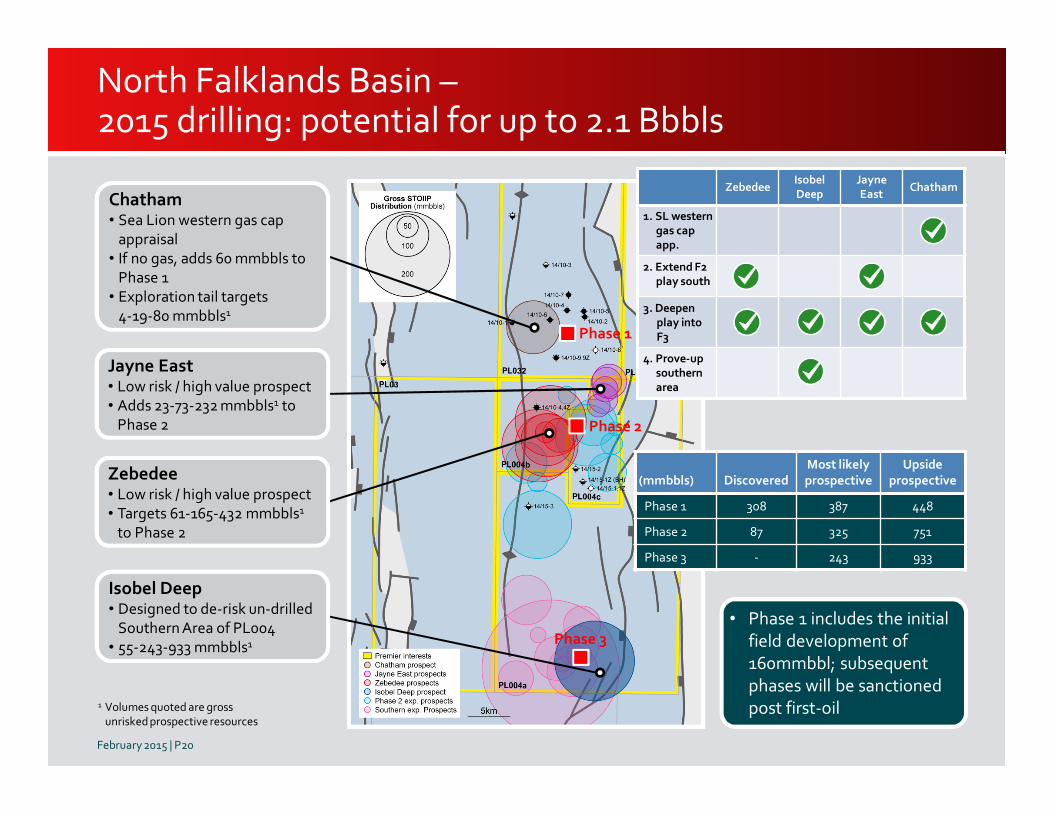
North Falklands Basin –2015 drilling: potential for up to 2.1 Bbbls
Phase 1
Phase 3
Phase 2
Chatham• Sea Lion western gas cap
appraisal
• If no gas, adds 60 mmbbls to
Phase 1
• Exploration tail targets
4-19-80 mmbbls1
Zebedee• Low risk / high value prospect
• Targets 61-165-432 mmbbls1
to Phase 2
Jayne East• Low risk / high value prospect
• Adds 23-73-232 mmbbls1 to
Phase 2
Isobel Deep• Designed to de-risk un-drilled
Southern Area of PL004
• 55-243-933 mmbbls1
1 Volumes quoted are grossunrisked prospective resources
(mmbbls) DiscoveredMost likelyprospective
Upside prospective
Phase 1 308 387 448
Phase 2 87 325 751
Phase 3 - 243 933
ZebedeeIsobelDeep
Jayne East
Chatham
1. SL western gas cap app.
2. Extend F2 play south
3. Deepen play into F3
4. Prove-up southern area
• Phase 1 includes the initial
field development of
160mmbbl; subsequent
phases will be sanctioned
post first-oil
February 2015 | P20

FinanceRichard Rose
Finance Director

Capital expenditure ($m)
Excludes $49m from the Block A Aceh sale
and ~$30m positive adjustment from Scott
area disposal which will be received in Q1 2015
Liquids hedging
Cash flows
12 months to 31 Dec
2014
12 monthsto 31 Dec
2013
Working Interest production (kboepd) 63.6 58.2
Entitlement production (kboepd) 57.7 52.4
Realised oil price (US$/bbl) - pre hedge 98.2 109.0
Realised gas price (US$/mcf) - pre hedge 8.4 8.3
US$m US$m
Cash flow from operations 1,133 1,031
Taxation (209) (223)
Operating cash flow 924 803
Capital expenditure (1,196) (878)
Partner funding (Solan) (318) (186)
Disposals 131 61
Finance and other charges, net (120) (91)
Dividends (44) (40)
Share buy back (93) -
Net cash out flow (716) (331)
1H 2015 2H 2015 2016
Barrels hedged
2.7 m 2.85 m 1.2 m
Average price($/bbl)
$103 $92 $67
February 2015 | P22
2013 2014 2015
Exploration $207 $165 $220
Development $658 $1,017 $700
Other $14 $14
Total $878 $1,196 $920
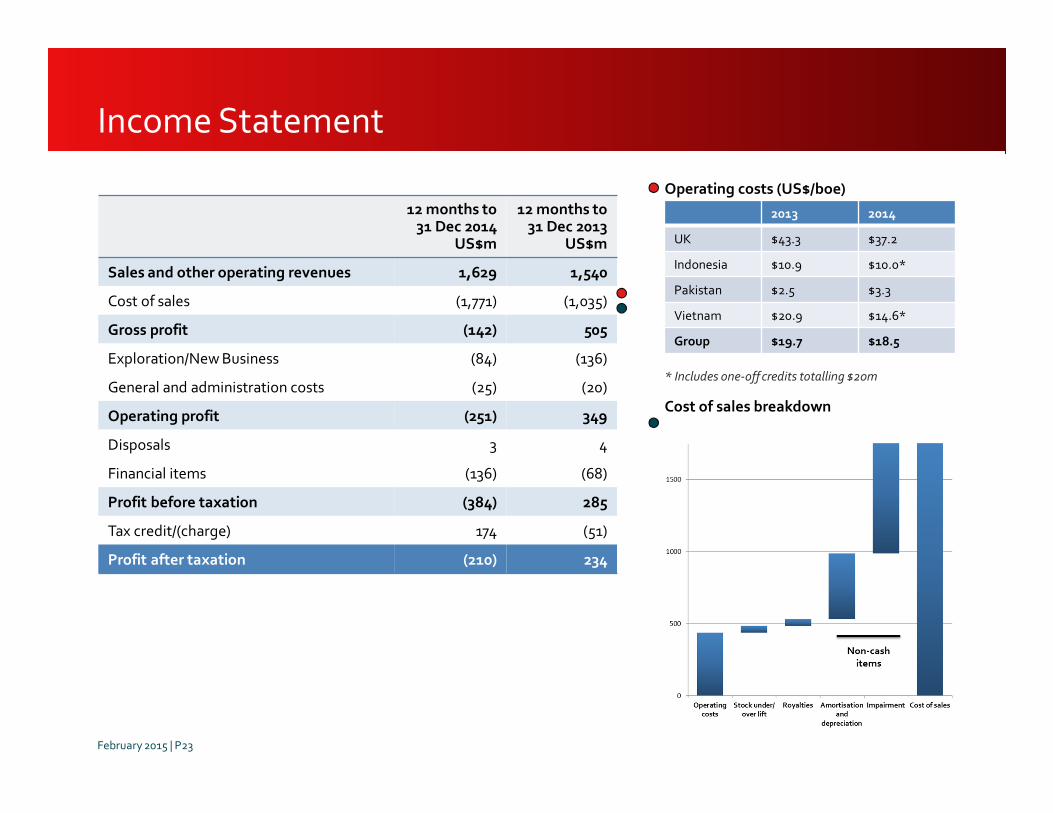
12 months to31 Dec 2014
US$m
12 months to 31 Dec 2013
US$m
Sales and other operating revenues 1,629 1,540
Cost of sales (1,771) (1,035)
Gross profit (142) 505
Exploration/New Business (84) (136)
General and administration costs (25) (20)
Operating profit (251) 349
Disposals 3 4
Financial items (136) (68)
Profit before taxation (384) 285
Tax credit/(charge) 174 (51)
Profit after taxation (210) 234
Income Statement
Operating costs (US$/boe)
* Includes one-off credits totalling $20m
Cost of sales breakdown
2013 2014
UK $43.3 $37.2
Indonesia $10.9 $10.0*
Pakistan $2.5 $3.3
Vietnam $20.9 $14.6*
Group $19.7 $18.5
February 2015 | P23
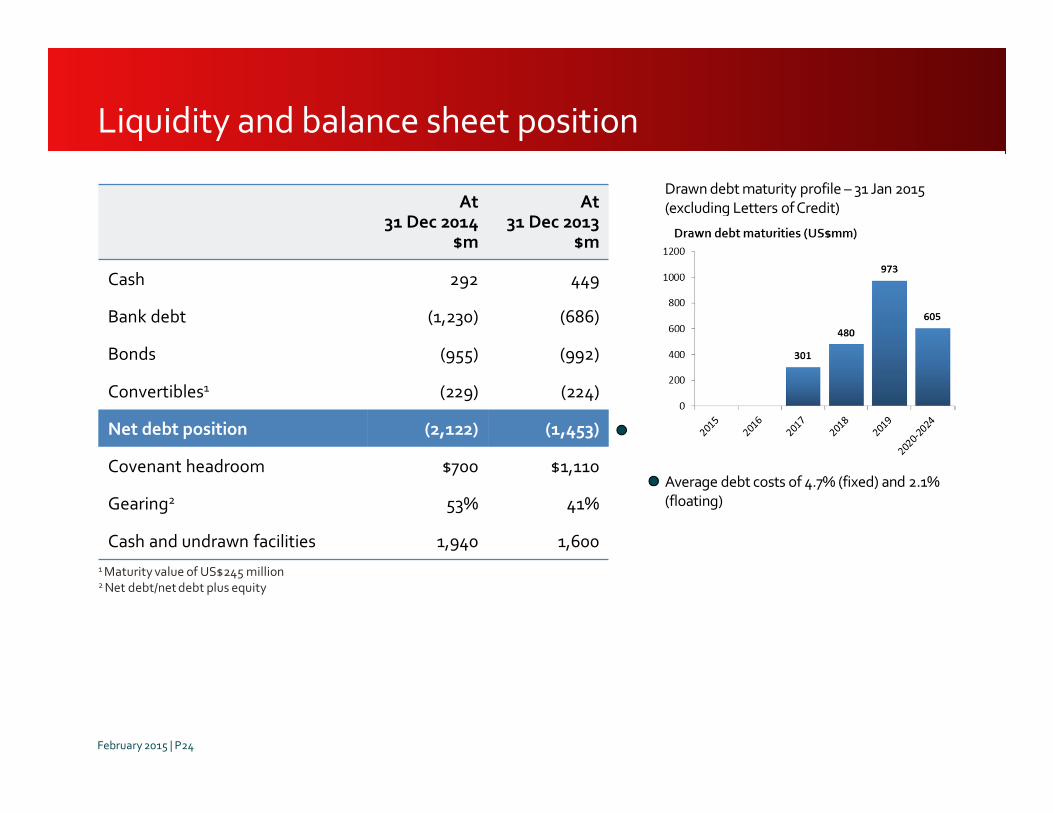
Liquidity and balance sheet position
At31 Dec 2014
$m
At31 Dec 2013
$m
Cash 292 449
Bank debt (1,230) (686)
Bonds (955) (992)
Convertibles1 (229) (224)
Net debt position (2,122) (1,453)
Covenant headroom $700 $1,110
Gearing2 53% 41%
Cash and undrawn facilities 1,940 1,600
1 Maturity value of US$245 million2 Net debt/net debt plus equity
Drawn debt maturity profile – 31 Jan 2015
(excluding Letters of Credit)
Average debt costs of 4.7% (fixed) and 2.1%
(floating)
February 2015 | P24
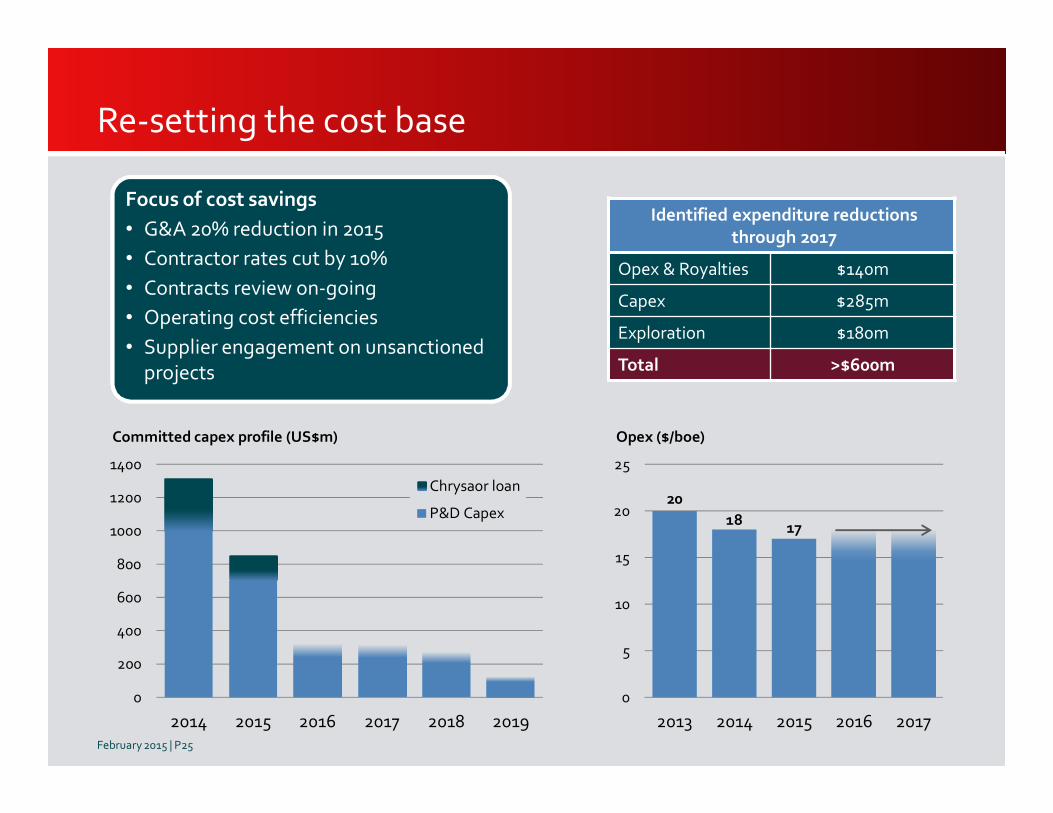
Re-setting the cost base
20
1817
0
5
10
15
20
25
2013 2014 2015 2016 2017
Opex ($/boe)
0
200
400
600
800
1000
1200
1400
2014 2015 2016 2017 2018 2019
Committed capex profile (US$m)
Chrysaor loan
P&D Capex
Focus of cost savings
• G&A 20% reduction in 2015
• Contractor rates cut by 10%
• Contracts review on-going
• Operating cost efficiencies
• Supplier engagement on unsanctioned projects
Identified expenditure reductions
through 2017
Opex & Royalties $140m
Capex $285m
Exploration $180m
Total >$600m
February 2015 | P25
OutlookTony Durrant
CEO
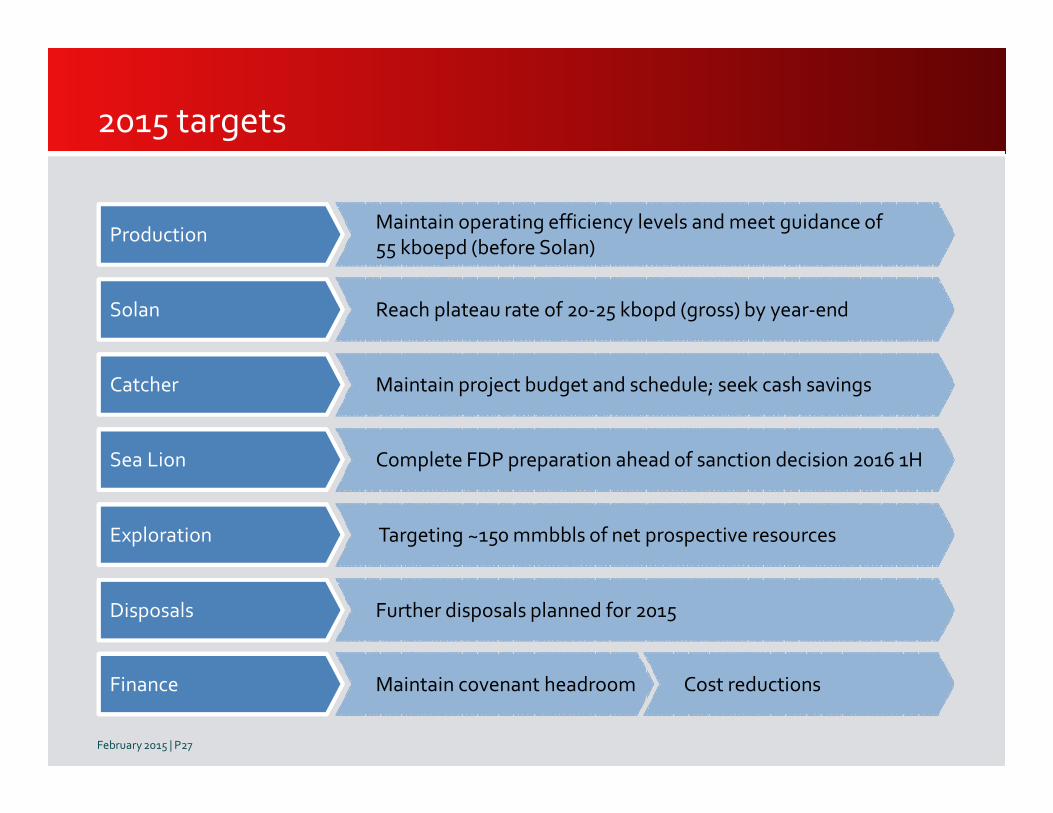
2015 targets
Reach plateau rate of 20-25 kbopd (gross) by year-end
Production
Solan
Catcher
Sea Lion
Exploration
Finance
Disposals
Maintain operating efficiency levels and meet guidance of55 kboepd (before Solan)
Maintain project budget and schedule; seek cash savings
Complete FDP preparation ahead of sanction decision 2016 1H
Targeting ~150 mmbbls of net prospective resources
Maintain covenant headroom Cost reductions
Further disposals planned for 2015
February 2015 | P27
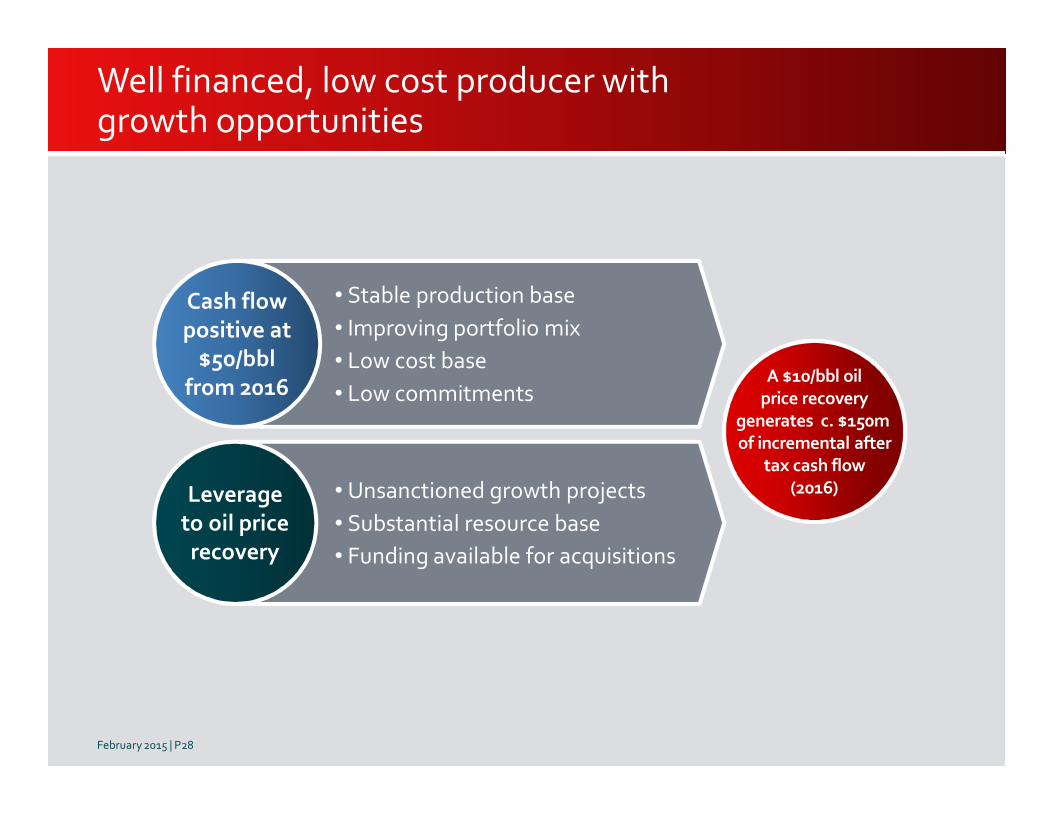
Well financed, low cost producer withgrowth opportunities
February 2015 | P28
A $10/bbl oil
price recovery
generates c. $150m
of incremental after
tax cash flow
(2016)• Unsanctioned growth projects
• Substantial resource base
• Funding available for acquisitions
Leverage
to oil price
recovery
• Stable production base
• Improving portfolio mix
• Low cost base
• Low commitments
Cash flow
positive at
$50/bbl
from 2016
Q&A
Premier Oil Plc
23 Lower Belgrave Street
London
SW1W 0NR
Tel: +44 (0)20 7730 1111
Fax: +44 (0)20 7730 4696
Email: [email protected]
www.premier-oil.com
February 2015