Preliminary Results of AP Computer Science Analyses · Preliminary Results of AP Computer Science...
9
Preliminary Results of AP Computer Science Analyses Page 1 of 9 Preliminary Results of AP Computer Science Analyses Jack Buckley July 2015
Transcript of Preliminary Results of AP Computer Science Analyses · Preliminary Results of AP Computer Science...
Preliminary Results of AP Computer Science Analyses Page 1 of 9
Preliminary Results of AP Computer Science Analyses
Jack Buckley
July 2015
Preliminary Results of AP Computer Science Analyses Page 2 of 9
Introduction
The purpose of this brief note is to document some exploratory analyses linking participation in AP Computer Science to subsequent performance in SAT Mathematics and AP Calculus and Statistics. None of these analyses should be interpreted as causal. Although there appears to be a relationship between AP CS participation and subsequent outcomes, it is highly likely that this is the result of one or more omitted and confounding characteristics of students that are not able to be controlled for given this research design.
Preliminary Results of AP Computer Science Analyses Page 3 of 9
Data and Results
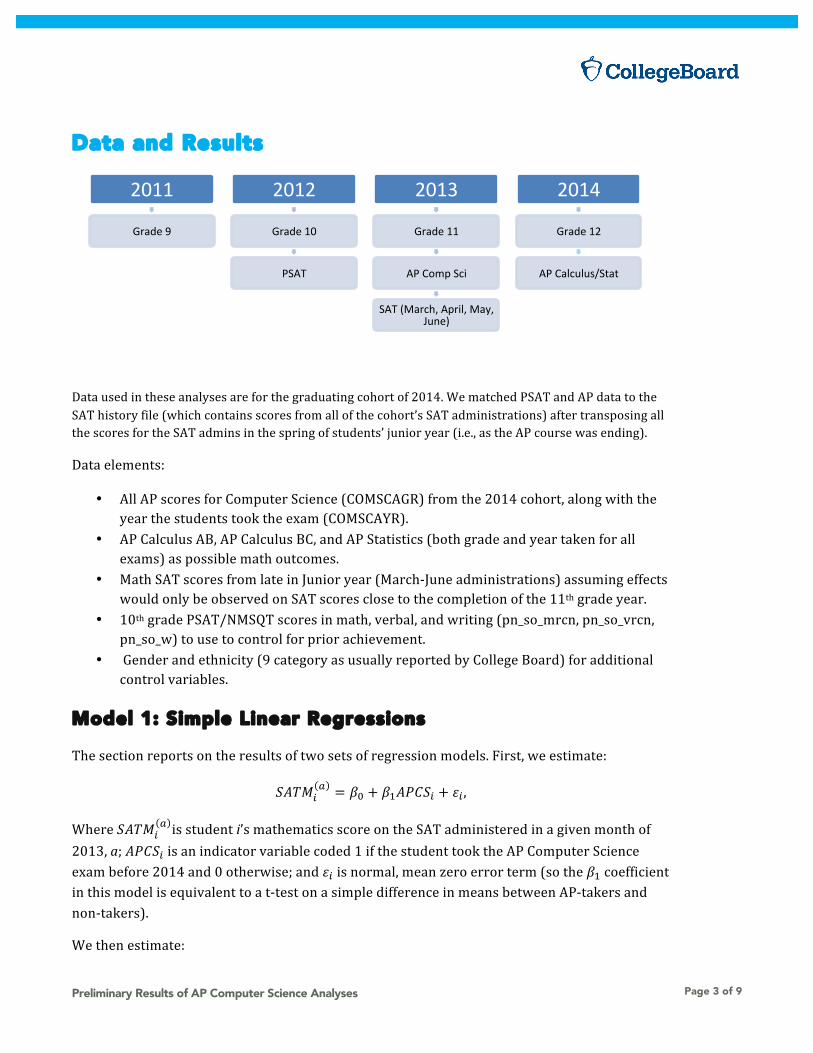
Data used in these analyses are for the graduating cohort of 2014. We matched PSAT and AP data to the SAT history file (which contains scores from all of the cohort’s SAT administrations) after transposing all the scores for the SAT admins in the spring of students’ junior year (i.e., as the AP course was ending).
Data elements:
• All AP scores for Computer Science (COMSCAGR) from the 2014 cohort, along with the year the students took the exam (COMSCAYR).
• AP Calculus AB, AP Calculus BC, and AP Statistics (both grade and year taken for all exams) as possible math outcomes.
• Math SAT scores from late in Junior year (March-‐June administrations) assuming effects would only be observed on SAT scores close to the completion of the 11th grade year.
• 10th grade PSAT/NMSQT scores in math, verbal, and writing (pn_so_mrcn, pn_so_vrcn, pn_so_w) to use to control for prior achievement.
• Gender and ethnicity (9 category as usually reported by College Board) for additional control variables.
Model 1: Simple Linear Regressions
The section reports on the results of two sets of regression models. First, we estimate:
𝑆𝐴𝑇𝑀!! = 𝛽! + 𝛽!𝐴𝑃𝐶𝑆! + 𝜀! ,
Where 𝑆𝐴𝑇𝑀!! is student i’s mathematics score on the SAT administered in a given month of
2013, a; 𝐴𝑃𝐶𝑆! is an indicator variable coded 1 if the student took the AP Computer Science exam before 2014 and 0 otherwise; and 𝜀! is normal, mean zero error term (so the 𝛽! coefficient in this model is equivalent to a t-‐test on a simple difference in means between AP-‐takers and non-‐takers).
We then estimate:
2011
Grade 9
2012
Grade 10
PSAT
2013
Grade 11
AP Comp Sci
SAT (March, April, May, June)
2014
Grade 12
AP Calculus/Stat
Preliminary Results of AP Computer Science Analyses Page 4 of 9
𝑆𝐴𝑇𝑀!! = 𝛽! + 𝛽!𝐴𝑃𝐶𝑆! + 𝛽!𝑃𝑆𝐴𝑇!
(!)!!!! + 𝛽!𝐹𝑒𝑚𝑎𝑙𝑒! + 𝛽!𝑅𝑎𝑐𝑒!
(!)!"!!! + 𝜀! ,
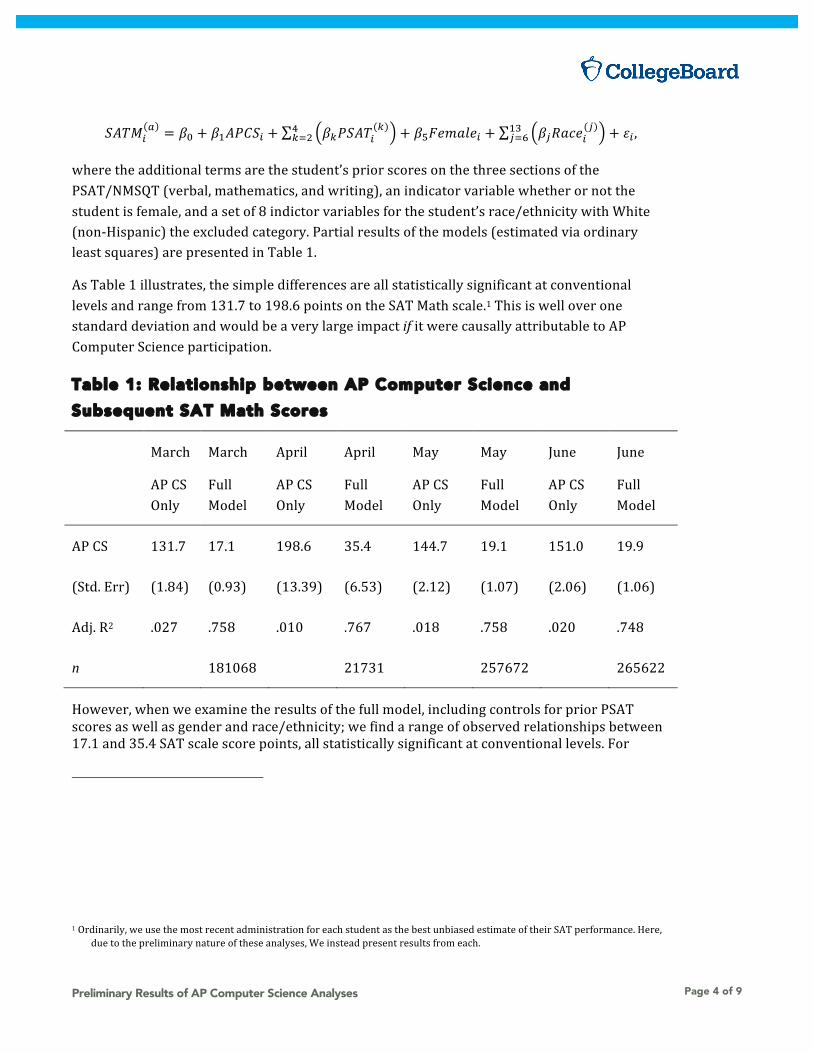
where the additional terms are the student’s prior scores on the three sections of the PSAT/NMSQT (verbal, mathematics, and writing), an indicator variable whether or not the student is female, and a set of 8 indictor variables for the student’s race/ethnicity with White (non-‐Hispanic) the excluded category. Partial results of the models (estimated via ordinary least squares) are presented in Table 1.
As Table 1 illustrates, the simple differences are all statistically significant at conventional levels and range from 131.7 to 198.6 points on the SAT Math scale.1 This is well over one standard deviation and would be a very large impact if it were causally attributable to AP Computer Science participation.
Table 1: Relationship between AP Computer Science and Subsequent SAT Math Scores
March
AP CS Only
March
Full Model
April
AP CS Only
April
Full Model
May
AP CS Only
May
Full Model
June
AP CS Only
June
Full Model
AP CS 131.7 17.1 198.6 35.4 144.7 19.1 151.0 19.9
(Std. Err) (1.84) (0.93) (13.39) (6.53) (2.12) (1.07) (2.06) (1.06)
Adj. R2 .027 .758 .010 .767 .018 .758 .020 .748
n 181068 21731 257672 265622
However, when we examine the results of the full model, including controls for prior PSAT scores as well as gender and race/ethnicity; we find a range of observed relationships between 17.1 and 35.4 SAT scale score points, all statistically significant at conventional levels. For
1 Ordinarily, we use the most recent administration for each student as the best unbiased estimate of their SAT performance. Here, due to the preliminary nature of these analyses, We instead present results from each.
Preliminary Results of AP Computer Science Analyses Page 5 of 9
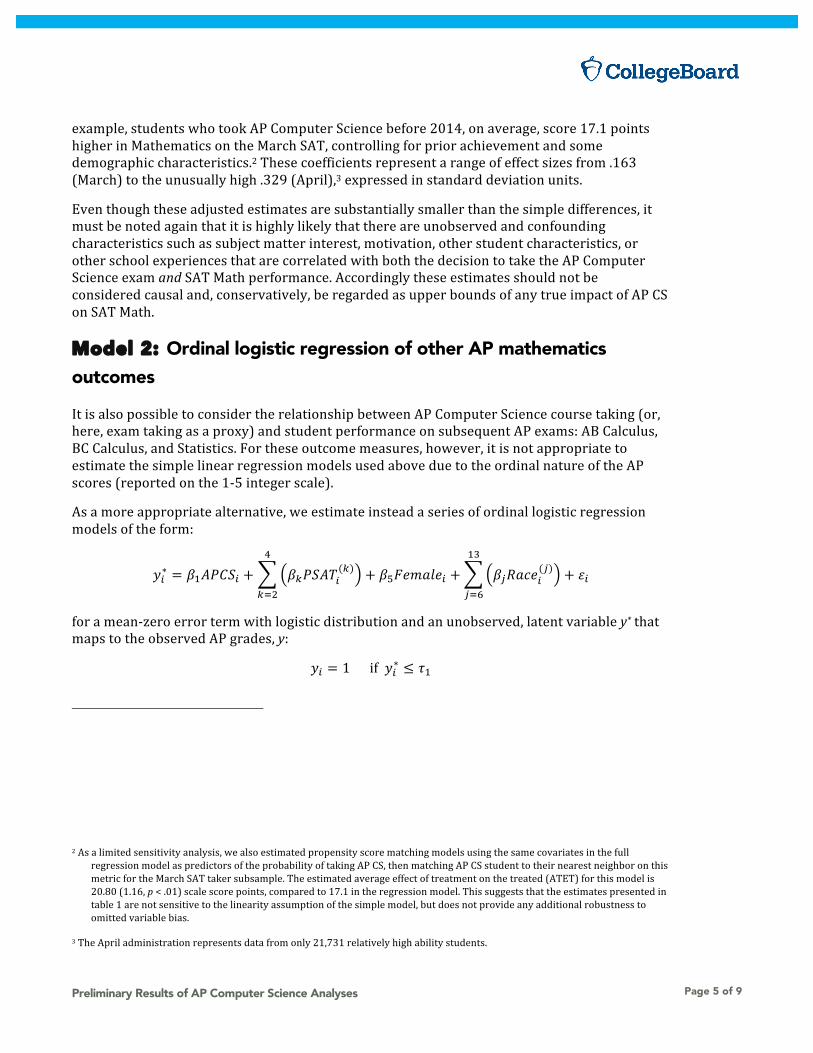
example, students who took AP Computer Science before 2014, on average, score 17.1 points higher in Mathematics on the March SAT, controlling for prior achievement and some demographic characteristics.2 These coefficients represent a range of effect sizes from .163 (March) to the unusually high .329 (April),3 expressed in standard deviation units.
Even though these adjusted estimates are substantially smaller than the simple differences, it must be noted again that it is highly likely that there are unobserved and confounding characteristics such as subject matter interest, motivation, other student characteristics, or other school experiences that are correlated with both the decision to take the AP Computer Science exam and SAT Math performance. Accordingly these estimates should not be considered causal and, conservatively, be regarded as upper bounds of any true impact of AP CS on SAT Math.
Model 2: Ordinal logistic regression of other AP mathematics outcomes
It is also possible to consider the relationship between AP Computer Science course taking (or, here, exam taking as a proxy) and student performance on subsequent AP exams: AB Calculus, BC Calculus, and Statistics. For these outcome measures, however, it is not appropriate to estimate the simple linear regression models used above due to the ordinal nature of the AP scores (reported on the 1-‐5 integer scale).
As a more appropriate alternative, we estimate instead a series of ordinal logistic regression models of the form:
𝑦!∗ = 𝛽!𝐴𝑃𝐶𝑆! + 𝛽!𝑃𝑆𝐴𝑇!(!)
!
!!!
+ 𝛽!𝐹𝑒𝑚𝑎𝑙𝑒! + 𝛽!𝑅𝑎𝑐𝑒!(!)
!"
!!!
+ 𝜀!
for a mean-‐zero error term with logistic distribution and an unobserved, latent variable y* that maps to the observed AP grades, y:
𝑦! = 1 if 𝑦!∗ ≤ 𝜏!
2 As a limited sensitivity analysis, we also estimated propensity score matching models using the same covariates in the full regression model as predictors of the probability of taking AP CS, then matching AP CS student to their nearest neighbor on this metric for the March SAT taker subsample. The estimated average effect of treatment on the treated (ATET) for this model is 20.80 (1.16, p < .01) scale score points, compared to 17.1 in the regression model. This suggests that the estimates presented in table 1 are not sensitive to the linearity assumption of the simple model, but does not provide any additional robustness to omitted variable bias.
3 The April administration represents data from only 21,731 relatively high ability students.
Preliminary Results of AP Computer Science Analyses Page 6 of 9
𝑦! = 2 if 𝜏! < 𝑦!∗ ≤ 𝜏!
⋮ 𝑦! = 5 if 𝑦!∗ > 𝜏!,
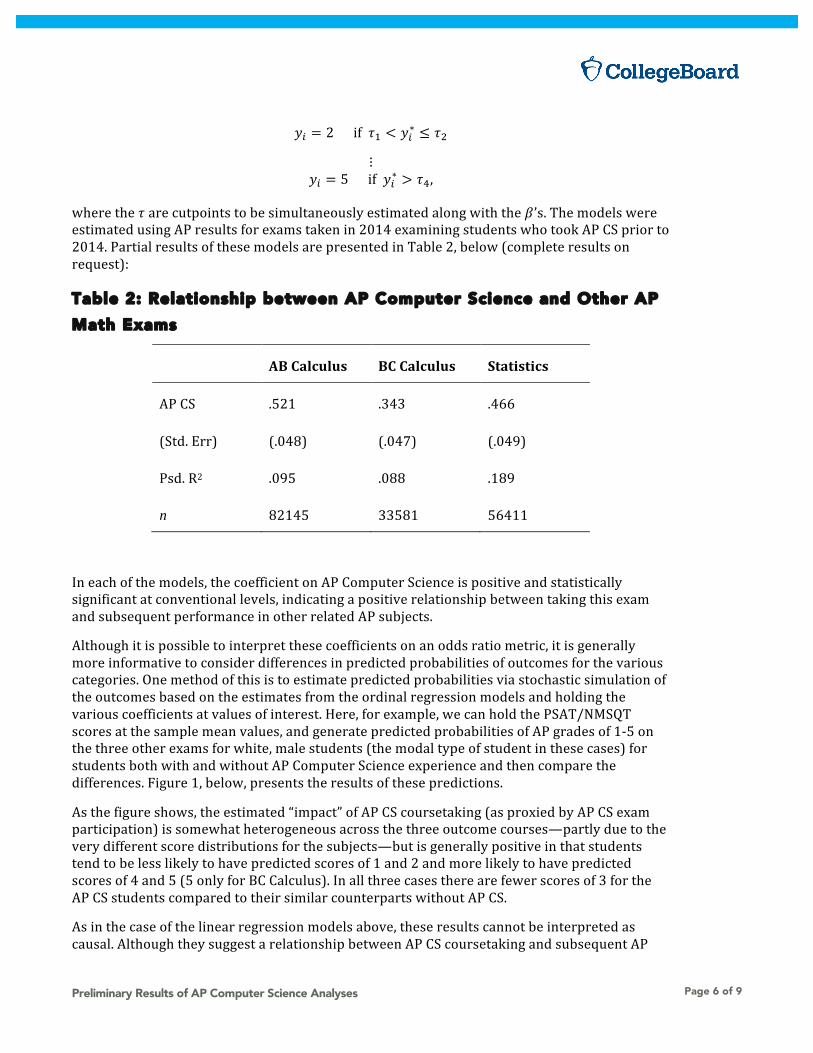
where the 𝜏 are cutpoints to be simultaneously estimated along with the 𝛽’s. The models were estimated using AP results for exams taken in 2014 examining students who took AP CS prior to 2014. Partial results of these models are presented in Table 2, below (complete results on request):
Table 2: Relationship between AP Computer Science and Other AP Math Exams
AB Calculus BC Calculus Statistics
AP CS .521 .343 .466
(Std. Err) (.048) (.047) (.049)
Psd. R2 .095 .088 .189
n 82145 33581 56411
In each of the models, the coefficient on AP Computer Science is positive and statistically significant at conventional levels, indicating a positive relationship between taking this exam and subsequent performance in other related AP subjects.
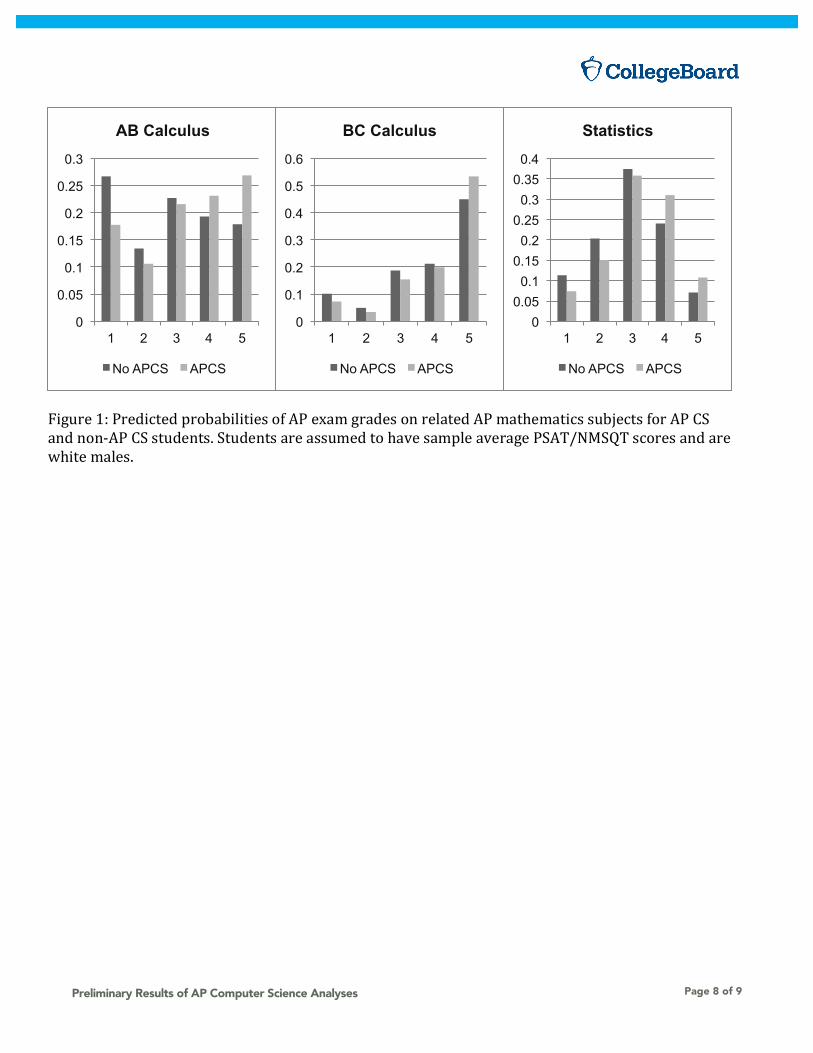
Although it is possible to interpret these coefficients on an odds ratio metric, it is generally more informative to consider differences in predicted probabilities of outcomes for the various categories. One method of this is to estimate predicted probabilities via stochastic simulation of the outcomes based on the estimates from the ordinal regression models and holding the various coefficients at values of interest. Here, for example, we can hold the PSAT/NMSQT scores at the sample mean values, and generate predicted probabilities of AP grades of 1-‐5 on the three other exams for white, male students (the modal type of student in these cases) for students both with and without AP Computer Science experience and then compare the differences. Figure 1, below, presents the results of these predictions.
As the figure shows, the estimated “impact” of AP CS coursetaking (as proxied by AP CS exam participation) is somewhat heterogeneous across the three outcome courses—partly due to the very different score distributions for the subjects—but is generally positive in that students tend to be less likely to have predicted scores of 1 and 2 and more likely to have predicted scores of 4 and 5 (5 only for BC Calculus). In all three cases there are fewer scores of 3 for the AP CS students compared to their similar counterparts without AP CS.
As in the case of the linear regression models above, these results cannot be interpreted as causal. Although they suggest a relationship between AP CS coursetaking and subsequent AP

Preliminary Results of AP Computer Science Analyses Page 7 of 9
success, it is again highly likely that there are additional confounding factors omitted from the model.
Preliminary Results of AP Computer Science Analyses Page 8 of 9
0
0.05
0.1
0.15
0.2
0.25
0.3
1 2 3 4 5
AB Calculus
No APCS APCS
0
0.1
0.2
0.3
0.4
0.5
0.6
1 2 3 4 5
BC Calculus
No APCS APCS
0 0.05
0.1 0.15
0.2 0.25
0.3 0.35 0.4
1 2 3 4 5
Statistics
No APCS APCS
Figure 1: Predicted probabilities of AP exam grades on related AP mathematics subjects for AP CS and non-‐AP CS students. Students are assumed to have sample average PSAT/NMSQT scores and are white males.
Preliminary Results of AP Computer Science Analyses Page 9 of 9
About the College Board The College Board is a mission-‐driven not-‐for-‐profit organization that connects students to college success and opportunity. Founded in 1900, the College Board was created to expand access to higher education. Today, the membership association is made up of over 6,000 of the world’s leading educational institutions and is dedicated to promoting excellence and equity in education. Each year, the College Board helps more than seven million students prepare for a successful transition to college through programs and services in college readiness and college success — including the SAT® and the Advanced Placement Program®. The organization also serves the education community through research and advocacy on behalf of students, educators and schools. For further information, visit www.collegeboard.org.