Jamie O’Mally, Ph.D.. Purpose Hypotheses Design & Procedures Data Sources Progress ...
30
Employment Among Transition-Age SSI Beneficiaries with Blindness Jamie O’Mally, Ph.D.
-
Upload
kristopher-nash -
Category
Documents
-
view
219 -
download
1
Transcript of Jamie O’Mally, Ph.D.. Purpose Hypotheses Design & Procedures Data Sources Progress ...
Employment Among Transition-Age SSI Beneficiaries with Blindness
Jamie O’Mally, Ph.D.
Overview
Purpose Hypotheses Design & Procedures Data Sources Progress Preliminary Results Future Analyses
Project Funding
Social Security Administration• Disability Research Consortium• Emerging Investigator Award

Purpose• Investigate individual and service factors that
influence employment outcomes for transition-age Supplemental Security Income (SSI) recipients who are blind or visually impaired.
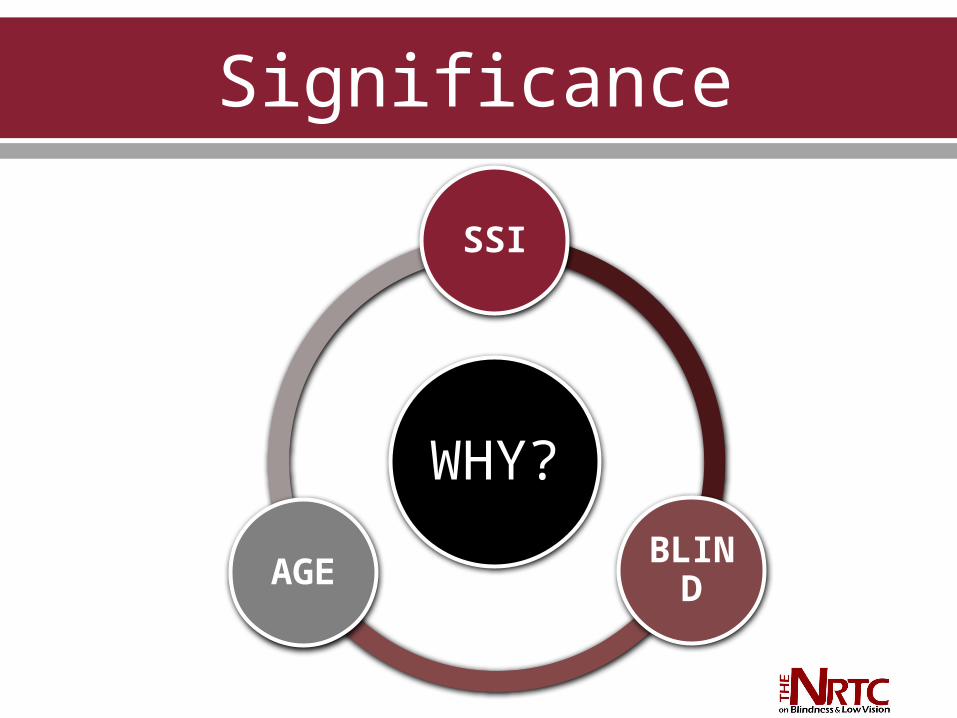
Significance
WHY?
SSI
BLINDAGE
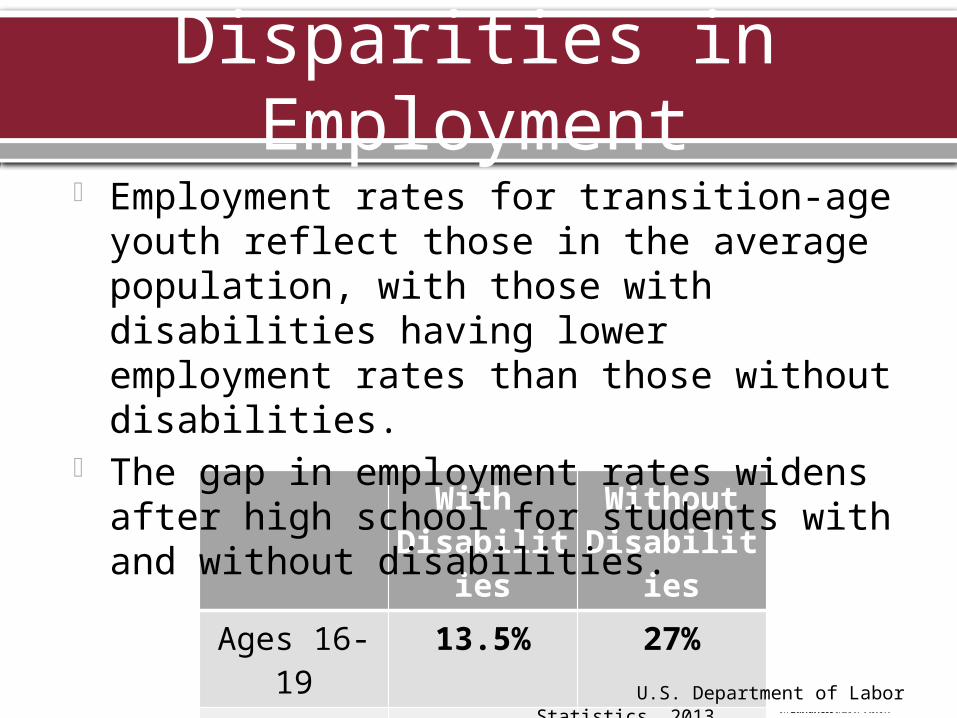
Disparities in Employment
With Disabilities
Without Disabilities
Ages 16-19 13.5% 27%
Ages 20-24 27.8% 62.5%
Employment rates for transition-age youth reflect those in the average population, with those with disabilities having lower employment rates than those without disabilities.
The gap in employment rates widens after high school for students with and without disabilities.
U.S. Department of Labor Statistics, 2013.

Employment Among B/VI
Unemployment rates are high for those with disabilities, especially for those with visual impairments.
Students with B/VI have the highest college attendance among students with disabilities but have difficulty finding employment
(Newman, Wagner, Cameto, & Knokey, 2009).

Reasons?
Why might college students who are B/VI have difficulty finding paid employment after graduating?

SSI Beneficiaries
SSI program provides cash benefits to children with disabilities and families who meet strict income-based criteria.
SSI benefits totaling $8 billion were distributed to 1,136,000 youth ages 13-25 in 2011 (SSA, 2012).
SSI may be a disincentive for obtaining employment among transition-age youth.• The odds of paid employment among transition-
age youth with disabilities is nearly double for those not receiving SSI (Berry, 2001).

Reasons?
Why might transition-age youth receiving SSI benefits be less likely to
work than those not receiving SSI?

Hypothesis
Both receipt of VR program services and individual characteristics play a role in
positive employment outcomes among blind transition-age SSI beneficiaries.
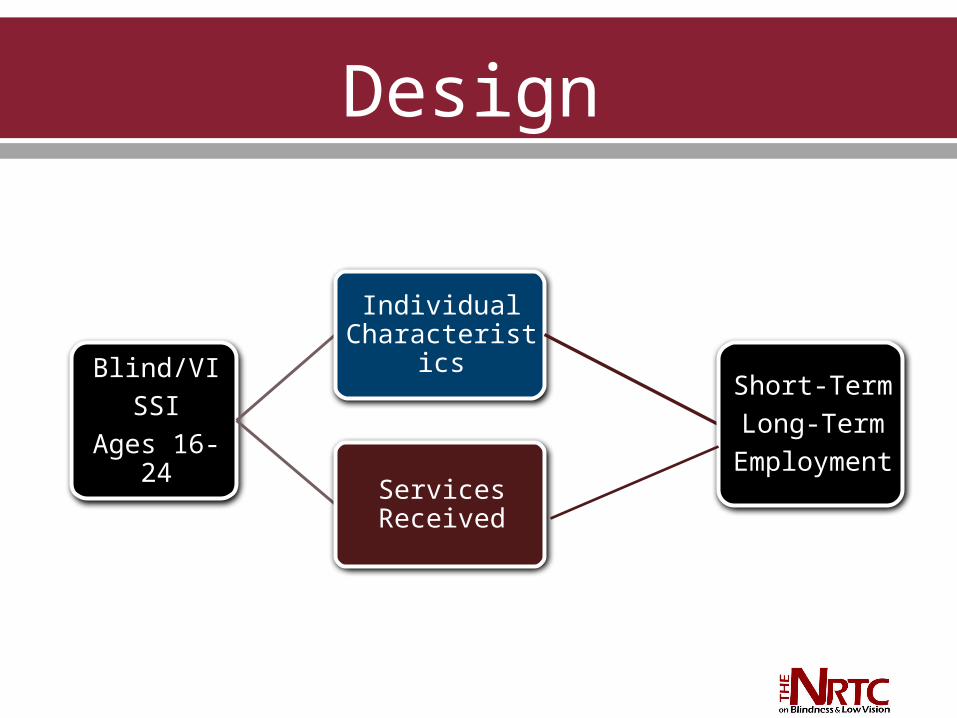
Design
Blind/VI
SSI
Ages 16-24
Individual Characteristics
Short-Term
Long-Term
EmploymentServices Received

The Role of VR Services are provided to assist individuals
in securing or maintaining employment. Services include:
1. job placement assistance
2. college training and technology
3. vocational supports
4. adjustment counseling
5. remedial training
Giesen & Cavenaugh, 2012
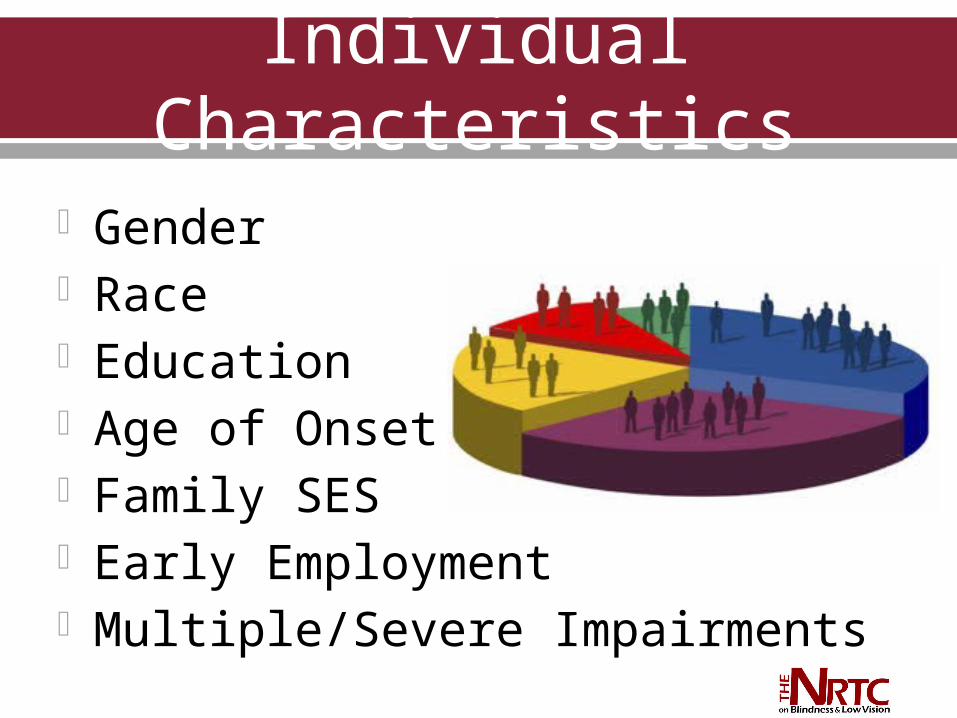
Individual Characteristics
Gender Race Education Age of Onset Family SES Early Employment Multiple/Severe Impairments

Data Sources
Restricted-use data Linked using SSN RSA-911 annual files
• Rehabilitation Services Administration Case Service Report (2002-2011)
Master Earnings File (MEF) • Later: longer term employment
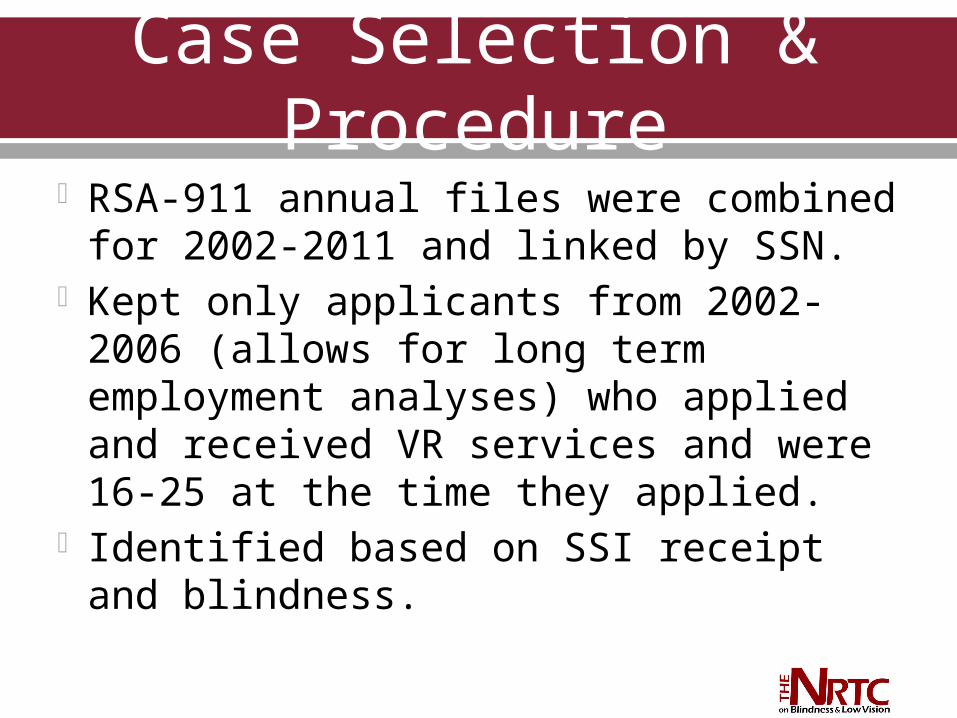
Case Selection & Procedure RSA-911 annual files were combined for
2002-2011 and linked by SSN. Kept only applicants from 2002-2006
(allows for long term employment analyses) who applied and received VR services and were 16-25 at the time they applied.
Identified based on SSI receipt and blindness.

Current Progress Descriptive information is currently
available.• Demographics• Services received• Employment at closure
Multivariate analyses on long term employment outcomes will be analyzed as the next step in this research.

Demographics N = 2,170 Ages 16-25, M = 20.6 53.5% Men, 46.5% Women Race
• 71% White• 24% African American• 5% Other races (Asian, Native Amer., Pac)
43% had a secondary impairment• 12% were cognitive
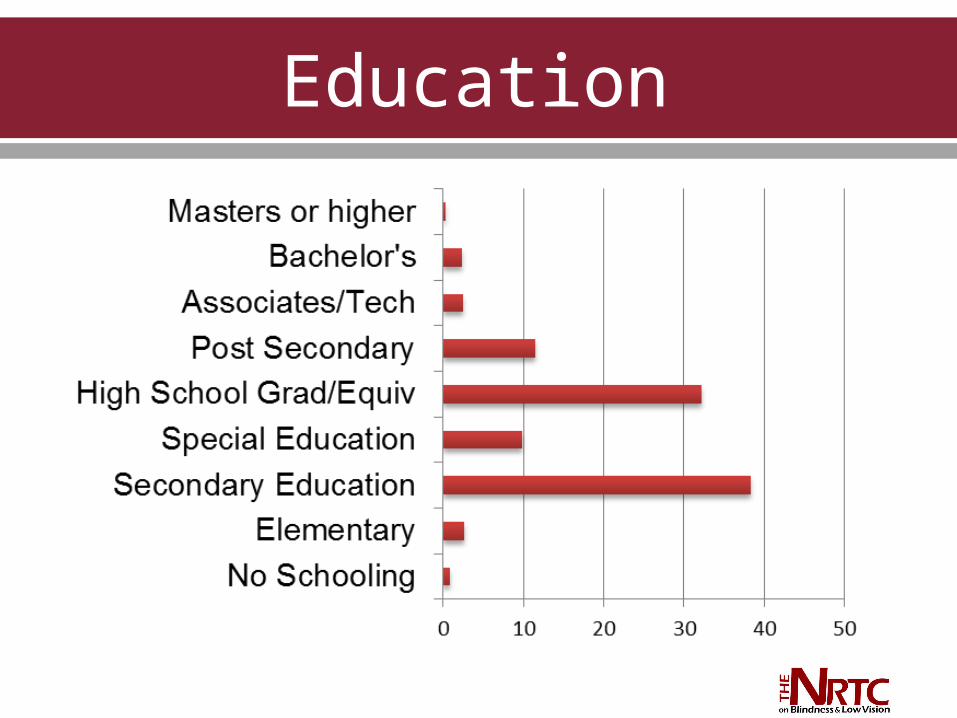
Education
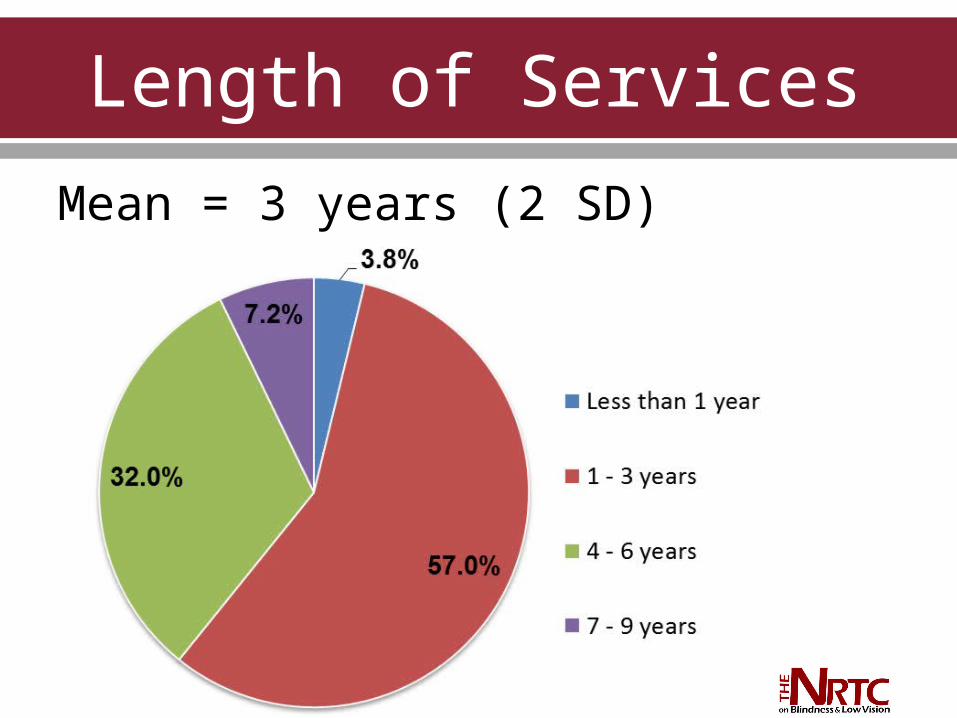
Length of Services
Mean = 3 years (2 SD)

Services Received

Employment Outcomes Competitive Employment Job Type at Closure Primary Source of Income Weekly earnings at application and
for successful closures
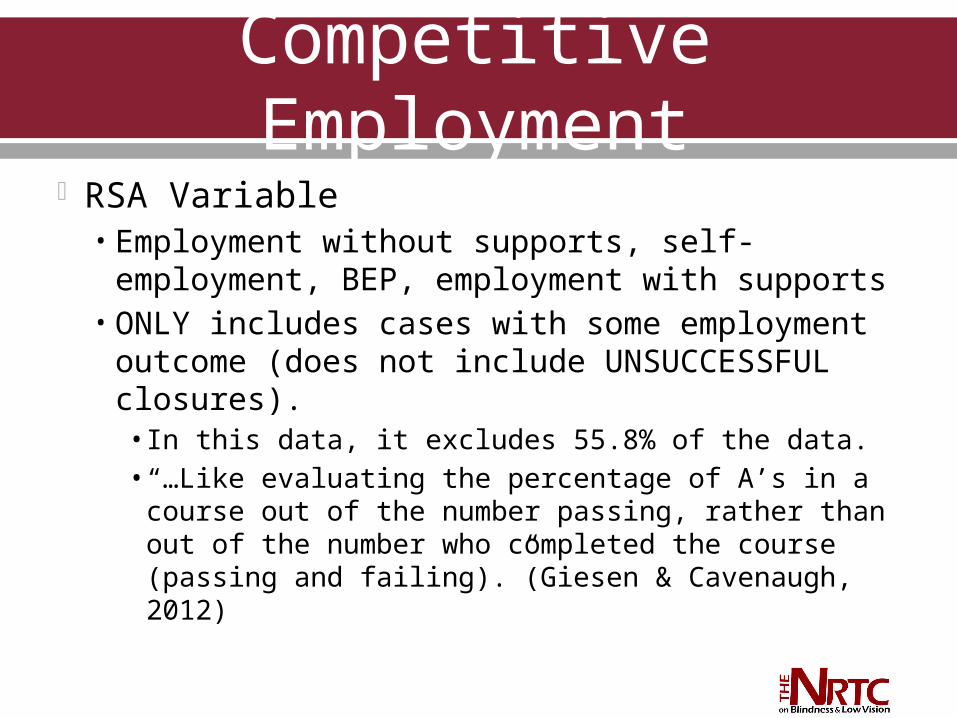
Competitive Employment RSA Variable
• Employment without supports, self-employment, BEP, employment with supports
• ONLY includes cases with some employment outcome (does not include UNSUCCESSFUL closures).• In this data, it excludes 55.8% of the data.• “…Like evaluating the percentage of A’s in a
course out of the number passing, rather than out of the number who completed the course (passing and failing).”(Giesen & Cavenaugh, 2012)
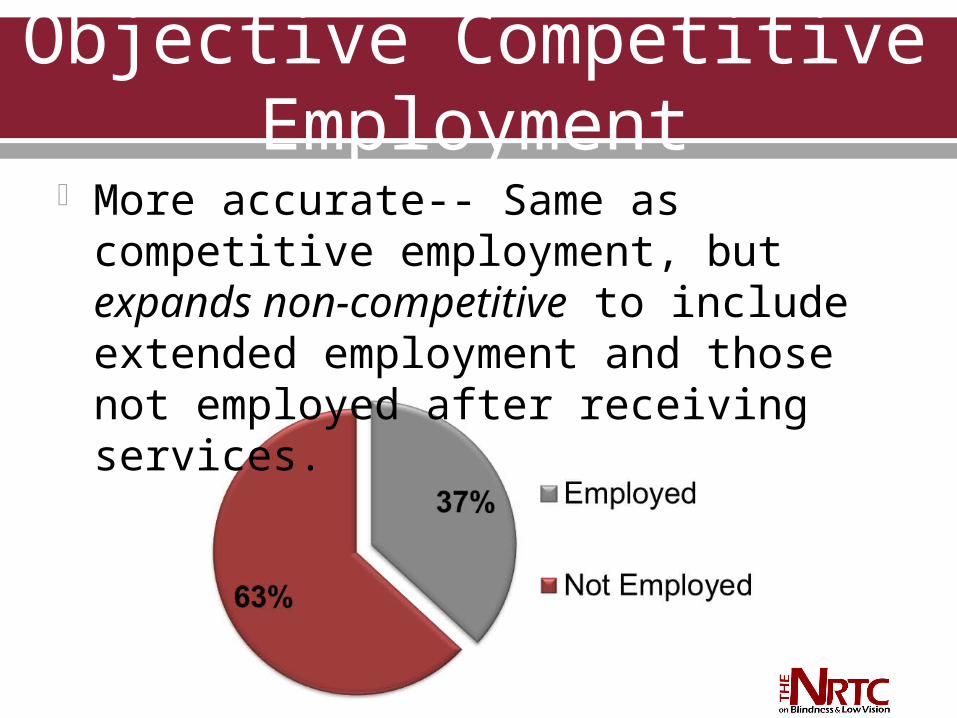
Objective Competitive Employment More accurate-- Same as competitive
employment, but expands non-competitive to include extended employment and those not employed after receiving services.
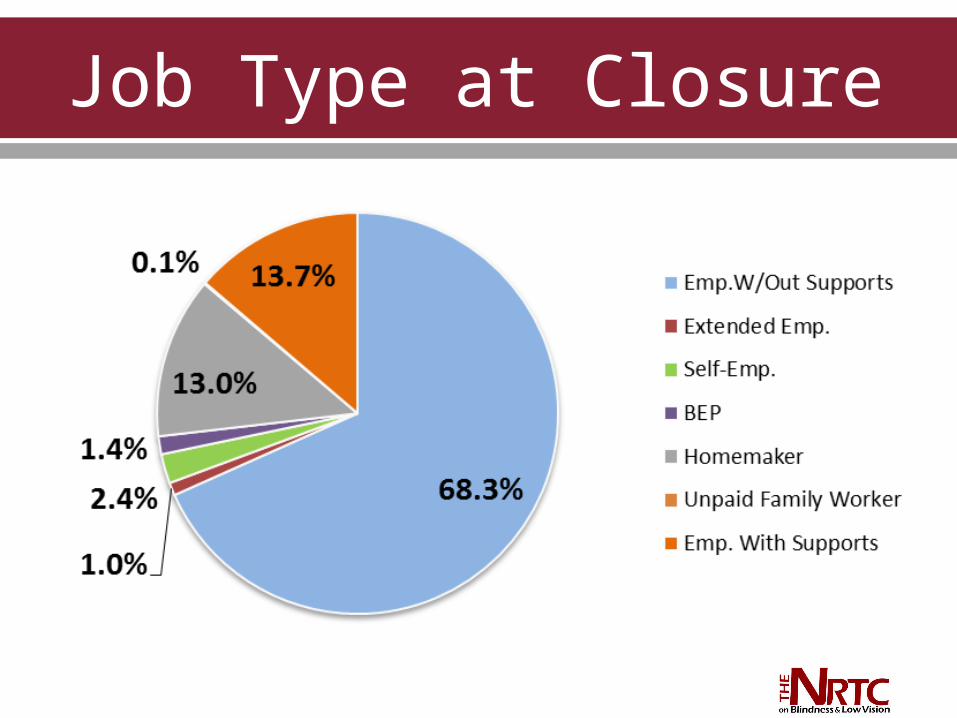
Job Type at Closure
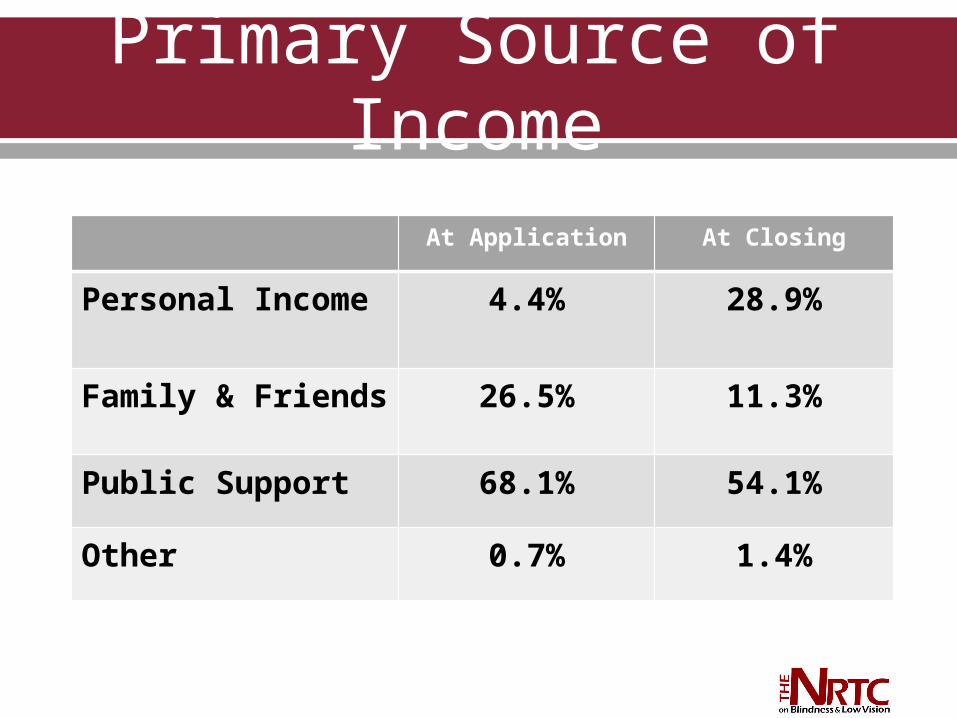
Primary Source of Income
At Application At Closing
Personal Income 4.4% 28.9%
Family & Friends 26.5% 11.3%
Public Support 68.1% 54.1%
Other 0.7% 1.4%

Weekly Earnings
At Application(ALL)
(N = 2170)
At Closing(Successful)
(N=959)
Range $0 - 800 $0 – 2,080
Mean $13 $254
Median $0 $209
Std. Dev. $55 $243
Future Analyses
Longitudinal analyses (LT employment) Individual and services received SSI vs. No SSI
Special Thanks
Soosan Shahrokh, Ph.D.Office of Program Development and Research
Social Security Administration

Contact Info
Jamie O’Mally, 662-325-2001
http://blind.msstate.edu