Preference Repaired)
57
CHAPTER – 1 SECTION-A INTRODUCTION TO THE TOPIC Dairy market has a great potential in a comparison with other markets of food product due to the popularization of this category of products in the recent years. The changes are very dynamic and are mainly affected by the degree with which market offer matches changing preferen ces of buyers which on the other hand are alteri ng together with a change in lifestyle of consumers that manifests it through: • increasing attention to the health and nutritional values of food products, • reduce of time spending on household activities, including preparing meals, • expectation of the convenience of food products, • expectation of the availability of food products. • expectation of the facility of preparation, The consequence of these changes is that consumers choose convenient food and food such as “light” or “diet”. Both of these groups include dairy products, especially modern, because modern products on dairy market have a great potential and there exists a low market saturation of this category of products. The highest milk producer in the entire globe – India boasts of that status. India is otherwise known as the ‘Oyster’ of the global dairy industry, with opportunities galore to the entrepreneurs globally. Anyone might want to capitalize on the largest and fastest growing milk and mil products' market. The dairy industry in India has been witnessing rapid growth. The liberalized economy provides more opportunities for MNCs and foreign investors to release the full potential of this industry. Potential for investment in the dairy industry Some areas of Indian dairy industry can be toned up by the evocation of differentiated technologies and equipment from overseas. These include: 1
-
Upload
amritpal-singh -
Category
Documents
-
view
229 -
download
0
Transcript of Preference Repaired)
8/4/2019 Preference Repaired)
http://slidepdf.com/reader/full/preference-repaired 1/57
CHAPTER – 1
SECTION-A
INTRODUCTION TO THE TOPIC
Dairy market has a great potential in a comparison with other markets of food product
due to the popularization of this category of products in the recent years. The changes
are very dynamic and are mainly affected by the degree with which market offer
matches changing preferences of buyers which on the other hand are altering together
with a change in lifestyle of consumers that manifests it through:
• increasing attention to the health and nutritional values of food products,
• reduce of time spending on household activities, including preparing meals,
• expectation of the convenience of food products,
• expectation of the availability of food products.
• expectation of the facility of preparation,
The consequence of these changes is that consumers choose convenient food and food
such as “light” or “diet”. Both of these groups include dairy products, especially
modern, because modern products on dairy market have a great potential and there
exists a low market saturation of this category of products.
The highest milk producer in the entire globe – India boasts of that status. India is
otherwise known as the ‘Oyster’ of the global dairy industry, with opportunities
galore to the entrepreneurs globally. Anyone might want to capitalize on the largest
and fastest growing milk and mil products' market. The dairy industry in India has
been witnessing rapid growth. The liberalized economy provides more opportunities
for MNCs and foreign investors to release the full potential of this industry.
Potential for investment in the dairy industry
Some areas of Indian dairy industry can be toned up by the evocation of differentiated
technologies and equipment from overseas. These include:
1
8/4/2019 Preference Repaired)
http://slidepdf.com/reader/full/preference-repaired 2/57
1. Raw milk handling: The raw milk handling needs to be elevated in terms of
physicochemical and microbiological properties of the milk in a combined
manner. The use of clarification and bactofugation in raw milk processing can
aid better the quality of the milk products.
2. Milk processing: Better operational ratios are required to amend the yields and
abridge wastage, lessen fat/protein losses during processing, control
production costs, save energy and broaden shelf life. The adoption of GMP
(Good Manufacturing Practices) and HACCP (Hazard Analysis Critical
Control Points) would help produce milk products adapting to the international
standards.
3. Packaging: Another area that can be improved is the range of packing
machines for the manufacture of butter, cheese and alike. Better packaging can
assist in retaining the nutritive value of products packed and thus broaden the
shelf life. A cold chain distribution system is required for proper storage and
transfer of dairy products.
4. Value-added products: There's vast scope for value-added products like
desserts, puddings, custards, sauces, mousse, stirred yoghurt, nectars and
sherbets to capture the dairy market in India.
The Indian dairy industry has aimed at better mananamegemt of the national resources
to enhance milk production and upgrade milk processing involving new innovative
technologies. Multinational dairy giants can also make their foray in the Indian dairy
market in this challenging scenario and create a win-win situation for both.
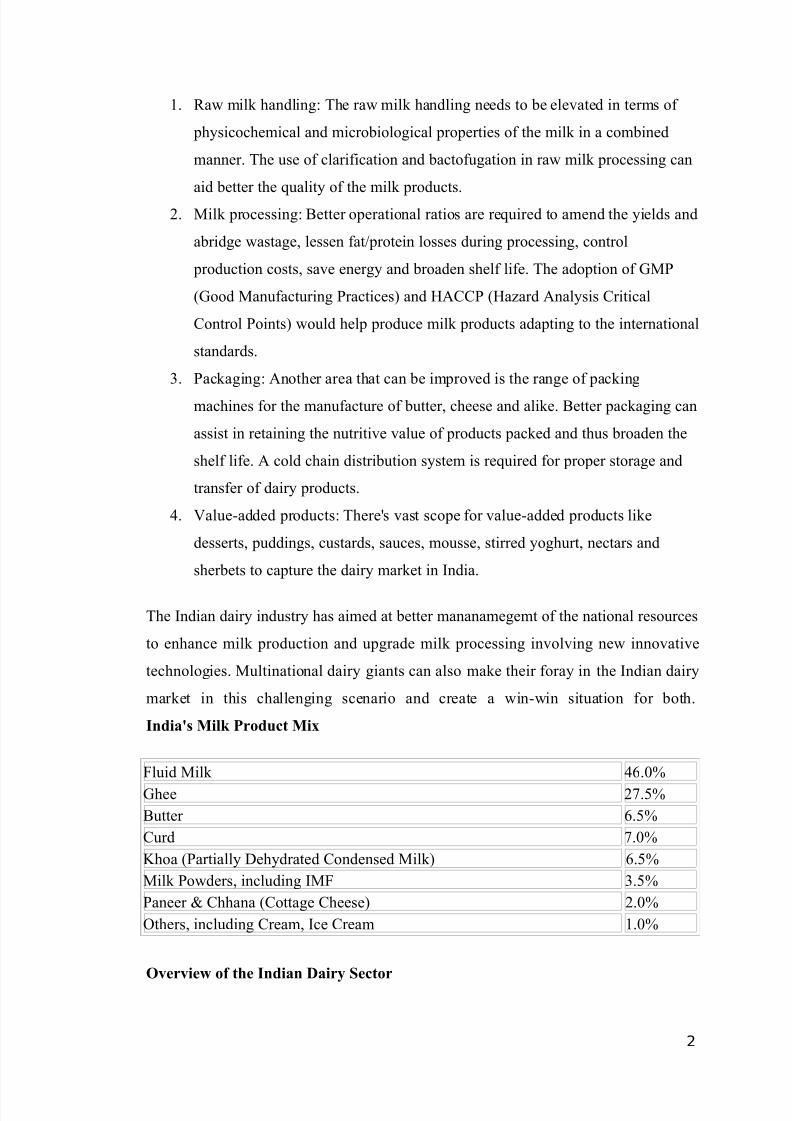
India's Milk Product Mix
Fluid Milk 46.0%
Ghee 27.5%
Butter 6.5%
Curd 7.0%
Khoa (Partially Dehydrated Condensed Milk) 6.5%
Milk Powders, including IMF 3.5%
Paneer & Chhana (Cottage Cheese) 2.0%
Others, including Cream, Ice Cream 1.0%
Overview of the Indian Dairy Sector
2

8/4/2019 Preference Repaired)
http://slidepdf.com/reader/full/preference-repaired 3/57
• The country is the largest milk producer all over the world, around 100
million MT
• Value of output amounted to ` 1179 billion (in 2004-05) (Approximately
equals combined output of paddy and wheat!!)
• 1/5thof the world bovine population
• Milch animals (45% indigenous cattle, 55 % buffaloes, and 10% cross bred
cows)
• Immensely low productivity, around 1000 kg/year (world average 2038
kg/year)
• Large no. of unproductive animals, low genetic potency, poor nutrition and
lack of services are the main factors for the low productivity
• There are different regions – developed, average, below average (eastern
states of Orissa, Bihar and NE region) in the dairy industry.
The market size of the dairy industry was $45 billion in 2006-07 and it is estimated to
grow to $83 billion by 2015. The processed dairy category accounts for 73 per cent in
value terms and 35 per cent in volume terms. The processed market is $32.9 billion in
value terms. The organised sector contributes 24 per cent or $7.9 billion to the
processed category. Sweets, homemade ghee and yogurt contribute significantly to the
organised segment.
1.1 CONSUMER PREFERENCES
Consumer preference may be defined as “The power or ability to choose one thing
over another with the anticipation that the choice will result in greater satisfaction,
greater capability or improved performance.” The underlying foundation of demand,
therefore, is a model of how consumers behave. The individual consumer has a set of
preferences and values whose determinations are outside the realm of economics.
They are no doubt dependent upon culture, education, and individual tastes, among a
plethora of other factors. The measure of these values in this model for a particular
good is in terms of the real opportunity cost to the consumer who purchases and
consumes the good. If an individual purchases a particular good, then the opportunity
cost of that purchase is the forgone goods the consumer could have bought instead.
1.2 THE THEORY OF THE CONSUMER
A consumer is someone who buys or uses things (goods) or services.
3
8/4/2019 Preference Repaired)
http://slidepdf.com/reader/full/preference-repaired 4/57
• GOODS are things we use like food.
• SERVICES are things that other people do for us. Service may be defined as”
an activity or benefit that one party offers to another”. It is essentially tangible
and does not result in ownership of anything. Its production may or may not be tied to physical products.
The "consumer" is the one who consumes the goods and services produced. Mahatma
Gandhi said a customer is the most important visitor in our premises. He is not
dependent on us, we are on him. He is not an interruption to our work, he is the
purpose of it.
Typically when business people talk of consumers they are talking about person asconsumer , an aggregated commodity item with little individuality other than that
expressed in the buy/not-buy decision. However there is a trend in marketing to
individualize the concept. Instead of generating broad demographic
profiles and psycho-graphic profilesof market segments, marketers have started to
engage in personalized marketing, permission marketing, and mass customization.
Consumer make decisions by allocating their scarce income across all possible goods
in order to obtain the greatest satisfaction. Formally, we say that consumers maximize
their utility subject to budget constraint. Utility is defined as the satisfaction that a
consumer derives from the consumption of a good. As noted above, utility’s
determinants are decided by a host of noneconomic factors. Consumer value is
measured in terms of the relative utilities between goods. These reflect the
consumer’s preferences.
1.3 THE THEORY OF CONSUMER PREFERENCES
Consumer preferences are defined as the subjective (individual) tastes, as measured
by utility, of various bundles of goods. They permit the consumer to rank these
bundles of goods according to the levels of utility they give the consumer. Note that
preferences are independent of income and prices. Ability to purchase goods does not
determine a consumer’s likes or dislikes. One can have a preference for Porsches over
Fords but only have the financial means to drive a Ford.
1.4 IMPORTANCE OF CONSUMER PREFERENCE
4

8/4/2019 Preference Repaired)
http://slidepdf.com/reader/full/preference-repaired 5/57
Consumer preference for a product can make or break a company. If consumers
generally like a product, it can stay around for years and sell millions of copies.
However, if consumers do not like the product, it could disappear very quickly if the
company cannot figure out how to fix the problem.
Many consumers choose to buy white cars instead of red or blue no matter what brand
the car is, where it was built or how many cup holders it has. This is a consumer
preference. Why is white the most popular car colour? Some people say it is because
it signifies purity or even technology. The colour of a car has nothing to do with how
the car functions, so logic would say that all colours would sell the same amount or
car manufacturers would only produce one colour. However, this is not the case.
Those manufacturers produce many colours, including twice as many in white, or
whichever colour is trendy or popular at the time.
1.5 DIFFERENCE OF OPINION
Sometimes, consumer preferences may lead to negative results. Shampoo companies
found that their customers associate suds with cleanliness, leading them to add
sudsing agents to their products even though the amount of suds has nothing to do
with how well the shampoos clean hair. The first company to add more suds to their
formula was able to use it as a marketing and promotional advantage. Other
companies followed suit, leading to a sudsiness competition.
Unfortunately, the more sudsy the lather, the worse the shampoo will clean. This is
true for two reasons. According to the Fox Avenue Salon website, "First, the
extremely sudsy shampoo takes much longer to rinse out of your hair, resulting in
excessive use of water. Secondly, with so many suds the hair doesn't seem to get as
clean." So, instead of manufacturers educating customers on how shampoo works,they add chemicals to adjust their products to the consumer preference.
1.6 HOW COMPANIES FIND CONSUMER PREFERENCES
Companies routinely test the market to find out what customers like and dislike about
their products and competitors' products. This is usually done by an internal
marketing department or outsourced to a market research firm. Phone interviews,
paper surveys, electronic surveys, focus groups and consumer samplings are common
methods for gathering information.
5

8/4/2019 Preference Repaired)
http://slidepdf.com/reader/full/preference-repaired 6/57
Market Research Example
Here is a popular example of market research: A customer has finished shopping and
paying for merchandise at a local grocery store. Before handing the receipt to her, the
cashier points to and explains that she has been invited to participate in a short survey
about her visit. If she chooses to participate, she will receive $5 off her next visit and
a chance to win a large monetary grand prize.
1.7 HOW COMPANIES USE THIS INFORMATION
After gathering information, the next step for the company is to determine what it
means. Analysis of the information may lead the company to change the formula,
packaging, colour, size or some other feature of the product. In the case of the suds in
the shampoo, the manufacturers may find that customers are continuing to prefer and
associate the foamy lather with high quality cleanliness, leading them to keep the
same formula or decide to add even more of the sudsing agent.
1.8 THE NEED TO UNDERSTAND CUSTOMER PREFERENCE
Have you ever wondered why your company often loses relatively satisfied
customers? Why is it that customers will often indicate they are satisfied with how
they have been treated but then leave for a competitor at the first opportunity? Why is
customer defection often unrelated to price? The answers to these and other related
questions are found in coming to an understanding of customer preference.
The idea that customers prefer one product or one service over another is not new.
The ability to identify and measure the elements of such preference decisions with
any accuracy and reliability has only recently become available.
Research into this area of consumer behavior has brought understanding to some of
the major issues with standard customer satisfaction research. Most importantly, we
have come to realize that high customer satisfaction does not assure continued
customer preference. Satisfaction research over the past fifteen years demonstrates
that high satisfaction scores, while a measure of corporate performance on a set of
important criteria, do not adequately explain the composition of preference formation
and therefore often serve as insufficient predictors of sustained preference or what is
normally referred to as customer loyalty.
6
8/4/2019 Preference Repaired)
http://slidepdf.com/reader/full/preference-repaired 7/57
Loyalty as a concept has also shown itself to be difficult to define. Like beauty,
loyalty is truly in the eye of the beholder. We understand there are different types and
degrees of loyalty and some of these are not appropriate in describing the relationship
between a consumer and a company. However, preference has demonstrated the
ability to be effectively measured and to provide meaningful insight into the choices
consumers make when selecting one provider over another and when determining to
continue a relationship over time.
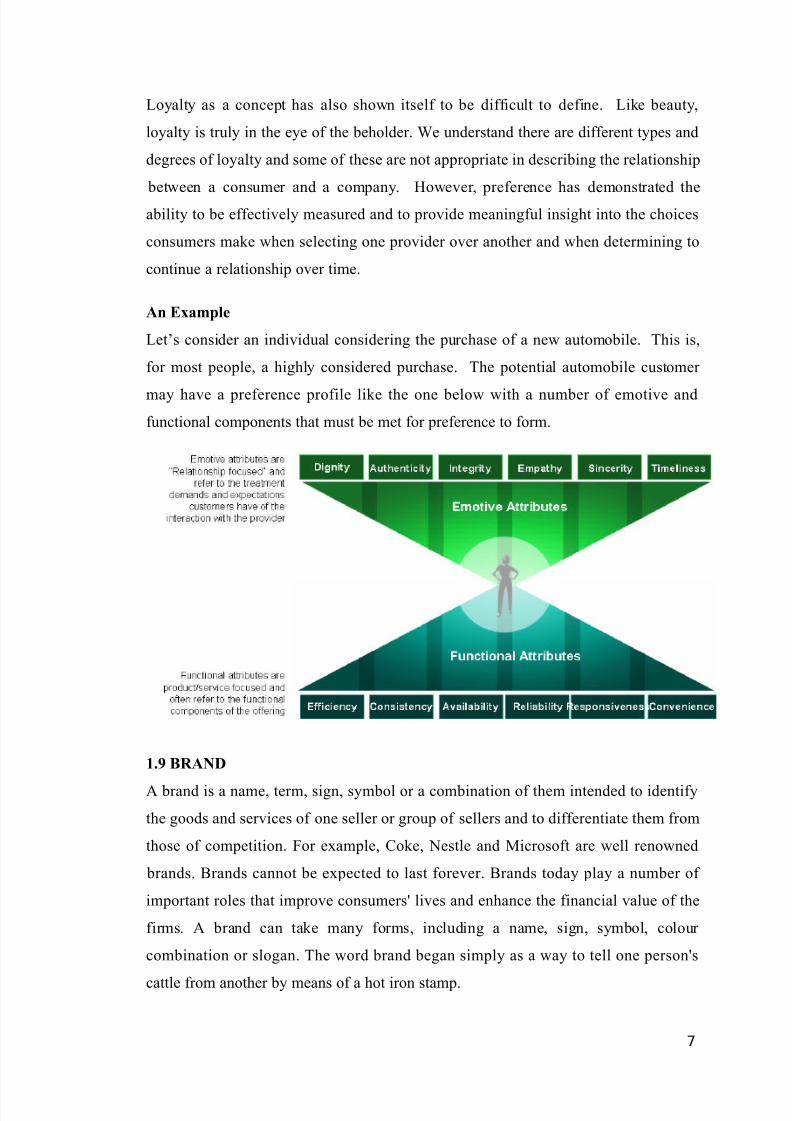
An Example
Let’s consider an individual considering the purchase of a new automobile. This is,
for most people, a highly considered purchase. The potential automobile customer
may have a preference profile like the one below with a number of emotive and
functional components that must be met for preference to form.
Meaning of Brand
1.9 BRAND
A brand is a name, term, sign, symbol or a combination of them intended to identify
the goods and services of one seller or group of sellers and to differentiate them from
those of competition. For example, Coke, Nestle and Microsoft are well renowned
brands. Brands cannot be expected to last forever. Brands today play a number of
important roles that improve consumers' lives and enhance the financial value of the
firms. A brand can take many forms, including a name, sign, symbol, colour
combination or slogan. The word brand began simply as a way to tell one person's
cattle from another by means of a hot iron stamp.
7
8/4/2019 Preference Repaired)
http://slidepdf.com/reader/full/preference-repaired 8/57
Some people distinguish the psychological aspect, brand associations like thoughts,
feelings, perceptions, images, experiences, beliefs, attitudes, and so on that become
linked to the brand, of a brand from the experiential aspect. The experiential aspect
consists of the sum of all points of contact with the brand and is known as the brand
experience. The psychological aspect, sometimes referred to as the brand image, is a
symbolic construct created within the minds of people, consisting of all the
information and expectations associated with a product, service or the company
providing them.
Brand is the personality that identifies a product, service or company (name, term,
sign, symbol, or design, or combination of them) and how it relates to key
constituencies: customers, staff, partners, investors etc. Some people distinguish the
psychological aspect, brand associations like thoughts, feelings, perceptions, images,
experiences, beliefs, attitudes, and so on that become linked to the brand, of a brand
from the experiential aspect.
The experiential aspect consists of the sum of all points of contact with the brand and
is known as the brand experience. The psychological aspect, sometimes referred to as
the brand image, is a symbolic construct created within the minds of people,
consisting of all the information and expectations associated with a product, service or
the company(ies) providing them.
People engaged in branding seek to develop or align the expectations behind the
brand experience, creating the impression that a brand associated with a product or
service has certain qualities or characteristics that make it special or unique. A brand
is therefore one of the most valuable elements in an advertising theme, as it
demonstrates what the brand owner is able to offer in the marketplace. The art of creating and maintaining a brand is called brand management. Orientation of the
whole organization towards its brand is called brand orientation.
Careful brand management seeks to make the product or services relevant to the target
audience. Brands should be seen as more than the difference between the actual cost
of a product and its selling price - they represent the sum of all valuable qualities of a
product to the consumer.
8
8/4/2019 Preference Repaired)
http://slidepdf.com/reader/full/preference-repaired 9/57
A brand which is widely known in the marketplace acquires brand recognition. When
brand recognition builds up to a point where a brand enjoys a critical mass of positive
sentiment in the marketplace, it is said to have achieved brand franchise. One goal in
brand recognition is the identification of a brand without the name of the company
present. For example, Disney has been successful at branding with their particular
script font (originally created for Walt Disney's "signature" logo), which it used in the
logo for go.com.
1.10 BRAND POSITIONING
Effective Brand Positioning is contingent upon identifying and communicating a
brand's uniqueness, differentiation and verifiable value. It is important to note that
"me too" brand positioning contradicts the notion of differentiation and should be
avoided at all costs. This type of copycat brand positioning only works if the business
offers its solutions at a significant discount over the other competitor(s).
Generally, the brand positioning process involves:
1. Identifying the business's direct competition (could include tertiary players
that offer your product/service amongst a larger portfolio of solutions)
2. Understanding how each competitor is positioning their business today (e.g.
claiming to be the fastest, cheapest, largest, the #1 provider, etc.)
3. Documenting the provider's own positioning as it exists today (may not exist if
startup business)
4. Comparing the company's positioning to its competitors' to identify viable
areas for differentiation
5. Developing a distinctive, differentiating and value-based brand positioning
statement, key messages and customer value propositions.
1.10.1 BRAND POSITIONING STRATEGIES
• Overall strategies
Since its introduction, Titan has been positioned as a premium brand,
providing high quality products. With its numerous sub-brands catering to different
segments, the challenge that Titan faces is to create a strong brand image. It follows
different positioning strategies; these strategies can also be analyzed as given below:
• Attribute Positioning:
9
8/4/2019 Preference Repaired)
http://slidepdf.com/reader/full/preference-repaired 10/57
When the company launched its products, it was the first to bring quartz
watches to the Indian market. The company successfully leveraged this to penetrate
the market and gain a market share. Raga, Classique and Regalia come under this
strategy. Classique has been positioned as elegant corporate wear that leaves a quiet,
but definite impression and fusion of function and sophistication. Power dressing now
has a new weapon! As Magic in gold and bicolor look, the 'Regalia' range represents
the essence of dress-wear. Raga has been differentiated and positioned as exclusive
watches for women. The Raga and Silver Raga collection is elegant, delicate and
feminine with each piece being truly unique.
• User Positioning:
Titan caters to several user groups- children (the Dash), sportspersons and
adventurers (PSI4000 and Fastrack range). The Fastrack range is seen as being
contemporary, sturdy and reliable. The advertising, packaging and merchandising of
this range is young, vibrant and ‘cool’ (the ad line says “Cool watches by Titan”)
• Benefit Positioning:
The Fastrack Digital range offers the customer a functional watch that is also
attractive. The digital watch has a “techno-geek” image, but Titan seeks to
differentiate its offering on the basis of superior style and attractiveness.
• Competitor Positioning:
With the entry of several foreign watchmakers into the market, Titan had to
counter the threat. Most of the entrants are catering to the upper end of the market-
Omega, Tissot, Cartier etc. Titan already had the Tanishq brand in this segment.
However, it has tried to reposition this brand by increasing the price range to
encourage more customers.
• Quality or Price Positioning:
In the overseas market, especially in Europe where it is competing with Swiss
and Japanese watches, it is positioning itself as ‘value- for- money’: reasonably priced
(less than Swiss watches and higher than Japanese), attractively styled and of good
quality. In Indian market, Sonata is a perfect example of Price positioning, titan came
up with this segment when it was facing heavy competition from lower end segment.
10
8/4/2019 Preference Repaired)
http://slidepdf.com/reader/full/preference-repaired 11/57
1.11 CONSUMER AND BRANDING
Consumers may look on branding as an important value added aspect of products or
services, as it often serves to denote a certain attractive quality or characteristic (see
also brand promise). From the perspective of brand owners, branded products or
services also command higher prices. Where two products resemble each other, but
one of the products has no associated branding (such as a generic, store-branded
product), people may often select the more expensive branded product on the basis of
the quality of the brand or the reputation of the brand owner.
People begin to develop preferences at a very early age. Within any product category,
most consumers have a group of brands that comprise their preference set. These are the
four or five up market brands the consumer will consider when making a purchase.
When building preference, the goal is to first get on the consumer’s preference sets, and
then to move up the set’s hierarchy to become the brand consumers prefer the most –
their upmarket brand. Gaining and maintaining consumer preference is a battle that is
never really won.
In every product category, consumers have more choices, more information and higher
expectations than ever before. To move consumers from trial to preference, brands need
to deliver on their value proposition, as well as dislodge someone else from the
consumer's existing preference set.
Preference is a scale, and brands move up, down and even off that scale with and
without a vigilant brand management strategy. Pricing, promotional deals and product
availability all have tremendous impact on the position of our brand in the consumer’s
preference set. If all things are equal, the best defence is to make us more relevant to
consumers than the competition. The brands potential can only be fulfilled bycontinually reinforcing its perceived quality, upmarket identity and relevance to the
consumer. The same branding activities that drive awareness also drive preference.
And, while awareness alone will not sustain preference, it will improve the brand’s
potential for building and maintaining preference.
1.12 FACTORS AFFECTING THE CONSUMER PREFERENCES
A consumer's decision to buy a product is the result of interplay of many factors. The
process of choosing is a complex phenomenon. Selection of a product or service goes
11
8/4/2019 Preference Repaired)
http://slidepdf.com/reader/full/preference-repaired 12/57
through a set of stages, especially for the selection of durable products. The customer
has to spend much time to think, evaluate and choose the desired brand based on
his/her requirements. After the opening up of the economy during the 1990s, with
proliferation of products and services from global players, the consumers found it
very hard to choose the right product or services. (Dharmaraj and Sudhahar, 2010)
A number of factors involve consumer choices. In some cases, consumers will be
more motivated . For example, one may be more careful choosing a gift for an in-law
than when buying the same thing for one self. Some consumers are also more
motivated to comparison shop for the best prices, while others are more convenience
oriented. Personality impacts decisions. Some like variety more than others, and
some are more receptive to stimulation and excitement in trying new stores.
Perception influences decisions. Some people, for example, can taste the difference
between generic and name brand foods while many cannot. Selective perception
occurs when a person is paying attention only to information of interest. For example,
when looking for a new car, the consumer may pay more attention to car ads than
when this is not in the horizon. Some consumers are put off by perceived risk . Thus,
many marketers offer a money back guarantee. Consumers will tend to change their
behavior through learning—e.g., they will avoid restaurants they have found to becrowded and will settle on brands that best meet their tastes. Consumers differ in the
values they hold (e.g., some people are more committed to recycling than others who
will not want to go through the hassle).
1.12.1 Customer involvement
Consumer involvement will tend to vary dramatically depending on the type of
product. In general, consumer involvement will be higher for products that are very
expensive (e.g., a home, a car) or are highly significant in the consumer’s life in some
other way (e.g., a word processing program or acne medication).
It is important to consider the consumer’s motivation for buying products. To achieve
this goal, we can use the Means-End chain, wherein we consider a logical progression
of consequences of product use that eventually lead to desired end benefit. Thus, for
example, a consumer may see that a car has a large engine, leading to fast
acceleration, leading to a feeling of performance, leading to a feeling of power, which
ultimately improves the consumer’s self-esteem. A handgun may aim bullets with
12

8/4/2019 Preference Repaired)
http://slidepdf.com/reader/full/preference-repaired 13/57
precision, which enables the user to kill an intruder, which means that the intruder
will not be able to harm the consumer’s family, which achieves the desired end-state
of security. In advertising, it is important to portray the desired end-states. Focusing
on the large motor will do less good than portraying a successful person driving the
car.
1.12.2 Attributes
In a very frequent buying situation, consumers have to choose among products with
very similar intrinsic attributes. Under these conditions they must rely mainly on
extrinsic product attributes. Findings indicate: 1) a very strong preference for one of
the brands prior the test but the subjects were unable to distinguish their preferred
brand from the others in the blind taste test; 2) that subjects are not aware about the
factors directing their choice of a product; 3) that differences in subjects' preferences
due to brand name are much higher than those they indicate due to beers tastes. There
is a strong effect of brand name on consumers' buying intentions. (Urdan et al ).
The effects of market entry-information and exposure-order on brand preference
depend on attribute-type and the time between attribute encoding and preference
construction. Market entry-information has no effect on preference and where the
second-encountered brand is preferred to the first. (Niedrich et al ).
1.12.3 Consumer Perception
There are many things that influence the behaviour of the consumer. These influences
can be religion, ethnic group, social class, age, gender, values, etc. But what is even
more important than the different stimuli itself is how consumers perceive, process,
interpret and store the stimuli. This work will describe what perception is, how
consumers perceive and how this scheme can be used by marketers. What is perception? In general, perception is gathering information through our senses, which
are seeing, hearing, touching, tasting, smelling and sensing. Through these senses we
can perceive things, events or relations. But as there are so many different stimuli
only a small portion of them are noticed and an even smaller amount can really reach
our attention. And that’s were it is necessary to talk about the difference between
Sensation and perception. Although the distinction between sensation and perception
is not that easy as it was believed in former times, a rough distinction can be made.
Sensation is the immediate response of our sensory receptors to such basic stimuli as
13
8/4/2019 Preference Repaired)
http://slidepdf.com/reader/full/preference-repaired 14/57
light, colour, etc. Perception is the process by which these stimuli are selected,
organized and interpreted. When talking about perception we always have to keep in
mind that we perceive the world not as it is, but as we think it is. That means that
there are innumerable perceived worlds out there. This statement is based on the fact
that every human being relates the observed world to its past experiences, its values,
etc. Perception is more than just gathering information about a certain event at a
certain time. It involves, recognizing stimuli, processing and storing them. The major
challenge for the marketer is to identify the target customer and to find out, how this
customer perceives the world. That will help to adjust all marketing activities to the
target customer.
a) Consumer Perception Theory
Consumer perception theory is any attempt to understand how a consumer's
perception of a product or service influences their behavior. Those who study
consumer perception try to understand why consumers make the decisions they do,
and how to influence these decisions. Usually, consumer perception theory is used by
marketers when designing a campaign for a product or brand. However, some people
study consumer perception in order to understand psychology in a much more general
sense.
b) Perception
In general psychological terms, perception is our ability to make some kind of sense
of reality from the external sensory stimuli to which we are exposed. Several factors
can influence our perception, causing it to change in certain ways. For example,
repeated exposure to one kind of stimuli can either make us oversensitive or
desensitized to it. Additionally, the amount of attention we focus on something can
cause a change in our perception of it.
c) Branding
A brand, or a brand name, is the attempt to impose some kind of identifying feature
on a product or service so that it is easily recognized by the general public. A brand is
oftentimes associated with an image, a set of expectations or recognizable logo. The
goal of a brand is to set a product or service apart from others of its kind, and
14

8/4/2019 Preference Repaired)
http://slidepdf.com/reader/full/preference-repaired 15/57
influence the consumers to choose the product over similar products simply because
of its associations.
d) Positioning, Repositioning or Depositioning
Positioning is the process whereby marketers attempt to build a brand. Marketers
actively try to create an image which is both recognizable and appeals to a certain
group of people or target market. Repositioning is the process of altering this image,
usually in order to influence a larger target market and thereby influence the behavior
of a greater number of consumers. Depositioning is the practice of trying to devalue
alternative, competing brands in the perceptions of a shared target market.
e) Value and Quality
Value refers to the perceptions a consumer has of a product's benefits when weighed
against its cost. Value can be measured both qualitatively--the emotional or
psychological pleasure a consumer derives from a product or service--and
quantitatively, in terms of the actual financial gain it wins them. Quality can be
related to value, and may be taken into account when measuring the value of a
product or service. More formally, it refers to the way in which a product or service
relates to its competitors, or else conforms to a set of measurable standards.
f) Buyer's remorse
Buyer's remorse is a strong feeling of regret which occurs after a purchase has been
made. It is a specific case of cognitive dissonance, or the psychological state of worry
or unease which comes about when attempting to come to terms with conflicting
ideas, perceptions or motives. Buyer's remorse usually occurs after a consumer has
made a purchase he or she has come to regret. Generally, it involves the realization
that the opportunity of purchasing one product or service over another in some way
outweighs the value of the purchase. In this regard, it occurs when a consumer's
perception of a purchase changes after he or she has already invested in it.
1.12.4 Status
Status have additive effects on brand preference such that perceptions of first-in-
market and first-experienced brands are more favorable, suggesting that both
explanations are operative. The effects of pioneer status on brand preference aremediated by attitude toward the brand and company credibility, while the effects of
15
8/4/2019 Preference Repaired)
http://slidepdf.com/reader/full/preference-repaired 16/57
experience order on brand preference are mediated by attitude toward the brand and
attribute recall. The effect of pioneer status on brand preference is the result of both
brand -level and company-level associations. (Niedrich et al ).
1.12.5 Brand Preference and Age Groups
Young consumers, for instance their approaches to product categorization; their
decision-making strategies; and their role in family decision making, considerable
work remains to be done to understand how young consumers develop brand loyalty,
brand preference and reliance. The findings indicate that product/brand imagery is
clearly established among young consumers, particularly for branded fashion
sportswear; and the results suggest that research design must take account of both age
and gender differences when choosing methods for eliciting data from young
consumers. ( Bruce and Hill, 1998)
The level of influence varies according to age, predisposition and cultural values.
While older customers place more emphasis on perceived brand quality, high on the
cultural value of individualism, commitment to brand is found to be a strong
contributor to brand preference. Similarly in the groups with a high power distance,
brand preference is more influenced by brand initiatives. While brand initiatives make
modest improvements to brand preference overall, more substantial impacts occur
under situational conditions. (Chomvilailuk and Butcher, 2010)
1.12.6 Values, Attitudes and Perception
The role of customer value has been largely recognized over time by the firms as an
instrument towards stimulating market share and profit optimization. The customer
values for innovative products and unfamiliar brands of firm in competitive markets
are determined largely by habits, reinforcement effects, and situational influences thanstrongly-held attitudes. (Rajgopal, 2006)
Consumers recognize brands by building favorable attitude towards them and through
the purchase decision process. Brand preference is understood as a measure of brand
loyalty in which a consumer exercises his decision to choose a particular brand in
presence of competing brands. Brand attributes including emotions, attitudes,
personality, image, reputation and trust influence consumer perceptions and temporal
16
8/4/2019 Preference Repaired)
http://slidepdf.com/reader/full/preference-repaired 17/57
association with brands. The study reveals that higher brand relevance and trust build
strong the association of consumers with brand in long-run. (Rajgopal, 2004)
The credibility of a brand as a signal is defined as the believability of the product
position information contained in a brand, which depends on consumer perceptions of
the willingness and ability of firms to deliver what they have promised. This term is
called moderation phenomenon "preference discrimination," which we conceptualize
as the decision makers' capacity to effectively discriminate between products' utilities
in choice situations. There is a strong evidence for brand credibility effects and
differential mechanisms through which brand credibility's impact materializes on
brand choice conditional on choice set, choice set formation and preference
discrimination. (Erdem et al, 2006)
1.12.7 Information search and decision making.
Consumers engage in both internal and external information search. Internal search
involves the consumer identifying alternatives from his or her memory. For certain
low involvement products, it is very important that marketing programs achieve “top
of mind” awareness. For example, few people will search the Yellow Pages for fast
food restaurants; thus, the consumer must be able to retrieve one’s restaurant from
memory before it will be considered. For high involvement products, consumers are
more likely to use an external search. Before buying a car, for example, the consumer
may ask friends’ opinions, read reviews in Consumer Reports, consult several web
sites, and visit several dealerships. Thus, firms that make products that are selected
predominantly through external search must invest in having information available to
the consumer in need—e.g., through brochures, web sites, or news coverage.
1.12.8 Segmentation and Brand PreferenceA multi-segmenting methodology is proposed for comparing the segmenting
capabilities of segmentation variables and providing complete market segmentation
information. Demographic and psychographic variables based on the differentiation of
consumer brand preference were used to elicit the characteristics of market segments.
The multi-combination variables of demographic segmentation exhibited market-
segmenting capabilities equivalent to those of psychographic segmentation. (Feng
Lin, 2004)
17
8/4/2019 Preference Repaired)
http://slidepdf.com/reader/full/preference-repaired 18/57
1.12.9 Behaviour of Consumer
Consumer choice behavior has some important prevailing conditions that must be
taken into account while studying choice. In the light of the classical problem solving
buying behavior, consumers engage in information search before making the actual
choice. Consumer decision making process is usually guided by already formed
preferences for a particular alternative. This means that consumers are likely to make
the choice between alternatives based on limited information search activity (Beatty
and Smith, 1987; Moorthy et al , 1997).
18

8/4/2019 Preference Repaired)
http://slidepdf.com/reader/full/preference-repaired 19/57
SECTION-B
VERKA MILK PLANT PROFILE
1.13 HISTORY
Milking has its advent
in the very evolution
of placental
mammals. While the
exact time of its
appearance is not
known, the immediate
ancestors of modern
mammals were much
like monotremes
including the
platypus. Such
animals today produce
a milk-like substance
from glands on the surface of their skin, but without the nipple, for their offspring to
drink after hatching from their eggs. Likewise, marsupials, the closest cousin to
placental mammals, produce a milk-like substance from a teat-like organ in their
pouches. The earliest immediate ancestor of placental mammals known seems to be
eomaia, a small creature superficially resembling rodents that is thought to have lived
125 million years ago, during the Cretaceous era. It almost certainly produced what
would be considered milk, in the same way as modern placental mammals.
Animal milk is first known to have been used as human food at the beginning of animal domestication. Cow milk was first used as human food in the Middle East
Goats and sheep are ruminants: mammals adapted to survive on a diet of dry grass, a
food source otherwise useless to humans, and one that is easily stockpiled. The
animals’ dairying proved to be a more efficient way of turning uncultivated grasslands
into sustenance: the food value of an animal killed for meat can be matched by
perhaps one year's worth of milk from the same animal, which will keep producing
milk — in convenient daily portions — for years.
19
8/4/2019 Preference Repaired)
http://slidepdf.com/reader/full/preference-repaired 20/57
Around 7000 BC, cattle were being herded in parts of Turkey. There is evidence from
DNA extraction of skeletons from the Neolithic period that people in northern Europe
were missing the necessary genes to process lactase. Scientists claim it is more likely
that the genetic mutation allowing the digestion of milk arose at some point after dairy
farming began. The use of cheese and butter spread in Europe, parts of Asia and parts
of Africa.
Milk was first delivered in bottles on January 11, 1878. The day is now remembered
as Milk Day and is celebrated annually. The town of Harvard, Illinois also celebrates
milk in the summer with a festival known as Milk Days. Theirs is a different tradition
meant to celebrate dairy farmers in the "Milk Capital of the World."
1.14 BEHIND VERKA
Far away from the din and maddening pace of the city, there rests, near Amritsar
sleepy village called Verka. Peaceful in its seclusion, life crawls on its own pace.
The cool breeze, rustle of the banyan leaves, the chirruping of the birds, the quite
flow of the shimmering water besides those soft folds of lush green, nestling a
healthy cattle grazing away to glory. Today, Verka has out-stripped its own
boundaries to reach our homes. Verka was there long before it came to MILKFED.
But then, it was the difference between being there and making it big. When we at
MILKFED took it on, we believed that it had potential to do a lot more. And it did.
With little more of a consumer oriented approach, Verka became a brand to reckon
with. With its growing outlets and thus easier availability, it reached far and wide
across the state and beyond. To people today, Verka is part of their daily lives.
1.15 INTRODUCTION: THE VERKA MILK PLANT LDH.
20

8/4/2019 Preference Repaired)
http://slidepdf.com/reader/full/preference-repaired 21/57
Verka milk plant, Ludhiana is known Ludhiana distt- co-operative milk produce
union. It is situated on Ferozepur road. It is fully equipped with modern fluid milk
plants facilities.
VMP, Ludhiana is a prestigious milk plant of Punjab State famous all over the
country and abroad for the supply of quality milk products. It has got first position in
Northern Zone. It's functioning stone was laid by Sh. Prakash Singh Badal, the Chief
Minister of the Punjab on June 22 1970. This plant was inaugurated by our referred
Prime Minister Smt. Indira Gandhi.
Milk plant is a co-operative society and farmers (producers) share all its profit and
losses. Govt. does not provide any financial assistance to milk plant Ludhiana. But
Govt. Supervisor and control is there. Law and policy maker is Punjab Govt. here
there is no dishonesty in the milk plant. It is very neat and clean organization. The
handling capacity of the milk plant per day is 4 Lac Litre.
In the year 1983, PDDC merged into milkfed and control of milk plant transferred to
milkfed in year 1983. But the efforts of the Directors and milk producer's control of
milk plant transferred to milk union, (union of milk producers).
Milk plant Ludhiana produces variety of milk products like Milk cake, cheese, Butter,
Ghee skimmed milk powder and standardized milk'. Milk plant sells better quality of
21
8/4/2019 Preference Repaired)
http://slidepdf.com/reader/full/preference-repaired 22/57
pasteurized milk to people. Ghee manufactured by this plant is not only sold in
country but also supplied to foreign countries like Nepal, Dubai.
The new achievements of this milk plant is to achieve the International quality
certificate ISO 9002. To get this ISO -9002 certification the following clauses are
requires.
1. Management Responsibility
2. Quality Systems
3. Contract Review
4. Documents and data control
5. Purchasing
6. Purchase- Supplier product
7. Product - Identification and tractability
8. Process Control
9. Inspecting and testing
10. Inspection, Measuring and test equipment
11. Inspection and test status.
12. Control of non conforming products
13. Corrective action
14. Holding, Storage, packaging and delivery
15. Quality Records
16. International Quality Audits
17. Training
18. Statistical Techniques
19. Design and control
20. Servicing
Profits of milk plant are distributed to workers and milk produces as increase in rate
of fat and SNF and to workers as bonus. In the year 2001-2002 the milk plant
achieved the Gross profit (Without Interest & Dep. ) for Rs. 5,7200000 and net profit
for Rs. 3,3100000.
In milk plant Ludhiana is controlled by Govt. The Govt. does not give any assistance
to the milk plant but milk plant can receive loans etc with the guarantee of Govt.
policymaker is the Govt. but milk produces spend money.
22

8/4/2019 Preference Repaired)
http://slidepdf.com/reader/full/preference-repaired 23/57
Machinery of best technology has been installed in the milk plant. The machinery is
available for the productions of following milk products.
1. Pasteurized fluid milk
2. Sterilized flavoured milk
3. Milk-cake
4. Paneer
5. Lassi
6. Ice Cream
7. Butter
8. Ghee
9. Skimmed milk
powder
10. Whole milk powder
11. Baby food
But according to the demands from the open market the following milk products are
produced:-
1. Pasteurized/ Sterlised milk
2. Milk cake3. Paneer
4. Butter
5. Ghee
6. Skimmed milk powder
Lured by high profits some new
concerns in private sector also try to
set up their own plants. So, the presentmargin of the milk plant has become
less and future is looking hard. The milk plant is still standing ahead and not loosing
courage. Normally middlemen and traders dominate the market. The milk plant
steadily marched toward fix goal of becoming a strong and viable milk plant and now
is at No. 1 in Northern Zone.
23
8/4/2019 Preference Repaired)
http://slidepdf.com/reader/full/preference-repaired 24/57
All its officer as well as workers are assets to milk plant Ludhiana who are
performing their duties delight and with full zeal and energy. Also the building of
milk plant. Ludhiana is nicely planned and maintained. There is great system of work.
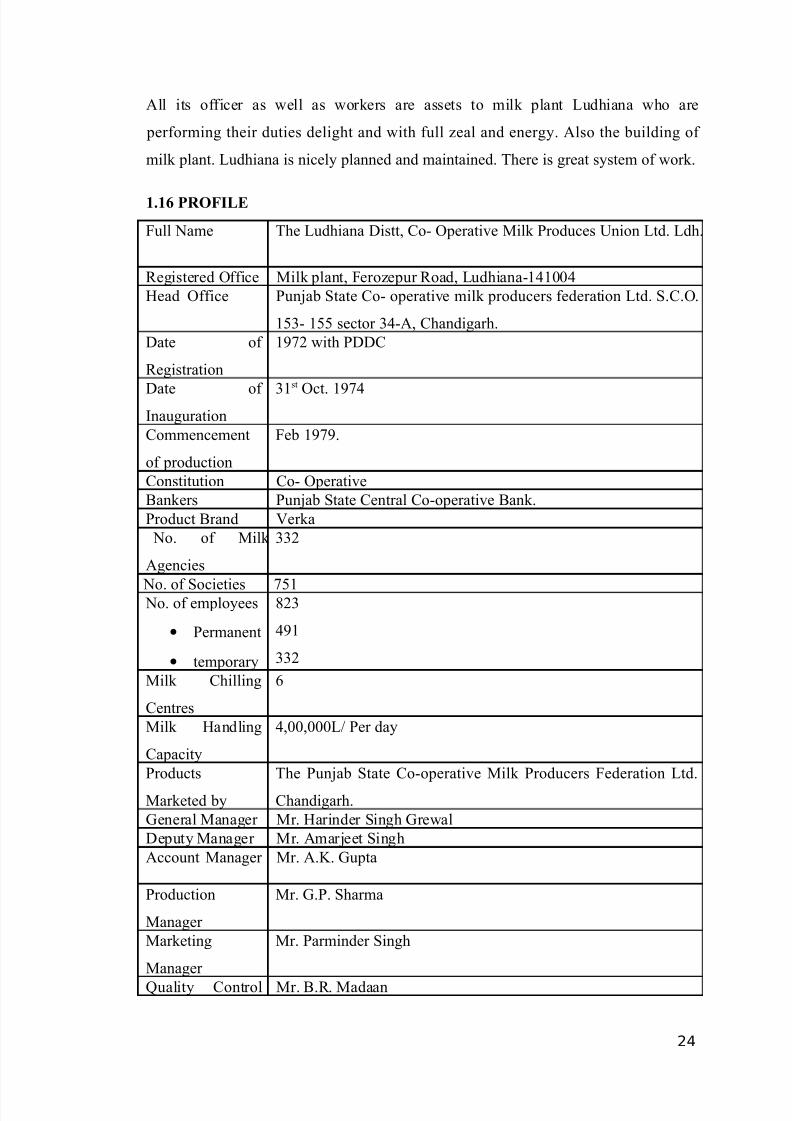
1.16 PROFILE
Full Name The Ludhiana Distt, Co- Operative Milk Produces Union Ltd. Ldh.
Registered Office Milk plant, Ferozepur Road, Ludhiana-141004
Head Office Punjab State Co- operative milk producers federation Ltd. S.C.O.
153- 155 sector 34-A, Chandigarh.
Date of
Registration
1972 with PDDC
Date of Inauguration
31st
Oct. 1974
Commencement
of production
Feb 1979.
Constitution Co- Operative
Bankers Punjab State Central Co-operative Bank.
Product Brand Verka
No. of Milk
Agencies
332
No. of Societies 751 No. of employees
• Permanent
• temporary
823
491
332
Milk Chilling
Centres
6
Milk Handling
Capacity
4,00,000L/ Per day
Products
Marketed by
The Punjab State Co-operative Milk Producers Federation Ltd.
Chandigarh.
General Manager Mr. Harinder Singh Grewal
Deputy Manager Mr. Amarjeet Singh
Account Manager Mr. A.K. Gupta
Production
Manager
Mr. G.P. Sharma
Marketing
Manager
Mr. Parminder Singh
Quality Control Mr. B.R. Madaan
24

8/4/2019 Preference Repaired)
http://slidepdf.com/reader/full/preference-repaired 25/57
Manager
SALIENT FEATURES
1. First milk plant in India to get ISO -9002 International Quality Certificate for
milk.
2. Milk rate paid to the producers among all the unions highest in the rate.
3. Milk procurement highest among all the unions in the state.
4. Milk procurements per society one day among all the union highest in the
state.
5. 100% milk producers co- operative societies are in profit.
6. Aggregate profit of the societies in any year is the maximum among all the
union state ever since inception, customer satisfaction and consistency in quality arethe key- thrust area of this organization.
7. Numbers of A.I. cases maximum among all the unions in the state.
8. Number of sick animals treated highest among all the unions in the state.
9. Cattle feed sold to societies is maximum among all the unions in the state.
10. F.M.D. vaccination maximum among the all unions in the state,
11. Milk transportation cost lowest among all the unions in the state.
12. Milk chilling cost lowest among all the unions in the state.
13. Average daily city supply maximum among all the unions in the state.
14. Embryo transfer technology introduced in the field for the first time in
northern India.
15. Milk products selling at premium rates and ghee exported to gulf countries and
Philippines.
16. Capacity utilization is maximum on yearly basis.
17. Fuel cost per Kg. Milk is lowest among all the union in the state.
18. Electricity cost per Kg. Milk is lowest among all the unions in the state.
19.Annual turnover more than Rs. 100.00 crores of rupees. Highest among all the
unions in the state.
20. Annual profitability highest among all the unions in the state.
1.17 ORGANIZATION STRUCTURE
Organization structure is a systematic combination of people, functions and physical
facilities. It constitutes a formal structure with defined authority and clear
25

8/4/2019 Preference Repaired)
http://slidepdf.com/reader/full/preference-repaired 26/57
responsibility. Each and every person is given a job and then authority is assigned to
him for the job. He is made responsible for the job.
The structure and process by which a co-operative group of human beings allocate its
task among its members, identifies relationship and integrates its activities towards
the common objectives.
Thus organizing structure aims and the saying, “Each one for a job and job for each
one"
Organization structure of milk plant, its board consist of 19 Directors, They appoint
General Manager and chairman. Then there are different departmental heads like
manager Accounts Manager, Production Manager, Purchase and manager marketing
etc. These heads have deputies for their assistance. The each department has different
employees at departmental level. Verka milk plant is well organized". It helps in
efficient 'running of concern.
1.18 MILK PROCUREMENT SECTION
Milk procurement business is being looked after mainly by milk union Ludhiana.
Procurement section is headed by manager milk procurement who is assisted by
technical officers and supporting staff for obtaining the objectives.
Milk union Ludhiana procure 1.00 lac liters of milk per day at the time of
commissiong of milk plant. But at present milk union procure 4 lacs lit of milk per
day.
1.18.1 MILK HANDLING CAPACITY OF THE PLANT: Detail of milk
handling capacity in % age is as under:-
Year Milk handling capacity (utilization) percentage
2000-01 86.4
2001-02 92.5
2002-03 135.9
2003-04 141.6
2004-05 168.7
2005-06 175.2
2006-07 186.92007-08 219.8
26

8/4/2019 Preference Repaired)
http://slidepdf.com/reader/full/preference-repaired 27/57
1.18.2 CITY SUPPLY
Milk union, Ludhiana in addition to supplying the surplus" milk to national milk and
Delhi also meet the social obligation of city supply to urban population of Ludhiana.
Four different types of milk that are
1. Pasteurized skimmed milk(SKM) 0.5% 8.7%
2. Pasteurised Double tonned milk (DTM) 1.5% 9.0%
3. Pasteurized standarised milk (Std.) 4.5% 8.5%
4. Pasteurized buffalo / Full cream milk (BM/FCM) 6.0% 8.5%
These four types of milk are packed in half liter, 1 liter & 5 liter poly sachets.There
are 21 routes for city supply. Verka milk plant has its own 5 milk bars at different
places. Sale or city supply milk during last 8 year is as under:-
Year Sales of milk (Percentage per day)
2000-01 150.4
2001-02 135.6
2002-03 154.3
2003-04 168.9
2004-05 184.5
2005-06 192.8
27

8/4/2019 Preference Repaired)
http://slidepdf.com/reader/full/preference-repaired 28/57
2006-07 211.9
2007-08 240.8
1.18.3 AVERAGE COLLECTION OF MILK PER DAY (‘000KG) Last 9 years
record of average collection of milk per day is listed as under:-
Year Average Collection (000 kg.)
2000-01 216
2001-02 179
2002-03 216
2003-04 242
2004-05 269
2005-06 256.7
2006-07 261.6
2007-08 295.5
28

8/4/2019 Preference Repaired)
http://slidepdf.com/reader/full/preference-repaired 29/57
1.19 INCEPTION
Milk Production is a very important part of the agricultural economy in the State of
Punjab. Punjab is one of the smallest States in Indian Union with a total area of
50,362 Sq. Kms., which is 1.5% of the Indian landmass. Dairy Farming is an age-old
subsidiary profession in the rural areas of Punjab. Punjab is the second largest milk
producing state in India, producing around 10% of the countries Milk Production i.e.
8 million tones annually.
1. First Milk Plant, of the State was setup at Verka near Amritsar.
2. The brand name of Milk and Milk Products was adopted as Verka.
3. The Foundation stone of Milk Plant, Ludhiana was laid by Hon. S. Parkash
Singh Badal, the then Chief Minister of Punjab in 1970.
4. Commissioning of the Plant was done by Punjab Dairy Development
Corporation in 1974.
5. Inauguration was done by Late Smt. Indira Gandhi the then Prime Minister of
India.
1.20 OBJECTIVES
1. To strengthen dairy sector, Milkfed came into existence in 1978 and
Simultaneously Distt. Milk unions were formed.
2. Village level cooperative societies were also formed on "Anand Pattern". The
system was run by the farmers, of the farmers and for the farmers.
29

8/4/2019 Preference Repaired)
http://slidepdf.com/reader/full/preference-repaired 30/57
3. To give remunerative prices to farmers and to ensure permanent market for the
whole year.
4. To provide technical inputs like artificial insemination,to improve the breed of
animals,animals health services,preventive disease treatment andawareness
regarding farm management etc.
5. To provide ISI marks good quality balanced Cattle feed and fodder seeds to
the farmers.
1.21 NECESSITY FOR PRODUCTION ENHANCEMENT
1. Milk production in the area increased manifold with the result. Resultantly
started receiving daily 2.50 LPD of milk.
2. To increase the participation of women 120 exclusively women societies are
organized with 15300 women members. through Punjab Women Dairy Project
a Central Govt. sponsored scheme.
3. Milk Production in the area increased manifold with the result. Resultantly
started receiving daily 2.50 Lac LPD of Milk and Peak procurement 4.5 Lac
LPD.
4. To cater to the increased demand, necessity of expansion of milk plant arose.
5. Capacity of Milk Plant enhanced from 1 lac to 4 lac litres with additional powder. Plant of 30 MTs .
6. This improved the socio- economic conditions of marginal and poor farmers.
7. The profitability of the plant and turnover of the plant improved a lot.
8. No. of societies increased from 94 to 751 and its membership from 5400 to
78000.
9. All the societies are in net profit and distributing bonus to its members.
1.22 QUALITY OF MILK AND MILK PRODUCTS
1. To improve the quality of raw milk, Clean Milk Production program started in
650 villages and resultantly the quality of products increased.
2. Milk Plant, Ludhiana was the First in India in Dairy Sector to get ISO
Certification.
3. Under ISO Certification and HACCP (IS 15000) Milk Union started export of
Ghee, SMP to Gulf Countries Philippines, Manila, South Africa, Singapore,
Bangla Desh etc. The export is more than 5.5 crore during the last year.
30

8/4/2019 Preference Repaired)
http://slidepdf.com/reader/full/preference-repaired 31/57
4. To further improve the quality of Raw Milk, Milk Union started 365
Automatic Milk collection Stations at village level.
5. To meet the Challenges of WTO Milk Union started TIFAC program with the
help of Ministry of information.
6. 28 model dairy demonstration farms have been established including milking
machines in distt. of Ludhiana which has encouraged the farmers to adopted
dairy on large scale.
7. Milk Union, Ludhiana is first in India which has installed Bectoscan worth 70
lacs and Somatic cell count machine have been installed at milk plant,
Ludhiana.
8. Further 23 BMC has been approved under central govt. Scheme on 75% grant
to be installed in societies.
1.23 PRESENT STATUS/ ACHIEVEMENTS OF THE PLANT
1. No. of societies increased from 94 to 751 and its membership from 5400 to
78000.
2. Milk Procurement has increased from 10200 LPD to 2,50,000 LPD.
3. Highest milk price is being paid to the milk producers as compare to other
plants in the states4. Products being manufactured by Ludhiana Plant are sold at premium rates
through out of the country and in the International Market.
5. City supply has increase from 66000 LPD to 1,60,000 LPD.
6. Turnover the plant touched to 180 crores Profit of the union has increased
manifold.
7. Capacity utilization of the plant is more than 80%.
8. Milk products like Ghee,Table Butter,Skimmed Milk Powder,Whole Milk Powder,Curd,Paneer,Milk Cake etc are being manufactured by Milk Plant
Ludhiana.
Milk Union, Ludhiana is further progressing by leaps and bounds and it is hoped that
in the years to come, it will achieve excellent results and will help improve the social
and economic condition of the people at large.
1.24 MISSION
31

8/4/2019 Preference Repaired)
http://slidepdf.com/reader/full/preference-repaired 32/57
The milk plant has become less and future is looking hard. The milk plant is still
standing ahead and not loosing courage. To meet the global competition milkfed
chandigarh has taken steps in the field of advertisement of products and has set aside
Rs, 1 crore for this purpose.
1. Providing improved technical input services to farmers.
2. Setting up big commercial farms.
3. More stress on clean milk production programme.
4. Rural women empowerment.
5. Massive women empowerment.
6. Strengthing market base with specific stress on consumer market.
7. Dynamic enhancement in Verka product mix.
32

8/4/2019 Preference Repaired)
http://slidepdf.com/reader/full/preference-repaired 33/57
CHAPTER 2
REVIEW OF LITERATURE
Abreu (2000) has made out that thirty years after Operation Flood, which saw the
country awash in milk, another revolution is in the making: the marketing and
distribution of packaged milk, both plain and in flavoured form, aimed at the
burgeoning Indian middle class. There is a strong rationale behind this surge. On the
supply side, milk production in the country has almost doubled from 38.8 million
tonnes in 1983-84 to 74 million tonnes in 1998-99. Juxtapose this with the demand
side development: A rising number of working couples, nuclear families, need for
longer shelf life and changing lifestyles; plus the increased consciousness of global
trends.
Ayanwale, et al (2005), found that many consumers do not buy whatever is
available or affordable if a product is good value for its price, it will command brand
loyalty. However, advertising helps in projecting product quality and value before the
consumers. The stage a product is in its life cycle is very important to a marketer as it
help in determining the type of marketing strategies to be embarked upon in respect of
the said product.
Bhar and Saxena (2005) developed ARIMA models for forecasting the sales
of milk and milk products in the regions of Bokaro and Dhanbad. Based on the data
collected from the period from March 2003 to December 2004, they fitted these
models and forecasted for the period from January 2005 till June 2005, and concluded
that they were valid for forecasting the milk sales and retailer growth of the dairy(with a 95-percentile confidence level), which will help the dairy companies to
formulate appropriate marketing and distribution strategies.
Botonak (2010) proposed that the increasing importance of convenience in
consumer food choices has attracted researchers’ interest. In the effort to understand
how convenience affects consumers’ food preferences, values are believed to play an
important role. The results reveal that convenience food consumption and
convenience orientation in the food domain are mainly connected
33
8/4/2019 Preference Repaired)
http://slidepdf.com/reader/full/preference-repaired 34/57
Brunner et al (2010) reported that convenience is one of the big trends in the
food business. The demand for convenience food products is steadily increasing.
Despite being vital properties of convenience food, saving time and effort have not
been very successful constructs for predicting convenience food consumption. The
various convenience food products could be categorized into four groups, which we
labeled as highly processed food items, moderately processed food items, single
components, and salads. Fifteen drivers were found to have a significant impact either
on total convenience consumption or on one of the identified categories. Strong
predictors were age, concern about naturalness, nutrition knowledge, and cooking
skills.
Carbonell and Costell (2008) studied the type of information (picture of real
package or card with beverage type and nutritional facts) and consumer attitudes
(interest in eating healthily and food neophobia) and affect on its hedonic ratings and
purchase intention with respect to refrigerated milk and soybean vanilla beverages.
Information affected purchase intention to a greater extent. Type of information
influencing consumer behaviour was also dependent on some consumer attitudes,
such as interest in eating healthily
Cardello and Schutz (2004) conducted the analytic studies with civilian and
military consumers in order to assess the factors that contribute to the concept of food
freshness and the relative importance of freshness to other product variables. Results
showed the concept of freshness to be determined primarily by time from
harvest/production and food type. Foods that were described as "minimally processed
e.g "frozen and thawed" were rated as less fresh than other foods.
Gofton and Ness (1991) studied that the twin trends of health and conveniencehave resulted in changing food consumption patterns. Their Research among
consumers confirmed that there is awareness and concern about the relationship
between health and diet and the better educated are more food-conscious. Changing
lifestyles and the changing role of women are shown to affect food habits.
Hlgren et al (2004) reported that food choice is dependent upon beliefs about
both the products and consumers. Beliefs about the prototypical attributes of ready
meal consumers have been investigated to establish the beliefs that exist and whether
34

8/4/2019 Preference Repaired)
http://slidepdf.com/reader/full/preference-repaired 35/57
they have any actual basis when compared with self-reported behaviours of ready
meal consumers.
Johnston (1981) proposed that time may be the most important variable in
consumer behavior. On one side, the time dimension of consumer behavior is viewed
as just beginning to emerge as a major variable of study, on the other side, however,
time has been implicitly and explicitly incorporated into consumer behavior theory
and marketing strategies for quite some time. Adoption of products by consumers was
not characterized by analytic consumption behavior but by risk aversion and
preference for incremental changes in the consumption set.
Khanona and Aung (2004) proposed that the diverse consumer attitudes
towards the safety of food. The diversity among consumers is based on a variety of
factors, including demographics and socio-economic status. The relationship between
consumer attitudes, knowledge and behaviour regarding food safety is also examined
in this paper. It indicates that different attitudes do not necessarily lead to behaviours
that increase the safety of the food consumed.
Michael et al (2008) studied the factors that influence willingness to buy
foods. Data were collected from a representative mail survey in Switzerland .Results
suggest that. Health claims were most positively evaluated when attached to a product
with a positive health image. Results further show that participants who have trust in
the food industry are more likely to buy functional foods compared with participants
who do not have trust in the food industry. Older consumers were more interested in
functional foods than younger consumers.
Parekh (2006) in his research established that, of the total milk produced in the
country, nearly 46 per cent is consumed as liquid milk (Table 1) and the balance
converted into various dairy products, such as ghee, butter, milk powder, ice cream,
cheese, condensed milk and for making various kinds of sweetmeats having distinct
regional preferences.
Prasad (2006) found in his study that 91.33% of the consumers knew the
availability of more than one variety of milk available in the market. He also
established that a large majority of respondents 62.33% said that it is the quality thatinfluences the choice of the brand, whereas a meagre 5.67% expressed the view that it
35
8/4/2019 Preference Repaired)
http://slidepdf.com/reader/full/preference-repaired 36/57
is the factor of easy availability that is responsible for the preference of a brand. He
found that a majority (about 82.67%) of the respondents were satisfied with the
present brand they were using and only 17.33% though otherwise. He further
suggested that prompt and regular supply, providing value by way of service rendered
by agents and avoidance of adulteration are factors that will count in the success or
failure of the milk producers.
Sachan (2005) discussed the dairy scenario in India and also highlighted the
export potential of this sector. According to him, higher professionalism could be
imparted in rearing, milking as also handling during distribution of milk. Lessons
could be learnt by individuals and small dairy farms from the cooperative sector.
which has managed to impart some amount of professionalism in its operations.
Several areas in the dairy industry could be strengthened by induction of state-of the-
art technologies, transferred from other dairy majors of the world: Operational
efficiencies are required, not only to improve yields but also to reduce waste and
minimization of losses in fat, protein during milk processing.
Sriram et al (2004) found that intrinsic brand preferences have a much bigger
effect on the performance of the brand than the inclusive value which reflects model
level prices, product attributes, and the length of the brand’s product line. Further,
some brands can increase their advertising expenditures and still increase their
profitability. Attributes may be accompanied by higher advertising expenditures. The
consumers notice all the changes in the portfolio of models offered by a brand
changes. However, due to limited cognitive capacity, it is likely that the consumers
only consider the models that are close to their needs and may hence not be affected
by the addition or withdrawal of other models. Moreover, it is likely that the retailers
do not carry all the models offered by the brand at all times.
Sun (2008) proposed the study that addressed how various health concerns
might influence not only consumers’ food choice motives but also consumers’
subsequent attitudes toward healthy eating. The findings revealed that the consumers
with greater health concerns would have different food choice motives and better
attitudes toward healthy eating.
36

8/4/2019 Preference Repaired)
http://slidepdf.com/reader/full/preference-repaired 37/57
Tauscher (2002) studied that Consumer demands for high-quality foods with
“fresh-like” characteristics that require only a minimum amount of effort and time for
preparation has led to the introduction of convenience foods preserved by mild
treatments. Non-thermal methods allow the processing of foods below temperatures
used during thermal pasteurisation, so flavours, essential nutrients, and vitamins
undergo minimal or no changes. This process is used to create food and food
ingredients with new sensory and functional properties including also physiological
functionality.
37
8/4/2019 Preference Repaired)
http://slidepdf.com/reader/full/preference-repaired 38/57
CHAPTER 3
RESEARCH METHEDOLOGY
Research Methodology is a way to systematically solve the research problem.When we talk about research methodology we not only talk about research methods
but also talk about the logic behind the method we use in the context of our research
that's why our research results are capable of being evaluated either by the researcher
himself or by others. The purpose of this section is to describe the methodology
carried out complete the work. The methodology plays a dominant role in any
research work. The effectiveness of any research work depends upon the correctness
and effectiveness of the research methodology.
TOPIC
Consumer Preference Regarding Branded and Unbranded Milk-Products
OBJECTIVES
• To understand reason for preference of branded or unbranded milk and milk-
products.
•
To study the satisfaction level of consumers for various features of a particular brand.
RESEARCH DESIGN
A research design is an arrangement of conditions for collection & analysis of
data in a manner that aims to combine relevance to the research purpose with the
economy in procedure. It constitutes the blueprint for collection, measurement &
analysis of data. I have used convenient, analytical and descriptive method.
RESEARCH INSTRUMENTS
Questionnaire is most common research instrument in collecting primary data
during marketing research. A questionnaire consists of a set of questions presented to
respondents. Because of its flexibility, the questionnaire is by far the most common
instrument used to collect primary data.
SAMPLING TECHNIQUE
38
8/4/2019 Preference Repaired)
http://slidepdf.com/reader/full/preference-repaired 39/57
In order to take the sample for the study sample technique selected is Random
sampling technique.
SAMPLE SIZE
Sample size of the research was 100.
DATA COLLECTION
• Primary Data – It was taken from the randomly selected people from the
customers.
• Secondary Data – It was taken from various books, journals, newspapers and
various Internet websites.
TOOLS OF DATA ANALYSIS
Keeping in view the objectives of the research and nature of the data,
percentage method for data analysis is used. For the ranking purpose simple
interpretation method was used as the results were clear simply by seeing the data.
MS Excel was used for calculation purpose.
LIMITATIONS
While surveying, researchers encountered with some problems like:
• The sample size was less; therefore this is a big limitation of our study. The
survey should have involved a larger sample size otherwise the findings of the
survey cannot be generalized. But a larger sample size may increase the time
and cost of collecting the primary data with the help of Questionnaire.
• Many of the respondents were not willing to fill the questionnaire.
• Another problem which researchers faced was that people were hesitating to
give information about their views freely.
39

8/4/2019 Preference Repaired)
http://slidepdf.com/reader/full/preference-repaired 40/57
CHAPTER 4
CONSUMER PREFERENCE ANALYSIS
4.1 TYPE OF MILK PRODUCTS PREFERRED
Table 4.1 Type of Milk Products Preferred
Type No of Respondents Percentage
Branded 78 78
Unbranded 22 22
Total 100 100
Graph 4.1 Type of Milk Products Preferred
From the inspection of above table it is clear that 78% of respondents prefer
branded milk-products over unbranded milk-products. Only 22% respondents said
that they prefer unbranded milk - products. Therefore, we can say that people mostly
prefer branded milk products.
40

8/4/2019 Preference Repaired)
http://slidepdf.com/reader/full/preference-repaired 41/57
4.2 Milk Products UsedTable 4.2 Milk Products Used
Milk Products No of Respondents
Milk 93
Curd 58Ice-cream 25
Kheer 59
Lassi 68
Butter 54
Ghee 34
People mostly use milk. 93% respondents use milk. After that the product
most frequently used is lassi, which is used by 68%respondents. After that it comes
kheer and Curd. These are used by 59% and 58% respondents respectively. Butter is
also used by 54% respondents. 34% people also use ghee. Ice-cream is least used by
people. Only 25% respondents use verka ice-cream. Therefore we can say that verka
milk, lassi and curd are most frequently used products of verka.
41

8/4/2019 Preference Repaired)
http://slidepdf.com/reader/full/preference-repaired 42/57
4.3 Frequency of Usage
Table 4.3 Frequency of Usage
Option No of Respondents
Daily 56Usually 23
Rarely 12
Do not use 9
Total 100
Graph 4.3 Frequency of Usage
Above table shows that mostly people use milk-products daily. 56% of
respondents use milk-products daily. 23% of respondents use milk-products usually.
12% of respondents are such that they use milk-products rarely and there are 9% of
respondents who do not use milk-products at all.
42

8/4/2019 Preference Repaired)
http://slidepdf.com/reader/full/preference-repaired 43/57
4.4 Nature of Purchase DecisionTable 4.4 Nature of Purchase Decision
Purchase Decision No of Respondents Percentage
Impulsive 29 29
Planned 71 71Total 100 100
Graph 4.4 Nature of Purchase Decision
Above table shows that 29% of respondents’ purchase decision is impulsive.
71% of respondents purchase milk-products by planning; therefore, we can say that
mostly people have planned purchasing regarding milk-products.
43

8/4/2019 Preference Repaired)
http://slidepdf.com/reader/full/preference-repaired 44/57
4.5 Factors Influencing PurchaseTable 4.5 Factors Influencing Purchase
Factors 1 2 3
Price 23 27 17Quality 22 14 25
Fat control 8 5 9
Relatives 1 2 0
Advertisement 2 3 1
Health condition 5 2 2
Doctors 2 1 1
Taste 26 24 22
Availability 9 14 20
Friends 1 2 1
Packaging 1 4 2
Others 0 2 0
From the inspection of the above table it is clear that price, quality and taste are
the factors which influence the people to buy branded milk-products. These three
factors are mostly chosen by respondents as first, second or third priority. After that
fat control and availability of products at nearby place also influence the people to
buy branded milk-products. After that it comes health condition which influence people to purchase branded milk-products. Any other factor does not have much
effect on the purchase decision. .
44

8/4/2019 Preference Repaired)
http://slidepdf.com/reader/full/preference-repaired 45/57
4.6 Major Problems W.R.T. Branded Milk-ProductTable 4.6 Major Problems W.R.T. Branded Milk-Product
Options 1 2 3 4 5 6
Lack of awareness 28 22 18 16 11 5
High price 11 15 10 20 16 28 Non-availability 26 25 21 16 9 3
Dislike 13 20 17 19 23 8
Low quality 20 17 28 15 14 6
Change of taste 2 1 6 14 27 50
The above table shows the major problems w.r.t. branded milk-products. The
major problem w.r.t. branded milk product is lack of awareness and non-availability
of branded milk-products. Change of taste and high price is not any problem in case
of branded products.
45

8/4/2019 Preference Repaired)
http://slidepdf.com/reader/full/preference-repaired 46/57
4.7 Factors Affecting Preference of Branded Products Over Unbranded
Table 4.7 Factors Affecting Preference of Branded Products Over Unbranded
Factors No of Respondents
Home delivery 8Lesser price 4
Quality assurance 25
Security of homogeneous production 22
Safety from perishability 20
Flavour 12
Improved taste 9
Total 100
Graph 4.5 Factors Affecting Preference of Branded Products Over Unbranded
From the inspection of the above table it is clear that quality assurance,
security of homogeneous production and safety from perishability are the factors
which affect the preference of branded products over unbranded. However home
delivery and lesser price are factors which do not effect it.
46

8/4/2019 Preference Repaired)
http://slidepdf.com/reader/full/preference-repaired 47/57
4.8 Source of Information
Table 4.8 Source of Information
Source No of Respondents
Friends 27
Advertisement 12
Shop keepers 22
Doctors 9
Relatives 30
Total 100
Graph 4.6 Source of Information
Friends and relatives are the most preferred source of information through
which people come to know about branded milk products. 30% respondents came to
know about branded milk products by their relatives and 27% respondents get
information from friends. 22% of respondents came to know about branded milk
products from shopkeepers.
47
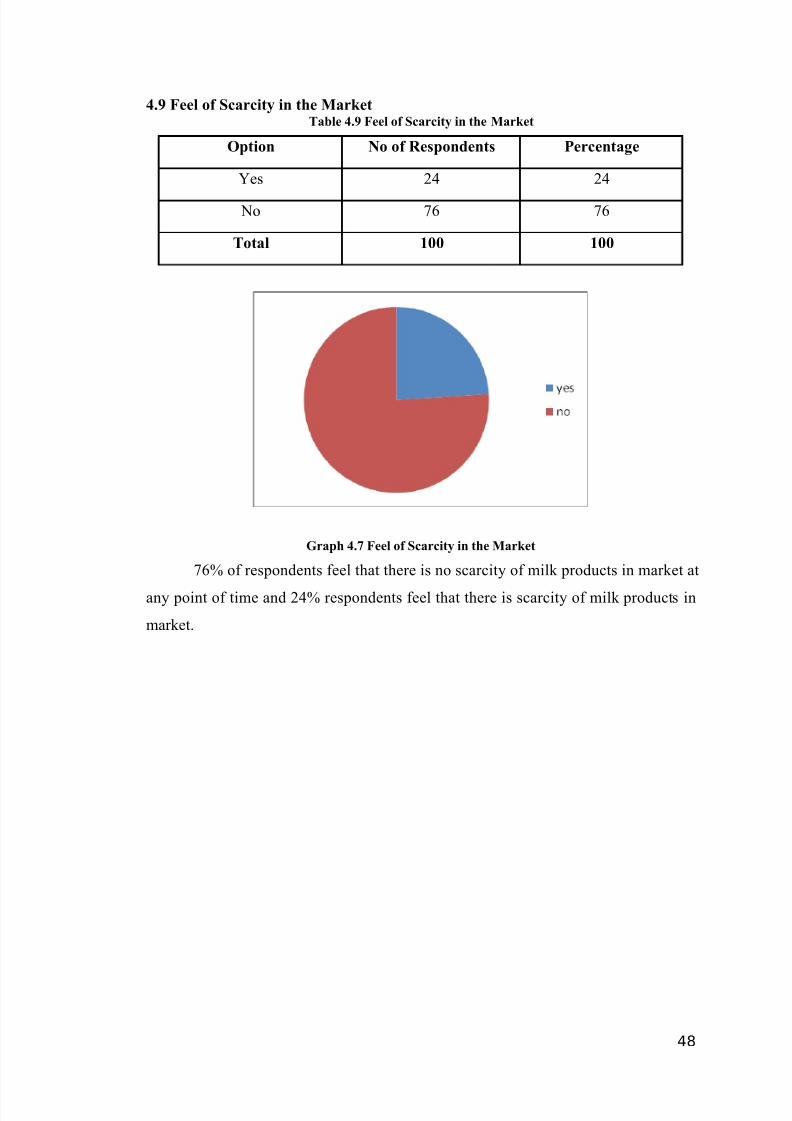
8/4/2019 Preference Repaired)
http://slidepdf.com/reader/full/preference-repaired 48/57
4.9 Feel of Scarcity in the MarketTable 4.9 Feel of Scarcity in the Market
Option No of Respondents Percentage
Yes 24 24
No 76 76
Total 100 100
Graph 4.7 Feel of Scarcity in the Market
76% of respondents feel that there is no scarcity of milk products in market at
any point of time and 24% respondents feel that there is scarcity of milk products in
market.
48
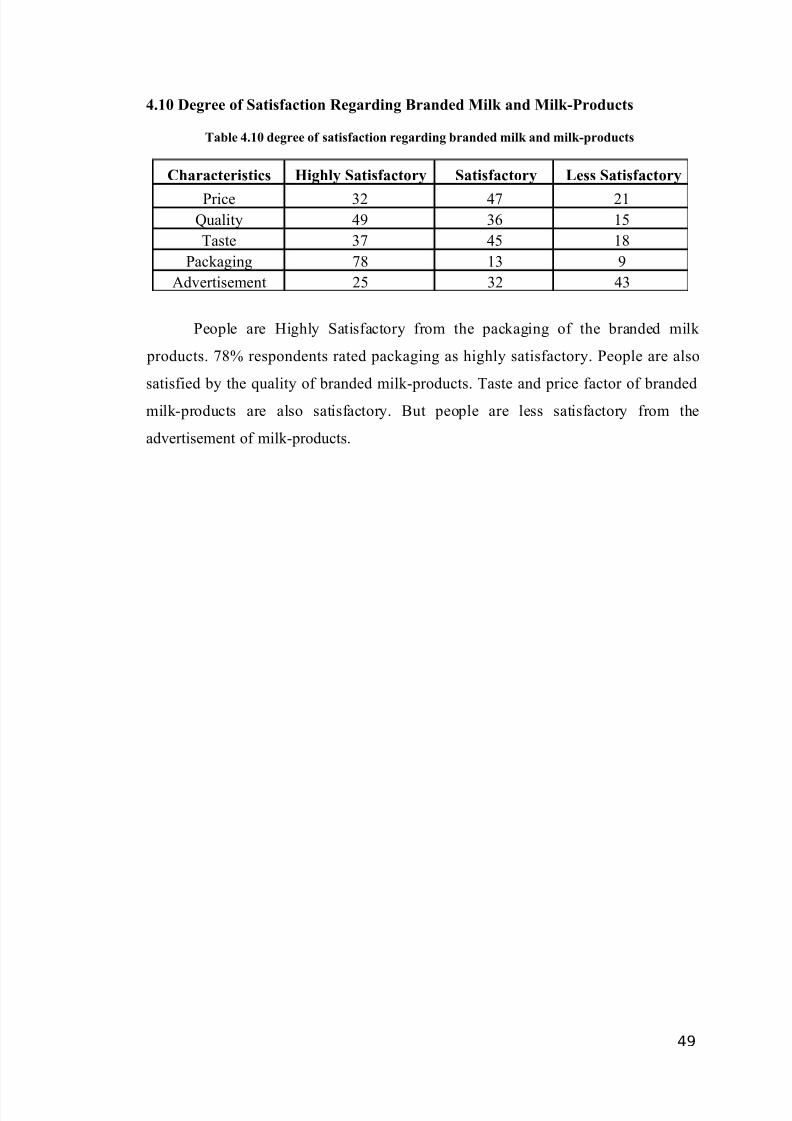
8/4/2019 Preference Repaired)
http://slidepdf.com/reader/full/preference-repaired 49/57
4.10 Degree of Satisfaction Regarding Branded Milk and Milk-Products
Table 4.10 degree of satisfaction regarding branded milk and milk-products
Characteristics Highly Satisfactory Satisfactory Less Satisfactory
Price 32 47 21Quality 49 36 15
Taste 37 45 18
Packaging 78 13 9
Advertisement 25 32 43
People are Highly Satisfactory from the packaging of the branded milk
products. 78% respondents rated packaging as highly satisfactory. People are also
satisfied by the quality of branded milk-products. Taste and price factor of branded
milk-products are also satisfactory. But people are less satisfactory from the
advertisement of milk-products.
49
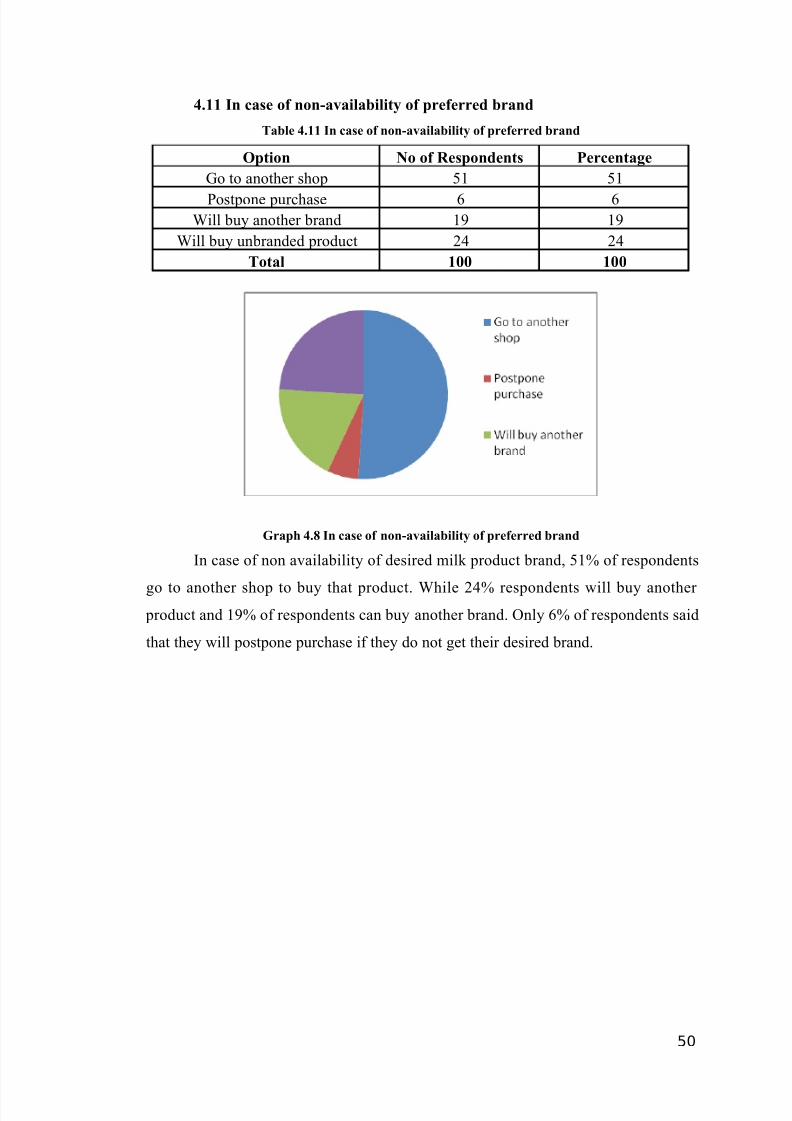
8/4/2019 Preference Repaired)
http://slidepdf.com/reader/full/preference-repaired 50/57
4.11 In case of non-availability of preferred brand
Table 4.11 In case of non-availability of preferred brand
Option No of Respondents Percentage
Go to another shop 51 51
Postpone purchase 6 6Will buy another brand 19 19
Will buy unbranded product 24 24
Total 100 100
Graph 4.8 In case of non-availability of preferred brand
In case of non availability of desired milk product brand, 51% of respondents
go to another shop to buy that product. While 24% respondents will buy another
product and 19% of respondents can buy another brand. Only 6% of respondents said
that they will postpone purchase if they do not get their desired brand.
50
8/4/2019 Preference Repaired)
http://slidepdf.com/reader/full/preference-repaired 51/57
CHAPTER 5
FINDINGS AND CONCLUSION
• Mostly people prefer branded milk and milk products over unbranded branded
milk and milk-products.
• Milk, lassi and curd are most frequently used products of verka.
• People generally use branded milk and milk-products daily.
• Mostly people have planned decision to purchase branded milk and milk-
products.
• Price, taste and quality of the branded milk and milk-products are the features
which affect their purchase.
• The major problems w.r.t. branded products are lack of awareness and non-
availability.
• Quality assurance and security of homogeneous production are the factors for
which people prefer branded products over unbranded.
• The major source of information about branded milk and milk-products are
relatives and friends.
• Generally people do not feel that there is scarcity of milk-products in the
market.
• People are highly satisfied by packaging and quality of branded milk and
milk-products.
• In case of non availability, people mostly prefer to go to another shop to buy
that brand.
CONCLUSION
...............................................................
51
8/4/2019 Preference Repaired)
http://slidepdf.com/reader/full/preference-repaired 52/57
REFERENCES
• Abreu, (2000) http://www.indiatoday.com/itoday/20000710Ibusiness.html .
• Adamczyk, G. (2005). Preferencje konsumentów na rynku warzyw mrożonych.
W: K. Gutkowska, L. Nawojek (red.) Konsument żywności i jego zachowania
w warunkach polskiego członkowstwa w Unii Europejskiej. [Ford consumer
and his behaviour in conditions of polish memberships in European Union].
Warszawa: Wyd. SGGW, s. 143-150.
• Bhar, Chandan;·and Saxena, Amit (2005), "Forecasting of Milk Sales and
Retailer Growth of a Dairy using Statistical Technique", Synthesis - The Journal of BLS Institute of Management, Vol. 3, No.1, July - Dec., pp. 29-39.
• Chin-Feng Lin, (2002) "Segmenting customer brand preference: demographic
or psychographic", Journal of Product & Brand Management, Vol. 11 Iss: 4,
pp.249 - 268
• Dharmaraj, C. and Sudhahar, J. Clement, Brand Preference Factors of
Passenger Cars: An Empirical Assessment (September 28, 2010). The IUP
Journal of Brand Management, Vol. VII, No. 3, pp. 18-34, September 2010.
• Erdem, Tulin and Swait, Joffre, Characterizing Brand Effects on Choice and
Choice Set Formation Under Uncertainty (April 2006).
• Niedrich, Ronald W. and Swain, Scott D., The Effects of Exposure-Order and
Market Entry-Information on Brand Preference: A Dual Process Mode
• Niedrich, Ronald W. and Swain, Scott D., The Influence of Pioneer Status and
Experience Order on Consumer Brand Preference: A Mediated-Effects Model.
• Parekh, 1. V. (2006), "Milky Ways", Times Food Processing Journal, Oct. -
Nov.
• Prasad, M. V. Rama (2006), "Dairy Products: Consumer Preferences - A
Limited Survey of Vishakhapatnam", Journal of Marketing &
Communication, Vol. 2, Iss. 2, Sep. - Dec., pp. 63-71.
52
8/4/2019 Preference Repaired)
http://slidepdf.com/reader/full/preference-repaired 53/57
• Rajagopal, Dr., Brand Value, Preference and Customer Value Effects of Non-
Conventional Utility Products: An Experimental Analysis in Mexican Market
(February 2006). ITESM Working Paper No. 02/2006.
• Rajagopal, Dr., Conational Drivers Influencing Brand Preference Among
Consumers (April 30, 2009).
• Rojanasak Chomvilailuk, Ken Butcher, (2010) "Enhancing brand preference
through corporate social responsibility initiatives in the Thai banking sector",
Asia Pacific Journal of Marketing and Logistics, Vol. 22 Iss: 3, pp.397 - 418
• Sachan, Dharmendra (2005), "Fresh Fruits, Vegetables and Dairy Products:
India's Potential for Exports to other Asian Countries", Research Brief No. 89,
January, http://www.indiadairy.com/ind_marketing_quality.htm l.
• Torres Urdan, Flávio and Torres Urdan, Andre, The Effect of Brand Name and
Taste on Consumers' Buying Intentions: An Experimental Analysis. Available
at SSRN: http://ssrn.com/abstract=273841 or doi:10.2139/ssrn.273841
53

8/4/2019 Preference Repaired)
http://slidepdf.com/reader/full/preference-repaired 54/57
BIBLIOGRAPHY
• www.google.com
54

8/4/2019 Preference Repaired)
http://slidepdf.com/reader/full/preference-repaired 55/57
ANNEXURE
SURVEY QUESTIONNAIRE FOR
CUSTOMER PREFERENCE FOR BRANDED AND UNBRANDED MILK
PRODUCTS
Name- Marital status-
Age- Occupation- Employed
Gender- Male Female Self-employed
1) What type of milk and milk-products do you prefer?
Branded Unbranded
2) Which branded milk and milk-products do you use commonly?
3) How often you use above stated branded milk and milk-products?
Daily
Usually
Rarely
Do not use
4) What is the nature of your purchase decision in case of branded milk and
milk-products?
Impulsive
Planned
55

8/4/2019 Preference Repaired)
http://slidepdf.com/reader/full/preference-repaired 56/57
5) Which of the following factor(s) influence(s) you to choose branded milk
and milk-products? (Rank 1-3)
Price Quality
Fat control Taste
Relatives Availability
Advertisement Friends
Health condition Packaging
Doctors Others
6) What are the major problems w.r.t. branded milk-products? (Rank 1-6)
Lack of awareness dislike
High price low quality
Non-availability change of taste
7) What factors will make you to prefer branded milk and milk-products over
unbranded milk and milk-products?
Home delivery Safety from perishability
Lesser price Flavour
Quality assurance Improved taste
Security of homogeneous production
8) How did you know this brand?
Friends Doctors
Advertisement Relatives
Shop keepers Others (Specify)
56

8/4/2019 Preference Repaired)
http://slidepdf.com/reader/full/preference-repaired 57/57
9) Have you ever felt the scarcity of branded milk and milk-products in the
market?
Yes No
10) State the degree of satisfaction regarding branded milk and milk-products
in comparison of unbranded milk and milk-products in the following:
Characteristics Highly
Satisfactory
Satisfactory Not
Satisfactory
Price
Quality
Taste
Packaging
Advertisement
11) In case of non-availability of your preferred brand, what will you do?
Go to another shop
Postpone purchase
Will buy another brand
Will buy unbranded product


![Hsbc [repaired]](https://static.fdocuments.us/doc/165x107/548cb7bab47959e8278b4728/hsbc-repaired.jpg)


![Emarketing [repaired]](https://static.fdocuments.us/doc/165x107/555122efb4c9052d0e8b54a2/emarketing-repaired.jpg)