Prediction of Rainfall in California - CS229: Machine...
1
Recently, many regions of California have endured serious drought. This trend is especially damaging towards agricultural regions that support food production not only for the state, but for the rest of the country. The unpredictability of rainfall complicates the livelihoods of many farmers, who are uncertain about how they should manage their futures. The city of Fresno, CA is one example where these issues are particularly prominent. Prediction of Rainfall in California Swarna Sinha, [email protected] Background Regularized linear regression is similar to least squares regression, but with additional penalty terms including the L1- and L2-norms of the weights for different features. After 10-fold cross-validation, the optimal weights are selected. This technique encourages feature selection, driving some weights to zero. Elastic Net Regression This method aims to find a model that deviates from the response by a value no greater than ε for each training point. It appears to under-predict precipitation, where present. Support Vector Regression This is a boosted ensemble learning technique. While it fits the data very well, it may be prone to overfitting. Random Forest • Apply different machine learning algorithms to rainfall prediction. • Determine which algorithms are most suitable. • Discern which features affect precipitation. Table of results: SVR needs significant improvement. Currently, random forest performs the best. Elastic net also performs considerably well. For the final report, the models need to be improved to make predictions for the future, potentially to 2020. The data set could also be augmented to add other features. This will help in determining the characteristics affecting precipitation. For further extension in the future, these methods could be coupled with weather simulation data. Conclusions & Future Work Objectives Monthly weather data were acquired for Fresno, CA from the National Centers for Environmental Information (NCEI), an organization under the National Oceanic and Atmospheric Administration (NOAA). The feature set is limited since data sets are inconsistent over the years (i.e. different metrics taken some years compared to others). The dates range from 1950 – present. Features (per month): • Temperature statistics (avg., max., min.) • No. of cooling days • No. of heating days • No. of days with min. temperature under 0, 32 degrees F • No. of days with max. temperature greater than 32, 70, 90 degrees F Data Model Training Error No. of Training Samples Testing Error No. of Testing Samples Elastic Net 0.169 1432 0.168 89 SVR 0.411 1432 0.503 89 Random Forest 0.140 1432 0.146 89
Transcript of Prediction of Rainfall in California - CS229: Machine...
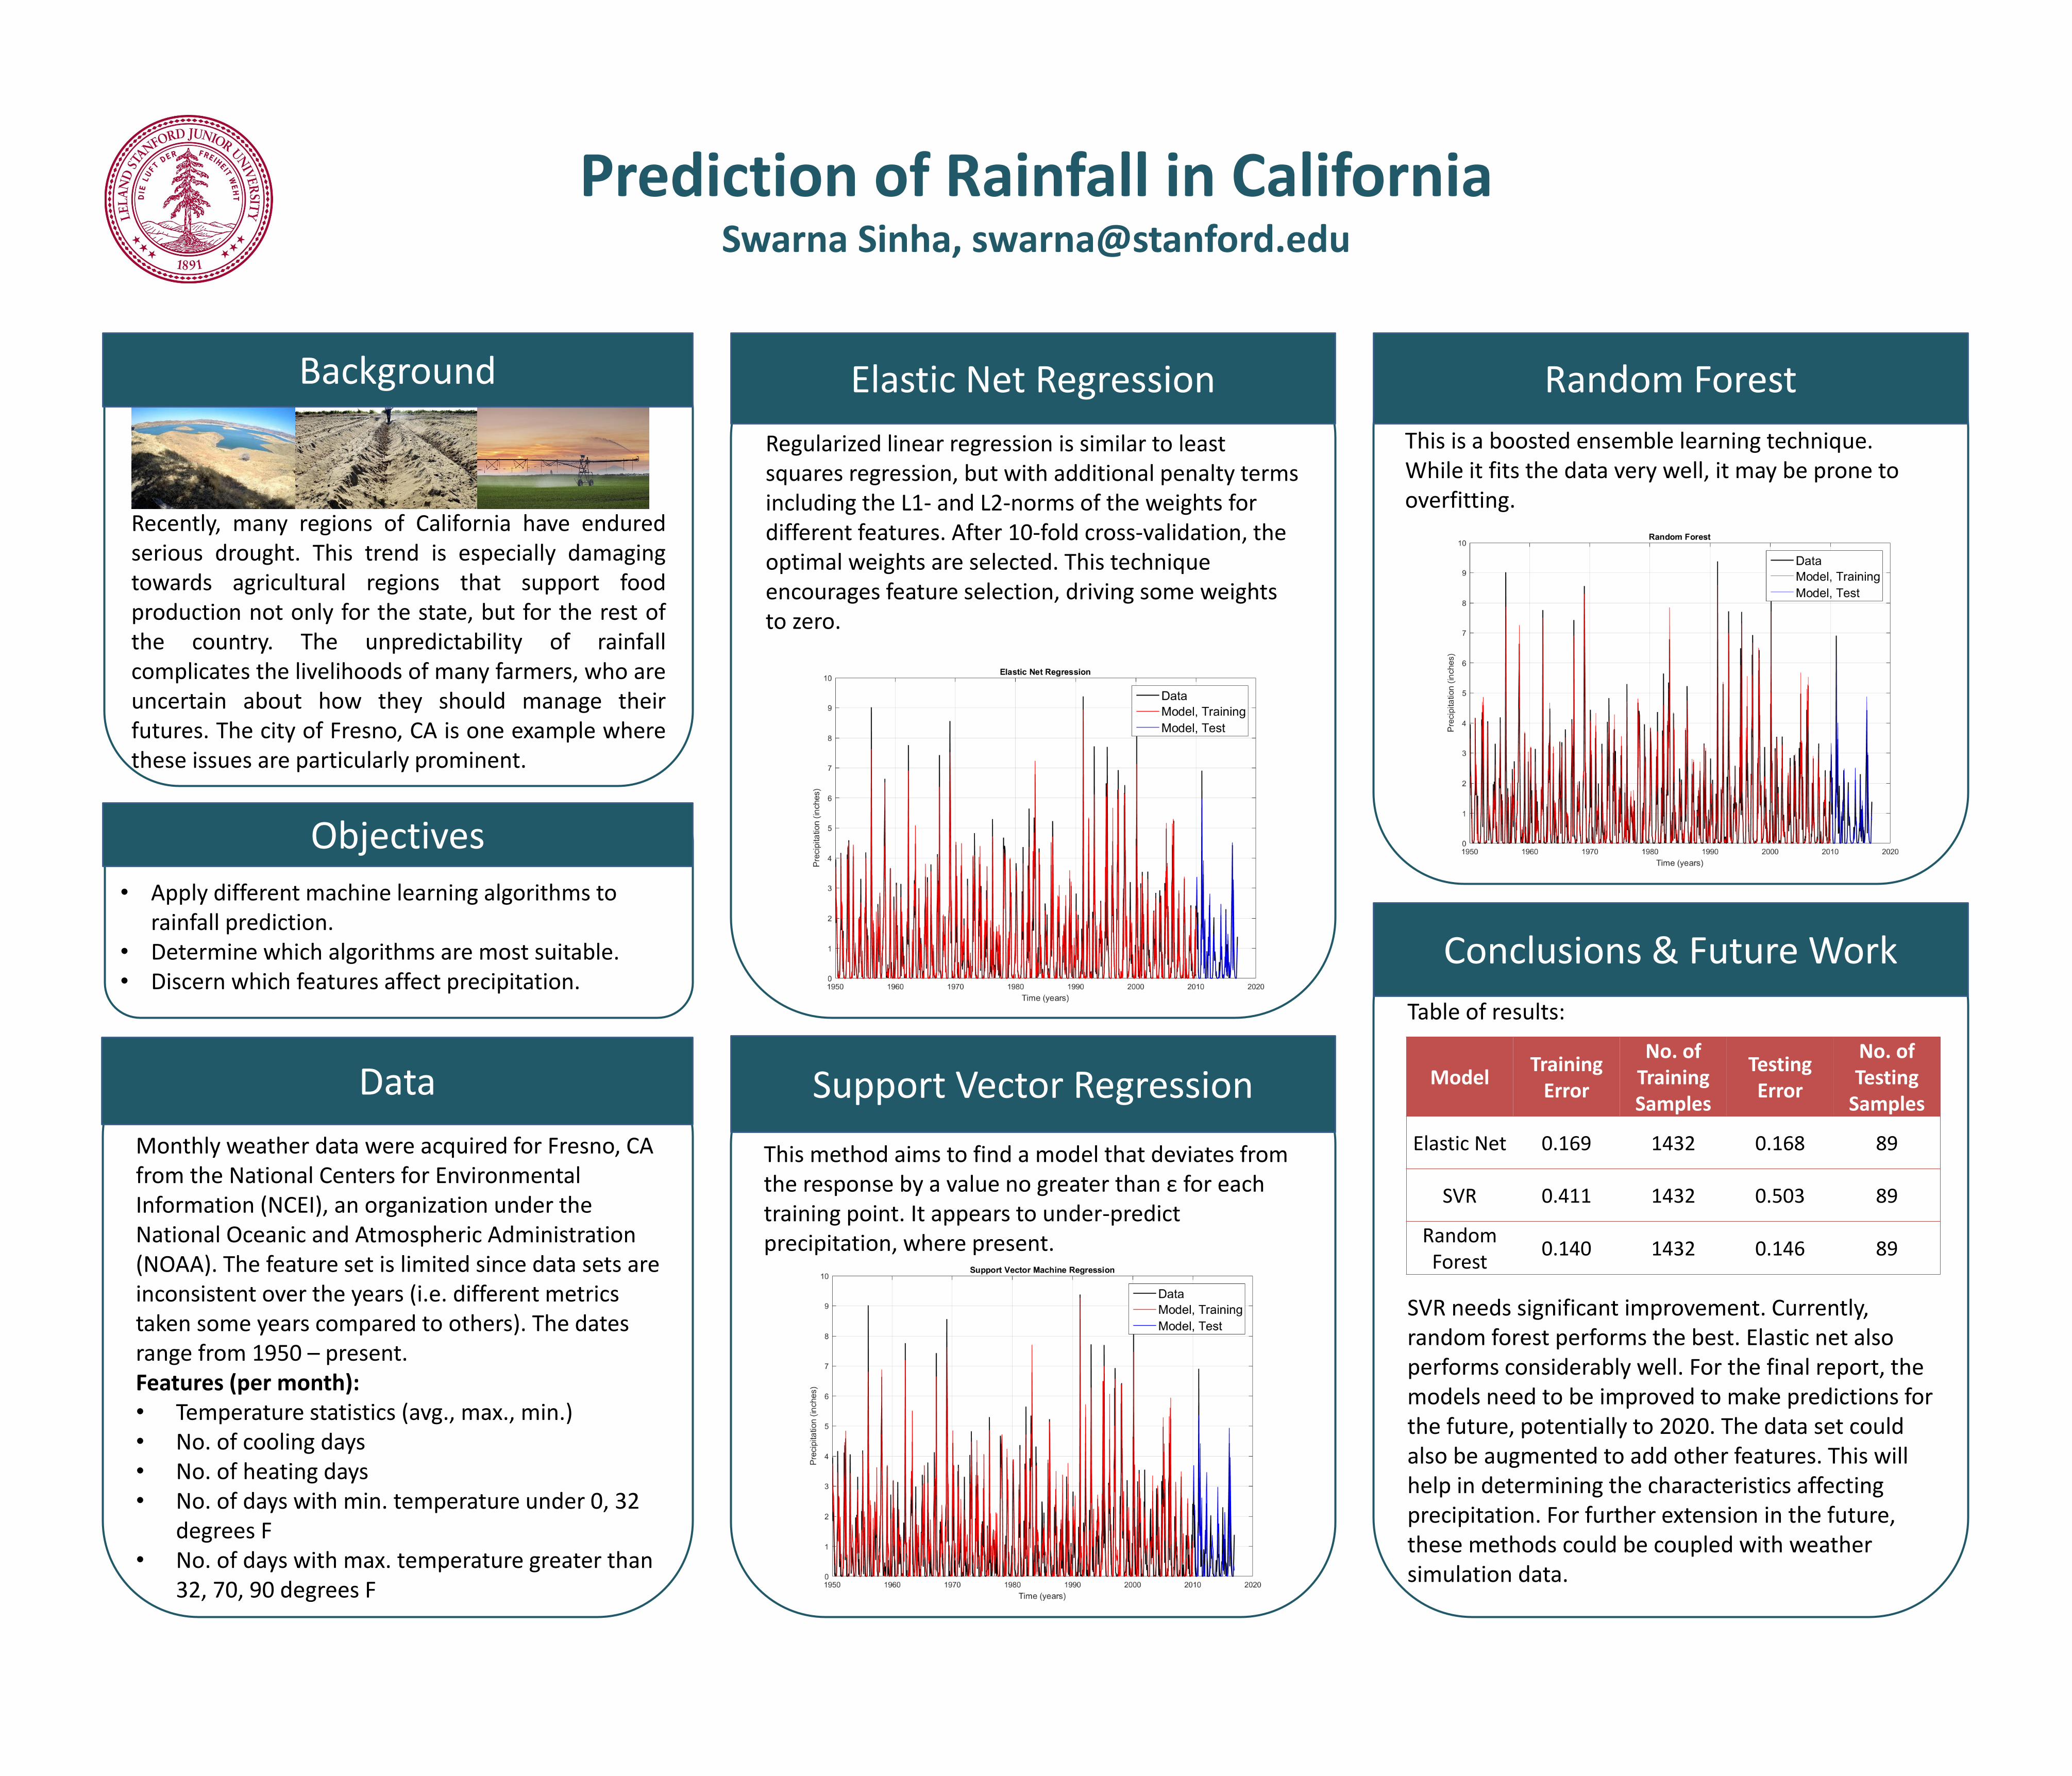
Recently, many regions of California have enduredserious drought. This trend is especially damagingtowards agricultural regions that support foodproduction not only for the state, but for the rest ofthe country. The unpredictability of rainfallcomplicates the livelihoods of many farmers, who areuncertain about how they should manage theirfutures. The city of Fresno, CA is one example wherethese issues are particularly prominent.
Prediction of Rainfall in CaliforniaSwarna Sinha, [email protected]
Background
Regularized linear regression is similar to least squares regression, but with additional penalty terms including the L1- and L2-norms of the weights for different features. After 10-fold cross-validation, the optimal weights are selected. This technique encourages feature selection, driving some weights to zero.
Elastic Net Regression
This method aims to find a model that deviates from the response by a value no greater than ε for each training point. It appears to under-predict precipitation, where present.
Support Vector Regression
This is a boosted ensemble learning technique. While it fits the data very well, it may be prone to overfitting.
Random Forest
• Apply different machine learning algorithms to rainfall prediction.
• Determine which algorithms are most suitable.• Discern which features affect precipitation.
Table of results:
SVR needs significant improvement. Currently, random forest performs the best. Elastic net also performs considerably well. For the final report, the models need to be improved to make predictions for the future, potentially to 2020. The data set could also be augmented to add other features. This will help in determining the characteristics affecting precipitation. For further extension in the future, these methods could be coupled with weather simulation data.
Conclusions & Future Work
Objectives
Monthly weather data were acquired for Fresno, CA from the National Centers for Environmental Information (NCEI), an organization under the National Oceanic and Atmospheric Administration (NOAA). The feature set is limited since data sets are inconsistent over the years (i.e. different metrics taken some years compared to others). The dates range from 1950 – present.Features (per month):• Temperature statistics (avg., max., min.)• No. of cooling days• No. of heating days• No. of days with min. temperature under 0, 32
degrees F• No. of days with max. temperature greater than
32, 70, 90 degrees F
Data ModelTraining
Error
No. of Training Samples
Testing Error
No. of Testing
Samples
Elastic Net 0.169 1432 0.168 89
SVR 0.411 1432 0.503 89
Random Forest
0.140 1432 0.146 89