Financial Distress and Bankruptcy Prediction: An empirical ...
Prediction of Corporate Bankruptcy from 2008 Through 2011
June Li University of Wisconsin, River Falls
This study examines the prediction of corporate failures in the U.S. during 2008-2011. Three prediction models are examined: Altman’s original Z-Score model, a re-estimated Z-Score model and a re-estimated model with an added variable. Through a series of discriminate analyses, the model with only one ratio “Market value of equity/Total liabilities” appears to have the highest bankruptcy predicting power. This lends support to the assertion of the superiority of market-based models in bankruptcy prediction to accounting-based models. Contrary to a popular criticism of the Z-Score model, total asset variability does not appear to be a significant factor for bankruptcy prediction. In addition, all models tend to have high type II error of mis-predicting a solvent firm as bankrupt. INTRODUCTION
The 2008 financial crisis has pushed the U.S. economy into its most severe recession since the Great Depression. The financial failures of many companies have had a devastating impact on world economy. Company failures negatively affect stakeholders. Prediction of corporate bankruptcy is an important aspect for the protection of the stakeholders’ interests.
Altman (1968) developed the “Z-Score” model to predict the financial failures of U.S. manufacturing firms. The Z-Score model is the best-known and most widely used financial distress test. The Z - Score measures how closely a firm resembles other firms that have filed for bankruptcy. It is a measure of corporate financial distress or economic bankruptcy.
The Z-Score model has drawn several statistical objections over the years because of its use of unadjusted accounting data, data from relatively small firms, and old data. There is evidence that the Z-Score coefficients should be re-estimated for the prediction of corporate distress involving different time periods or different industries (Grice & Ingram 2001).
The primary objective of this study is to test the accuracy of corporate failures prediction in the U.S. from 2008-2011using three models: Altman’s original model, a re-estimated model and a re-estimated model with an added variable. Z-Scores of the publicly held companies from these models are examined using financial data from one and two years prior to bankruptcy. The results would show which version of a model is superior in bankruptcy prediction.
The remainder of this paper includes the following sections. Literature review is followed by methodology and study results. Conclusions and implications are in the last section.
Journal of Accounting and Finance vol. 12(1) 2012 31
RELATED LITERATURE REVIEW
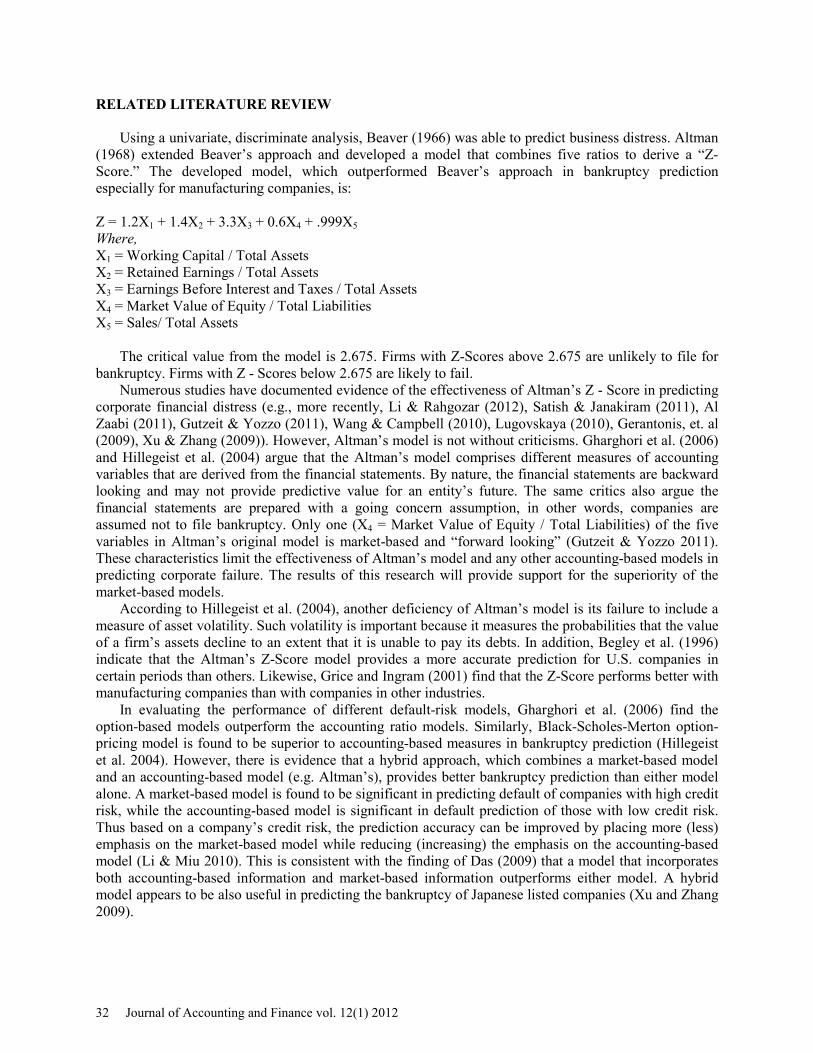
Using a univariate, discriminate analysis, Beaver (1966) was able to predict business distress. Altman (1968) extended Beaver’s approach and developed a model that combines five ratios to derive a “Z-Score.” The developed model, which outperformed Beaver’s approach in bankruptcy prediction especially for manufacturing companies, is: Z = 1.2X1 + 1.4X2 + 3.3X3 + 0.6X4 + .999X5 Where, X1 = Working Capital / Total Assets X2 = Retained Earnings / Total Assets X3 = Earnings Before Interest and Taxes / Total Assets X4 = Market Value of Equity / Total Liabilities X5 = Sales/ Total Assets
The critical value from the model is 2.675. Firms with Z-Scores above 2.675 are unlikely to file for bankruptcy. Firms with Z - Scores below 2.675 are likely to fail.
Numerous studies have documented evidence of the effectiveness of Altman’s Z - Score in predicting corporate financial distress (e.g., more recently, Li & Rahgozar (2012), Satish & Janakiram (2011), Al Zaabi (2011), Gutzeit & Yozzo (2011), Wang & Campbell (2010), Lugovskaya (2010), Gerantonis, et. al (2009), Xu & Zhang (2009)). However, Altman’s model is not without criticisms. Gharghori et al. (2006) and Hillegeist et al. (2004) argue that the Altman’s model comprises different measures of accounting variables that are derived from the financial statements. By nature, the financial statements are backward looking and may not provide predictive value for an entity’s future. The same critics also argue the financial statements are prepared with a going concern assumption, in other words, companies are assumed not to file bankruptcy. Only one (X4 = Market Value of Equity / Total Liabilities) of the five variables in Altman’s original model is market-based and “forward looking” (Gutzeit & Yozzo 2011). These characteristics limit the effectiveness of Altman’s model and any other accounting-based models in predicting corporate failure. The results of this research will provide support for the superiority of the market-based models.
According to Hillegeist et al. (2004), another deficiency of Altman’s model is its failure to include a measure of asset volatility. Such volatility is important because it measures the probabilities that the value of a firm’s assets decline to an extent that it is unable to pay its debts. In addition, Begley et al. (1996) indicate that the Altman’s Z-Score model provides a more accurate prediction for U.S. companies in certain periods than others. Likewise, Grice and Ingram (2001) find that the Z-Score performs better with manufacturing companies than with companies in other industries.
In evaluating the performance of different default-risk models, Gharghori et al. (2006) find the option-based models outperform the accounting ratio models. Similarly, Black-Scholes-Merton option-pricing model is found to be superior to accounting-based measures in bankruptcy prediction (Hillegeist et al. 2004). However, there is evidence that a hybrid approach, which combines a market-based model and an accounting-based model (e.g. Altman’s), provides better bankruptcy prediction than either model alone. A market-based model is found to be significant in predicting default of companies with high credit risk, while the accounting-based model is significant in default prediction of those with low credit risk. Thus based on a company’s credit risk, the prediction accuracy can be improved by placing more (less) emphasis on the market-based model while reducing (increasing) the emphasis on the accounting-based model (Li & Miu 2010). This is consistent with the finding of Das (2009) that a model that incorporates both accounting-based information and market-based information outperforms either model. A hybrid model appears to be also useful in predicting the bankruptcy of Japanese listed companies (Xu and Zhang 2009).
32 Journal of Accounting and Finance vol. 12(1) 2012

METHODOLOGY
Despite the various techniques for bankruptcy predictions, Altman’s Z-Score model remains to be the most extensively used and researched method. This study, therefore, focuses on Altman’s model. In addition, this study follows the first three of four steps in the development of bankruptcy prediction models identified by Altman et al. (1981): 1. Analyze bankrupt and solvent firms to identify most dissimilar financial characteristics between the groups before bankruptcy, 2. Reclassify the original sample using the financial characteristics, and 3. Test the model’s predictive ability in a holdout sample. Altman’s 4th step in bankruptcy prediction models is to use the model to predict future bankruptcies.
The sample in this research consists of all publicly traded companies that filed for Chapter 11 and Chapter 7 bankruptcies in the U.S. between 2008 and first quarter of 2011. Those companies were identified from two sources: COMPUSTAT and BankruptcyData.com. There were 106 companies and 66 companies that filed for Chapter 11 and Chapter 7 bankruptcies; respectively. Data were extracted for all 172 companies from COMPUSTAT and firms with incomplete or missing data were eliminated. The final sample size is 70.
A matched pair process is used in the study. For each bankrupt firm, a solvent firm in the same industry and of the closest asset size in the bankruptcy year was identified. For each bankrupt and matching solvent firms, the financial data were collected from COMPUSTAT one and two years prior to bankruptcy. A random sample of 20 out of the 70 bankrupt firms and their matched solvent firms were selected to test the accuracy of each model (prediction group). The remaining 50 bankrupt firms and their solvent counterparts were used as the “estimation group”.
To examine Altman’s original Z-Score model in predicting financial stress, the Z scores from one and two years prior to bankruptcy years were obtained from COMPUSTAT for each bankrupt and its matched solvent firm (Altman’s original model). In response to the issue of whether Z-Score model should be revised for bankruptcy prediction involving both manufacturing and non-manufacturing firms in different time periods, Altman original model’s coefficients were re-estimated using the estimation group (re-estimated model) and then tested for accuracy using the prediction group. In addition, to address the failure of the Altman’s model to include a measure of asset volatility, a new variable was added (X6) to the re-estimated model. The new variable is calculated as “(total assets one year prior to bankruptcy – total assets two years prior to bankruptcy)/ total assets two years prior to bankruptcy”. A series of discriminate analyses were performed, including step-wise method, for the re-estimated model and the re-estimated model with the add variable. STUDY RESULTS Descriptive Statistics of Variables
F tests using data from one and two years prior to bankruptcy are performed to test the individual variables’ discriminating powers. Table 1 shows that, except for the results using prior 2nd prediction group data, variable X4 is the only one that is significant at 0.05 level using all other years’ group data. For the same years, X4 has the highest F statistics than other variables do. These indicate a significant difference between bankrupt and solvent groups in X4 (Market Value of Equity / Total Liabilities). Surprisingly, contrary to prior expectations, all tests results indicate no significant difference in X6 , an indicator of asset variability.
Journal of Accounting and Finance vol. 12(1) 2012 33
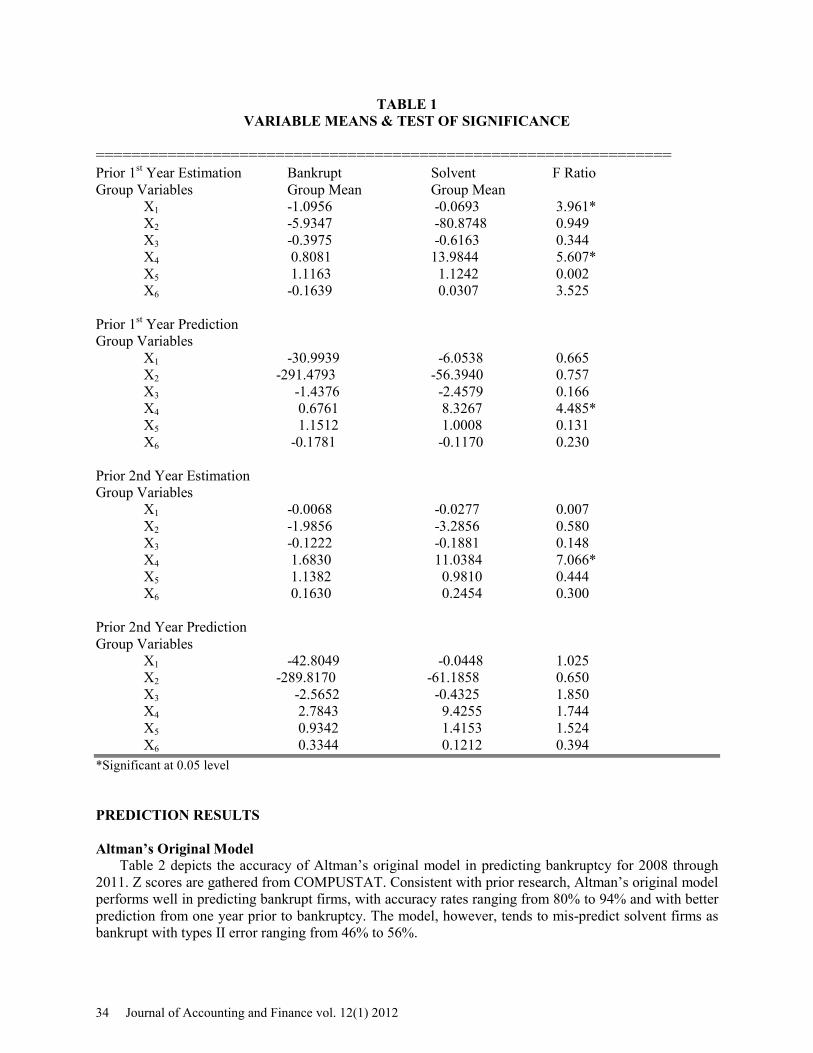
TABLE 1 VARIABLE MEANS & TEST OF SIGNIFICANCE
================================================================ Prior 1st Year Estimation Bankrupt Solvent F Ratio Group Variables Group Mean Group Mean X1 -1.0956 -0.0693 3.961* X2 -5.9347 -80.8748 0.949 X3 -0.3975 -0.6163 0.344 X4 0.8081 13.9844 5.607* X5 1.1163 1.1242 0.002 X6 -0.1639 0.0307 3.525 Prior 1st Year Prediction Group Variables X1 -30.9939 -6.0538 0.665
X2 -291.4793 -56.3940 0.757 X3 -1.4376 -2.4579 0.166 X4 0.6761 8.3267 4.485*
X5 1.1512 1.0008 0.131 X6 -0.1781 -0.1170 0.230 Prior 2nd Year Estimation Group Variables X1 -0.0068 -0.0277 0.007 X2 -1.9856 -3.2856 0.580 X3 -0.1222 -0.1881 0.148 X4 1.6830 11.0384 7.066* X5 1.1382 0.9810 0.444 X6 0.1630 0.2454 0.300 Prior 2nd Year Prediction Group Variables X1 -42.8049 -0.0448 1.025 X2 -289.8170 -61.1858 0.650 X3 -2.5652 -0.4325 1.850 X4 2.7843 9.4255 1.744 X5 0.9342 1.4153 1.524 X6 0.3344 0.1212 0.394 *Significant at 0.05 level PREDICTION RESULTS Altman’s Original Model
Table 2 depicts the accuracy of Altman’s original model in predicting bankruptcy for 2008 through 2011. Z scores are gathered from COMPUSTAT. Consistent with prior research, Altman’s original model performs well in predicting bankrupt firms, with accuracy rates ranging from 80% to 94% and with better prediction from one year prior to bankruptcy. The model, however, tends to mis-predict solvent firms as bankrupt with types II error ranging from 46% to 56%.
34 Journal of Accounting and Finance vol. 12(1) 2012

TABLE 2 SUMMARY Z – SCORE BANKRUPTCY PREDICTIONS
USING ALTMAN’S ORIGINAL MODEL
===================================================== One Year Prior Predicted Group Membership Accuracy Type I Type II To Bankruptcy Bankrupt Solvent Total Rate Error Error ================================================================
Actual Group Membership
Estimation Group
Bankrupt 47 3 50 94% 6% Solvent 28 22 50 44% 56%
Prediction Group Bankrupt 18 2 20 90% 10% Solvent 11 9 20 45% 55%
================================================================
2nd Year Prior Predicted Group Membership Accuracy Type I Type II To Bankruptcy Bankrupt Solvent Total Rate Error Error ================================================================ Actual Group Membership
Estimation Group
Bankrupt 40 10 50 80% 20% Solvent 23 27 50 54% 46%
Prediction Group Bankrupt 17 3 20 85% 15% Solvent 10 10 20 50% 50%
====================================================== Re-Estimated Model
Altman’s model coefficients were re-estimated using estimation group and then tested for accuracy using the prediction group. Using the estimation group data from one year prior to bankruptcy, the discriminate analysis produced the following model: Z = 0.340X1 – 0.002X2 + 0.003X3 + 0.022X4 + 0.027X5 – 0.075.
As depicted in Table 3, the results are mixed. The re-estimated model accurately predicts 70% of bankrupt firms for one year prior to bankruptcy, with accuracy of 100% using the prediction group data. The same model produced 72% accuracy rate for classifying solvent firms. This is higher than the prediction results produced by Altman’s original model. However, when using prediction group data, the accuracy rate dropped to 35%. Using data from two years prior to bankruptcy, the re-estimated model correctly predicted 92% of bankrupt firms and 75% using the prediction group data. Similar to Altman’s original model results, the prediction power for solvent firms is less than ideal with type II error of 68% and 55% for estimation and prediction groups, respectively.
Journal of Accounting and Finance vol. 12(1) 2012 35

TABLE 3 SUMMARY Z – SCORE BANKRUPTCY PREDICTIONS
USING RE-ESTIMATED MODEL
===================================================== One Year Prior Predicted Group Membership Accuracy Type I Type II To Bankruptcy Bankrupt Solvent Total Rate Error Error ================================================================ Actual Group Membership
Estimation Group
Bankrupt 35 15 50 70% 30% Solvent 14 36 50 72% 28%
Prediction Group Bankrupt 20 0 20 100% 0 Solvent 13 7 20 35% 65%
================================================================
2nd Year Prior Predicted Group Membership Accuracy Type I Type II To Bankruptcy Bankrupt Solvent Total Rate Error Error ================================================================ Actual Group Membership
Estimation Group
Bankrupt 46 4 50 92% 8% Solvent 34 16 50 32% 68%
Prediction Group Bankrupt 15 5 20 75% 25% Solvent 11 9 20 45% 55%
======================================================
X4 (Re-Estimated Step-Wise) Model A multiple discriminate step-wise technique is applied to the re-estimated model which includes
variables X1 through X5. The results (Table 4) is a model which contains only one variable X4 (Market Value of Equity / Total Liabilities). Using the estimation group data from one year prior to bankruptcy, the model obtained is: Z = 0.036X4 - 0.266. The critical value is 0 for this model. Firms with a Z score below 0 are predicted to be bankrupt. Those with a Z score above 0 are predicted to be solvent. The model derived from data two years prior to bankrupt is similar to the one with data from prior 1st year with the same critical value: Z = 0.057X4 - 0.361.
The model predicts bankruptcy firms remarkably well with accuracy rate of 96% (94%) and 100% (90%) for estimation and prediction groups, respectively for one year prior to bankruptcy (two years prior to bankruptcy). These results are superior to those produced by Altman’s original model and the re-estimated model. However, the model, like the two previous models, falls short on classifying solvent firms as such, with high type II errors ranging from 68% to 80% for the both years.
36 Journal of Accounting and Finance vol. 12(1) 2012
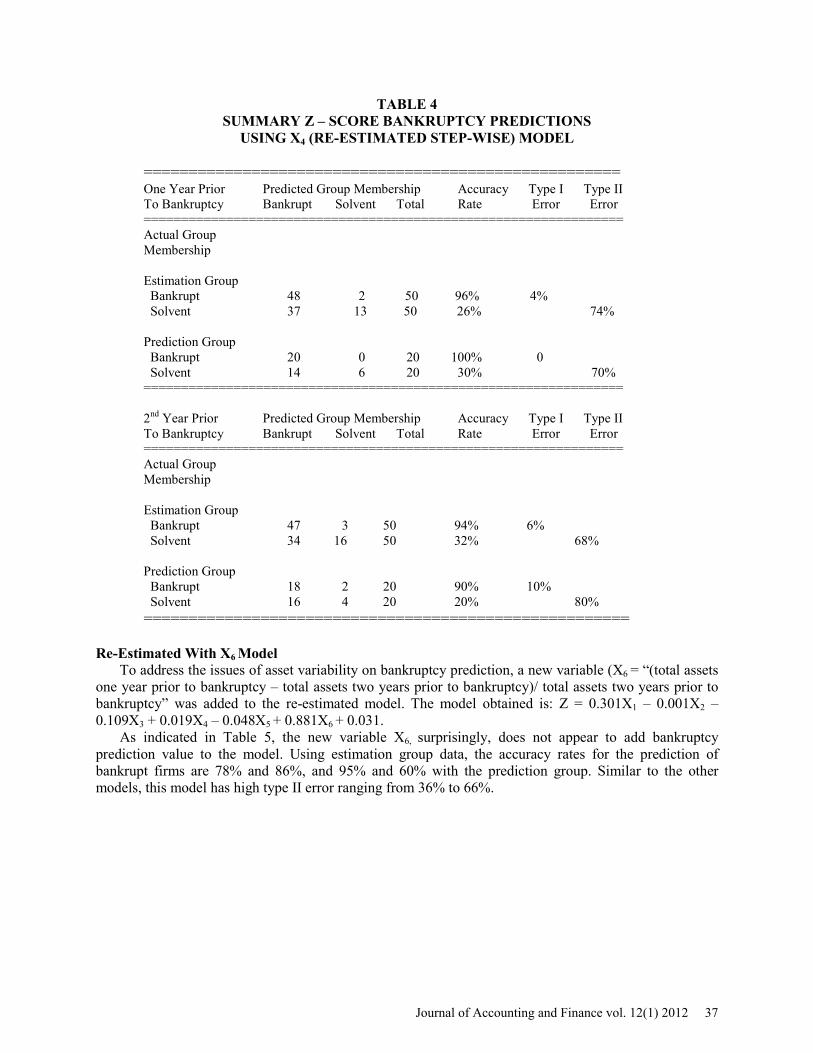
TABLE 4 SUMMARY Z – SCORE BANKRUPTCY PREDICTIONS
USING X4 (RE-ESTIMATED STEP-WISE) MODEL
===================================================== One Year Prior Predicted Group Membership Accuracy Type I Type II To Bankruptcy Bankrupt Solvent Total Rate Error Error ================================================================ Actual Group Membership
Estimation Group
Bankrupt 48 2 50 96% 4% Solvent 37 13 50 26% 74%
Prediction Group Bankrupt 20 0 20 100% 0 Solvent 14 6 20 30% 70%
================================================================
2nd Year Prior Predicted Group Membership Accuracy Type I Type II To Bankruptcy Bankrupt Solvent Total Rate Error Error ================================================================ Actual Group Membership
Estimation Group
Bankrupt 47 3 50 94% 6% Solvent 34 16 50 32% 68%
Prediction Group Bankrupt 18 2 20 90% 10% Solvent 16 4 20 20% 80%
======================================================
Re-Estimated With X6 Model To address the issues of asset variability on bankruptcy prediction, a new variable (X6 = “(total assets
one year prior to bankruptcy – total assets two years prior to bankruptcy)/ total assets two years prior to bankruptcy” was added to the re-estimated model. The model obtained is: Z = 0.301X1 – 0.001X2 – 0.109X3 + 0.019X4 – 0.048X5 + 0.881X6 + 0.031.
As indicated in Table 5, the new variable X6, surprisingly, does not appear to add bankruptcy prediction value to the model. Using estimation group data, the accuracy rates for the prediction of bankrupt firms are 78% and 86%, and 95% and 60% with the prediction group. Similar to the other models, this model has high type II error ranging from 36% to 66%.
Journal of Accounting and Finance vol. 12(1) 2012 37

TABLE 5 SUMMARY Z – SCORE BANKRUPTCY PREDICTIONS
USING RE-ESTIMATED WITH X6 MODEL ===================================================== One Year Prior Predicted Group Membership Accuracy Type I Type II To Bankruptcy Bankrupt Solvent Total Rate Error Error ================================================================ Actual Group Membership
Estimation Group
Bankrupt 39 11 50 78% 22% Solvent 18 32 50 64% 36%
Prediction Group Bankrupt 19 1 20 95% 5% Solvent 12 8 20 40% 60%
================================================================
2nd Year Prior Predicted Group Membership Accuracy Type I Type II To Bankruptcy Bankrupt Solvent Total Rate Error Error ================================================================ Actual Group Membership
Estimation Group
Bankrupt 43 7 50 86% 14% Solvent 33 17 50 34% 66%
Prediction Group Bankrupt 12 8 20 60% 40% Solvent 9 11 20 55% 45%
======================================================
X4 & X6 Model A discriminate analysis step-wise approach produced a model with two significant variables: Z =
0.029X4 + 1.297X6 – 0.13. As disclosed in Table 6, the model performs well in predicting bankrupt firms with accuracy rate of ranging from 85% to 100% from one and two years prior to bankruptcy. However, these results are not as good as the model with X4 only. With estimation group data from two year prior to bankruptcy, X4 is the only significant ratio in the model. This appears to solidify the bankruptcy prediction power of a model consisting of only the ratio X4. Consistent with the results from the last model, X6, the measure for asset variability in this study, does not appear to increase a model’s bankruptcy prediction power.
38 Journal of Accounting and Finance vol. 12(1) 2012
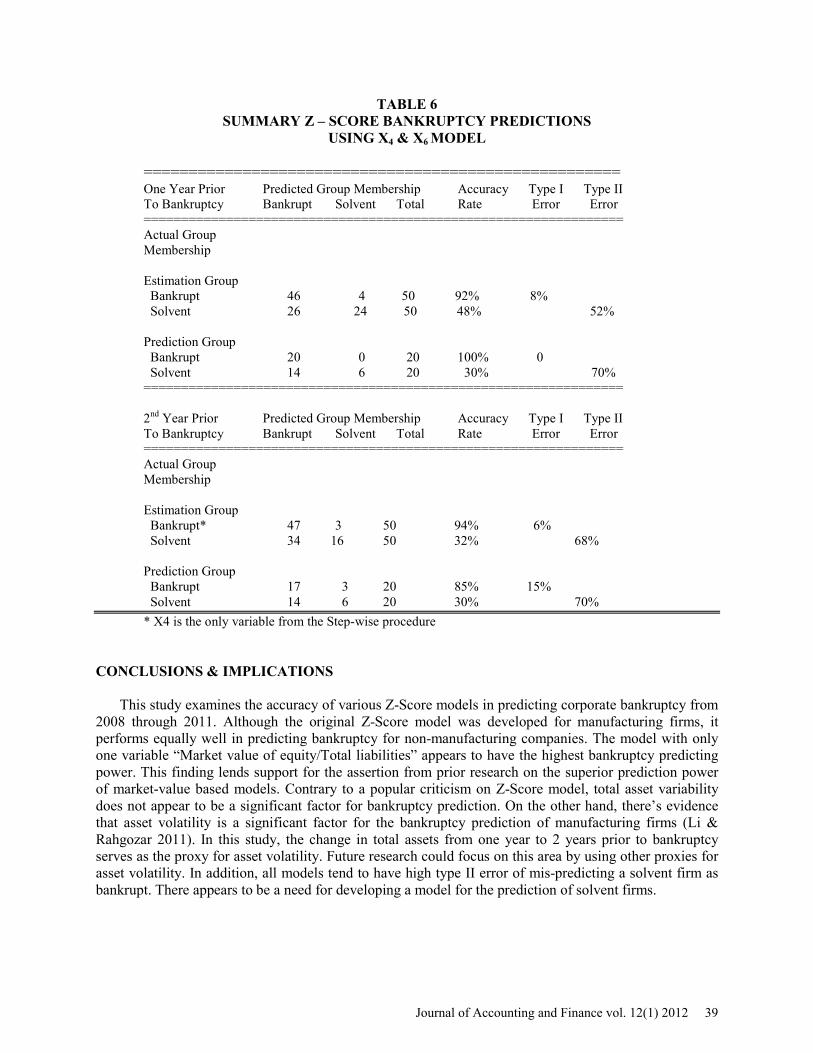
TABLE 6 SUMMARY Z – SCORE BANKRUPTCY PREDICTIONS
USING X4 & X6 MODEL
===================================================== One Year Prior Predicted Group Membership Accuracy Type I Type II To Bankruptcy Bankrupt Solvent Total Rate Error Error ================================================================ Actual Group Membership
Estimation Group
Bankrupt 46 4 50 92% 8% Solvent 26 24 50 48% 52%
Prediction Group Bankrupt 20 0 20 100% 0 Solvent 14 6 20 30% 70%
================================================================
2nd Year Prior Predicted Group Membership Accuracy Type I Type II To Bankruptcy Bankrupt Solvent Total Rate Error Error ================================================================ Actual Group Membership
Estimation Group
Bankrupt* 47 3 50 94% 6% Solvent 34 16 50 32% 68%
Prediction Group Bankrupt 17 3 20 85% 15%
Solvent 14 6 20 30% 70% * X4 is the only variable from the Step-wise procedure
CONCLUSIONS & IMPLICATIONS
This study examines the accuracy of various Z-Score models in predicting corporate bankruptcy from
2008 through 2011. Although the original Z-Score model was developed for manufacturing firms, it performs equally well in predicting bankruptcy for non-manufacturing companies. The model with only one variable “Market value of equity/Total liabilities” appears to have the highest bankruptcy predicting power. This finding lends support for the assertion from prior research on the superior prediction power of market-value based models. Contrary to a popular criticism on Z-Score model, total asset variability does not appear to be a significant factor for bankruptcy prediction. On the other hand, there’s evidence that asset volatility is a significant factor for the bankruptcy prediction of manufacturing firms (Li & Rahgozar 2011). In this study, the change in total assets from one year to 2 years prior to bankruptcy serves as the proxy for asset volatility. Future research could focus on this area by using other proxies for asset volatility. In addition, all models tend to have high type II error of mis-predicting a solvent firm as bankrupt. There appears to be a need for developing a model for the prediction of solvent firms.
Journal of Accounting and Finance vol. 12(1) 2012 39

REFERENCES Al Zaabi, O.S.H. (2011). Potential for the Application of Emerging Market Z-Score in UAE Islamic Banks. International Journal of Islamic and Middle Eastern Finance and Management. Vol. 4, 2, 158 – 173. Altman, Edward I. (September, 1968). "Financial Ratios, Discriminant Analysis and the Prediction of Corporate Bankruptcy". Journal of Finance: 189–209. Altman, E.I. (1968). Financial Ratios, Discriminant Analysis and the Prediction of Corporation Bankruptcy. The Journal of Finance, 23: 589-609. Altman, E.I, Avery, R., Eisenbeis, R. & Sinkey, J. (1981). Application of Classification Techniques in Business, Banking and Finance, Contemporary Studies in Economic and Financial Analysis, Vol 3. Greenwich, CT:JAI Press. Altman, E.I. and Hotchkiss, E. (2005). Corporate Financial Distress and Bankruptcy, 3rd edition, New York: John Wiley and Sons. Beaver, W.H. (1966). Financial Ratios as Predictors of Failure. Journal of Accounting Research, 4: 71-111. Begley J., Ming J. and Watts S. (1996). Bankruptcy Classification Errors in the 1980s: An Empirical Analysis of Altman’s and Ohlson’s Models. Review of Accounting Studies, 267-284. Bris, A., Welch, I. and Zhu, N. (2006). The Cost of Bankruptcy: Chapter 7 Liquidation versus Chapter 11 Reorganization. The Journal of Finance, Vol. LXI, No. 3, June. Das, S.R. (2009). Accounting-Based Versus Market-Based Cross-Sectional Models of CDS Spreads. Journal of Banking & Finance, April, Vol. 33, issue 4, 719-730. Gerantonis, N., Vergos, K. and Christopoulos, A.G. (2009). “Can Altman Z - Score Models Predict Business Failures in Greece?”. Research Journal of International Studies, 12, 21- 28. Gharghori, P., Chan, H. and Faff, R. (2006). Investigating the Performance of Alternative Default-Risk Models: Option-Based Versus Accounting-Based Approaches. Austrian Journal of Management, Vol. 31, No. 2, 207-234. Grice, J.S and Ingram, R.W. (2001). Test of Generalizability of Altman’s Bankruptcy Prediction Model. Journal of Business Research, 10, 53-61. Gutzeit, G and Yozzo, J. (2011). Z-Score Performance Amid Great Recession. American Bankruptcy Institute Journal, 30, 2, 44, 45 & 80. Hillegeist, S.A. et. al (2004). Assessing the Probability of Bankruptcy. Review of Accounting Studies, 9, 5-34. http://sec.gov/investor/pubs/bankrupt.htm, 02-03-2009
40 Journal of Accounting and Finance vol. 12(1) 2012

Li, J. and Rahgozar, R. (2012). Application of the Z -Score Model with Consideration of Total Assets Volatility in Predicting Corporate Financial Failures from 2000-2010. Journal of Accounting & Finance, (forthcoming). Li, M-Y L and Miu, P (2010). A Hybrid Bankruptcy Prediction Model with Dynamic Loadings on Accounting-Ratio-Based and Market-Based Information: A Binary Quantile Regression Approach. Journal of Empirical Finance, 17, 818-833. Lugovskaya, L. (2010). Predicting Default of Russian SMEs on The Basis of Financial and Non-Financial Variables. Journal of Financial Services Marketing, Vol. 14, 4, 301-313. Satish, Y.M. and Janakiram B (2011). Turnaround Strategy Using Altman Model as a Tool in Solar Water Heater Industry in Karnataka. International Journal of Business and Management. Vol. 6, 1, 199-206. Wang, Y. and Campbell, M. (2010). Business Failure Prediction for Publicly Listed Companies in China. Journal of Business and Management, Vol. 16, 75-88.
Journal of Accounting and Finance vol. 12(1) 2012 41