![Discovering Yelp Elites: Reifying Yelp Elite Selection Criterion · 2018-02-05 · A. Yelp Challenge Dataset We obtain the dataset from the Yelp Dataset Challenge [4] which includes](https://static.fdocuments.us/doc/165x107/5f23397707fa8e71780e4974/discovering-yelp-elites-reifying-yelp-elite-selection-criterion-2018-02-05-a.jpg)
Predicting Yelp Ratings Using User Friendship Network...
9
Predicting Yelp Ratings Using User Friendship Network Information Wenqing Yang (wenqing), Yuan Yuan (yuan125), Nan Zhang (nanz) December 7, 2015 1 Introduction With the widespread of B2C businesses, many products and service providers need both evaluation and prediction of customers’ feedback. For example, Yelp has a five-star quality rating system of restaurants as well as review text, which generates a big volume of ex- plicit and implicit user data. Consequently, a lot of meaningful research questions can be answered using Yelp’s datasets. In this project, we attempt to predict the rating a user will give to a restaurant listed on Yelp using Yelp’s Challenge Dataset. Being able to predict the rating a user assigns to a restaurant is helpful when trying to build better recommendation systems on Yelp. We approach the problem from a social network analysis perspective by incorporating Yelp user-user friendship networks in our predictions, and we attempt to test if the additional network information enhances the accuracy of the rating predictions. 2 Literature Review With the vast amount of information on products and businesses available to users online nowadays, there is increasing interest in developing recommender systems that provide users with personalized recommendations on items. Usually these systems work by pre- dicting numeric ratings users give products or businesses, and in general they belong to one of two types: content-based methods or collaborative filtering based methods. Content-based methods compare how similar a target item is to items that the user has rated before and gives a predicted rating based on the user’s previous ratings. Mooney and Roy determine the similarity between books by mining the text in book descriptions on Amazon.com and then recommend similar books to users [5]. Sarwar, Konstan and Riedl compare different methods of computing item similarity and different methods of producing predictions from the computed similarities [8]. Pazzani and Billsus allow users to provide a profile of webpages that they find “interesting” and then revise this profile by comparing the similarity between text on webpages [6]. 1
Transcript of Predicting Yelp Ratings Using User Friendship Network...

Predicting Yelp Ratings Using User Friendship Network
Information
Wenqing Yang (wenqing), Yuan Yuan (yuan125), Nan Zhang (nanz)
December 7, 2015
1 Introduction
With the widespread of B2C businesses, many products and service providers need bothevaluation and prediction of customers’ feedback. For example, Yelp has a five-star qualityrating system of restaurants as well as review text, which generates a big volume of ex-plicit and implicit user data. Consequently, a lot of meaningful research questions can beanswered using Yelp’s datasets.
In this project, we attempt to predict the rating a user will give to a restaurant listed onYelp using Yelp’s Challenge Dataset. Being able to predict the rating a user assigns to arestaurant is helpful when trying to build better recommendation systems on Yelp. Weapproach the problem from a social network analysis perspective by incorporating Yelpuser-user friendship networks in our predictions, and we attempt to test if the additionalnetwork information enhances the accuracy of the rating predictions.
2 Literature Review
With the vast amount of information on products and businesses available to users onlinenowadays, there is increasing interest in developing recommender systems that provideusers with personalized recommendations on items. Usually these systems work by pre-dicting numeric ratings users give products or businesses, and in general they belong toone of two types: content-based methods or collaborative filtering based methods.
Content-based methods compare how similar a target item is to items that the user hasrated before and gives a predicted rating based on the user’s previous ratings. Mooney andRoy determine the similarity between books by mining the text in book descriptions onAmazon.com and then recommend similar books to users [5]. Sarwar, Konstan and Riedlcompare different methods of computing item similarity and different methods of producingpredictions from the computed similarities [8]. Pazzani and Billsus allow users to providea profile of webpages that they find “interesting” and then revise this profile by comparingthe similarity between text on webpages [6].
1
On the other hand, collaborative filtering methods rely on the assumption that users similarto each other tend to like the same items or tend to give similar ratings. Koren, Bell andVolinsky, the winners of the Netflix Prize Contest, summarize the application and flexibilityof matrix factorization techniques used in recommender systems, and they introduce howto use singluar value decomposition (SVD), regularization, stochastic gradient descent andalternating least squares to tackle missing data problems [3]. McAuley and Leskovec uselatent factor models to uncover hidden dimensions in review ratings and Latent DirichletAllocation to uncover the hidden dimensions in review text [4]. Yu et al. develop an al-gorithm to recommend web communities to users, and they solve the sparsity problem intraditional collaborative filtering methods by generating the latent link between communi-ties and members using latent topic associations [7].
There have also been attempts to improve traditional recommender systems by taking intoconsideration the social relations among users. He and Chu present a social network-basedrecommender system (SNRS) that incorporates the influence from both immediate friendsand distant friends of a user [1]. They test their recommender system on Yelp’s dataset,and they find that SNRS performs better than other traditional methods. Using users’contact information on Flickr, Zheng and Bao are able to prove the usefulness of users’social network structure when recommending Flickr groups to users [10]. Yang et al. focuson matching users to Yahoo services using users’ contacts on Yahoo! Pulse [9]. They pro-pose a hybrid model that combines a factor-based random walk model to explain friendshipconnections and a coupled latent factor model to uncover interest interactions.
Taking inspiration from the previous work done, we use a latent factor model with biasterms as our baseline method for predicting user ratings of restaurants. Since previousstudies have shown that user social relations are effective at improving rating predictions, weimprove our baseline model by adding users’ friends’ information into the model. Intuitively,it is reasonable to add user-user interaction because people often go to restaurants withfriends, so their friends’ preferences will influence their own preferences to some extent.However, not all friends’ opinions are equal, and depending on how friends are involved inthe Yelp friendship network their opinions may be thought of as more or less reliable. Takingthis fact into consideration, we further weight friends’ ratings by their degree centrality.
3 Data Summary
3.1 Description
The dataset we choose to work with is the Yelp Challenge Dataset. Compiled for researchersand students to explore a wide variety of topics on Yelp, the Challenge Dataset includes1.6 million reviews and ratings, 481,000 business attributes, a social network of 366,000users for a total of 2.9 million social edges, and aggregated check-ins over time for eachof the 61,000 businesses. The businesses included in the dataset are located in the U.K.,Germany, Canada and the U.S. This dataset is particularly suitable for our purposes, sincein addition to user ratings of businesses, it also provides information on which users arefriends with each other on Yelp. The data is available for download via the Yelp Dataset
2

Challenge website in the form of .json files (http://www.yelp.com/dataset_challenge).
Number of users 269231
Number of restaurants 21892
Number of reviews 990627
Average review rating 3.0
Table 1: Data Statistics
Since Yelp is best known for its reviews on restaurants, we only explore restaurants in theU.S. and leave out the other business types for our project. After applying these filters, weend up with 21892 businesses that are identified as restaurants and 269231 users that haveposted a total of 990627 reviews at these restaurants (Table 1).
3.2 Network Properties and Visualization
To construct the Yelp user-user friendship network, we let each user be a node, and add anundirected edge between two users if they are friends with each other on Yelp. Summarystatistics of the Yelp friendship graph are shown in Table 2 and the connected componentsinformation is shown in Table 3. From the connected components information, we can seethat the connections of the network are very sparse. Approximately 50% of the users donot have friends. This can also be seen from the degree distribution plotted in Figure 1.The degree distribution of nodes is extremely right-skewed, with most nodes having degreeless than 120 and 1.06% of nodes having degree more than 120. It approximately follows apower-law distribution with α = 1.44.
Number of nodes 269231
Number of edges 986864
Alpha of power-law 1.44
Table 2: Graph Statistics
Size of CCs Number of CCs
1 135648
2 1763
3 162
4 24
5 7
6 2
7 2
129414 1
Table 3: Connected Components (CC) Info
Figure 1: Power Law Distribution of YelpDataset
3

To create the visualization of the network, we filter out nodes with degree more than 120,and take a random sample of 10% of the remaining nodes. We plot the Yelp friendshipnetwork using these sampled nodes in Gephi and apply the Force Atlas 2 layout. Afterlooking at user attributes such as the average rating users give, number of reviews posted,number of years being a Yelp user, restaurant locations most reviewed, restuarant categoriesmost reviewed etc., we observe that the network shows clustering pattern by most reviewedrestaurant locations. Intuitively, this makes sense. Since people go to restaurants togetherwith friends, we would expect friendship clustering to show seperation pattern by location.
Figure 2: Yelp friendship network with nodes colored by location
4 Baseline Model and Results
4.1 Model
The basic model we use to predict ratings is the “standard” latent-factor model.
r̂u,i = µ+ au + bi + qTi pu
Here, r̂u,i is the prediction of the rating for item i by user u. µ is a global offset parameter.au and bi are user and item biases respectively. pu and qi are user and item factors. The
4

system learns by minimizing the Error Sum of Squares (SSE) combined with regularization.
min∑
(u,i)∈τ
[(ru,i − r̂u,i)2 + λ(‖pu‖2 + ‖qi‖2 + a2u + b2i )]
• Initialization: µ is given by averaging ratings and we will not update it during itera-tions. au and bi are initialized by averaging ratings and residuals. We would like puand qi for all users u and items i to be such that qTi pu ∈ [0, 5]. So we initialize allelements of p and q to random values in [0,
√5/k], where k is the number of latent
factors.
• Update: We use stochastic gradient descent to perform updates according to theupdate equations shown below.
εu,i ← ru,i − r̂u,iau ← au + η(εu,i − λau)
bi ← bi + η(εu,i − λbi)pu ← pu + η(εu,iqi − λpu)
qi ← qi + η(εu,ipu − λqi)
(1)
• Parameters: We read each line of the rating file from disk and update the parametersfor each line. Each iteration of the algorithm will read the whole file. We set thenumber of iterations to be 100, and the step size η to be 0.1. We then try out differentvalues for the number of latent factors k and the regularization parameter λ.
4.2 Results
(a) λ = 0 (b) λ = 0.2 (c) λ = 0.4
(d) λ = 0.6 (e) λ = 0.8 (f) λ = 1
Figure 3: Baseline model training and test MSE for different k’s and λ’s
5
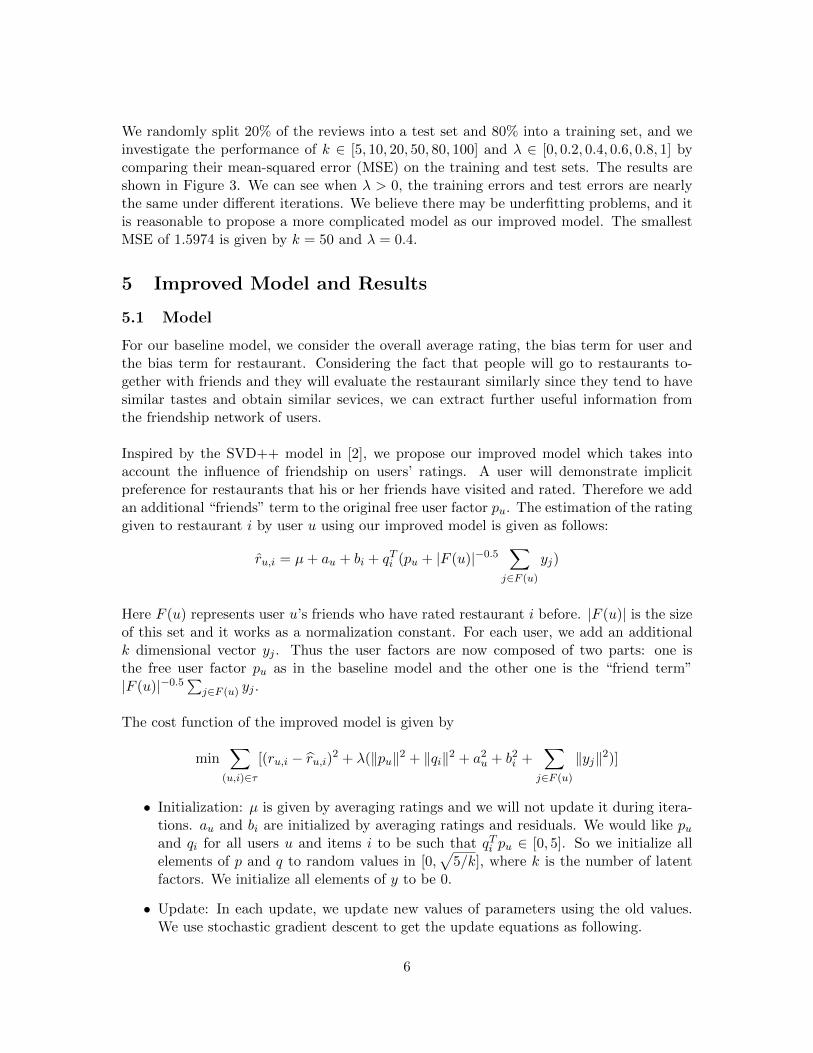
We randomly split 20% of the reviews into a test set and 80% into a training set, and weinvestigate the performance of k ∈ [5, 10, 20, 50, 80, 100] and λ ∈ [0, 0.2, 0.4, 0.6, 0.8, 1] bycomparing their mean-squared error (MSE) on the training and test sets. The results areshown in Figure 3. We can see when λ > 0, the training errors and test errors are nearlythe same under different iterations. We believe there may be underfitting problems, and itis reasonable to propose a more complicated model as our improved model. The smallestMSE of 1.5974 is given by k = 50 and λ = 0.4.
5 Improved Model and Results
5.1 Model
For our baseline model, we consider the overall average rating, the bias term for user andthe bias term for restaurant. Considering the fact that people will go to restaurants to-gether with friends and they will evaluate the restaurant similarly since they tend to havesimilar tastes and obtain similar sevices, we can extract further useful information fromthe friendship network of users.
Inspired by the SVD++ model in [2], we propose our improved model which takes intoaccount the influence of friendship on users’ ratings. A user will demonstrate implicitpreference for restaurants that his or her friends have visited and rated. Therefore we addan additional “friends” term to the original free user factor pu. The estimation of the ratinggiven to restaurant i by user u using our improved model is given as follows:
r̂u,i = µ+ au + bi + qTi (pu + |F (u)|−0.5∑
j∈F (u)
yj)
Here F (u) represents user u’s friends who have rated restaurant i before. |F (u)| is the sizeof this set and it works as a normalization constant. For each user, we add an additionalk dimensional vector yj . Thus the user factors are now composed of two parts: one isthe free user factor pu as in the baseline model and the other one is the “friend term”|F (u)|−0.5
∑j∈F (u) yj .
The cost function of the improved model is given by
min∑
(u,i)∈τ
[(ru,i − r̂u,i)2 + λ(‖pu‖2 + ‖qi‖2 + a2u + b2i +∑
j∈F (u)
‖yj‖2)]
• Initialization: µ is given by averaging ratings and we will not update it during itera-tions. au and bi are initialized by averaging ratings and residuals. We would like puand qi for all users u and items i to be such that qTi pu ∈ [0, 5]. So we initialize allelements of p and q to random values in [0,
√5/k], where k is the number of latent
factors. We initialize all elements of y to be 0.
• Update: In each update, we update new values of parameters using the old values.We use stochastic gradient descent to get the update equations as following.
6

εu,i ← ru,i − r̂u,iau ← au + η(εu,i − λau)
bi ← bi + η(εu,i − λbi)pu ← pu + η(εu,iqi − λpu)
qi ← qi + η[εu,i(pu + |F (u)|−0.5∑
j∈F (u)
yj)− λqi]
∀y ∈ F (u) : yj ← yj + η(εu,i|F (u)|−0.5qi − λyj)
(2)
• Parameters: We read each line of the rating file from disk and update the parametersfor each line. Each iteration of the algorithm will read the whole file. We set thenumber of iterations to be 100, and the step size η to be 0.1. Similar to before, wethen try out different values for the number of latent factors k and the regularizationparameter λ.
In addition, we also consider using degree centrality to weight the new user factor yj . Theweighted “friend term” is given by
(∑
j∈F (u)
Dj)−0.5
∑j∈F (u)
Djyj
Our experiments find that weighting by degree centrality leads to small difference in pre-diction accuracy compared with the improved model without weighting. Therefore we omitthe detailed description of the model with weighting by degree centrality here.
5.2 Results
(a) λ = 0 (b) λ = 0.2 (c) λ = 0.4
(d) λ = 0.6 (e) λ = 0.8 (f) λ = 1
Figure 4: Improved model training and test MSE for different k’s and λ’s
7

With this improved model, we observe that the friends’ influence term helps to improve theaccuracy of rating prediction significantly. Again, we randomly split 20% of the reviewsinto a test set and 80% into a training set, and we investigate the performance of k ∈[5, 10, 20, 50, 80, 100] and λ ∈ [0, 0.2, 0.4, 0.6, 0.8, 1] by comparing their MSE on the trainingand test sets. The results are shown in Figure 4. We can see when λ = 0, the trainingerrors are very small but the test errors are large, so there are overfitting problems. Withthe increase of λ, the gap between training errors and test errors becomes smaller. Thesmallest MSE of 1.4663 is given by k = 100 and λ = 0.2.
6 Conclusions
By comparing the results of the baseline model and the improved model, we observe thatthe friend term introduced in user factors improves the prediction accuracy significantly.The free user factor pu represents explicit ratings given by user u. The friend term repre-sents user’s implicit preference for restaurants. People will have similar tastes with theirfriends and friends can also recommend or comment on restaurants, which influences rat-ings given to restaurants by users. The two terms combined together therefore give us moreinformation of a user’s rating behavior. We also try to incorporate the centrality measuresin the friend term, but our results show that weighting friends’ ratings by degree centralitydoes not produce a noticable improvement on the prediction performance. This result isreasonable for the Yelp Dataset because most of the users do not have friends informationand only very few users have a lot friends. Therefore we conclude that friendship networkinformation allows us to predict user restaurant ratings more accurately, although furtherdifferentiating between friends through weighting by degree centrality does not offer muchimprovement in prediction accuracy.
References
[1] He, J., & Chu, W. W. (2010). A social network-based recommender system (SNRS)(pp. 47-74). Springer US.
[2] Koren, Y. (2008, August). Factorization meets the neighborhood: a multifaceted col-laborative filtering model. In Proceedings of the 14th ACM SIGKDD internationalconference on Knowledge discovery and data mining (pp. 426-434). ACM.
[3] Koren, Y., Bell, R., & Volinsky, C. (2009). Matrix factorization techniques for recom-mender systems. Computer, (8), 30-37.
[4] McAuley, J., & Leskovec, J. (2013, October). Hidden factors and hidden topics: under-standing rating dimensions with review text. In Proceedings of the 7th ACM conferenceon Recommender systems (pp. 165-172). ACM.
[5] Mooney, R. J., & Roy, L. (2000, June). Content-based book recommending using learn-ing for text categorization. In Proceedings of the fifth ACM conference on Digital li-braries (pp. 195-204). ACM.
8
[6] Pazzani, M., & Billsus, D. (1997). Learning and revising user profiles: The identificationof interesting web sites. Machine learning, 27(3), 313-331.
[7] Qian, Y., Zhiyong, P., Liang, H., Ming, Y., & Dawen, J. (2012, November). A latenttopic based collaborative filtering recommendation algorithm for web communities. InWeb Information Systems and Applications Conference (WISA), 2012 Ninth (pp. 241-246). IEEE.
[8] Sarwar, B., Karypis, G., Konstan, J., & Riedl, J. (2001, April). Item-based collabo-rative filtering recommendation algorithms. In Proceedings of the 10th internationalconference on World Wide Web (pp. 285-295). ACM.
[9] Yang, S. H., Long, B., Smola, A., Sadagopan, N., Zheng, Z., & Zha, H. (2011, March).Like like alike: joint friendship and interest propagation in social networks. In Proceed-ings of the 20th international conference on World wide web (pp. 537-546). ACM.
[10] Zheng, N., & Bao, H. (2013). Flickr group recommendation based on user-generatedtags and social relations via topic model. In Advances in Neural Networks–ISNN 2013(pp. 514-523). Springer Berlin Heidelberg.
9