To Catch a Fake: Curbing Deceptive Yelp Ratings and Venuescarbunar/deceptive.sam.pdf · Yelp events...
15
To Catch a Fake: Curbing Deceptive Yelp Ratings and Venues Mahmudur Rahman 1 , Bogdan Carbunar 1∗ , Jaime Ballesteros 2 , and Duen Horng (Polo) Chau 3† • AQ1 1 The School of Computing and Information Sciences, Florida International University, Miami, FL 33199,• USA AQ2 2 Here, Nokia Inc. Chicago, IL, USA 3 School of Computational Science & Engineering, Georgia Tech, Atlanta, GA, USA Received 13 May 2014; revised 13 November 2014; accepted 3 March 2015 DOI:10.1002/sam.11264 Published online in Wiley Online Library (wileyonlinelibrary.com). Abstract: The popularity and influence of reviews, make sites like Yelp ideal targets for malicious behaviors. We present Marco, a novel system that exploits the unique combination of social, spatial and temporal signals gleaned from Yelp, to detect venues whose ratings are impacted by fraudulent reviews. Marco increases the cost and complexity of attacks, by imposing a tradeoff on fraudsters, between their ability to impact venue ratings and their ability to remain undetected. We contribute a new dataset to the community, which consists of both ground truth and gold standard data. We show that Marco significantly outperforms state-of-the-art approaches, by achieving 94% accuracy in classifying reviews as fraudulent or genuine, and 95.8% accuracy in classifying venues as deceptive or legitimate. Marco successfully flagged 244 deceptive venues from our large dataset with 7,435 venues, 270,121 reviews and 195,417 users. Furthermore, we use Marco to evaluate the impact of Yelp events, organized for elite reviewers, on the hosting venues. We collect data from 149 Yelp elite events throughout the US. We show that two weeks after an event, twice as many hosting venues experience a significant rating boost rather than a negative impact. © 2015 Wiley Periodicals, Inc. Statistical Analysis and Data Mining 0: 000–000, 2015 Keywords: fake review detection; deceptive venue detection; machine learning 1. INTRODUCTION Online reviews are central to numerous aspects of people’s daily online and physical activities. Which Thai restaurant has good food? Which mover is reliable? Which mechanic is trustworthy? People rely on online reviews to make decisions on purchases, services and opinions, among others. People assume these reviews are written by real patrons of venues and services, who are sharing their honest opinions about what they have experienced. But, is that really the case? Unfortunately, no. Reviews are sometimes fake, written by fraudsters who collude to write glowing reviews for what might otherwise be mediocre services or venues [1–4]. In this paper we focus on Yelp [5], a popular social networking and location based service that exploits crowd- sourcing to collect a wealth of peer reviews concerning ∗ Correspondence to: Bogdan Carbunar (carbunar@cs.fiu.edu) † A preliminary version of this article has appeared in SIAM SDM 2014. This research was supported in part by DoD grant W911NF- 13-1-0142 and NSF grant EAGER-1450619. venues and services. Crowdsourcing has however exposed Yelp to significant malicious behaviors: Up to 25% of Yelp reviews may be fraudulent [6]. While malicious behaviors may occasionally be per- formed by inexperienced fraudsters, they may also be pro- fessionally organized. For example, search engine opti- mization (SEO) companies tap into review writer mar- kets [7–9] to offer review campaigns. Review campaigns act as “face lift” operations for business owners [10], manipulating venue ratings through multiple, coordinated artificial reviews. For business owners, profit seems to be the main incentive to drive them to engage in such activities. Studies have shown that an extra half-star rating on Yelp causes a restaurant to sell out 19% more often [11], and a one-star increase leads to a 5–9% increase in revenue [12]. Furthermore, we study the impact of Yelp “elite” events on the ratings of hosting venues. Elite events are organized by Yelp for the benefit of “Elite,” influential users, who write popular reviews. Yelp attempts to prevent review “unfairness” by encouraging attendees to review the event instead of the venue. However, the ample warning offered 1 2 3 4 5 6 7 8 9 10 11 12 13 14 15 16 17 18 19 20 21 22 23 24 25 26 27 28 29 30 31 32 33 34 35 36 37 38 39 40 41 42 43 44 45 46 47 48 49 50 51 52 53 1 2 3 4 5 6 7 8 9 10 11 12 13 14 15 16 17 18 19 20 21 22 23 24 25 26 27 28 29 30 31 32 33 34 35 36 37 38 39 40 41 42 43 44 45 46 47 48 49 50 51 52 53 © 2015 Wiley Periodicals, Inc.
Transcript of To Catch a Fake: Curbing Deceptive Yelp Ratings and Venuescarbunar/deceptive.sam.pdf · Yelp events...

To Catch a Fake: Curbing Deceptive Yelp Ratings and Venues
Mahmudur Rahman1, Bogdan Carbunar1∗, Jaime Ballesteros2, and Duen Horng (Polo) Chau3†•AQ1
1The School of Computing and Information Sciences, Florida International University, Miami, FL 33199,• USAAQ2
2Here, Nokia Inc. Chicago, IL, USA
3School of Computational Science & Engineering, Georgia Tech, Atlanta, GA, USA
Received 13 May 2014; revised 13 November 2014; accepted 3 March 2015DOI:10.1002/sam.11264
Published online in Wiley Online Library (wileyonlinelibrary.com).
Abstract: The popularity and influence of reviews, make sites like Yelp ideal targets for malicious behaviors. We presentMarco, a novel system that exploits the unique combination of social, spatial and temporal signals gleaned from Yelp, to detectvenues whose ratings are impacted by fraudulent reviews. Marco increases the cost and complexity of attacks, by imposinga tradeoff on fraudsters, between their ability to impact venue ratings and their ability to remain undetected. We contribute anew dataset to the community, which consists of both ground truth and gold standard data. We show that Marco significantlyoutperforms state-of-the-art approaches, by achieving 94% accuracy in classifying reviews as fraudulent or genuine, and 95.8%accuracy in classifying venues as deceptive or legitimate. Marco successfully flagged 244 deceptive venues from our largedataset with 7,435 venues, 270,121 reviews and 195,417 users. Furthermore, we use Marco to evaluate the impact of Yelpevents, organized for elite reviewers, on the hosting venues. We collect data from 149 Yelp elite events throughout the US. Weshow that two weeks after an event, twice as many hosting venues experience a significant rating boost rather than a negativeimpact. © 2015 Wiley Periodicals, Inc. Statistical Analysis and Data Mining 0: 000–000, 2015
Keywords: fake review detection; deceptive venue detection; machine learning
1. INTRODUCTION
Online reviews are central to numerous aspects ofpeople’s daily online and physical activities. Which Thairestaurant has good food? Which mover is reliable? Whichmechanic is trustworthy? People rely on online reviews tomake decisions on purchases, services and opinions, amongothers. People assume these reviews are written by realpatrons of venues and services, who are sharing their honestopinions about what they have experienced. But, is thatreally the case? Unfortunately, no. Reviews are sometimesfake, written by fraudsters who collude to write glowingreviews for what might otherwise be mediocre services orvenues [1–4].
In this paper we focus on Yelp [5], a popular socialnetworking and location based service that exploits crowd-sourcing to collect a wealth of peer reviews concerning
∗ Correspondence to: Bogdan Carbunar ([email protected])† A preliminary version of this article has appeared in SIAM
SDM 2014.This research was supported in part by DoD grant W911NF-
13-1-0142 and NSF grant EAGER-1450619.
venues and services. Crowdsourcing has however exposedYelp to significant malicious behaviors: Up to 25% of Yelpreviews may be fraudulent [6].
While malicious behaviors may occasionally be per-formed by inexperienced fraudsters, they may also be pro-fessionally organized. For example, search engine opti-mization (SEO) companies tap into review writer mar-kets [7–9] to offer review campaigns. Review campaignsact as “face lift” operations for business owners [10],manipulating venue ratings through multiple, coordinatedartificial reviews.
For business owners, profit seems to be the mainincentive to drive them to engage in such activities. Studieshave shown that an extra half-star rating on Yelp causes arestaurant to sell out 19% more often [11], and a one-starincrease leads to a 5–9% increase in revenue [12].
Furthermore, we study the impact of Yelp “elite” eventson the ratings of hosting venues. Elite events are organizedby Yelp for the benefit of “Elite,” influential users, whowrite popular reviews. Yelp attempts to prevent review“unfairness” by encouraging attendees to review the eventinstead of the venue. However, the ample warning offered
123456789
1011121314151617181920212223242526272829303132333435363738394041424344454647484950515253
123456789
1011121314151617181920212223242526272829303132333435363738394041424344454647484950515253
© 2015 Wiley Periodicals, Inc.

2 Statistical Analysis and Data Mining, Vol. 0 (2015)
Col
or
Fig. 1 System overview of Marco. Marco relies on social, temporal and spatial signals gleaned from Yelp, to extract novel features. Thefeatures are used by the venue classifier module to label venues (deceptive vs. legitimate) based on the collected data. Section 5 describesMarco in detail.
to hosts, coupled with the inability of users to accuratelyfollow directions, may be used by adversaries to transformYelp events into review campaign tools.
We propose Marco (MAlicious Review CampaignObserver), a novel system that leverages the wealth of spa-tial, temporal and social information provided by Yelp, todetect venues that are targets of deceptive behaviors. Marco(see Fig. 1) exploits fundamental fraudster limitations (seeSection 5.1) to identify venues with (i) abnormal reviewspikes, (ii) series of dissenting reviews, and (iii) impact-ful but suspicious reviews. Marco detects both venues thatreceive large numbers of fraudulent reviews, and venuesthat have insufficient genuine reviews to neutralize theeffects of even small scale campaigns. Our major contri-butions include:
• We introduce a lower bound on the number ofreviews required to launch a review campaign thatimpacts a target venue’s rating, and prove that thisbound renders such campaigns detectable. Ourtheoretical results force fraudsters to compromisebetween the impact and undetectability of theirreview campaigns (Section 5).
• We present Marco, a system that leverages novelsocial, spatial and temporal features gleaned fromYelp
• We contribute a novel dataset of reviews andvenues, which consists of both ground truth (i.e.,objectively correct) and gold standard instances(i.e., selected based on best available strate-gies); and a large collection of 7,435 venues,270,121 reviews and 195,417 reviewer profiles(Section 4).
• We demonstrate that Marco is effective andfast; its classification accuracy is up to 94%for reviews, and 95.8% for venues. It flags244 of the 7,435 venues analyzed as deceptive;manual inspection revealed that they were indeedsuspicious (Section 6).
• We collect data from 149 Yelp Elite eventsthroughout the US and use it to study the shortand long term impact of Yelp events on the ratingof the hosting venues (Section 6.4).
Marco aims to complement legal actions against profitable,fraudulent review activities [10]. Organizations caught red-handed in setting up review campaigns have been shownto pay $1–$10 per fraudulent review. By making the costof purchasing reviews approach the cost of products andservices provided by hiring venues, Marco has the potential
123456789
1011121314151617181920212223242526272829303132333435363738394041424344454647484950515253
123456789
1011121314151617181920212223242526272829303132333435363738394041424344454647484950515253
Statistical Analysis and Data Mining DOI:10.1002/sam

Rahman et al.: To Catch a Fake: Curbing Deceptive Yelp Ratings and Venues 3
to act as an economic counter-incentive for rational venueowners.
2. RELATED WORK
2.1. Research in Detecting Fraudulent Reviews
Jindal and Liu [2] introduce the problem of detectingopinion spam for Amazon reviews. They proposed solutionsfor detecting spam, duplicate or plagiarized reviews andoutlier reviews. Jindal et al. [3] identify unusual, suspiciousreview patterns. In order to detect “review spam”, Lim etal. [4] propose techniques that determine a user’s deviationfrom the behavior of other users reviewing similar products.Mukherjee et al. [13] focus on fake reviewer groups; similarorganized fraudulent activities were also found on onlineauction sites, such as eBay [14]. Mukherjee et al. [15]leverage the different behavioral distributions of reviewspammers to learn the population distributions of spammerand non-spammer clusters. Li et al. [16] exploit the reviewsof reviews concept of Epinions to collect a review spamcorpus, then propose a two view, semisupervised methodto classify reviews.
Ott et al. [17] integrate work from psychology andcomputational linguistics to develop and compare severaltext-based techniques for detecting deceptive TripAdvisorreviews. To address the lack of ground truth, theycrowdsourced the job of writing fraudulent reviews forexisting venues.
Unlike previous research, we focus on the problem ofdetecting impactful review campaigns. Our approach takesadvantage of the unique combination of social, spatial andtemporal dimensions of Yelp. Furthermore, we do not breakYelp’s terms of service to collect ground truth data. Instead,we take advantage of unique Yelp features (i.e., spelp sites,consumer alerts) to collect a combination of ground truthand gold standard review and venue datasets.
Feng et al. [18] seek to address the lack of ground truthdata for detecting deceptive Yelp venues: They introducethree venue features and use them to collect gold standardsets of deceptive and legitimate venues. They show thatan SVM classifier is able to classify these venues with anaccuracy of up to 75%. In Section 6 we confirm their resultson our datasets. We show that with an accuracy of 95.8%,Marco significantly outperforms the best strategy of Fenget al [18].
Li et al. [19] and Ntoulas et al. [20] rely on the reviewcontent to detect review spam. Li et al. [19] exploit machinelearning methods in their product review mining system.Ntoulas et al. [20] propose several heuristic methods fordetecting content based spam and combine the mosteffective ones to improve results. Our work differs throughits emphasis on relationship among reviewers, friends
and ratings in the context of Yelp’s spatial and temporaldimensions.
Gao et al. [21] target asynchronous wall messages todetect and characterize spam campaigns. They model eachwall post as a pair of text description and URL and applysemantic similarity metrics to identify large subgraphsrepresenting potential social spam campaigns and laterincorporate threshold based techniques for spam detection.Instead, we focus on temporal and geosocial review context,the where reviewer activity and behavioral pattern are ofsignificant importance.
Wang et al. [22] introduce the concept of heteroge-neous review graphs and iterative methods exploring rela-tionship among reviewers, reviews and stores to detectspammers. While we also consider social relations amongreviewers we differ on our focus on temporal and spatialdimensions.
2.2. Research in Sybil Detection
Sybil accounts can be used to launch review campaigns,by enabling a single adversary to write multiple reviewsfor the same venue, each from a different account. Yelpidentifies venues that receive multiple reviews from thesame IP address (but different user accounts). Tools such asproxies [23] and anonymizers (e.g., Tor [24]) can howeverbe used to avoid detection.
SybilInfer [25], detects Sybil nodes in social networksby using Bayesian inference and knowledge of the socialnetwork graph. Sybil tolerant solutions like DSybil exploitthe heavy-tail distribution of the typical behavior of honestusers and rely on user weights to identify whether thesystem needs more opinions or not. Similarly, SumUp [26]uses “adaptive vote flow aggregation” to limit the numberof fake feedback provided by an adversary to the numberof attack edges in the trust network—that is, the number ofbi-directional trust edges the attacker is able to establish toother users. Molavi et al. [27] propose to associate weightswith ratings and introduce the concept of “relative ratings”to defend against bought ratings and ratings from Sybilaccounts. When given access to the perspective of the socialnetwork provider, Wang et al. [28] proposed an approachthat detects Sybil accounts based on their click streambehaviors (traces of click-through events in a browsingsession).
Our work aims to complement Sybil detection tech-niques. Reviews written from accounts detected to be Sybilsmay be classified as fraudulent. The number (or percent-age) of reviews of a venue written from Sybil accountscan be used as a feature to detect “deceptive” venues.Conversely, user accounts with high numbers of postedfraudulent reviews may be used as candidates for furtherSybil detection screenings.
123456789
1011121314151617181920212223242526272829303132333435363738394041424344454647484950515253
123456789
1011121314151617181920212223242526272829303132333435363738394041424344454647484950515253
Statistical Analysis and Data Mining DOI:10.1002/sam

4 Statistical Analysis and Data Mining, Vol. 0 (2015)
Col
or Fig. 2 YCrawl system architecture. YCrawl relies on a pool of servers and proxies to issue requests. The scheduler relies on a requestqueue to ensure there are no loops in the crawling process.
3. SYSTEM MODEL
3.1. Yelp’s Review System
For this work, we focus on Yelp [5], a review centricgeosocial network that hosts information concerning usersand venues. Subscribed users (“yelpers”) have accountsand can write reviews, befriend other subscribers, reportlocations and search for venues of interest. We use the term“venue” to represent a business or event with an associatedlocation (e.g., restaurants, shops, offices, concerts).
Reviews have a star rating, an integer ranging from 1to 5, with 5 being the highest mark. In Yelp, an averagerating value is computed for each venue (rounded to thenearest half star), over the ratings of all the posted reviews.For a review R, let R.ρ denote its rating and R.τ to denotethe time when the review was posted. We say a review is“positive” if its rating is at least 4 stars and “negative” if itsrating is 2 stars or fewer. In our analysis we do not consider3 star reviews. Their impact on the rating of the venue islikely to be small: Yelp denotes a 3 star rating as “A-OK”.
3.2. Influential and Elite Yelpers
Users can rate the reviews of others, by clickingon associated buttons (e.g., “useful”, “funny” or “cool”buttons). They can upload photos taken at venues reviewedand perform “check-ins”, to formally record their real-timepresence at the venue. Yelp rewards “influential” reviewers(often peer-recommended) with a special, yearly “Elite”badge.
3.3. Fraudulent Reviews and Deceptive Venues
A review is fraudulent if it describes a fictitiousexperience. Otherwise, the review is genuine. We say avenue is deceptive if it has received a sufficient number offraudulent reviews to impact its average rating by at leasthalf a star. Otherwise, the venue is legitimate.
Yelp relies on proprietary algorithms to filter reviews itconsiders fraudulent. See ref. [29] for an attempt to reverseengineer Yelp’s filter. Furthermore, Yelp has launched a
“Consumer Alert” process, posting “alert badges” on thepages of venues for which (i) people were caught red-handed buying fraudulent reviews, offering rewards ordiscounts for reviews or (ii) that have a large number ofreviews submitted from the same IP address. The consumeralert badge is displayed for 90 days.
3.4. Yelp Events
Yelp organizes special Elite events, at select venues,where only Elite badge holders are invited. For each event,Yelp creates a separate Yelp page, containing the nameof the event and the name, address and information forthe hosting venue. Attendees are encouraged to review theevent account, which then lists the reviews, just like aregular venue.
4. COLLECTED YELP DATA
In this section we describe the Yelp datasets we collectedusing the YCrawl crawler that we developed. Our dataconsists of: (i) 90 deceptive and 100 legitimate venues; (ii)426 fraudulent and 410 genuine reviews; and (iii) a largecollection of 7,435 venues and their 270,121 reviews from195,417 reviewers, from San Francisco, New York City,and Miami.
4.1. YCrawl
We have developed YCrawl, a crawling engine forautomatically collecting data from Yelp user and venuepages. YCrawl consists of 1820 lines of Python code. Itfetches the raw HTML pages of target Yelp user and venueaccounts. Fig. 2 illustrates the system design of YCrawl.
Yelp keeps track of requests made from a single IP andsuppresses any IP making an exorbitant number of requestswithin a short time window 1. To overcome this limitation,
1 Such IP addresses are suppressed from Yelp’s servers and thisremains in place for a few weeks (or sometimes forever).
123456789
1011121314151617181920212223242526272829303132333435363738394041424344454647484950515253
123456789
1011121314151617181920212223242526272829303132333435363738394041424344454647484950515253
Statistical Analysis and Data Mining DOI:10.1002/sam

Rahman et al.: To Catch a Fake: Curbing Deceptive Yelp Ratings and Venues 5
YCrawl uses a pool of servers and IP proxies: For everyrequest, YCrawl randomly picks a server and proxy. If therequest is not successful, a new request is made using adifferent proxy. A centralized scheduler maintains a requestqueue to ensure there are no loops in the crawling process.
At the time when we performed this data collection,Yelp’s filtered reviews could only be accessed by solv-ing a CAPTCHA. In order to collect filtered reviewswe used DeathByCaptcha [30] to programatically collectCAPTCHA protected reviews filtered by Yelp.
We used YCrawl to collect a seed dataset of randomvenue and user accounts, using a breadth-first crawlingstrategy and stratified sampling [31]. First, we selected alist of 10 major cities (e.g., New York, San Francisco, LosAngeles, Chicago, Seattle, Miami) in the United States andwe collected an initial random list of 100 venues from eachof these cities as a seed dataset. We note that the stratavenues are mutually exclusive, i.e., venues do not belongto two or more different cities. We then randomly selected10,031 Yelp users who reviewed these venues, and collectedtheir entire Yelp data (the html pages), including all theirreviews, for a total of 646,017 reviews. This processenabled us to avoid bias toward high degree nodes (userswith many friends, venues with many reviews), which isa common problem when crawling social networks [32].We have then randomly selected a list of 16,199 venues,reviewed by the previously collected 10,031 Yelp users. Wehave collected the html pages of the selected the venues,including all their reviews.
4.2. The Data
We use the term “ground truth” set to denote dataobjectively known to be correct. We use the term “goldstandard” to denote data selected according to the bestavailable strategies. We collect such data following severalstringent requirements, often validated by multiple third-parties.Ground truth deceptive venues. We relied on Yelp’s“Consumer Alert” feature to identify deceptive venues. Wehave used Yelp and Google to identify a snapshot of all the90 venues that received consumer alerts during July andAugust, 2013.Gold standard legitimate venues. We have used the col-lected list of 16,199 venues previously described to firstselected a preliminary list of venues with well known con-sistent quality, e.g., the “Ritz-Carlton” hotel. We have thenmanually verified each review of each venue, includingtheir filtered reviews. We have selected only venues withat most one tenth of their reviews filtered by Yelp andwhose filtered reviews include a balanced amount of posi-tive and negative ratings. While Yelp tends to filter reviewsreceived from users with few friends and reviews, Feng
et al. [18] showed that this strategy is not accurate. In total,we selected 100 legitimate venues.
In addition to collecting the html pages of all the reviewsof the selected deceptive and legitimate venues, we havealso collected the html pages of all the users who wrotereviews for them, and the html pages of all the reviewswritten by these reviewers. This data enables us to extractthe features that we introduce in the following sections.
For the 90 deceptive venues we have collected their10,063 reviews written by 7,258 reviewers. We havecollected all the reviews (311,994 in total) written by the7,258 reviewers of the 90 deceptive venues. In addition,we have collected the 9,765 reviews, written by 7,161reviewers, of the 100 legitimate venues. We have thencollected all the reviews written by these 7,161 reviewers,for a total of 530,408 reviews. Thus, for these 190 venues,we have collected more than 840,000 reviews. Note howthe 90 deceptive venues have received more reviews thanthe 100 legitimate venues. However, the total numberof reviews written by reviewers of legitimate venuessignificantly exceeds those written by the reviewers ofdeceptive venues.Gold standard fraudulent reviews. We have used spelp(Spam + Yelp) sites (e.g., refs. [33,34]), forums wheremembers, often “Elite” yelpers with ground truth knowl-edge, reveal and initiate the discussion on fraudulent Yelpreviews. While in theory such sites are ideal targets forfraudulent behavior, the high investment imposed on fraud-sters, coupled with the low visibility of such sites, makethem unappealing options. Nevertheless, we have identifiedspelp reviews that (i) were discussed by and agreed upon bymultiple other Yelp users, (ii) were written from accountswith no user photo or with web plagiarized photos (iden-tified through Google’s image search), and (iii) that wereshort (less than 50 words). From this preliminary set, wehave manually selected 410 generic reviews, that provideno venue specific information [35].
Specifically, each “spelp” review we collected wasposted by a Yelp users, and discussed and agreed uponby multiple other Yelp users.Gold standard genuine reviews. Given the seed user andvenue datasets previously described, we have extracted alist of 410 genuine reviews satisfying a stringent test thatconsists of multiple checkpoints. In a first check we usedGoogle (text and image search) to eliminate reviews withplagiarized text and reviewer account photos. In a secondcheck we discarded short (less than 50 words), genericreviews, lacking references to the venue. Third, we gavepreference to reviews written by users who
• Reached the “Elite” member status at least once.
• Participated in forums e.g., Yelp Talk.
123456789
1011121314151617181920212223242526272829303132333435363738394041424344454647484950515253
123456789
1011121314151617181920212223242526272829303132333435363738394041424344454647484950515253
Statistical Analysis and Data Mining DOI:10.1002/sam

6 Statistical Analysis and Data Mining, Vol. 0 (2015)
• Garnered positive feedback on their reviews.
• Provided well thought out personal informationon their profile.
We have collected the 54,213 reviews written by the writersof the 410 genuine reviews. We have also collected the1,998 reviews written by the writers of the 426 fraudulentreviews.Large Yelp Data Set. We have used YCrawl to collect thedata of 7,435 car repair shops, beauty & spa centers andmoving companies from San Francisco, New York City andMiami. The collection process took 3 weeks. Of the 7,345venues, 1928 had no reviews posted. We have collectedall their 270,121 reviews and the data of their 195,417reviewers (one user can review more than 1 of thesevenues). Table 8 shows the number of venues collected foreach venue type and city. Yelp limits the results for a searchto the first 1000 matching venues. Entries with values lessthan 1000 correspond to cities with fewer than 1000 venuesof the corresponding type.Yelp event collection. We have collected Yelp events from60 major cities covering 44 states of United States. Theremaining states had no significant Yelp events or activities(WY, VT, SD, NE, WV, ND). After identifying an Eliteevent, we identified the hosting venue through either itsname or address. We used YCrawl to collect a majority ofthe available Yelp events and hosting venues, for a total of149 pairs.
For each Yelp event and corresponding venue, we havecollected their name, number of reviews, star rating andall their reviews. For each review, we have collected thedate when it was written, the rating given and the availableinformation about the reviewer, including the Elite status,number of friends and number of reviews written. In total,we have collected 24,054 event/hosting venue reviews.
While we are unable to make public these datasets, due topossible legal action from Yelp, we recommend researchersto contact us with questions concerning this data.
5. MARCO: PROPOSED METHODS
We present Marco, a system for automatic detection offraudulent reviews, deceptive venues and impactful reviewcampaigns. We begin with a description of the adversaryand his capabilities.
5.1. Adversarial Model
We model the attacker following the corrupt SEO (SearchEngine Optimization) model mentioned in the introduction.The attacker A receives a contract concerning a target venue
Table 1. Table of notations.
Notation Definition
A AdversaryV Target venueHV , �T V ’s timeline and active intervalρV (T ) Rating of V at time Tδr Desired rating increase by Aδt Review campaign durationq Number of fraudulent reviews by AR, R.ρ, R.τ Review, its rating and its posting timen Number of genuine reviews of Vσ Sum of ratings of all genuine reviewsp Number of genuine positive reviews
V . A receives a finite budget, and needs to “adjust” therating of V , i.e., either increase or decrease it by at leasthalf a star.
We assume A controls a set of unique (IP address, YelpSybil account) pairs and has access to a market of reviewwriters. Sybil accounts [36] are different Yelp identitiescontrolled by A. A uses these resources to launch a “reviewcampaign” to bias the rating of V : post one review fromeach controlled (IP address, Yelp Sybil account) pair and/orhire (remote) review writers, with valid Yelp accounts, todo it.
The number of reviews A can post is limited by thenumber of unique (IP address, Yelp Sybil account) pairs itcontrols as well as by the budget received in the contract(minus A’s fee) divided by the average cost of hiring areview writer.
5.2. Overview of Marco
Marco, whose functionality is illustrated in Fig. 1,consists of 3 primary modules. The Review Spike Detection(RSD) module relies on temporal, inter-review relationsto identify venues receiving suspiciously high numbersof positive (or negative) reviews. The Aggregate ReviewDisparity (ARD) module uses relations between reviewratings and the aggregate rating of their venue, at the timeof their posting, to identify venues that exhibit a “bipolar”review behavior. The Fraudulent Review Impact (FRI)module first classifies reviews as fraudulent or genuinebased on their social, spatial and temporal features. It thenidentifies venues whose aggregate rating is significantlyimpacted by reviews classified as fraudulent. Each moduleproduces several features that feed into a venue classifier,trained on the datasets of Section 4.2. Table 1 shows thenotations used by Marco.
The approach used in Marco leverages manually labeleddata, including fraudulent and genuine reviews, as well asdeceptive and legitimate venues, to classify reviews andvenues. Marco does not require knowledge of all the data
123456789
1011121314151617181920212223242526272829303132333435363738394041424344454647484950515253
123456789
1011121314151617181920212223242526272829303132333435363738394041424344454647484950515253
Statistical Analysis and Data Mining DOI:10.1002/sam

Rahman et al.: To Catch a Fake: Curbing Deceptive Yelp Ratings and Venues 7
and can classify new data in an online manner. A drawbackof this approach stems from the difficulty of acquiringground truth and gold standard data. While it is also difficultto identify relevant features that are hard to bypass byadversaries, we note that Marco introduces a trade-off forattackers, between impact and detectability.
An alternative approach is to use unsupervised outlierdetection solutions [37–41]. While such solutions do notrequire labeled data, they require knowledge of the entiredataset. This approach is thus suitable for the providers (i.e.,Yelp). We note however that an adversary with sufficientknowledge of the data can attempt to bypass this approach,by determining and introducing fraudulent data that wouldnot be classified as outlier.
5.3. Review Spike Detection (RSD) Module
A review campaign needs to adjust (e.g., increase) therating of its target venue, by posting (fraudulent) reviewsthat compensate the negative ratings of other reviews.The RSD module detects this behavior by identifyingvenues that receive higher numbers of positive (or negative)reviews than normal.
In the following, our first goal is to prove that reviewcampaigns that impact the ratings of their target venuesare detectable. For this, let q denote the total number offraudulent reviews that A posts for the target venue V . Wefocus on the typical scenario where an attacker attempts toincrease the rating of V (ballot stuffing). Attempts to reducethe rating of V (bad mouthing) are similar and omitted herefor brevity.A can follow any strategy, including (i) greedy, by
posting all q reviews in a short time interval and (ii)uniform, by spreading reviews over a longer time interval.While a greedy strategy is likely to quickly impact thevenue, a uniform strategy seems more likely to passunnoticed. However, we show in the following that, if thereview campaign is successful, it becomes detectable.
Let Ts and Te denote the start and end times of thecampaign, the times when the first and last fraudulentreviews initiated by A are posted. δt = Te − Ts is thecampaign duration interval. Let n denote the number ofgenuine reviews V has at the completion of the campaign(time Te). We assume V receives fraudulent reviews onlyfrom A. We prove the following lower bound on the numberof reviews that A needs to write in order to impact the ratingof V .
Claim 1 The minimum number of reviews A needs to postin order to (fraudulently) increase the rating of V by half astar is q = n/7.
Proof: Let R1, R2, ..., Rn denote the n genuine reviewsof V . Let σ = ∑n
i=1 Ri.ρ. According to Yelp semantics,
Col
or
0
5
10
15
Time
Po
siti
ve r
evie
ws South Bay BMW
02468
10
Time
Po
siti
ve r
evie
ws Smith Brothers Appliance Repair
0
2
4
6
2007 2008 2009 2010 2011 2012 2013
2010 2011 2011 2012 2012 2013 2013
2010 2011 2012 2013
Time
Po
siti
ve r
evie
ws Bert Levi Family Jewelers
Fig. 3 Timelines of positive reviews of three deceptive venues(see Section 4.2). Each venue has several significant spikes in itsnumber of daily positive reviews.
Ri.ρ ∈ [1, 5], thus σ ∈ [n, 5n]. The “genuine” rating of V
is ρg
V = σn
. In order to minimize q, A has to write only5 star reviews. Let δr be the increase in the rating of V
generated by A’s review campaign. Note that δr ∈ [0.5, 4).Furthermore, σ
n+ δr ≤ 5, as the final rating of V cannot
exceed 5. Hence,
σ + 5q
n + q= σ
n+ δr,
Thus, q = n2δr5n−σ−nδr
. Given that σ ≥ n, we have q ≥ nδr4−δr
.When δr = 1/2, this results in q ≥ n/7. For δr = 1, q ≥n/3, when δr = 2, q ≥ n, etc. �
We say a review campaign is successful if it increases therating of the target venue by at least half a star (δr ≥ 1/2).We introduce now the notion of venue timeline:
DEFINITION 1: The timeline of a venue V is the setof tuples HV = {(Ui, Ri)|i = 1...n}, the list of reviews Ri
received by V from users Ui , chronologically sorted bythe review post time, Ri.τ . Let �T = Tc − T1 denote theactive interval of the venue, where Tc denotes the currenttime and T1 = R1.τ .
Fig. 3 illustrates this concept, by showing the evolution ofthe positive review (four and five star) timelines of threevenues selected from the ground truth deceptive venuedataset (see Section 4.2). Let p denote the number ofpositive reviews received by V during its active interval,�T . We now show that:
123456789
1011121314151617181920212223242526272829303132333435363738394041424344454647484950515253
123456789
1011121314151617181920212223242526272829303132333435363738394041424344454647484950515253
Statistical Analysis and Data Mining DOI:10.1002/sam

8 Statistical Analysis and Data Mining, Vol. 0 (2015)
Claim 2 Assuming a uniform arrival process for genuinepositive reviews, the maximum number of genuine positivereviews in a δt interval is approximately p δt
�T(1 + 1√
c),
where c = p δt
�T log �Tδt
.
Proof: The distribution of reviews into δt intervals followsa balls and bins process, where p is the number of ballsand �T/δt is the number of bins. It is known (e.g., [42,43])that given b balls and B bins, the maximum number of ballsin any bin is approximately b
B(1 + 1√
c), where c = b
B logB.
Thus, the result follows. �
We introduce now the following result.
THEOREM 1: If n > 49, a successful review campaignwill exceed, during the attack interval, the maximumnumber of reviews of a uniform review distribution.
Proof: Let p denote the number of positive, genuinereviews received by the target venue at the end of the reviewcampaign. p < n, where n is the total number of genuinereviews at the end of the campaign. According to Claim 1,a successful review campaign needs to contain at least n/7positive (5 star) reviews. Then, since the expected numberof positive genuine reviews to be received in a δt intervalwill be pδt
�T, following the review campaign, the expected
number of (genuine plus fraudulent) positive reviews in theattack interval will be n
7 + pδt
�T.
The maximum number of positive genuine reviews postedduring an interval δt , assuming a uniform distribution, is,
according to Claim 2, approximately p δt
�T+
√pδt log �T
δt
�T.
Thus, the number of positive reviews generated by a reviewcampaign exceeds the maximum positive reviews of auniform distribution if
n
7+ pδt
�T>
pδt
�T+
√pδt log �T
δt
�T.
Since n > p, this converts to n49 >
log �Tδt
�Tδt
. Since �T > δt ,
we have thatlog �T
δt�Tδt
< 1. Thus, the above inequality trivially
holds for n > 49. �
Theorem 1 introduces a tradeoff for attackers. Specif-ically, an attacker can choose to either (i) post enoughreviews to impact the rating of a venue (launch a successfulcampaign) but then become detectable (exceed the maxi-mum number of reviews of a uniform distribution) or (ii)remain undetected, but then do not impact the rating of thevenue.Detect abnormal review activity. We exploit the aboveresults and use statistical tools to retrieve ranges ofabnormal review activities. In particular, our goal is to
identify spikes, or outliers in a venue’s timeline. Forinstance, each venue in Fig. 3 has several significant reviewspikes. The RSD module of Marco uses the measures ofdispersion of Box-and-Whisker plots [31] to detect outliers.Specifically, given a venue V , it first computes the quartilesand the inter-quartile range IQR of the positive reviewsfrom V ’s timeline HV . It then computes the upper outerfence (UOF ) value using the Box-and-Whiskers plot [31].For each sub-interval d of set length (in our experiments|d| = 1 day) in V ’s active period, let Pd denote the set ofpositive reviews from HV posted during d. If |Pd | > UOF ,the RSD module marks Pd , i.e., a spike has been detected.For instance, the “South Bay BMW” venue (see Fig. 3) hasa UOF of 9 for positive reviews: any day with more than9 positive reviews is considered to be a spike.
We note that a different empirical approach, proposed byFei et al. [44] is to use Kernel Density Estimation (KDE) toestimate the probability distribution function of the reviewsof a venue.
The RSD module outputs two features (see Table 3):SC(V ), the number of spikes detected for a venue V ,and SAmp(V ), the amplitude of the highest spike of V ,normalized to the average number of reviews posted for V
during an interval d.
5.4. Aggregate Rating Disparity
A venue that is the target of a review campaignis likely to receive reviews that do not agree withits genuine reviews. Furthermore, following a successfulreview campaign, the venue is likely to receive reviewsfrom genuine users that do not agree with the venue’s newlyengineered rating.
Let ρV (T ) denote the average rating of a venue V at timeT ∈ [T1, Tc]. We define the rating disparity of a review R
written at time R.τ for V to be the divergence of R’srating from the average rating of V at the time of itsposting, |R.ρ − ρV (R.τ)|. Let R1, ..., RN , N = n + q, beall the reviews received by V (both genuine and fraudulent)during its active interval �T . We define the aggregaterating disparity (ARD) score of V to be the average ratingdisparity of all the reviews of V :
ARD(V ) =∑N
i=1 |Ri.ρ − ρV (Ri.τ )|N
By influencing the average rating of a venue, a reviewcampaign will increase the rating disparity of both fraudu-lent and of genuine reviews. This is illustrated in Fig. 4, thatplots the evolution in time of the average rating against theratings of individual reviews received by the “Azure Nail& Waxing Studio” (Chicago, IL). The positive reviews (1day has a spike of 19, five-star reviews, shown in red in
123456789
1011121314151617181920212223242526272829303132333435363738394041424344454647484950515253
123456789
1011121314151617181920212223242526272829303132333435363738394041424344454647484950515253
Statistical Analysis and Data Mining DOI:10.1002/sam

Rahman et al.: To Catch a Fake: Curbing Deceptive Yelp Ratings and Venues 9
Col
or
0 5 10 15 20 25 30 35 40 45 50 55
1
2
3
4
5
2
2
2
2
2 2
3
2
2
2 2 2 2222
22 4 19
2
446
2
22
Days
Rat
ing
Venue avg ratingUser rating
Fig. 4 Evolution in time of the average rating of the venue“Azure Nail & Waxing Studio” of Chicago, IL, compared againstthe ratings assigned by its reviews. The values in parenthesesdenote the number of reviews that were assigned a correspondingrating (shown on the y-axis) during one day. The lack of consensusbetween the many low and high rated reviews raises a red flag.
the upper right corner) disagree with the low rated reviews,generating a high ARD value. The ARD module contributesone feature, the ARD score, see Table 3.
We note that Jindal and Liu [2], Lim et al. [4], Mukherjeeet al. [13] and Mukherjee et al. [15] proposed a featuresimilar to ARD. However, the ARD feature we introducediffers, in that the disparity is between the rating of a reviewand the rating of the venue at the time when the reviewwas written. Previous work considers a formula where thedisparity is computed at the present time.
5.5. FRI Module
Venues that receive few genuine reviews are particularlyvulnerable to review campaigns (see also Theorem 1).Furthermore, long term review campaigns that post highnumbers of fraudulent reviews can re-define the “normal”review posting behavior, flatten spikes and escape detectionby the RSD module. They are also likely to drown theimpact of genuine reviews on the aggregate rating of thevenue. Thus, the ARD of the campaign’s target venue willbe small, controlled by the fraudulent reviews.
We propose to detect such behaviors through fraudulentreviews that significantly impact the aggregate rating ofvenues. For this, in a first step, the FRI module usesmachine learning tools to classify the reviews posted for V
as either fraudulent or genuine. It uses features extractedfrom each review, its writer and the relation betweenthe review writer and the target venue (see Table 2).Specifically, let R denote a review posted for a venueV , and let U denote the user who wrote it. In additionto the friend and review count of U , we introduce theconcept of expertise of U around V . ExpU(V ) is the
Table 2. Features used to classify review R written by user Ufor venue V .
Notation Definition
f (U) The number of friends of Ur(U) The number of reviews written by UExpU(V ) The expertise of U around VcU (V ) The number of check-ins of U at VpU(V ) The number of photos of U at Vf eedback(R) The feedback count of RAgeU (R) Age of U ’s account when R was posted
number of reviews U wrote for venues in the vicinity(50 mile radius) of V . Furthermore, FRI uses the numberof activities of U recorded at V , the feedback of R,counting the users who reacted positively to the review,and the age of U ’s account when R was posted, AgeU(R).Section 6.1 shows that the Random Forest tool achieves94% accuracy when classifying fraudulent and genuinereviews.
In a second step, the FRI module introduces the notionof FRI, to model the impact of fraudulent reviews on thefinal rating of the venue. Let ρ
g
V = σn
denote the genuinerating of V , computed as an average over its n genuinereviews. Then, FRI (V ) = ρV (Tc) − ρ
g
V , where ρV (Tc) isthe average rating of V at current time Tc. Note thatFRI (V ) can be negative, for a bad-mouthing campaign.The FRI module contributes two features, FRI (V ), andthe percentage of reviews classified as fraudulent for V ,CF(V ) (see Table 3).
5.6. Venue Classification
In addition to the features provided by the RSD, ARDand FRI modules, we also use the rating of V , ρV , itsnumber of reviews N , its number of reviews with associateduser check-ins, cir(V ), and with uploaded photos, pr(V ),and the current age of V , Age(V ), measured in monthssince V ’s first review. Table 3 lists all the features weselected. Section 6.2 shows that the features enable theRandom Forest classifier to achieves 95.8% accuracy whenclassifying the venue sets of Section 4.2.
6. EMPIRICAL EVALUATION
In this section we show that Marco is scalable as wellas efficient in detecting fraudulent reviews and deceptivevenues. We have implemented Marco using (i) Python, toextract data from parsed pages and compute the proposedfeatures and (ii) the statistical tool R, to classify reviewsand venues. We used MySQL to store collected data andfeatures.
123456789
1011121314151617181920212223242526272829303132333435363738394041424344454647484950515253
123456789
1011121314151617181920212223242526272829303132333435363738394041424344454647484950515253
Statistical Analysis and Data Mining DOI:10.1002/sam

10 Statistical Analysis and Data Mining, Vol. 0 (2015)
6.1. Review Classification
We investigated the ability of the FRI module to classifyreviews, when using five machine learning tools: Bagging,k-Nearest Neighbor (kNN), Random Forest (RF), SupportVector Machines (SVM) and C4.5 Decision Trees (DT).We used tenfold cross-validation over the fraudulent and410 genuine reviews of Section 4.2. Fig. 5(a) shows thereceiver operating characteristic (ROC) curve for the topthree performers: RF, Bagging and DT.
The overall accuracy ( T PR+T NRT PR+T NR+FPR+FNR
) of RF,Bagging and DT is 93.8%, 93.6% and 93.2% respectively.TPR is the true positive rate, TNR is the true negativerate, FPR the false positive rate and FNR the false negativerate. The (FPR, FNR) pairs for RF, Bagging and DT are(7.0%, 5.3%),(6.3%, 6.6%) and (5.1%, 8.6%) respectively(shown in Table 4). In the remaining experiments, the FRImodule of Marco uses the RF classifier.
The top 2 most impactful features for RF are r(U) andExpU(V ). Fig. 5(b) compares the distribution of the r(U)
Table 3. Features used to classify a venue V as either deceptiveor legitimate.
Notation Definition
SC(V ) The number of review spikes for VSAmp(V ) The amplitude of the highest spikeARD(V ) Aggregate rating disparityFRI (V ) The FRI of VCF(V ) Count of reviews classified fraudulentρV The rating of VN The number of reviews of Vcir(V ) The number of reviews with check-inspr(V ) The number of reviews with photosAge(V ) The age of V
feature for the 426 fraudulent and the 410 genuine reviews.We emphasize their symmetry: few fraudulent reviewwriters posted a significant number of reviews, while fewgenuine review writers posted only a few reviews. Fig. 5(c)compares the distribution of the ExpU(V ) measure. Thedistributions are also almost symmetric: most writers of
Col
or
False positive rate
Tru
e p
ositiv
e r
ate
0.0 0.2 0.4 0.6 0.8 1.0
0.0
0.2
0.4
0.6
0.8
1.0
Decision treeRandom forestBagging
(a)
1 2 3 4 56−10
11−15
16−20
21−25
26−100
>100
020406080
100120140160180200220240260
Number of reviews
Num
ber
of re
vie
we
rs
fakegenuine
(b)
0 1 2 3 4 56−10
11−20
21−100>100
020406080
100120140160180200220240260280
Reviewer expertise
Num
ber
of re
vie
wers
fakegenuine
(c)
Fig. 5 (a) ROC plot of Random Forest (RF), Bagging and C4.5 Decision Tree (DT) for review classification (426 fraudulent, 410genuine). RF performs best, at 93.83% accuracy. (b) Distribution of reviewers’ review count: fraudulent versus genuine review sets. (c)Distribution of reviewers’ expertise levels: fraudulent versus genuine sets. Note their symmetry: unlike genuine reviewers, fraudulentreviewers tend to have written only few reviews and have low expertise for the venues that they reviewed.
123456789
1011121314151617181920212223242526272829303132333435363738394041424344454647484950515253
123456789
1011121314151617181920212223242526272829303132333435363738394041424344454647484950515253
Statistical Analysis and Data Mining DOI:10.1002/sam

Rahman et al.: To Catch a Fake: Curbing Deceptive Yelp Ratings and Venues 11
Table 4. Review classification: comparison of machine learningalgorithms. RF performs best, at 93.83% accuracy.
Classifier TPR (%) FPR (%) FNR (%) Acc (%)
Random Forest 94.71 7.0 5.29 93.83Bagging 93.45 6.28 6.55 93.59Decision tree 91.44 5.07 8.56 93.22SVM 89.92 9.66 6.04 92.11
Table 5. Significance test: pairwise comparison of machinelearning algorithms using McNemar’s test. With the exceptionof the (Bagging, RF) pair, for all other pairs McNemar’s testproduces a χ2 value with one degree of freedom, highly significantwith a confidence level of more than 95.0%.
Compared Classifiers χ2 value p-value
Bagging-DT 11.6452 0.0006437RF-DT 13.5 0.0002386Bagging-RF 0.0476 0.8273RF-SVM 4.8983 0.0268Bagging-SVM 5.2258 0.0222DT-SVM 5.1142 0.0237
genuine reviews have written at least 4 reviews for othervenues in the vicinity of the venue of their selected review.
Furthermore, we tested the null hypothesis that theclassifiers used in review classification are equivalent i.e.,the difference in performance metrics of different classifiersis not significant. As the classifiers are trained and testedon the same dataset, we used McNemar’s test whichtabulates the outcomes of every two classifiers used forreview classification. The results are shown in Table 5.With the exception of the test that compares Bagging andRF, all other tests produce a χ2 value with one degreeof freedom, highly significant with a confidence level ofmore than 95.0% (the p-value is <0.05). Thus, we reject
Table 6. Marco versus the three deceptive venue detectionstrategies of Feng et al. [18]. Marco shows over 23% accuracyimprovement over dist�.
Strategy FPR FNR Accuracy
Marco/RF 5/90 = 0.055 3/100 = 0.3 95.8%avg� 33/90 = 0.36 31/100 = 0.31 66.3%dist� 28/90 = 0.31 25/100 = 0.25 72.1%peak ↑ 41/90 = 0.45 37/100 = 0.37 58.9%
the null hypothesis, which means that the differences inperformance metrics of DT, RF, Bagging and SVM modelsare statistically significant.
6.2. Venue Classification
We have used tenfold cross-validation to evaluate theability of Marco to classify the 90 deceptive and 100legitimate venues of Section 4.2. Fig. 6(a) shows the ROCcurve for Marco when using the RF, Bagging and C4.5DT classifiers on the features listed in Table 3. The over-all accuracy for RF, Bagging and DT is 95.8%, 93.7%and 95.8% respectively, with the corresponding (FPR,FNR)pairs being (5.55%, 3%), (8.88%, 4%) and (5.55%, 3%)respectively.
Fig. 6(a) shows the distribution of SC(V ) for the 190venues. Only one legitimate venue has a review spike,while several deceptive venues have more than 10 spikes.Furthermore, 26 deceptive venues have an FRI score largerthan 1; only one legitimate venue has an FRI larger than 1.Comparison with state-of-the-art. We compared Marco withthe three deceptive venue detection strategies of Fenget al. [18], avg�, dist� and peak ↑. Table 6 showsthe FPR, FNR and overall accuracy of Marco, avg�,dist� and peak ↑. Marco achieves a significant accuracy
Col
or
False positive rate
Tru
e p
ositiv
e r
ate
0.0 0.2 0.4 0.6 0.8 1.0
0.0
0.2
0.4
0.6
0.8
1.0
Decision treeRandom forestBagging
(a)
0 1 2 3 4 5 67−
10
11−1
5>1
5
0
10
20
30
40
50
60
70
80
90
Number of review spikes
Nu
mb
er
of
venu
es
fakegenuine
(b)
Fig. 6 (a) ROC plot of RF, Bagging and C4.5 DT for the 90 deceptive/100 legitimate venue datasets. RF and DT are tied for bestaccuracy, of 95.8%. (b) Distribution of SC(V), for the 90 deceptive and 100 legitimate venues. 60 deceptive venues have at least onereview spike. One legitimate venue has one spike.
123456789
1011121314151617181920212223242526272829303132333435363738394041424344454647484950515253
123456789
1011121314151617181920212223242526272829303132333435363738394041424344454647484950515253
Statistical Analysis and Data Mining DOI:10.1002/sam

12 Statistical Analysis and Data Mining, Vol. 0 (2015)
Table 7. Marco performance on new, unpopular venues: com-parison of machine learning algorithms. RF and DT perform thebest.
Classifier TPR (%) FPR (%) FNR (%) Acc (%)
Random Forest 96.07 20.0 3.92 94.64Bagging 94.12 20.0 5.88 92.15Decision tree 94.12 0.0 5.88 94.64
(a) (b)
Fig. 7 (a) Marco’s per-module overhead: FRI is the mostexpensive, but under 2.3 s even for venues with 500 reviews.(b) Zoom-in of FRI module overhead. Computing the ExpU(V )feature takes the most time.
improvement (95.8%) over dist�, the best strategy of Fenget al. [18] (72.1%).Marco performance for new venues. We have also evaluatedthe performance of Marco to classify relatively new venueswith few genuine reviews. Specifically, from our set of 90deceptive and 100 genuine reviews, we selected 51 decep-tive and 5 genuine venues that had less than 10 genuinereviews when we collected them. The overall accuracy ofRF, Bagging and DT on these 56 venues is 94.64%, 92.15%and 94.64% respectively. The (FPR, FNR) pairs for RF,Bagging and DT are (20.0%, 3.92%), (20.0%, 5.88%) and(0.0%, 5.88%), respectively (Table 7).
6.3. Marco in the Wild
Marco takes only a few seconds to classify a venue,on a [email protected], 4 GB of RAM Dell laptop. Fig. 7(a)shows the per-module overhead of Marco (averages over10 experiment runs), as a function of the review count ofthe venue classified. While the FRI module is the mosttime consuming, even for venues with 500 reviews theFRI overhead is below 2.3 s. The RSD and ARD modulesimpose only a few ms (6 ms for 500 reviews), while DBaccess and data retrieval take around 90 ms. Fig. 7(b)zooms-in into the FRI overhead. For 500 reviews, themost time consuming components are computing the userexpertise, ExpU(V ) (≈ 1.1 s), computing all the otherfeatures (≈ 0.4 s) and classifying the reviews (≈ 0.8 s).
In order to understand the ability of Marco to performwell when trained on small sets, we have trained it on 50deceptive and 50 legitimate venues and we have tested it
Table 8. Collected venues organized by city and venue type.Values between parentheses show the number of venues detectedby Marco to be deceptive. San Francisco has the highestpercentage of deceptive venues.
City Car Shop Mover Spa
Miami, FL 1000 (6) 348 (8) 1000 (21)San Fran., CA 612 (59) 475 (45) 1000 (42)NYC, NY 1000 (8) 1000 (27) 1000 (28)
on the remaining 40 deceptive and 50 legitimate venues.On average over 10 random experiments, Marco achievedan FPR of 6.25% and an FNR of 3%.
We have used Marco to classify the 7,435 venues wecollected from Miami, San Francisco and New York City.We have divided the set of 7,435 venues into subsets of200 venues. We trained Marco on the 190 ground truth/goldstandard venues and tested it separately on all subsets of 200venues. Table 8 shows the total number of venues collectedand the number of venues detected to be deceptive, betweenparentheses. San Francisco has the highest concentrationof deceptive venues: Marco flags almost 10% of its carrepair and moving companies as suspicious, and uponour manual inspection, they indeed seemed to engagein suspicious review behaviors. While the FRI of SanFrancisco’s collected genuine venues is at most 1, 60%of its deceptive venues have an FRI between 1 and 4.
6.4. Detecting Yelp Campaigns
We conjecture that Yelp events can be used as reviewcampaigns. Our hypothesis is based on several observations.First, the process of choosing the venues hosting Yelpevents is not public. Second, a venue hosting an eventis given ample warning to organize the event. Third,only Elite yelpers attend this event. While the attendeesare encouraged to review the event’s Yelp account, wehave identified Yelp events that impacted the ratings ofthe corresponding host venues. We call such events, Yelpcampaigns. Fig. 8(a) shows an example of venue and eventtimelines, correlated in time, for the venue “Pink Taco 2”(Los Angeles). Note how the venue’s latest two spikescoincide with the spikes of the event.
To detect correlations between Yelp events and increasedreview activity concerning the venues hosting the events,we use Marco’s RSD module as follows. Specifically, givena Yelp event and a time interval �T (system parameter),we determine of the hosting venue experiences a positivereview spike within an interval �T of the event’s date.
For the events and hosting venues collected (seeSection 4.2), Fig. 8(b) plots the number of positive reviewspikes detected within �T days, when �T ranges from1 to 5 weeks. For instance, when �T is 14 days, Marco
123456789
1011121314151617181920212223242526272829303132333435363738394041424344454647484950515253
123456789
1011121314151617181920212223242526272829303132333435363738394041424344454647484950515253
Statistical Analysis and Data Mining DOI:10.1002/sam
Rahman et al.: To Catch a Fake: Curbing Deceptive Yelp Ratings and Venues 13
Col
or
(a)(b)
Fig. 8 (a) The timeline of “Pink Taco 2” (Los Angeles) and of the Yelp event for this venue. Note the correlation between the two. (b)Yelp events: Positive review spike count as a function of �T .
(a) (b)
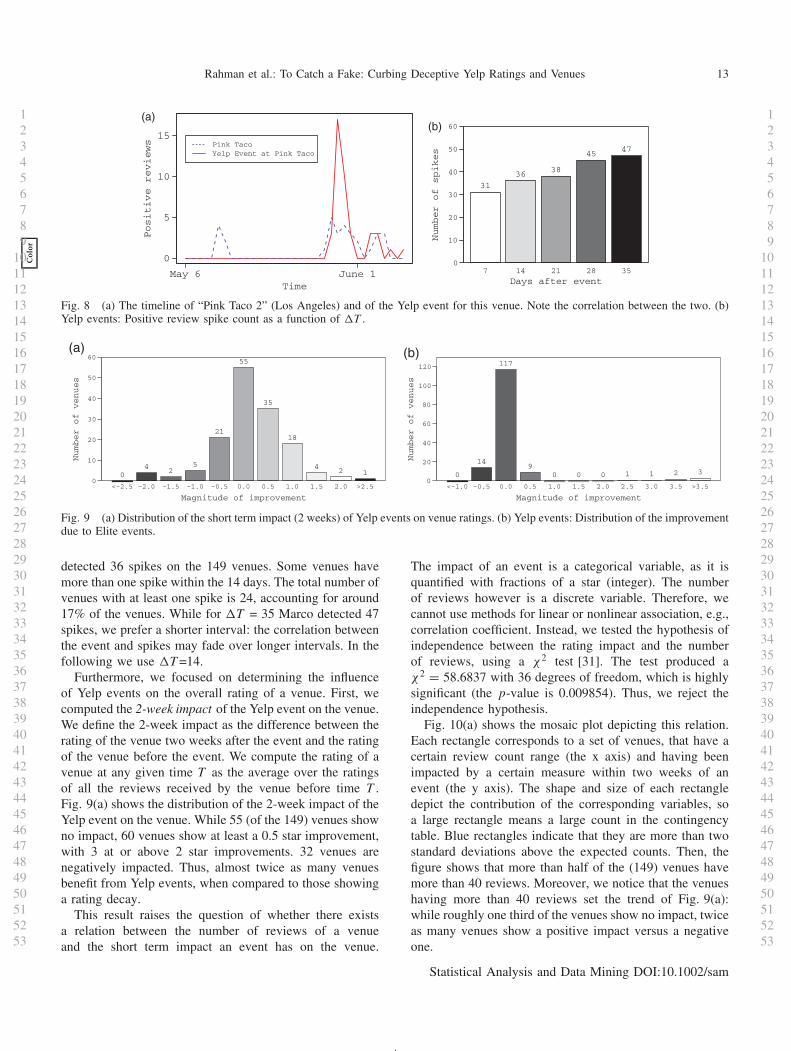
Fig. 9 (a) Distribution of the short term impact (2 weeks) of Yelp events on venue ratings. (b) Yelp events: Distribution of the improvementdue to Elite events.
detected 36 spikes on the 149 venues. Some venues havemore than one spike within the 14 days. The total number ofvenues with at least one spike is 24, accounting for around17% of the venues. While for �T = 35 Marco detected 47spikes, we prefer a shorter interval: the correlation betweenthe event and spikes may fade over longer intervals. In thefollowing we use �T =14.
Furthermore, we focused on determining the influenceof Yelp events on the overall rating of a venue. First, wecomputed the 2-week impact of the Yelp event on the venue.We define the 2-week impact as the difference between therating of the venue two weeks after the event and the ratingof the venue before the event. We compute the rating of avenue at any given time T as the average over the ratingsof all the reviews received by the venue before time T .Fig. 9(a) shows the distribution of the 2-week impact of theYelp event on the venue. While 55 (of the 149) venues showno impact, 60 venues show at least a 0.5 star improvement,with 3 at or above 2 star improvements. 32 venues arenegatively impacted. Thus, almost twice as many venuesbenefit from Yelp events, when compared to those showinga rating decay.
This result raises the question of whether there existsa relation between the number of reviews of a venueand the short term impact an event has on the venue.
The impact of an event is a categorical variable, as it isquantified with fractions of a star (integer). The numberof reviews however is a discrete variable. Therefore, wecannot use methods for linear or nonlinear association, e.g.,correlation coefficient. Instead, we tested the hypothesis ofindependence between the rating impact and the numberof reviews, using a χ2 test [31]. The test produced aχ2 = 58.6837 with 36 degrees of freedom, which is highlysignificant (the p-value is 0.009854). Thus, we reject theindependence hypothesis.
Fig. 10(a) shows the mosaic plot depicting this relation.Each rectangle corresponds to a set of venues, that have acertain review count range (the x axis) and having beenimpacted by a certain measure within two weeks of anevent (the y axis). The shape and size of each rectangledepict the contribution of the corresponding variables, soa large rectangle means a large count in the contingencytable. Blue rectangles indicate that they are more than twostandard deviations above the expected counts. Then, thefigure shows that more than half of the (149) venues havemore than 40 reviews. Moreover, we notice that the venueshaving more than 40 reviews set the trend of Fig. 9(a):while roughly one third of the venues show no impact, twiceas many venues show a positive impact versus a negativeone.
123456789
1011121314151617181920212223242526272829303132333435363738394041424344454647484950515253
123456789
1011121314151617181920212223242526272829303132333435363738394041424344454647484950515253
Statistical Analysis and Data Mining DOI:10.1002/sam

14 Statistical Analysis and Data Mining, Vol. 0 (2015)
Col
or
Sta
ndard
ized
Resid
uals
:
<−4
−4:−2
−2:0
0:2
2:4
>4
<−4
−4:−2
−2:0
0:2
2:4
>4
Number of reviews
Magnitude o
f Im
pro
vem
ent
04>04−0202−0101−44−0
>2.5
2.0
1.5
1.0
0.5
0.0
−0.5−1.0−1.5
−2.0
(a)
Sta
nd
ard
ize
d
Re
sid
ua
ls:
Number of reviews
Ma
gn
itu
de
of
Imp
rove
me
nt
04>04−0202−0101−44−0
>2.0
0.5
0.0
−0.5
(b)
Fig. 10 Mosaic plots: The standardized residuals indicate the importance of the rectangle in the χ2 test. (a) The dependency betweenthe short term rating change of venues due to events and their number of reviews. (b) The dependency between the long term ratingchange of venues due to events and their number of reviews.
Second, we study the long term impact of Yelp events.For this, we compare the current ratings of the 149 venueswith their ratings before the events. Fig. 9(b) shows thedistribution (over the 149 venues) of the difference betweenthe current rating of the venues and their rating before theevents. 78% of venues show no improvement. Furthermore,we see a balance between the number of venues showing animprovement versus a negative impact (16 positive vs. 14negative). However, we emphasize that the negative impactis only half a star, while the positive impact reaches up to3.5 stars.
We conducted a χ2 test to verify the dependence of thelong term impact of events on venues on the number ofratings of the venues. The test was highly significant withχ2 = 29.2038, 12 degrees of freedom and a p-value of0.003674. Fig. 10(b) shows the mosaic plot: a vast majorityof the venues having more than 40 reviews have no impacton the long term. This shows that review spikes have asmaller impact on constantly popular venues.
7. CONCLUSIONS
We presented Marco, a system for detecting deceptiveYelp venues and reviews, leveraging a suite of social, tem-poral and spatial signals gleaned from Yelp reviews andvenues. We also contribute a large dataset of over 7Kvenues, 270K reviews from 195K users, containing also
a few hundred ground-truth and gold-standard reviews(fraudulent/genuine) and venues (deceptive/legitimate).Marco is effective in classifying both reviews and venues,with accuracies exceeding 94%, significantly outperform-ing state-of-the-art strategies. Using Marco, we show thattwo weeks after an event, twice as many venues that hostYelp events experience a significant rating boost, whencompared to the venues that experience a negative impact.Marco is also fast; it classifies a venue with 500 reviews inunder 2.3 s.
REFERENCES
[1] D. Segal, A Rave, a Pan, or Just a Fake? The NewYork Times www.nytimes.com/2011/05/22/your-money/22haggler.html, 2011.
[2] N. Jindal and B. Liu, Opinion spam and analysis, InProceedings of the International Conference on Web Searchand Web Data Mining, WSDM ’08, New York, ACM,219–230, 2008.
[3] N. Jindal, B. Liu, and E-P. Lim, Finding unusual reviewpatterns using unexpected rules, In Proceedings of the19th ACM International Conference on Information andKnowledge Management, CIKM ’10, 1549-1552, 2010.
[4] E-P. Lim, V-A. Nguyen, N. Jindal, B. Liu, and H. W.Lauw, Detecting product review spammers using ratingbehaviors, In Proceedings of the International Conferenceon Information and Knowledge Management (CIKM),939–948, 2010.
123456789
1011121314151617181920212223242526272829303132333435363738394041424344454647484950515253
123456789
1011121314151617181920212223242526272829303132333435363738394041424344454647484950515253
Statistical Analysis and Data Mining DOI:10.1002/sam

Rahman et al.: To Catch a Fake: Curbing Deceptive Yelp Ratings and Venues 15
[5] Yelp, http://www.yelp.com.[6] Yelp admits a quarter of submitted reviews could be fake,
BBC, www.bbc.co.uk/news/technology-24299742.[7] Sponsored Reviews, www.sponsoredreviews.com/, 2013.[8] Posting Positive Reviews, www.postingpositivereviews.
blogspot.com/, 2013.[9] Pay Per Post, https://payperpost.com/, 2013.
[10] A. G. Schneiderman announces agreement with 19 com-panies to stop writing fake online reviews and pay morethan $350,000 in fines, www.ag.ny.gov/press-release/ag-schneiderman-announces-agreement-19-companies-stop-writing-fake-online-reviews-and.
[11] M. Anderson and J. Magruder, Learning from the crowd:Regression discontinuity estimates of the effects of anonline review database. Econ J, 122 (2012), 957–989.
[12] M. Luca, Reviews, reputation, and revenue: the case ofYelp.com, www.hbswk.hbs.edu/item/6833.html.
[13] A. Mukherjee, B. Liu, and N. Glance, Spotting fakereviewer groups in consumer reviews, In Proceedings ofthe International Conference on World Wide Web, 2012.
[14] S. Pandit, D. H. Chau, S. Wang, and C. Faloutsos,Netprobe: a fast and scalable system for fraud detection inonline auction networks, In Proceedings of the InternationalConference on World Wide Web, ACM, New York,201–210, 2007.
[15] A. Mukherjee, A. Kumar, B. Liu, J. Wang, M. Hsu, M.Castellanos, and R. Ghosh, Spotting opinion spammersusing behavioral footprints, In Proceedings of the 19thACM SIGKDD International Conference on KnowledgeDiscovery and Data Mining, KDD ’13, 632–640, 2013.
[16] F. Li, M. Huang, Y. Yang, X. Zhu, and X. Zhu, Learning toidentify review spam, In IJCAI, pages 2488–2493, 2011.
[17] Myle Ott, Yejin Choi, Claire Cardie, and Jeffrey T.Hancock. Finding deceptive opinion spam by any stretchof the imagination, In Proceedings of the 49th HumanLanguage Technologies (HLT), 2011.
[18] S. Feng, L. Xing, A. Gogar, and Y. Choi, Distributionalfootprints of deceptive product reviews, In Proceedings ofthe 6th International Conference on Weblogs and SocialMedia (ICWSM), 2012.
[19] F. Li, M. Huang, Y. Yang, and X. Zhu, Learning to identifyreview spam, In Proceedings of the 22nd InternationalJoint Conference on Artificial Intelligence, IJCAI ’11,2488–2493, 2011.
[20] A. Ntoulas, M. Najork, M. Manasse, and D. Fetterly,Detecting spam web pages through content analysis, InProceedings of the 15th international conference on WorldWide Web, WWW ’06, 83–92, 2006.
[21] H. Gao, J. Hu, C. Wilson, Z. Li, Y. Chen, and B. Y..Zhao, Detecting and characterizing social spam campaigns,In Proceedings of the 10th Annual Conference on InternetMeasurement, IMC ’10, 35–47, 2010.
[22] G. Wang, S. Xie, B. Liu, and P. S. Yu, Review graphbased online store review spammer detection, In ICDM’11, 1242–1247, 2011.
[23] Hide My Ass! Free Proxy and Privacy Tools, http://www.hidemyass.com/.
[24] R. Dingledine, N. Mathewson, and P. F. Syverson, Tor:The second–generation onion router, In USENIX SecuritySymposium, 303–320, 2004.
[25] G. Danezis and P. Mittal, Sybilinfer: Detecting sybil nodesusing social networks, In Proceedings of the Network andDistributed System Security Symposium (NDSS), 2009.
[26] N. Tran, B. Min, J. Li, and L. Subramanian, Sybil-resilientonline content voting, In NSDI’09: Proceedings of the6th USENIX Symposium on Networked Systems Designand Implementation, Berkeley, CA, USENIX Association,2009, 15–28.
[27] A. Molavi Kakhki, C. Kliman-Silver, and A. Mislove,Iolaus: Securing online content rating systems, In Proceed-ings of the Twenty-Second International World Wide WebConference (WWW’13), Rio de Janeiro, Brazil, May 2013.
[28] G. Wang, T. Konolige, C. Wilson, X. Wang, H. Zheng, andB. Y. Zhao, You are how you click: Clickstream analysisfor sybil detection, In Proceedings of USENIX Security,2013.
[29] A. Mukherjee, V. Venkataraman, B. Liu, and N. Glance,What yelp fake review filter might be doing, In Proceedingsof the International Conference on Weblogs and SocialMedia, 2013.
[30] Death By Captcha. www.deathbycaptcha.com/.[31] A. C. Tamhane and D. D Dunlop. Statistics and Data
Analysis: From Elementary to Intermediate. Upper SaddleRiver, NJ, Prentice Hall, 2000.
[32] M. Gjoka, M. Kurant, C. T. Butts, and A. Markopoulou,Walking in Facebook: a case study of unbiased sampling ofOSNs, In Proceedings of IEEE INFOCOM ’10, San Diego,CA, 2010.
[33] Spelp. www.yelp.com/topic/boston-spelp-9.[34] Flelp. www.yelp.com/topic/miami-flelp-we-rock.[35] 3 tips for spotting fake product reviews - from someone
who wrote them. MoneyTaksNews, www.moneytalksnews.com/2011/07/25/3-tips-for-spotting-fake-product-reviews–from-someone-who-wrote-them.
[36] J. R. Douceur, The Sybil attack, In Revised Papers fromthe First International Workshop on Peer-to-Peer Systems,2002.
[37] V. J. Hodge and J. Austin, A survey of outlier detectionmethodologies, Artif Intell Rev 22 (2004), 85–126.
[38] A. Zimek, E. Schubert, and H.-P. Kriegel, A surveyon unsupervised outlier detection in high-dimensionalnumerical data, Stat Anal Data Min 5 (2012), 363–387.
[39] K. Yamanishi, J-I. Takeuchi, G. Williams, and P. Milne,On-line unsupervised outlier detection using finite mixtureswith discounting learning algorithms, In Proceedings ofthe Sixth ACM SIGKDD International Conference onKnowledge Discovery and Data Mining, KDD ’00, ACM,New York, 2000, 320–324.
[40] K. Zhang, S. Shi, H. Gao, and J. Li. Unsupervisedoutlier detection in sensor networks using aggregation tree,In Advanced Data Mining and Applications, New York,Springer, 2007, 158–169.
[41] Z. Ferdousi and A. Maeda, Unsupervised outlier detectionin time series data, In Proceedings of 22nd InternationalConference on Data Engineering Workshops, x121–x121,IEEE, 2006.
[42] P. Berenbrink, A. Brinkmann, T. Friedetzky, and L. Nagel,Balls into bins with related random choices, In Proceedingsof the Symposium on Parallelism in Algorithms andArchitectures (SPAA), 2010.
[43] M. Raab and A. Steger. Balls into bins: a simpleand tight analysis, In Proceedings of Randomizationand Approximation Techniques in Computer Science(RANDOM), 159–170, 1998.
[44] G. Fei, A. Mukherjee, B. Liu, M. Hsu, M. Castellanos,and R. Ghosh, Exploiting burstiness in reviews for reviewspammer detection, In ICWSM, 2013.
123456789
1011121314151617181920212223242526272829303132333435363738394041424344454647484950515253
123456789
1011121314151617181920212223242526272829303132333435363738394041424344454647484950515253
Statistical Analysis and Data Mining DOI:10.1002/sam