Predicting walkability
114
Predicting walkability August 2011 S Abley – Abley Transportation Consultants Ltd Dr S Turner – Beca Infrastructure Ltd NZ Transport Agency research report 452
-
Upload
clean-air-initiative-for-asian-cities -
Category
Documents
-
view
213 -
download
0
description
This research, which was carried out from mid-2009 to early 2011, included undertaking a number of surveys of the physical and operational characteristics of the street environments in Christchurch, Gisborne, Auckland and Wellington (New Zealand), and correlating those measurements with how people felt about those environments in terms of safety, pleasantness and other variables. A number of predictive mathematical formulas were derived that enabled the perception of the qualitative quality of the street environment to be calculated using quantitative measurements.
Transcript of Predicting walkability
Predicting walkability
August 2011
S Abley – Abley Transportation Consultants Ltd
Dr S Turner – Beca Infrastructure Ltd
NZ Transport Agency research report 452
ISBN 978-0-478-38029-3 (print)
ISBN 978-0-478-38028-6 (electronic)
ISSN 1173-3756 (print)
ISSN 1173-3764 (electronic)
NZ Transport Agency
Private Bag 6995, Wellington 6141, New Zealand
Telephone 64 4 894 5400; facsimile 64 4 894 6100
www.nzta.govt.nz
Abley, S and S Turner (2011) Predicting walkability. NZ Transport Agency research report 452. 114pp.
This publication is copyright © NZ Transport Agency 2011. Material in it may be reproduced for personal
or in-house use without formal permission or charge, provided suitable acknowledgement is made to this
publication and the NZ Transport Agency as the source. Requests and enquiries about the reproduction of
material in this publication for any other purpose should be made to the Research Programme Manager,
Programmes, Funding and Assessment, National Office, NZ Transport Agency, Private Bag 6995,
Wellington 6141.
Keywords: accessibility, community street review, correlation, crossings, level of service, mathematical
formula, path length, pedestrian, pleasantness, predicting, quality, road crossing, safety, walkability,
walkable

An important note for the reader
The NZ Transport Agency is a Crown entity established under the Land Transport Management Act 2003.
The objective of the Agency is to undertake its functions in a way that contributes to an affordable,
integrated, safe, responsive and sustainable land transport system. Each year, the NZ Transport Agency
funds innovative and relevant research that contributes to this objective.
The views expressed in research reports are the outcomes of the independent research, and should not be
regarded as being the opinion or responsibility of the NZ Transport Agency. The material contained in the
reports should not be construed in any way as policy adopted by the NZ Transport Agency or indeed any
agency of the NZ Government. The reports may, however, be used by NZ Government agencies as a
reference in the development of policy.
While research reports are believed to be correct at the time of their preparation, the NZ Transport Agency
and agents involved in their preparation and publication do not accept any liability for use of the research.
People using the research, whether directly or indirectly, should apply and rely on their own skill and
judgement. They should not rely on the contents of the research reports in isolation from other sources of
advice and information. If necessary, they should seek appropriate legal or other expert advice.
Acknowledgements
The researchers acknowledge the assistance provided for this research project and sincerely thank:
• the peer reviewers, for their critical and proactive comments as the draft reports were reviewed and
amended – Dr Fergus Tate (MWH Limited) and Tim Hughes (NZ Transport Agency)
• the steering group members, for their critical and proactive comments as the research progressed –
Jacqueline Blake (NZ Transport Agency), Simon Ginn (Christchurch City Council), Dr Glen Koorey,
(University of Canterbury), Denis Mander (Queenstown Lakes District Council), and Chris Smith
(Auckland City Council, now Auckland Council)
• the initial supporters of this research – Wayne Thompson (Tauranga City Council), Steve Spence
(Wellington City Council), Tracy Wheeler (Northshore City Council, now Auckland Council), Sarah Weller
(Dunedin City Council), Eddie Cook (Invercargill City Council), Andrew Dixon (Timaru District Council),
Kit Mclean (Manukau City Council, now Auckland Council) and Lynley Beckingsale (Waimakariri District
Council)
• Paul Barker (Wellington City Council) and Simon Markham (Waimakariri District Council), who allowed
the collection of physical and operational data when existing community street reviews were being
undertaken
• the participants involved in the community street reviews.
The researchers would like to make special mention of the wider research team, and specifically Rohit
Singh (Beca Infrastructure), Professor Graham Wood (Macquarie University) and Peter Rose (Abley
Transportation Consultants), all of whom made a significant contribution to the outcomes of this research.
The authors wish to dedicate this research to Wayne Osmers, an employee of the NZ Transport Agency and
a colleague of the authors, who passed away while this research was being undertaken. Wayne will be
sorely missed for his insights and his passion in the area of traffic engineering.
Abbreviations and acronyms
• CSR community street review
• LOS level of service
• NZTA NZ Transport Agency
• TRL Transport Research Laboratory
5
Contents
Executive summary ........................................................................................................................................................................ 7
Abstract ................................................................................................................................................................................................. 8
1 Introduction .......................................................................................................................................................................... 9
1.1 Motivation ............................................................................................................................. 9
1.2 Background ........................................................................................................................... 9
1.3 Research objective ............................................................................................................... 9
1.4 Report structure ................................................................................................................... 9
2 Background ........................................................................................................................................................................ 11
2.1 Introduction ........................................................................................................................11
2.1.1 Walkability – a definition ......................................................................................11
2.2 Problem identification ........................................................................................................12
2.3 Assessment techniques .....................................................................................................12
2.4 Level of service (LOS) .........................................................................................................13
2.4.1 Community street reviews (CSR) ..........................................................................13
3 Literature review ............................................................................................................................................................ 15
3.1 Introduction ........................................................................................................................15
3.2 Pedestrian LOS modelling ..................................................................................................15
3.2.1 Pedestrian LOS prediction models for the roadside environment between intersections .......................................................................................................................15
3.2.2 Pedestrian LOS prediction model for urban signalised intersections ................20
3.2.3 Pedestrian LOS prediction model for urban intersections ..................................22
3.2.4 Modelling the pedestrian LOS for urban arterials with footpaths ......................24
3.3 Application of pedestrian LOS prediction models ............................................................26
3.4 Summary .............................................................................................................................27
4 Data collection methodology .................................................................................................................................. 29
4.1 Introduction ........................................................................................................................29
4.2 General methodology .........................................................................................................29
4.2.1 Finding participants ..............................................................................................29
4.2.2 Route choice..........................................................................................................30
4.3 Survey specifics ..................................................................................................................32
4.3.1 Programme and timing .........................................................................................32
4.3.2 Control ..................................................................................................................32
4.3.3 Additional survey questions .................................................................................32
4.4 Summary .............................................................................................................................33
5 Model development methodology ....................................................................................................................... 34
5.1 Background .........................................................................................................................34
5.2 Selection of predictor variables .........................................................................................34
5.2.1 Introduction ..........................................................................................................34
5.2.2 Grouped variable sets ...........................................................................................34
5.2.3 Continuous and discrete variables .......................................................................37

6
5.2.4 Short-listed variables ............................................................................................ 38
5.3 Data manipulation ............................................................................................................. 43
5.3.1 Introduction .......................................................................................................... 43
5.3.2 Adjustment of raw walkability ratings ................................................................ 43
5.3.3 Manipulation of variables .................................................................................... 48
5.3.4 Additional data manipulation and exclusions .................................................... 48
5.4 Analysis of predictor variables .......................................................................................... 49
5.4.1 Sample size ........................................................................................................... 49
5.4.2 Path-length variables ............................................................................................ 50
5.4.3 Road-crossing variables ....................................................................................... 55
5.5 Analysis of walkability, by gender and age ...................................................................... 61
5.5.1 Walkability of path lengths, by gender ............................................................... 61
5.5.2 Walkability of path lengths, by age group .......................................................... 62
5.5.3 Walkability of road crossings, by age group....................................................... 65
6 Prediction models .......................................................................................................................................................... 68
6.1 Mathematical approach ..................................................................................................... 68
6.1.1 Predictor variables ................................................................................................ 68
6.1.2 Models developed ................................................................................................ 68
6.2 Path-length models ............................................................................................................ 69
6.3 Environment-variable models ............................................................................................ 73
6.3.1 Summary: path-length models ............................................................................ 75
6.4 Road-crossing models ....................................................................................................... 77
6.4.1 Models, by crossing type ..................................................................................... 77
6.4.2 Summary: road-crossing models ......................................................................... 80
7 Discussion .......................................................................................................................................................................... 82
7.1 Use of the prediction models ............................................................................................ 82
7.1.1 Understanding the modelled walkability rating .................................................. 82
7.1.2 Participant rating vs predicted rating .................................................................. 83
7.2 Model for path lengths ...................................................................................................... 83
7.3 Models for road crossings ................................................................................................. 84
7.4 Comparison with the Landis walkability model ............................................................... 85
8 Recommendations ......................................................................................................................................................... 87
9 References .......................................................................................................................................................................... 88
Appendix A CSR maps ........................................................................................................................................................ 90
Appendix B Additional questionnaire ...................................................................................................................... 95
Appendix C Variables ......................................................................................................................................................... 96
Appendix D Variable correlations ............................................................................................................................... 97
Appendix E Walkability adjustment ....................................................................................................................... 101
Appendix F Model results ............................................................................................................................................ 102
Appendix G Contributions to overall walkability score, by variable ................................................. 109
7
Executive summary
Walking is often considered the ‘forgotten’ mode of transport, but every journey, no matter how big or
small, starts and ends with a single step.
Other modes of transport, and especially the private motor vehicle, have a high degree of measurability
because those other modes have previously undergone significant study. Walking, on the other hand,
requires limited infrastructure and it lags behind those other modes in terms of research.
This research project fills some of the ‘walking’ knowledge gap and provides practitioners with a
technique to quantify the quality of the pedestrian environment in a way that is similar to that which is
used for other modes of travel.
This research combined the methodology for collecting people’s perceptions of the walking environment
that is outlined in the NZTA’s Guide to undertaking community street reviews (2010), with the method for
systematically collecting physical and operational variables that is outlined in Walkability research tools –
variables collection methodology (Abley 2006). These publications and other background material can be
found at www.levelofservice.com.
This research, which was carried out from mid-2009 to early 2011, included undertaking a number of
surveys of the physical and operational characteristics of the street environments in Christchurch,
Gisborne, Auckland and Wellington (New Zealand), and correlating those measurements with how people
felt about those environments in terms of safety, pleasantness and other variables. A number of predictive
mathematical formulas were derived that enabled the perception of the qualitative quality of the street
environment to be calculated using quantitative measurements.
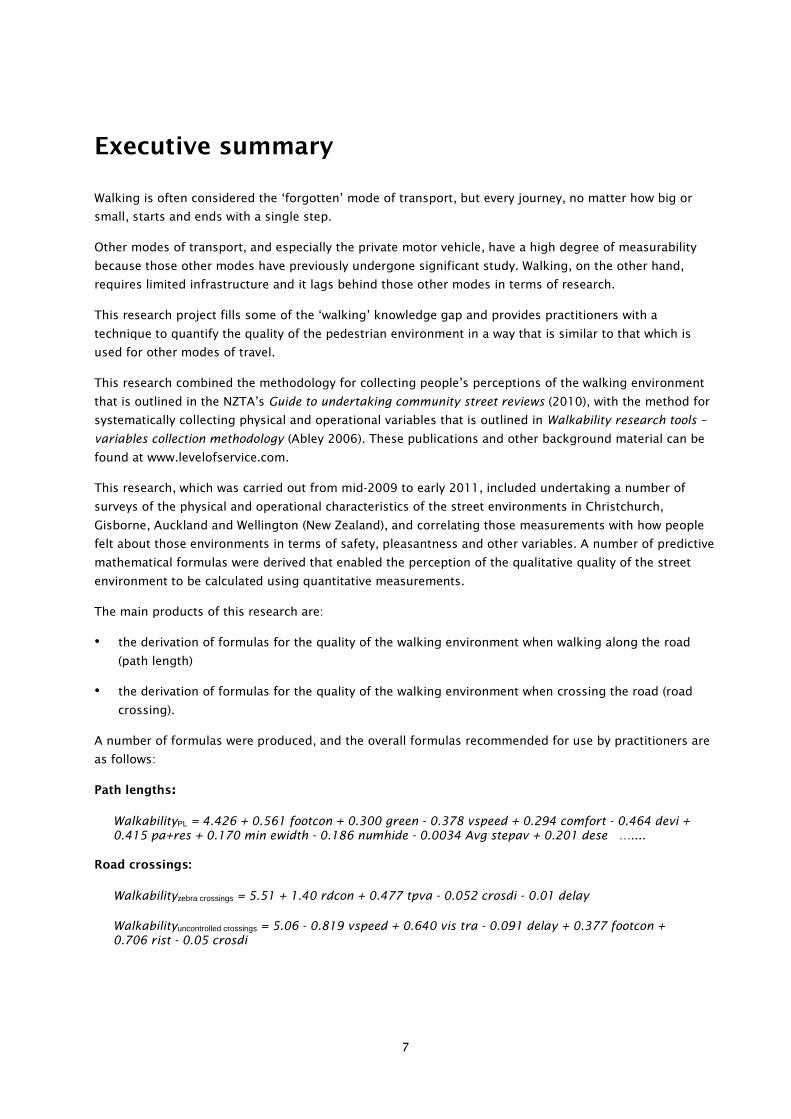
The main products of this research are:
• the derivation of formulas for the quality of the walking environment when walking along the road
(path length)
• the derivation of formulas for the quality of the walking environment when crossing the road (road
crossing).
A number of formulas were produced, and the overall formulas recommended for use by practitioners are
as follows:
Path lengths:
WalkabilityPL = 4.426 + 0.561 footcon + 0.300 green - 0.378 vspeed + 0.294 comfort - 0.464 devi + 0.415 pa+res + 0.170 min ewidth - 0.186 numhide - 0.0034 Avg stepav + 0.201 dese …....
Road crossings:
Walkabilityzebra crossings = 5.51 + 1.40 rdcon + 0.477 tpva - 0.052 crosdi - 0.01 delay
Walkabilityuncontrolled crossings = 5.06 - 0.819 vspeed + 0.640 vis tra - 0.091 delay + 0.377 footcon + 0.706 rist - 0.05 crosdi

Predicting walkability
8
The following recommendations are suggested as a result of this research:
• Data collection for sites at LOS D, E and F: The sample set used in this study did not include a
sufficient number of sites at LOS D, E and F to enable closer assessment and prediction of walkability
scores for such sites. Future studies should focus on data collection from a broader range of sites,
including an adequate number of sites with low pedestrian LOS ratings.
• Data collection for road crossings: The limited availability of relevant data meant that a sufficiently
converging model for signalised road crossings could not be built as part of this study. In addition,
the sample set included data from only 13 zebra crossing sites. Further research is needed to carefully
examine the pedestrian walkability of these crossing types by utilising data from additional sites.
• Collection of traffic-volume data: Because of the limited availability of data on traffic volumes at path
lengths and road crossings, traffic flow could not be included in the final walkability models. Efforts to
use the logarithmic relationship between noise and traffic volume to develop a surrogate variable for
traffic flow resulted in numerical complications during the modelling process. It is recommended that
traffic flow data be utilised in future analyses of the walkability of path lengths and road crossings.
• Walkability at different times of day: The data utilised for developing the walkability prediction
models was obtained from CSR surveys that were held at various times during the day. Future studies
could look at examining the walkability of sections at specific times of the day, especially in busy CBD
areas where the walking environment can differ markedly between peak and non-peak times, and
between daytime and the hours of darkness.
• Model validation: A comprehensive model validation exercise has not been undertaken as part of this
study, and could be the focus of follow-on research.
• Walkability for impaired pedestrians: Further research is also recommended on analysis of the
differences in walkability ratings between able-bodied pedestrians and those with physical and/or
visual impairments.
Abstract
This research provides a number of mathematical formulas for predicting the quality of the walking
environment from the perspective of the user using operational and physical variables. The formulas were
derived by combining the perception data gathered from participants in the community street reviews with
measurements of the walking environment.
The two main areas that were researched to enable the derivation of formulas were:
• when walking along the road (path length)
• when crossing the road (road crossing).
This research describes the process for obtaining the data and deriving the formulas, and recommends
the formulas most suitable for practitioner use. This research and the background resource material can
be referenced at www.levelofservice.com.
1 Introduction
9
1 Introduction
1.1 Motivation
This research has been produced to help practitioners quantify the quality of a walking environment.
Other modes of transport (especially the private motor vehicle) have been subject to widespread study,
and therefore have a high degree of measurability – but the research on walking lags behind. This
research report fills some of the ‘walking’ knowledge gap and provides practitioners with a technique for
quantifying the quality of the pedestrian environment in a way that is similar to that which is used for
other modes of travel. This process will allow practitioners to give the topic of walking more care and
attention, and facilitate the country’s progress towards an affordable, integrated, safe, responsive and
sustainable land transport system.
1.2 Background
Abley Transportation Consultants Ltd (Abley) and Beca Infrastructure Ltd (Beca) were commissioned by the
NZ Transport Agency (NZTA) to undertake research into predicting the walkability of urban road
environments in New Zealand. This project builds on previous research undertaken by Abley and Beca,
including:
• the development of Walkability research tools – variable collection methodology (Abley 2006)
• the Community street review (CSR) methodology that was developed in 2007, and the correction of
errata in 2010 (Abley 2010)
• the NZTA Pedestrian planning and design guide (2007), of which Beca was a principal author.
1.3 Research objective
The purpose of the research was to provide practitioners with a tool that used engineering measurements
to predict the quality of walking environments. The research objective was to develop prediction equations
for path lengths and road crossings that would allow the input of a number of operational and physical
measurements to derive a ‘level of service’ (LOS) for the path length or road crossing. This would enable
practitioners to identify areas of poor performance and potential improvements, and to test proposals.
The tool would also help practitioners measure the significance of proposals.
1.4 Report structure
This report consists of the following sections:
• Section 1: Introduction – outlines the research purpose
• Section 2: Background – walkability definitions such as pedestrian ‘level of service’
• Section 3: Literature review – international research on pedestrian modelling
• Section 4: Data collection methodology

Predicting walkability
10
• Section 5: Model development methodology
• Section 6: Prediction models – the derivation of the various models
• Section 7: Discussion
• Section 8: Recommendations
2 Background
11
2 Background
2.1 Introduction
In transportation planning circles, walking is generally considered the ‘forgotten’ mode, and there are very
few analytical techniques that enable practitioners to improve the provision for this mode of travel.
However, walking is a key element of a balanced transportation system. Overall, it is the second most
popular form of travel in New Zealand, and nearly 20% of all household trips are made on foot (NZTA
2007). Walking is an especially vital mode of transport for the 10% of households that have no car, for
those in those households with no access to a car for much of the day, and for those who cannot (or
choose not to) drive (ibid). Walking is often the only way that many people (eg the elderly, people with
impaired mobility, and those in low-income groups) can access everyday activities such as grocery
shopping, chemists and other services.
A low-quality walking environment can adversely affect an individuals’ ability to walk. Therefore it is vitally
important to identify and improve any infrastructure that is failing the needs of people who wish to use
walking as a mode of transport for practical, social and physical fitness reasons.
The fact that the quality of journeys undertaken on foot is not measured probably contributes to walking
being considered an after-thought for most decision makers. When the walkability of an area is
considered, it is usually left to urban designers and landscape architects to determine the visual appeal of
the walking environment, and to engineers to assess the functionality of specific walking schemes. This
often results in contradictory recommendations. For example, landscape architects might recommend
features that engineers find unsafe, and engineers might recommend features that landscape architects
find unattractive. In addition, the community – the end-user of walking schemes – rarely understands the
subtle details between engineering or urban design issues.
Unlike the range of tools that are available to measure the quality of provision for other transport modes
(especially the use of private motor vehicles), the tools that are currently available for practitioners to
measure the quality of the walking environment are limited. This is further complicated by the difficulty of
quantifying an area’s walkability because of the wide range of possible individual perceptions.
For the walking network to be included in network planning and the economic analysis of transport
decisions, analysis tools that can evaluate the quality of a walking environment before it is constructed,
and provide a balance to the recommendations made for other transport modes, need to be developed.
2.1.1 Walkability – a definition
‘Walkability’ and ‘walkable’ are terms that have become common in the fields of engineering, planning and
health, partly because walking is widely recognised as having benefits for the social, health and economic
well-being of a society.
The term ‘walkability’ was defined in 2005 as ‘…the extent to which the built environment is walking
friendly’ (Abley 2005), and this definition was incorporated into the NZTA’s Pedestrian planning and
design guide (NZTA 2007). The Design Guide also noted that walkability is ‘…a useful way to assess the
characteristics of an area or a route, although it can be subjective’.

Predicting walkability
12
It is this subjectivity that is the focus of this research, specifically to develop the ability to calculate
qualitative walkability results from quantitative measurements.
2.2 Problem identification
Problems in the built environment, and specifically in the highway and pedestrian environments, can be
identified through proactive methods such as consultation, measuring the safety or efficiency of links, or
from recommendations made by the road controlling authority. Problems can also be identified through
resident or user complaints – but these measures are reactive and do not promote forward planning. This
means the cost of reactive or remedial work is difficult to factor into yearly budgets, apart from taking a
broad-brush guess. Additionally, working reactively means that funds may not be directed to the most
urgent projects and improvements, which might include unreported problems. This is clearly not an
inefficient use of finite funds.
Large capital projects are exempt from this reactive process because they are usually well planned and
budgeted for in advance, and can be quantified using strong economic measures such as a detailed cost–
benefit ratio. In contrast, the low cost of most walking infrastructure could be one reason for the scarcity
of quantifiable tools for measuring the quality of walking environments.
When a problem in the built environment is identified, it can either be viewed as:
• a maintenance issue that can be acted upon immediately, or have plans put in place to rectify it at the
first available opportunity
• an issue that requires further investigation, using one of the proactive or reactive measures described
above.
Professionals in this field favour taking active measures to improve the quality of the built environment,
and they are increasingly using performance design techniques (eg reviewing, auditing and rating) to test
performance measures such as walkability, and to understand problems and identify solutions.
2.3 Assessment techniques
In 2005, Abley Transportation Consultants Ltd developed the following three broad techniques for
assessing the performance of the built environment (and therefore walkability):
• Reviewing: This applies to existing situations and may include auditing and rating, as well as other
assessment tools. It can be used to assess the degree to which proposed options will improve
walkability at the qualitative level.
• Auditing: This can be applied to existing and proposed designs. It identifies deficiencies against
recognised standards, and can propose solutions. It is an ideal way of identifying maintenance issues
and simple remedies, both qualitatively and quantitatively.
• Rating: This is a tool for scoring the walkability of an environment or facility. It can be used on
existing or proposed designs, and allows a practitioner to compare different walking environments at
the quantitative level.

2 Background
13
This earlier work identified the need for a consumer-style audit that combined with a rating system to
meet both the qualitative and quantitative aspects of measuring walking environments. This is slightly
different to the methodologies that are applied when determining the quality of provision for, say,
motorised vehicles – these tend to be based on efficiency and safety issues, and are typically reported as
‘quality of service’ (or ‘level of service’).
2.4 Level of service (LOS)
2.4.1 Community street reviews (CSR)
Past publications on the topic of pedestrian ‘level of service’ (LOS), such as Fruin (1971) and the US
Transportation Research Board’s Highway capacity manual (HCM) (2000), mentioned environmental
factors, but they did not attempt to substantiate or qualify the effects of these on the perceived quality of
the pedestrian environment.
The absence of well-publicised tools to assess the quality of the walking environment has led to the
development of a number of independent walkability LOS rating systems. Three tools that have been
tested in New Zealand are:
• PERS: Pedestrian Environment Review System – Transport Research Laboratory (TRL)
• Walking Audit Methodology – Boulter and Rutherford, New Zealand, 2004
• Centres for Disease Control and Prevention (CDC) – Walkability Audit Tool – USA, 2000.
In 2007, a joint project by the New Zealand Health Sponsorship Council, Living Streets Aotearoa and Abley
Transportation Consultants developed a new tool called Community street review (Abley 2010), which
built upon the UK DIY community street audits (Living Streets 2002) concept and combined it with a
numerical rating system. The NZTA recently published an easy-to-read online CSR guide (NZTA 2010).
The CSR methodology provides a standard tool for measuring walkability in New Zealand and assesses the
walkability of a route from the point of view of the people using the route. It focuses on peoples’
perceptions regarding the road or road-crossing environment, and how they feel when walking. It collects
data on safety, the functionality of the pedestrian space, the ease of road crossings, the effects of urban
design, and other relevant factors. CSRs thus include not only a qualitative consumer audit, but also a
quantitative rating. A CSR benefits the immediate community (through the auditing process) and also
provides practitioners with an asset management tool (through the rating process) for prioritising
potential walking schemes.
CSR data was collected in conjunction with physical and operational data as a pilot for this project. The
results of this earlier project were reported in the NZTA report Walkability research tools – summary
report (Abley 2008).
The database that was created to facilitate the collection of this data is housed at www.levelofservice.com,
and the website provides a store for research on measuring walkability and the promotion of CSRs.
Additional CSR data and physical and operational measurements were gathered for this current research
project, and the database was updated to allow for increased functionality. The data has been used to
develop linear regression equations that link the raw walkability scores that were collected during the CSR

Predicting walkability
14
surveys with various physical and operational variables that affect the quality of the pedestrian
environment.
These mathematical equations can be used to calculate the perceived walkability in an existing or
proposed walking environment from its measured physical and operational factors, in order to allow
practitioners to estimate the LOS for journeys undertaken on foot in a similar manner to that currently
used for other modes of travel.
3 Literature review
15
3 Literature review
3.1 Introduction
The principal aim of the literature review was to evaluate the various pedestrian LOS modelling
methodologies that have been developed internationally, in order to develop pedestrian LOS prediction
models for roadside segments (path lengths) and road crossings in New Zealand.
Section 3.2 summarises several international research documents on pedestrian modelling for different
roadside environments. Section 3.3 describes the applications of pedestrian LOS prediction models.
Section 3.4 summarises the current research on pedestrian LOS prediction models and the variables that
they each assess.
3.2 Pedestrian LOS modelling
3.2.1 Pedestrian LOS prediction models for the roadside environment between intersections
3.2.1.1 Landis et al – Modelling the roadside walking environment (2001)
Landis et al developed a LOS model in a US metropolitan area, using the results from an earlier pedestrian
LOS perception survey that had collected more than 1200 observations from 75 participants walking on
one route in Florida. The purpose of that survey had been to evaluate the LOS of the individual roadway
segments within that route, rather than just the intersections.
The route consisted of 24 road segments with near-equal length, but with varying traffic characteristics,
roadside features and roadway conditions. Some segments did not have footpaths. The participants were
instructed to disregard the conditions at intersections and the immediate approaches, and also the
surrounding aesthetics, when assessing the quality of the walking infrastructure. The participants
evaluated each segment for how safe/comfortable they felt as they walked along it, using a 6-point (A–F)
scale (A being the best and F being the worst).
The researchers identified the following variables that could affect the preliminary structure and testing of
the pedestrian LOS model:
• lateral separation elements between pedestrian and motor vehicle traffic, including:
– the presence of a footpath
– the width of the footpath
– buffers (verges) between a footpath and motor vehicle travel lanes
– the presence of barriers within the buffer area
– the presence of on-street parking
– the width of the outside travel lane
– the presence and width of shoulder or cycle lanes
Predicting walkability
16
• motor vehicle traffic volume
• the effect of vehicle speed
• the percentage of heavy vehicles
• driveway access frequency and volume.
Landis et al pointed out that the variables listed above were ‘considered the most probable primary factors
affecting pedestrians’ sense of safety’. The variables were identified using several Pearson Correlation
Analyses and extensive iterative testing of roadside segment groupings with common levels of
independent variables.
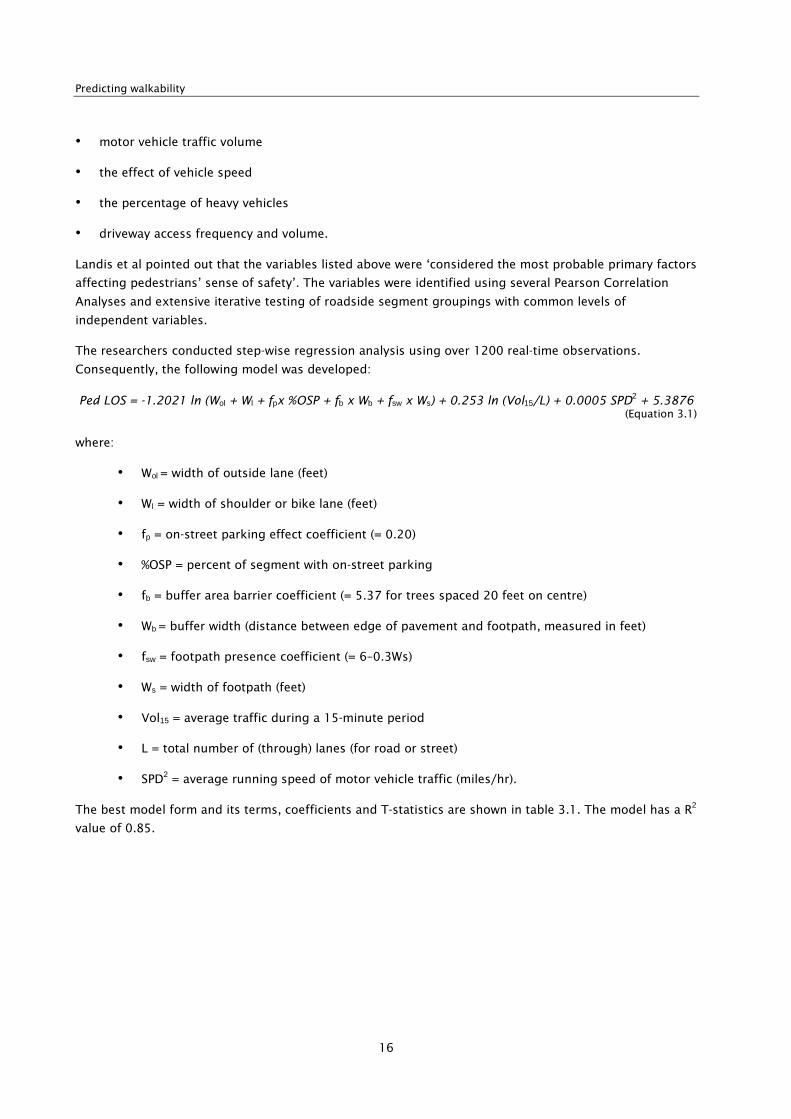
The researchers conducted step-wise regression analysis using over 1200 real-time observations.
Consequently, the following model was developed:
Ped LOS = -1.2021 ln (Wol + Wl + fpx %OSP + fb x Wb + fsw x Ws) + 0.253 ln (Vol15/L) + 0.0005 SPD2 + 5.3876
(Equation 3.1)
where:
• Wol = width of outside lane (feet)
• Wl = width of shoulder or bike lane (feet)
• fp = on-street parking effect coefficient (= 0.20)
• %OSP = percent of segment with on-street parking
• fb = buffer area barrier coefficient (= 5.37 for trees spaced 20 feet on centre)
• Wb = buffer width (distance between edge of pavement and footpath, measured in feet)
• fsw = footpath presence coefficient (= 6–0.3Ws)
• Ws = width of footpath (feet)
• Vol15 = average traffic during a 15-minute period
• L = total number of (through) lanes (for road or street)
• SPD2 = average running speed of motor vehicle traffic (miles/hr).
The best model form and its terms, coefficients and T-statistics are shown in table 3.1. The model has a R2
value of 0.85.

3 Literature review
17
Table 3.1 Model coefficients and T-statistics
Model terms Coefficients T-statistics
Lateral separation elements: ln(LS) -1.2021 -10.072
Motor vehicle volume: ln(Vol15/L) 0.253 3.106
Speed and MV type: SPD2 0.0005 2.763
Constant 5.3876 11.094
Model correlation (R2) 0.85
In table 3.2, the pedestrians’ LOS scores resulting from the equation developed by Landis et al have been
stratified into service categories A–F, reflecting the users’ perceptions of the road segments’ LOS for
pedestrian travel.
Table 3.2 LOS categories (Landis et al)
Level of Service Pedestrian LOS score
A ≤1.5
B >1.5 and ≤2.5
C >2.5 and ≤3.5
D >3.5 and ≤4.5
E >4.5 and ≤5.5
F >5.5
3.2.1.2 Huang and Chiun – Modelling level of service on pedestrian environment (2007)
Huang and Chiun developed a pedestrian LOS prediction model based on 1075 participants and 263 street
segments in Taiwan. The authors criticised the Landis et al model for using a potentially non-repeatable
questionnaire methodology to determine the quality of the walking environment.
Huang and Chiun collected the following variables that they considered would affect the pedestrian LOS:
• the effective width of the footpath (Ws)
• the width of barriers (Wb)
• the flow volume of pedestrians in maximum 15-minute periods during the peak hour (Np)
• the flow rate of pedestrians per minute per effective width of footpath (Qp)
• the vehicle flow volume in the peak hour (F).
If Ws is fixed and Np increases, then Qp can indicate the level of congestion of a pedestrian walking
environment.
The authors used the ‘fuzzy weighting methodology’ to develop a safety index and a comfort index for
each of the street segments. Both the safety index (αs) and comfort index (αc) are functions of Qp, Ws, Wb
and F.
A step-wise regression analysis using 215 observations was undertaken.

Predicting walkability
18
Consequently, the following model was developed using αs and
αc as the independent variables:
Pedestrian LOS = 0.782αs +0.810αc -3.535 (Equation 3.2)
The correlation coefficient (R2) of the above model is 0.9983. Based on the model, the authors were able
to develop a LOS grading A–L using Qp, Ws, Wb and F, as shown in figure 3.1.
Figure 3.1 Pedestrian LOS grading system (Huang and Chiun 2007)
3.2.1.3 Gallin – Quantifying pedestrian friendliness (2001)
Gallin developed a very simplistic model to determine LOS for pedestrians for footpath segments. He
identified the following three main categories that affect pedestrian LOS:
• the physical characteristics
• location factors
• user factors.
The factors contained in each category are scored by using the system shown in table 3.3. Each factor is
multiplied by its respective weight, and addition of these values results in a combined score that is used
to assign the corresponding LOS grades, as shown in table 3.4.

3 Literature review
19
Table 3.3 Assessment table to determine pedestrian LOS for footpath segments (Gallin 2001)
Predicting walkability
20
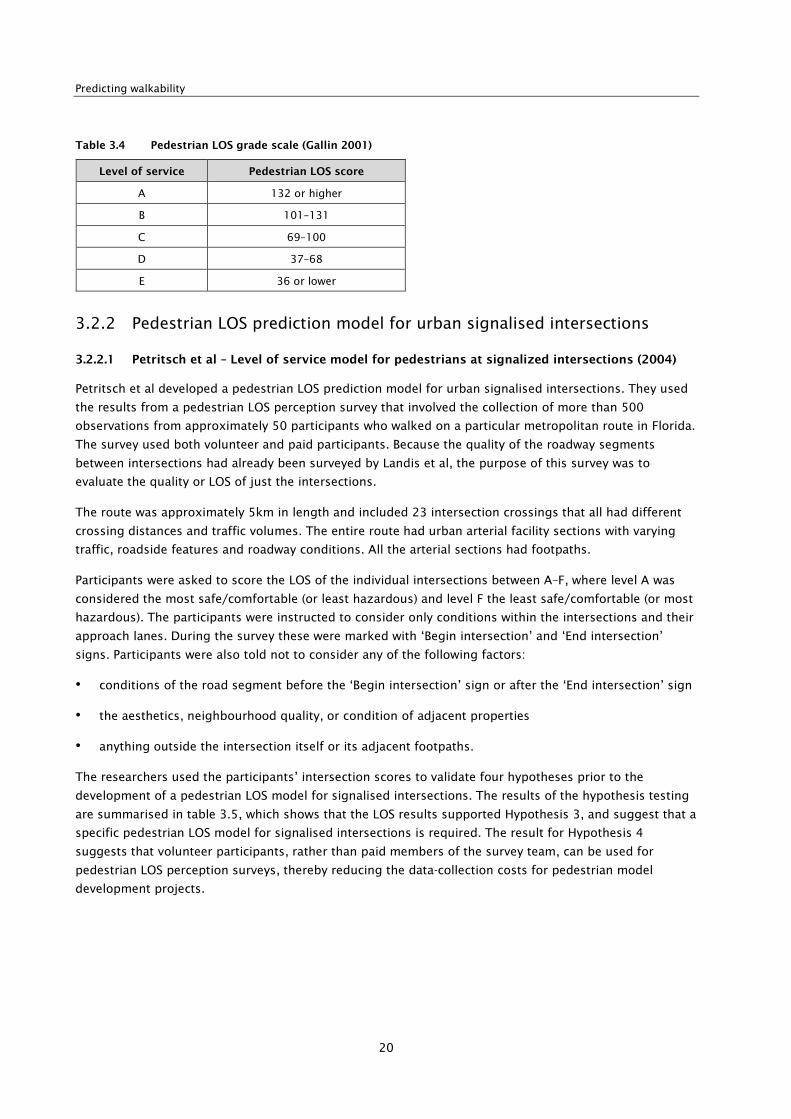
Table 3.4 Pedestrian LOS grade scale (Gallin 2001)
Level of service Pedestrian LOS score
A 132 or higher
B 101–131
C 69–100
D 37–68
E 36 or lower
3.2.2 Pedestrian LOS prediction model for urban signalised intersections
3.2.2.1 Petritsch et al – Level of service model for pedestrians at signalized intersections (2004)
Petritsch et al developed a pedestrian LOS prediction model for urban signalised intersections. They used
the results from a pedestrian LOS perception survey that involved the collection of more than 500
observations from approximately 50 participants who walked on a particular metropolitan route in Florida.
The survey used both volunteer and paid participants. Because the quality of the roadway segments
between intersections had already been surveyed by Landis et al, the purpose of this survey was to
evaluate the quality or LOS of just the intersections.
The route was approximately 5km in length and included 23 intersection crossings that all had different
crossing distances and traffic volumes. The entire route had urban arterial facility sections with varying
traffic, roadside features and roadway conditions. All the arterial sections had footpaths.
Participants were asked to score the LOS of the individual intersections between A–F, where level A was
considered the most safe/comfortable (or least hazardous) and level F the least safe/comfortable (or most
hazardous). The participants were instructed to consider only conditions within the intersections and their
approach lanes. During the survey these were marked with ‘Begin intersection’ and ‘End intersection’
signs. Participants were also told not to consider any of the following factors:
• conditions of the road segment before the ‘Begin intersection’ sign or after the ‘End intersection’ sign
• the aesthetics, neighbourhood quality, or condition of adjacent properties
• anything outside the intersection itself or its adjacent footpaths.
The researchers used the participants’ intersection scores to validate four hypotheses prior to the
development of a pedestrian LOS model for signalised intersections. The results of the hypothesis testing
are summarised in table 3.5, which shows that the LOS results supported Hypothesis 3, and suggest that a
specific pedestrian LOS model for signalised intersections is required. The result for Hypothesis 4
suggests that volunteer participants, rather than paid members of the survey team, can be used for
pedestrian LOS perception surveys, thereby reducing the data-collection costs for pedestrian model
development projects.

3 Literature review
21
Table 3.5 Hypotheses test results for signalised intersections
Hypothesis Result
1 Participants would score the intersections differently according to
their demographic characteristics. Insignificant
2 Crossing pedestrians who were walking with the traffic (ie walking in
the same direction as the traffic in the adjacent lanes parallel with the
crosswalk) would score the intersections differently from crossing
pedestrians who were walking against the traffic.
Insignificant
3 The pedestrian LOS model for roadway segments does not
adequately predict how well intersections serve pedestrians. Significant
4 Paid participants would score intersections differently from volunteer
participants. Insignificant
The researchers identified the following list of variables that could affect the preliminary structure and
testing of the pedestrian LOS model:
• perceived conflicts:
– motorists turning right from the street parallel to the road crossing
– motorists turning right from side streets, on a red light
– through motorists on the street parallel to the road crossing
– motorists turning left from the street parallel to the road crossing
• perceived exposure:
– crossing distance
– presence of a crosswalk
– other traffic-control devices (eg no right turn on red signs, yield to pedestrians, etc)
– presence of kerb and/or sidewalk at waiting/landing areas
– median type (raised, painted, or none)
• delay – the researchers used equation 18-5 from the Highway capacity manual (TRB 2000) to calculate
pedestrian delay at signalised intersections.
These variables were identified using the following processes:
• Identify which variables are relevant, using Pearson Correlations.
• Test for the best configuration of each variable that results in the best-fit regression model.
• Establish the coefficients for the variables that result in the best-fit regression model.
The researchers conducted step-wise regression analysis using over 500 real-time observations.
Predicting walkability
22
Consequently, the following model was developed:
Pedestrian LOS for Signalised Intersections = (RTOR+PermLefts) + (PerpTrafVol*PerpTrafSpeed) + (LanesCrossed0.514) + ln(PedDelay) + C (Equation 3.3)
where:
• RTOR+PermLefts = sum of the number of right-turn-on-red vehicles, and the number of
motorists making a permitted left turn, in a 15-minute period
• PerpTrafVol*PerpTrafSpeed = product of the traffic in the outside through lane of the street
being crossed, and the midblock 85th percentile speed of traffic on the street being crossed, in
a 15-minute period
• LanesCrossed = number of lanes being crossed by the pedestrian
• PedDelay = average number of seconds the pedestrian is delayed before being able to cross
the intersection
• C = constant.
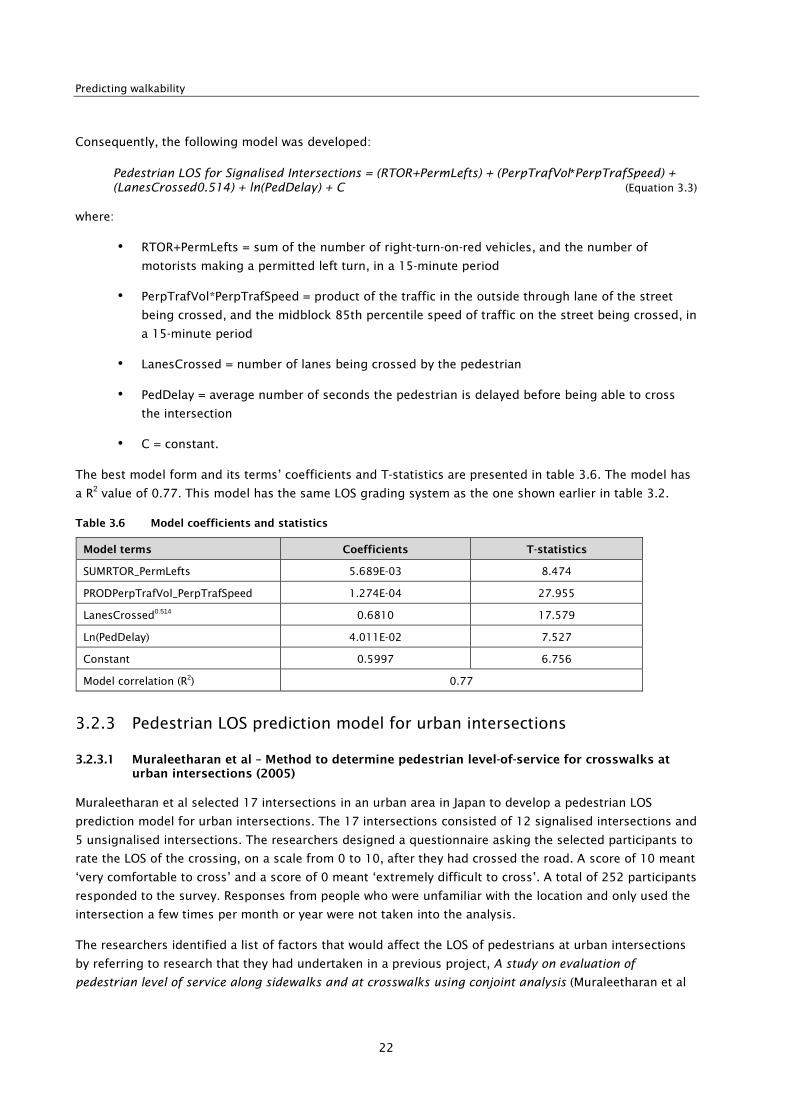
The best model form and its terms’ coefficients and T-statistics are presented in table 3.6. The model has
a R2 value of 0.77. This model has the same LOS grading system as the one shown earlier in table 3.2.
Table 3.6 Model coefficients and statistics
Model terms Coefficients T-statistics
SUMRTOR_PermLefts 5.689E-03 8.474
PRODPerpTrafVol_PerpTrafSpeed 1.274E-04 27.955
LanesCrossed0.514 0.6810 17.579
Ln(PedDelay) 4.011E-02 7.527
Constant 0.5997 6.756
Model correlation (R2) 0.77
3.2.3 Pedestrian LOS prediction model for urban intersections
3.2.3.1 Muraleetharan et al – Method to determine pedestrian level-of-service for crosswalks at urban intersections (2005)
Muraleetharan et al selected 17 intersections in an urban area in Japan to develop a pedestrian LOS
prediction model for urban intersections. The 17 intersections consisted of 12 signalised intersections and
5 unsignalised intersections. The researchers designed a questionnaire asking the selected participants to
rate the LOS of the crossing, on a scale from 0 to 10, after they had crossed the road. A score of 10 meant
‘very comfortable to cross’ and a score of 0 meant ‘extremely difficult to cross’. A total of 252 participants
responded to the survey. Responses from people who were unfamiliar with the location and only used the
intersection a few times per month or year were not taken into the analysis.
The researchers identified a list of factors that would affect the LOS of pedestrians at urban intersections
by referring to research that they had undertaken in a previous project, A study on evaluation of
pedestrian level of service along sidewalks and at crosswalks using conjoint analysis (Muraleetharan et al

3 Literature review
23
2004). These factors included space at corners, crossing facilities, turning vehicles, delay at signals, and
pedestrian–bicycle interactions – see figure 3.2.
Figure 3.2 Factors affecting pedestrian LOS at intersections (Muraleetharan et al 2004)
The factors identified in figure 3.2 were weighted by coefficients derived by step-wise regression
modelling importance. Given that the factors shown in figure 3.2 are categorical variables, they were
assigned a categorical score individually to be transformed into numerical variables.
A step-wise multivariable regression analysis was used to express the pedestrian LOS prediction model for
intersections. Consequently, the following model was developed:
(Equation 3.4)
where:
• Dij = categorical score associated with jth level of the i
th attribute
• δij = 1 if the jth level of the i
th attribute is present
• pd = pedestrian delay in seconds
• pb = number of pedestrian–bicycle interactions.

Predicting walkability
24
3.2.4 Modelling the pedestrian LOS for urban arterials with footpaths
3.2.4.1 Petritsch et al – Pedestrian level of service model for urban arterial facilities with sidewalks (2006)
Petritsch et al developed a pedestrian LOS prediction model for urban arterials with footpaths, utilising the
results from their pedestrian LOS perception survey that had collected more than 500 observations from
approximately 50 participants walking on one route in Florida. The purpose of that survey had been to
evaluate the pedestrian LOS of the urban arterial facility as a whole, not just the intersections or the
roadway segments between intersections. It only addressed the through-movement of the pedestrians
along the arterial route, not pedestrians crossing from one side of the arterial to the other.
The course was approximately 5km in length and included 11 urban arterial facility sections. The
intersections had different crossing distances and traffic volumes. The entire route had urban arterial
facility sections with varying traffic, roadside features and roadway conditions. All the arterial sections had
footpaths provided.
Participants were asked to score the LOS of the individual intersections from A to F, where A was
considered the most safe/comfortable (or least hazardous) and F the least safe/comfortable (or most
hazardous). The participants were instructed to consider only the conditions within the intersections and
their approach lanes, which were marked with ‘Begin facility’ and ‘End facility’ signs. Participants were also
told not to consider any of the following:
• the conditions of the road section prior to the ‘Begin facility’ sign or ‘End facility’ sign
• the aesthetics, neighbourhood quality, or condition of adjacent properties.
The researchers used the participants’ intersection scores to undertake testing of three hypotheses prior
to the development of a pedestrian LOS model for signalised intersections. The results of the hypothesis
testing are summarised in table 3.7.
Table 3.7 Hypotheses test results for urban arterials with footpaths
Hypothesis Result
1 Participants would score the intersections differently according to
their demographic characteristics. Insignificant
2 The pedestrian LOS model for roadway segments does not
adequately predict how well facilities serve pedestrians. Significant
3 Paid participants would score intersections differently from volunteer
participants. Insignificant
The researchers identified the following list of variables that could affect the preliminary structure and
testing of the pedestrian LOS model:
• proximity to the travel lanes
– width of the outside travel lane
– width of any additional cycle lane or paved shoulder
– separation between the pavement and the footpath
– width of the footpath

3 Literature review
25
• perceived conflicts at intersections
– motorists turning right from the street parallel to the crosswalk
– motorists turning right from side streets, on a red light
– through motorists on the street parallel to the crosswalk
– motorists turning left from the street parallel to the crosswalk
• perceived exposure to threat when crossing roadways or driveways
– crossing distance (across the street/driveway width plus a portion of the intersection radii)
– presence of a crosswalk – possibly modified by various markings
– other traffic-control devices (eg ‘No right turn on red’ signs, ‘Yield to pedestrians’ signs, etc
– presence of kerb and/or sidewalk (at waiting/landing areas)
– median type (raised, painted, or none)
• delay – the researchers used equation 18-5 from the Highway capacity manual (TRB 2000) to calculate
pedestrian delays at signalised intersections.
The following processes were used to identify the above variables:
• Identify which variables are relevant, using Pearson Correlations.
• Test for the best configuration of each variable that results in the best-fit regression model.
• Establish the coefficients for the variables that result in the best-fit regression model.
The researchers conducted step-wise regression analysis using over 500 real-time observations.
Consequently, the following model was developed:
Ped LOS for Arterials with Sidewalks = a1(XingWidth/Mile) + a2(Vol15) + C (Equation 3.5)
where:
• XingWidth/Mile = total width of crossings at conflict locations (this term is the sum (per mile)
of the crossing widths (in feet) of all driveways and intersections, signalised and unsignalised)
• Vol15 = average 15-minute volume on the adjacent roadway
• C = constant.
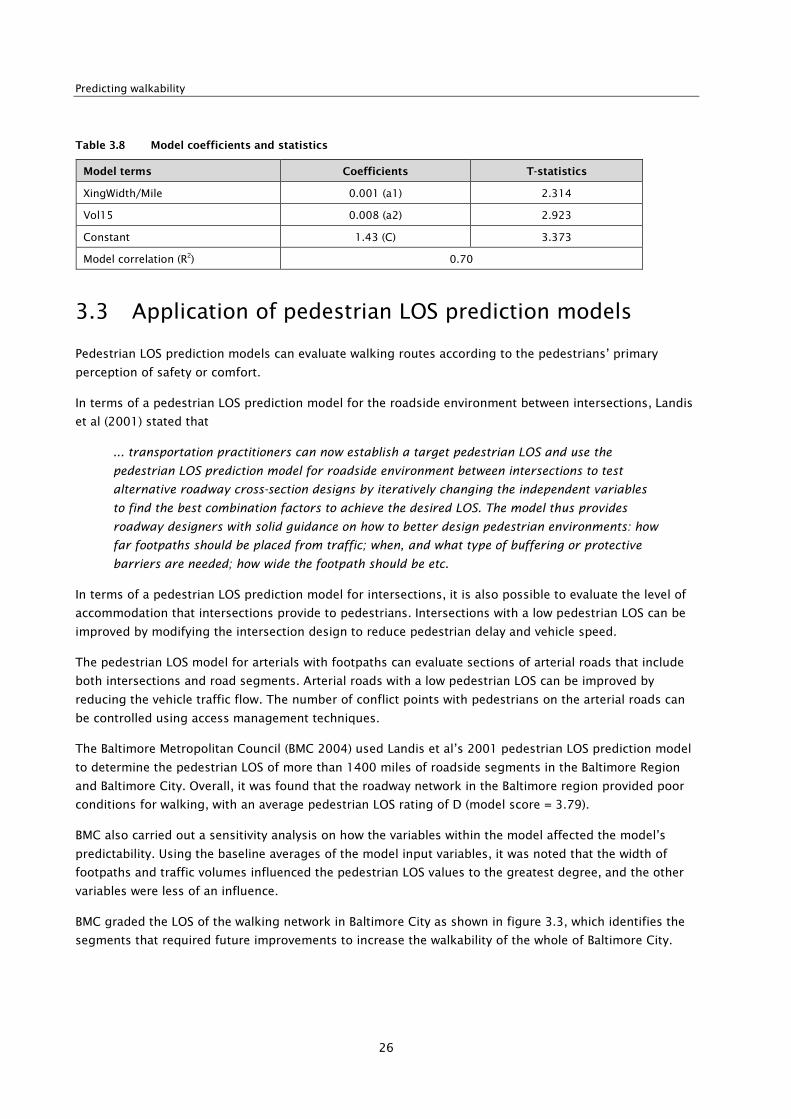
The best model form and its terms’ coefficients and T-statistics are presented in table 3.8. The model has
a R2 value of 0.77. This model has the same LOS grading system as the one shown earlier in table 3.2.
Predicting walkability
26
Table 3.8 Model coefficients and statistics
Model terms Coefficients T-statistics
XingWidth/Mile 0.001 (a1) 2.314
Vol15 0.008 (a2) 2.923
Constant 1.43 (C) 3.373
Model correlation (R2) 0.70
3.3 Application of pedestrian LOS prediction models
Pedestrian LOS prediction models can evaluate walking routes according to the pedestrians’ primary
perception of safety or comfort.
In terms of a pedestrian LOS prediction model for the roadside environment between intersections, Landis
et al (2001) stated that
... transportation practitioners can now establish a target pedestrian LOS and use the
pedestrian LOS prediction model for roadside environment between intersections to test
alternative roadway cross-section designs by iteratively changing the independent variables
to find the best combination factors to achieve the desired LOS. The model thus provides
roadway designers with solid guidance on how to better design pedestrian environments: how
far footpaths should be placed from traffic; when, and what type of buffering or protective
barriers are needed; how wide the footpath should be etc.
In terms of a pedestrian LOS prediction model for intersections, it is also possible to evaluate the level of
accommodation that intersections provide to pedestrians. Intersections with a low pedestrian LOS can be
improved by modifying the intersection design to reduce pedestrian delay and vehicle speed.
The pedestrian LOS model for arterials with footpaths can evaluate sections of arterial roads that include
both intersections and road segments. Arterial roads with a low pedestrian LOS can be improved by
reducing the vehicle traffic flow. The number of conflict points with pedestrians on the arterial roads can
be controlled using access management techniques.
The Baltimore Metropolitan Council (BMC 2004) used Landis et al’s 2001 pedestrian LOS prediction model
to determine the pedestrian LOS of more than 1400 miles of roadside segments in the Baltimore Region
and Baltimore City. Overall, it was found that the roadway network in the Baltimore region provided poor
conditions for walking, with an average pedestrian LOS rating of D (model score = 3.79).
BMC also carried out a sensitivity analysis on how the variables within the model affected the model’s
predictability. Using the baseline averages of the model input variables, it was noted that the width of
footpaths and traffic volumes influenced the pedestrian LOS values to the greatest degree, and the other
variables were less of an influence.
BMC graded the LOS of the walking network in Baltimore City as shown in figure 3.3, which identifies the
segments that required future improvements to increase the walkability of the whole of Baltimore City.

3 Literature review
27
Figure 3.3 Pedestrian LOS grading of the walking network in Baltimore City (BMC 2004)
3.4 Summary
There are several overseas pedestrian LOS prediction models that can be used to assess the walking LOS
within a city or region, to identify the roadway elements that require future improvement for pedestrians.
The types of pedestrian LOS prediction models developed internationally, and the key variables identified
for the individual models, are summarised in table 3.9.
Table 3.9 Pedestrian LOS prediction model types and key variables
Model type Country Key variables
Roadside segments between
intersections
US
• lateral separation of pedestrians from motor
vehicle traffic
• presence of physical barriers and buffers
• outside lane traffic volume
• motor vehicle speed
• vehicle mix
Taiwan
• effective width of footpath
• width of barriers
• flow volume of pedestrians
• vehicle flow volume in the peak hour

Predicting walkability
28
Model type Country Key variables
Urban signalised intersections US
• turning vehicles
• 85th percentile speed of traffic
• number of lanes being crossed by
pedestrians
• pedestrian delay
Urban intersections Japan
• space at intersection corner
• intersection crossing facilities
• intersection turning vehicles
• pedestrian delay
• number of pedestrian–bicycle interactions
Urban arterials with footpaths US • total width of crossings at conflict locations
• average volume on the adjacent roadway
Consulting the international pedestrian LOS prediction modelling methodologies has ensured the New
Zealand models that have been developed in this research are in line with those international
methodologies, and extend the knowledge in this area.
4 Data collection methodology
29
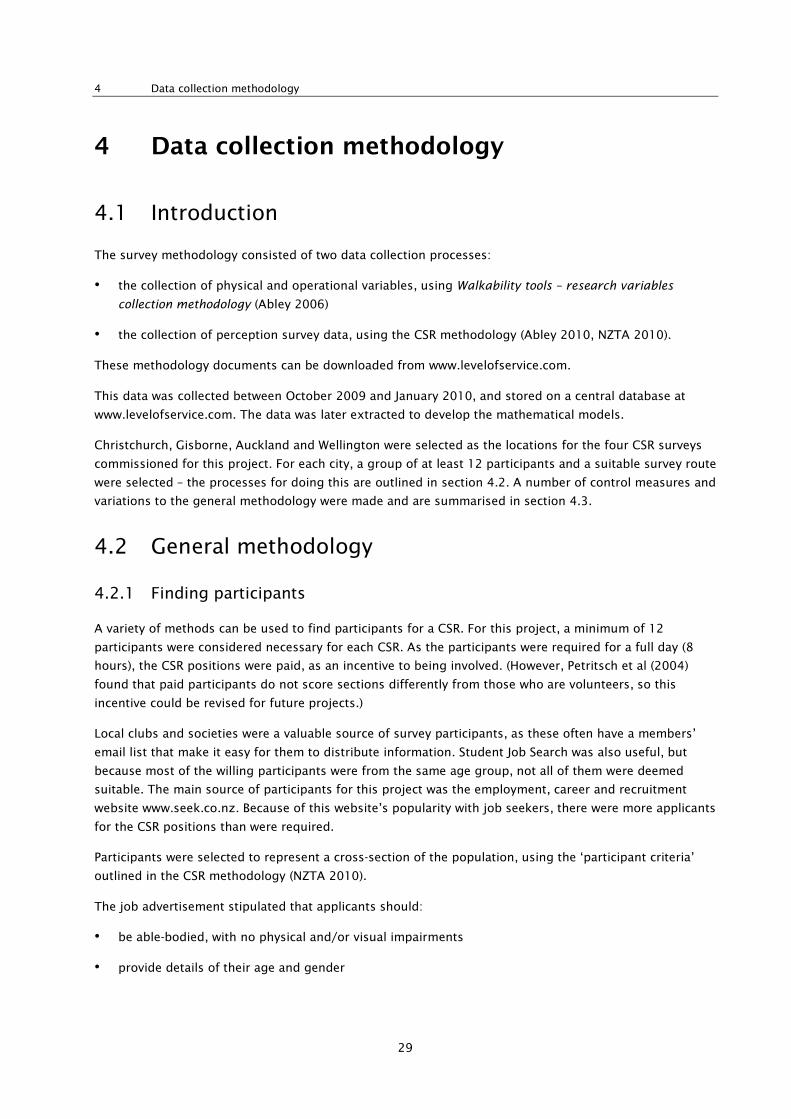
4 Data collection methodology
4.1 Introduction
The survey methodology consisted of two data collection processes:
• the collection of physical and operational variables, using Walkability tools – research variables
collection methodology (Abley 2006)
• the collection of perception survey data, using the CSR methodology (Abley 2010, NZTA 2010).
These methodology documents can be downloaded from www.levelofservice.com.
This data was collected between October 2009 and January 2010, and stored on a central database at
www.levelofservice.com. The data was later extracted to develop the mathematical models.
Christchurch, Gisborne, Auckland and Wellington were selected as the locations for the four CSR surveys
commissioned for this project. For each city, a group of at least 12 participants and a suitable survey route
were selected – the processes for doing this are outlined in section 4.2. A number of control measures and
variations to the general methodology were made and are summarised in section 4.3.
4.2 General methodology
4.2.1 Finding participants
A variety of methods can be used to find participants for a CSR. For this project, a minimum of 12
participants were considered necessary for each CSR. As the participants were required for a full day (8
hours), the CSR positions were paid, as an incentive to being involved. (However, Petritsch et al (2004)
found that paid participants do not score sections differently from those who are volunteers, so this
incentive could be revised for future projects.)
Local clubs and societies were a valuable source of survey participants, as these often have a members’
email list that make it easy for them to distribute information. Student Job Search was also useful, but
because most of the willing participants were from the same age group, not all of them were deemed
suitable. The main source of participants for this project was the employment, career and recruitment
website www.seek.co.nz. Because of this website’s popularity with job seekers, there were more applicants
for the CSR positions than were required.
Participants were selected to represent a cross-section of the population, using the ‘participant criteria’
outlined in the CSR methodology (NZTA 2010).
The job advertisement stipulated that applicants should:
• be able-bodied, with no physical and/or visual impairments
• provide details of their age and gender
Predicting walkability
30
• be available for the day immediately after the one scheduled for the CSR in case it had to be deferred
because of issues such as inclement weather.
In order to select the most representative group of participants, a list of applicants’ details was created in
order to ensure a range of different ages and an equal gender spread. An extra three participants were
selected, to ensure the CSRs would not be cancelled because of fewer than the minimum number of
participants being available on the day. This brought the total number of participants to 15 for each trial –
actual participant numbers for each survey can be found in section 4.4.
Once applicants had been selected, they were sent a set of instructions regarding their role and were
required to confirm their availability for the survey via email or a telephone call to the CSR leader.
The time frame for finding enough suitable participants was proportional to the size of the city or town. In
the large cities (ie Auckland, Wellington and Christchurch), approximately one week was sufficient; in
Gisborne, approximately two weeks were required.
4.2.2 Route choice
It was important to choose the routes for the surveys carefully, to maximise the use of the participants’
time as well as to incorporate a diverse range of sections in the route to enable the measurement of the
influence of different variables.
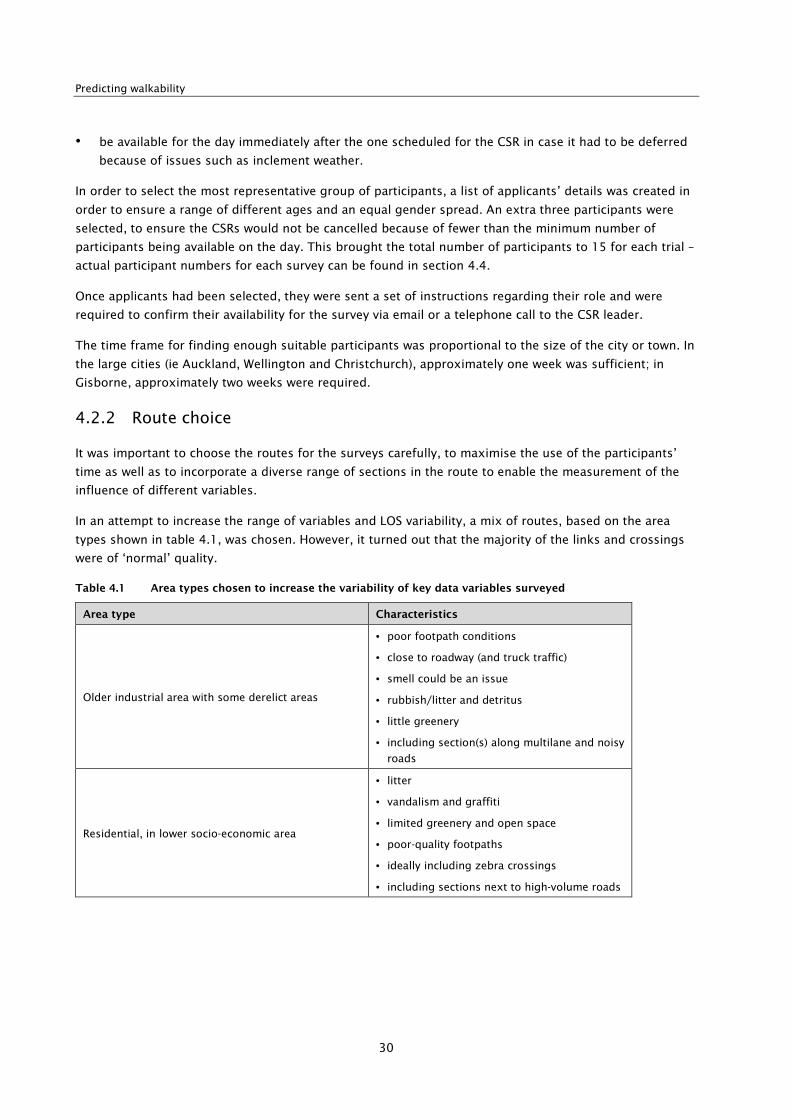
In an attempt to increase the range of variables and LOS variability, a mix of routes, based on the area
types shown in table 4.1, was chosen. However, it turned out that the majority of the links and crossings
were of ‘normal’ quality.
Table 4.1 Area types chosen to increase the variability of key data variables surveyed
Area type Characteristics
Older industrial area with some derelict areas
• poor footpath conditions
• close to roadway (and truck traffic)
• smell could be an issue
• rubbish/litter and detritus
• little greenery
• including section(s) along multilane and noisy
roads
Residential, in lower socio-economic area
• litter
• vandalism and graffiti
• limited greenery and open space
• poor-quality footpaths
• ideally including zebra crossings
• including sections next to high-volume roads

4 Data collection methodology
31
Area type Characteristics
High-quality central-city environment
• redevelopment with new paving and/or
cobbles
• high-activity area
• high-quality comfort features
• high pedestrian volumes and wider footpaths
• traffic-signal crossings
• verandas – partial and complete coverage
• good-quality crossing aids
• some multilane crossings
• with and without kerbside parking
New suburb with plenty of park land
• plenty of parks and open spaces along route
• footpaths with wider separation from traffic
• high-quality crossing aids
Although the area types described in the above table were incorporated into the four survey locations
(Auckland, Christchurch, Gisborne and Wellington), they were not all represented at each location.
Focusing on one or two of the area types for each survey location allowed for a less restricted route
choice.
Choosing the specific path lengths and suitable crossings was a difficult task, and it was best to consult
with staff members of the local councils for their in-depth knowledge of the local streets and of which
areas would be the most appropriate for the CSR surveys. Once the specific areas were chosen, they were
linked together by a series of path lengths and road crossings to form a complete pedestrian route.
Photos from Google Street View were cross referenced in order to check the road and pedestrian
environments. The final route choices were checked again with staff members of the local councils, in case
the road layout or pedestrian environment had changed significantly in the interim – if this was the case, a
more appropriate location was selected.
Once the route had been approved by all interested stakeholders, a final map of the CSR route was created
(see appendix A). Each path length and road crossing was labelled with a unique ID and if appropriate, the
path length or road crossing was colour coded to show if that part of the route would be surveyed in the
morning or afternoon.
Although it would have been more efficient to have a route that started and ended in the same location, it
was sometimes necessary to travel to another location for part of the route, in order to maintain levels of
variability in the pedestrian environment. It was important that this travel time had to be considered
during the planning of the route, in case some route sections might need to be removed either before the
survey began, or during the survey day, if time ran short.
The Christchurch CSR map (shown in appendix A) shows approximately 40 sections distributed equally
between the morning and afternoon of the survey day. This number of sections was calculated based on
previous CSRs that found it took approximately 3 hours to survey 40 sections that were made up of road
crossings and path lengths in approximately equal numbers. This was found to be the practicable
maximum number of sections for a full day of surveying.
Predicting walkability
32
It is important to note that in the Gisborne and Auckland CSRs, some additional questions were included,
thus increasing the time taken per section. These additional questions are described in section 4.3.3.
4.3 Survey specifics
4.3.1 Programme and timing
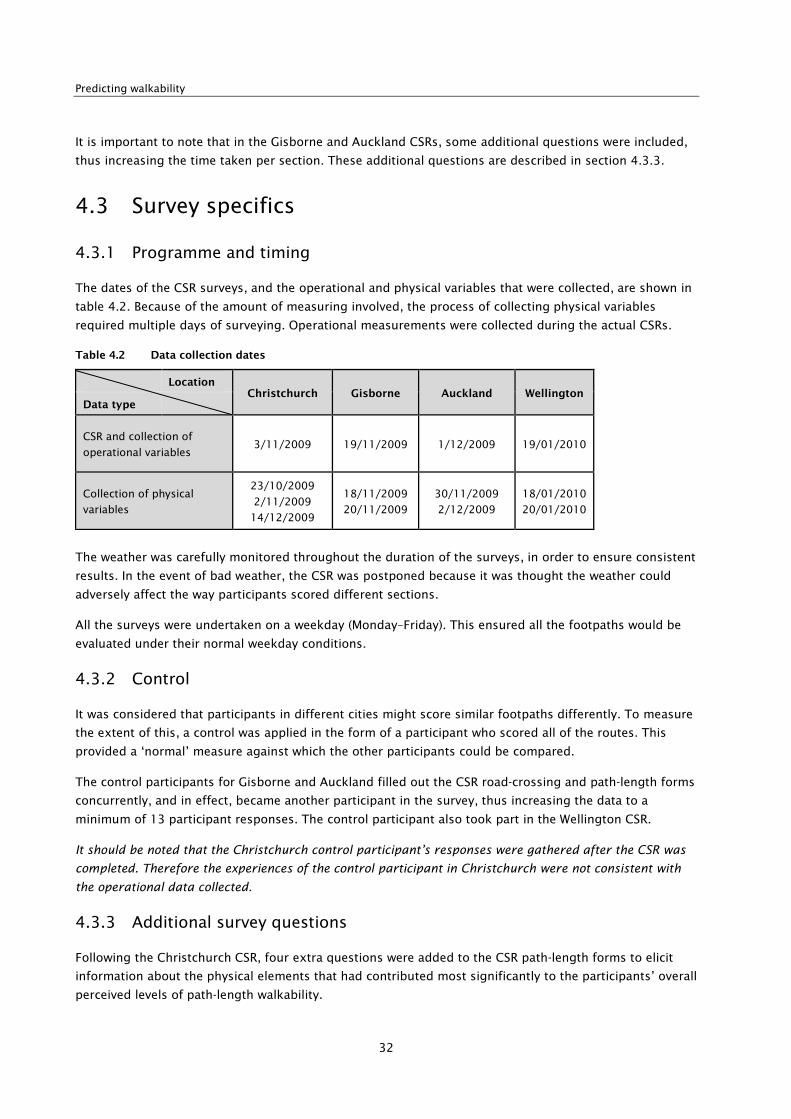
The dates of the CSR surveys, and the operational and physical variables that were collected, are shown in
table 4.2. Because of the amount of measuring involved, the process of collecting physical variables
required multiple days of surveying. Operational measurements were collected during the actual CSRs.
Table 4.2 Data collection dates
Location Christchurch Gisborne Auckland Wellington
Data type
CSR and collection of
operational variables 3/11/2009 19/11/2009 1/12/2009 19/01/2010
Collection of physical
variables
23/10/2009
2/11/2009
14/12/2009
18/11/2009
20/11/2009
30/11/2009
2/12/2009
18/01/2010
20/01/2010
The weather was carefully monitored throughout the duration of the surveys, in order to ensure consistent
results. In the event of bad weather, the CSR was postponed because it was thought the weather could
adversely affect the way participants scored different sections.
All the surveys were undertaken on a weekday (Monday–Friday). This ensured all the footpaths would be
evaluated under their normal weekday conditions.
4.3.2 Control
It was considered that participants in different cities might score similar footpaths differently. To measure
the extent of this, a control was applied in the form of a participant who scored all of the routes. This
provided a ‘normal’ measure against which the other participants could be compared.
The control participants for Gisborne and Auckland filled out the CSR road-crossing and path-length forms
concurrently, and in effect, became another participant in the survey, thus increasing the data to a
minimum of 13 participant responses. The control participant also took part in the Wellington CSR.
It should be noted that the Christchurch control participant’s responses were gathered after the CSR was
completed. Therefore the experiences of the control participant in Christchurch were not consistent with
the operational data collected.
4.3.3 Additional survey questions
Following the Christchurch CSR, four extra questions were added to the CSR path-length forms to elicit
information about the physical elements that had contributed most significantly to the participants’ overall
perceived levels of path-length walkability.

4 Data collection methodology
33
The physical elements considered were:
• the actual footpath, including the density of its usage
• the road, including the level of traffic on the road
• the degree of separation between the footpath and the road
• the larger environment beyond the footpath and road – ie all aspects not already covered above that
made the environment feel more or less comfortable to be in.
The extra questions are described in more detail in appendix B. Gisborne and Auckland participants
answered these questions immediately after the usual CSR questions for each path length. During the
participant briefing, extra time was taken to explain what each of the questions meant.
4.4 Summary
Surveying was undertaken in four locations in New Zealand – Auckland, Gisborne, Wellington and
Christchurch. Individual perceptions of the walking environment were collected using the CSR
methodology, and physical and operational variables were collected using the ‘Walkability tools research
variables collection’ methodology (Abley 2006).
Overall, 52 people of various ages, with an approximately even split of males and females, reviewed 165
path lengths and 137 road crossings. Table 4.3 shows the mix between path lengths and road crossings,
as well as a breakdown of the types of participants.
Table 4.3 Survey summary table
Location Christchurch Gisborne Auckland Wellington Total
Variable
Total length (m) 5800 6100 7800 6900 26,600
Path lengths (number) 40 40 31 54 165
Road crossings (number) 41 39 34 23 137
Gender Males 8 5 5 2 20
Females 5 8 8 11 32
Age
18–29 7 5 3 7 22
30–39 4 2 5 2 13
>40 2 6 5 4 17
Predicting walkability
34
5 Model development methodology
5.1 Background
This section describes the modelling methodology that was adopted for the purpose of developing models
for predicting the walkability of path-length and road-crossing sections, and identifies the preferred
models for each section type and for different age groups. In addition, the results of an assessment of the
variability of CSR walkability scores by participant gender and age are provided.
5.2 Selection of predictor variables
5.2.1 Introduction
The CSRs involved collecting data on a large number of variables for both path lengths and road
crossings. For the purpose of developing a model for predicting walkability, it was not considered feasible
for all variables to be included as predictor variables during the model development stage.
The full variables collection methodology report (Abley 2006) provides a description of each of the
physical and operation variables that have been used in model development, and also includes the process
for collecting the variables. The variables themselves are listed in appendix C along with the variable
‘string name’ – ie the shorthand name of the variable that was used in the statistical modelling software
package. The modelling package that was used to undertake the analysis was Minitab version 16.
This section describes the detailed methodology adopted for narrowing down the number of variables that
were eventually used for developing the walkability prediction model.
5.2.2 Grouped variable sets
The exhaustive set of physical and operational variables for which data was collected during the CSR
surveys was assessed to identify the variables that were most likely to have a strong relationship with
walkability. This was achieved by analysing the correlations between variables, and classifying them into
several categories (or ‘groups’) based on the expected type of influence of the respective variables on
walkability.
Correlations of all variables within each group (and between different groups) were analysed to exclude
variables that were highly correlated, and to determine the initial set of variables for input into the
models. The full correlation matrices for path-length and road-crossing variables are provided in appendix
C.
The sets of grouped variables for path lengths were as follows:
• gradient
– average longitudinal gradient (%)
• crossfall
– average crossfall (%)
5 Model development methodology
35
• separation from road
– distance from moving vehicles (m)
• accessways
– number of vehicle accessways
– visibility to vehicle accessways
– use of accessways
• footpath width
– average effective footpath width
– minimum effective width along path
– maximum effective width along path
• hazards
– surface type – concrete or asphalt
– average stumbling hazards (mm)
– average trip hazards
– average obstacle effective width
– deviation around obstacles
– footpath condition
• urban design
– how many utilities
– quantity of greenery
– land-use class
– how many comfort features
– average step height
– design comfort
• traffic
– number of adjacent vehicles (road width)
– vehicle speed
– number of heavy vehicles
– noise in decibels
• pedestrian volume
– people flow
– people density
• environment and personal security
– litter
– detritus
– vandalism
– number of hiding places

Predicting walkability
36
• weather
– survey weather
– weather, rain
– weather, cloudy
– weather, windy
– temperature
• parking
– use of on-street parking
• presence of others
– shared path.
The sets of grouped variables for crossings were as follows:
• entry from roadway and exit to roadway
– kerb/kerb cutdown present
– average trip hazard – average kerb gradient (both sides), average road gradient (both sides)
• crossing distance
– crossing length, distance (m)
– possible crossing width distance
– median/refuge island present
• traffic
– traffic volume at crossing
– noise in decibels
– time taken to cross
– delay (calculated)
• pedestrian flow
– people density
– people flow
• speed
– vehicle speed
– posted speed limit
• road pavement condition
– road condition
– average trip hazards
– average stumbling hazards (mm)
• central island
– presence of a central island
– average island effective width
• footpath condition

5 Model development methodology
37
• presence of cycle lanes
– number of cycle lanes to cross
• crossing type
– type of crossing – zebra/signalised/uncontrolled
• urban design
– how many comfort features
• visibility to traffic
• weather
– survey weather
– weather, rain
– weather, cloudy
– weather, windy
• tactiles
– presence of tactile aids
• deviation from desire lines
• personal security
– litter
– detritus
– vandalism.
These variables represent the initial set of variables that formed the sample set for model development.
However, all other physical and operational variables that were excluded at this stage were later tested
during the model development process, to identify any other important variables that may have been
overlooked.
5.2.3 Continuous and discrete variables
Variables for which data was collected in the CSR surveys can be broadly classified into two categories –
continuous variables and discrete variables.
5.2.3.1 Continuous variables
These are variables that can assume any value within the limits of the variable range. For example, road
width is classified as a continuous variable.
5.2.3.2 Discrete variables
Discrete variables are those that can only take on values that have been predefined as part of the
variable’s definition. For example, the walkability of a site, as collected during the CSR surveys, is a
discrete variable, since this can only assume integer values between 1 and 7 (inclusive). Similarly,
‘Weather, windy’ is classified as a discrete variable since it can only assume two values, ie either ‘Yes’ or
‘No’.

Predicting walkability
38
Discrete variables can be further subdivided into:
• ordinal variables, which include those variables that have been rated on a predefined scale (eg the
walkability rating and ‘yes/no’ variables)
• categorical variables, which have two or more categories without any ranking between categories (eg
land use).
Many of the variables for which data was collected during the CSR surveys were in the category of ‘discrete
variables’.
5.2.4 Short-listed variables
This section lists the variables within each of the variable groups in section 5.2.2. These variables were
selected for further analysis and formed the sample set used for modelling.
5.2.4.1 Path-length variables
Table 5.1 lists the variables that were included in the sample set for path lengths, along with the variable
type – ie whether continuous or discrete.
Table 5.1 Path-length variables selected for modelling
Category Variable name S. no. Variable description Type
Gradient Avg longgrad 1 Average longitudinal gradient (%) Continuous
Crossfall Avg cfall 2 Average crossfall (%) Continuous
Separation
from road Disveh 3 Distance from moving vehicles (m) Continuous
Accessways
Vaways 4 Number of vehicle accessways Discrete
Visacc 5 Visibility to vehicle accessways Discrete
Useacc 6 Use of accessways Discrete
Footpath width
Avg ewidth 7 Average effective width of the path Continuous
Min ewidth 8 Minimum effective width of the path Continuous
Max ewidth 9 Maximum effective width of the path Continuous
Hazards
Surface 8 Surface (concrete, asphalt or other) Discrete
Avg stum 9 Average stumbling hazards (mm) Continuous
Avg trip 10 Average trip hazards Continuous
Avg obs ewidth 11 Average effective width of path at the
location of an obstacle Continuous
Devi 12 Deviation around obstacles Discrete
Footcon 13 Footpath condition Discrete
Urban design
Manyutil 14 How many utilities Discrete
Green 15 Quantity of greenery Discrete
Manycom 16 How many comfort features Discrete
Avg stepav 17 Height of steps along route Continuous
Luclass 18 Land-use class Discrete
Traffic Numveh 19 Number of adjacent vehicles (per hour) Continuous

5 Model development methodology
39
Category Variable name S. no. Variable description Type
Traffic Roadwid 20 Road width (m) Continuous
Vspeed 21 Vehicle speed Continuous
Numhveh 22 Number of heavy vehicles (per hour) Continuous
Dbnoise 23 Noise in decibels Continuous
Ped. volume Peoplenum 24 People flow (per hour) Continuous
Density 25 People density Continuous
Environment
and personal
security
Litter 26 Litter Discrete
Deti 27 Detritus Discrete
Vanda 28 Vandalism Discrete
Numhide 29 Number of hiding places Discrete
Weather
Weather 30 Survey weather Discrete
Rain 31 Weather, rain Discrete
Cloud 32 Weather, cloudy Discrete
Wind 33 Weather, windy Discrete
Temp. 34 Temperature Continuous
Parking Useosp 35 Use of on-street parking Discrete
Shared path Shared 36 Shared path Discrete
5.2.4.2 Correlations between path-length variables
Table 5.2 lists some of the significant correlations between the selected path-length predictor variables
and all variables for which data was collected during the CSR surveys.
Table 5.2 Path-length variable correlations
Variable 1 Variable 2 Correlation
Survey weather Weather, windy 0.784
Average effective width of path Average effective width of permanent non-
regular obstacles 0.765
How many utilities How many comfort features 0.722
Average effective width of path Average effective width (m) of regular obstacles 0.667
People flow per hour People density 0.645
Average effective width of path Average obstacle effective width 0.577
Average obstacle effective width Average effective width (m) of regular obstacles 0.573
How many utilities Street activity 0.567
How many utilities People flow per hour 0.556
People flow per hour Street activity 0.536
Average obstacle effective width Average effective width of permanent non-
regular obstacles 0.522
Weather, cloudy Humidity 0.521
How many comfort features Design effort 0.519
Temperature Humidity -0.501
How many utilities Average number of regular obstacles 0.475
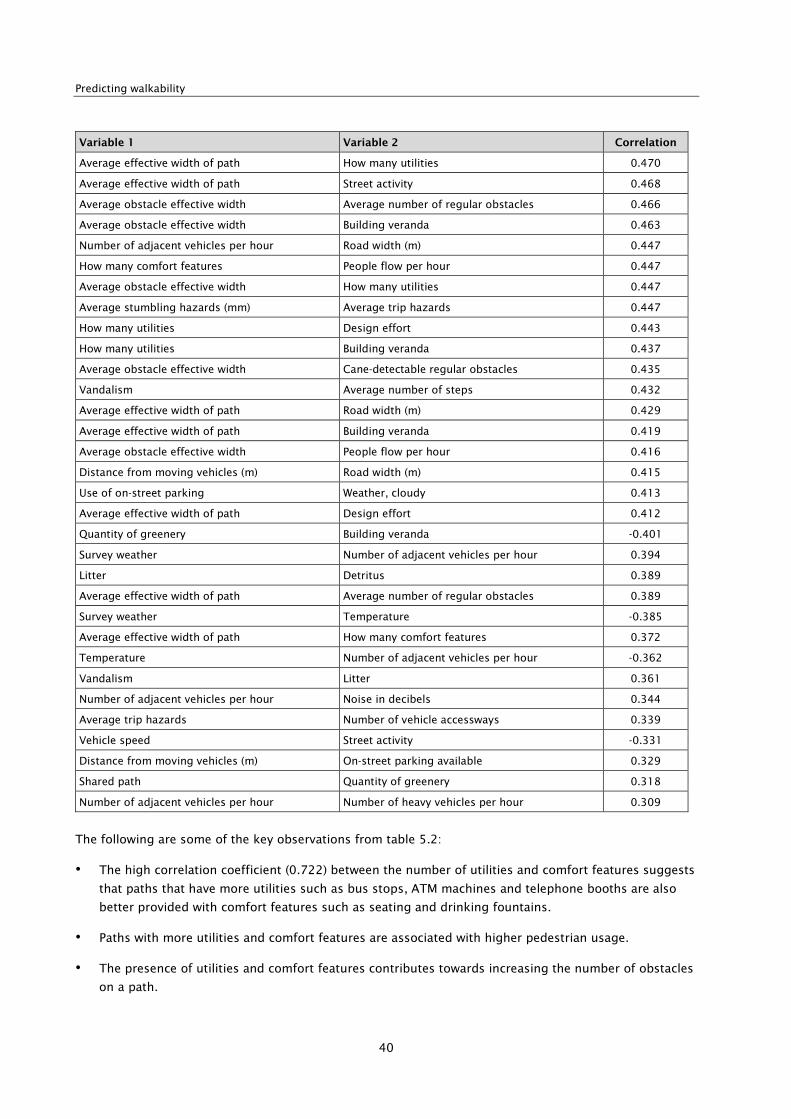
Predicting walkability
40
Variable 1 Variable 2 Correlation
Average effective width of path How many utilities 0.470
Average effective width of path Street activity 0.468
Average obstacle effective width Average number of regular obstacles 0.466
Average obstacle effective width Building veranda 0.463
Number of adjacent vehicles per hour Road width (m) 0.447
How many comfort features People flow per hour 0.447
Average obstacle effective width How many utilities 0.447
Average stumbling hazards (mm) Average trip hazards 0.447
How many utilities Design effort 0.443
How many utilities Building veranda 0.437
Average obstacle effective width Cane-detectable regular obstacles 0.435
Vandalism Average number of steps 0.432
Average effective width of path Road width (m) 0.429
Average effective width of path Building veranda 0.419
Average obstacle effective width People flow per hour 0.416
Distance from moving vehicles (m) Road width (m) 0.415
Use of on-street parking Weather, cloudy 0.413
Average effective width of path Design effort 0.412
Quantity of greenery Building veranda -0.401
Survey weather Number of adjacent vehicles per hour 0.394
Litter Detritus 0.389
Average effective width of path Average number of regular obstacles 0.389
Survey weather Temperature -0.385
Average effective width of path How many comfort features 0.372
Temperature Number of adjacent vehicles per hour -0.362
Vandalism Litter 0.361
Number of adjacent vehicles per hour Noise in decibels 0.344
Average trip hazards Number of vehicle accessways 0.339
Vehicle speed Street activity -0.331
Distance from moving vehicles (m) On-street parking available 0.329
Shared path Quantity of greenery 0.318
Number of adjacent vehicles per hour Number of heavy vehicles per hour 0.309
The following are some of the key observations from table 5.2:
• The high correlation coefficient (0.722) between the number of utilities and comfort features suggests
that paths that have more utilities such as bus stops, ATM machines and telephone booths are also
better provided with comfort features such as seating and drinking fountains.
• Paths with more utilities and comfort features are associated with higher pedestrian usage.
• The presence of utilities and comfort features contributes towards increasing the number of obstacles
on a path.

5 Model development methodology
41
• The effective width of permanent regular and non-regular obstacles is found to be highly correlated
with the effective width of the path (0.765 and 0.667 for non-regular and regular obstacles
respectively). This suggests that paths that have a larger number of regular or non-regular obstacles
are usually wider than those that have fewer obstacles.
• Roads with a high traffic volume are seen to be wider than those with a low traffic flow.
• The correlation between effective path width and road width (0.429) suggests that paths adjacent to
major roads are usually wider than those adjacent to narrower roads.
• A moderate correlation (0.415) is seen between distance from moving vehicles and road width. This,
along with the correlation between road width and traffic volume, indicates that paths adjacent to
busy roads are usually further away from the road than those adjacent to roads with lower traffic
volumes.
• The number of stumbling hazards and trip hazards are correlated (0.447).
• Paths next to roads with high traffic volumes usually had a higher amount of noise (coefficient of
correlation of 0.34).
5.2.4.3 Variables for road crossings
Variables included in the modelling for road crossings are provided in table 5.3:
Table 5.3 Road-crossing variables selected for modelling
Category Variable name S. no. Variable description Value type
Entry and exit
to road
Ekerbd, exitd 1 Entry or exit kerb dropped Discrete
Ekerbf, ekerbr 2 Entry kerb: footpath and road gradient Continuous
Exitf, exitr 3 Exit kerb: footpath and road gradient Continuous
Avgf 4 Average footpath gradient (entry and
exit kerb) Continuous
Avgr 5 Average road gradient (entry and exit
kerb) Continuous
Crossing
distance
Crosdi 6 Crossing-length distance (m) Continuous
Rist 7 Refuge island Discrete
Traffic
Dbnoise 8 Noise in decibels Continuous
Traffic volume 9 Volume of traffic at crossing Continuous
Timetak 10 Time taken to cross Continuous
Pedestrian
volume
Peoplenum 11 People flow Continuous
Density 12 People density Continuous
Speed of traffic Vspeed 13 Vehicle speed Continuous
Pospeed 14 Posted speed limit Continuous
Road pavement
condition
Rdcon 15 Road condition Discrete
Avg stum 16 Average stumbling hazards (mm) Continuous
Avg trip 17 Average trip hazards Continuous
Central island
Iswid 18 Island start: effective width Continuous
Imwid 19 Island middle: effective width Continuous

Predicting walkability
42
Category Variable name S. no. Variable description Value type
Central island
Ifwid 20 Island finish: effective width Continuous
Avgiwid 21 Average island effective width Continuous
Footpath Footcon 22 Footpath condition Discrete
Cycle lanes Croscyc 23 Number of cycle lanes to cross Discrete
Urban design Manucom 25 How many comfort features Discrete
Visibility Vistra 26 Visibility to traffic Discrete
Weather
Weather 27 Survey weather Discrete
Rain 28 Weather, rain Discrete
Cloud 29 Weather, cloudy Discrete
Wind 30 Weather, windy Discrete
Tactile aids Tpva 31 Tactile paving or visual aids Discrete
Deviation from
desire line Ddl 32 Deviation from desire line Continuous
Environment
and personal
security
Litter 33 Litter Discrete
Deti 34 Detritus Discrete
Vanda 35 Vandalism Discrete
Delay Delay 36 Crossing delaya Continuous
a) Delay was calculated from the time taken to cross (timetak) by using the crossing distance and assuming an
average walking speed of 1.5m/s.
5.2.4.4 Correlations between road-crossing variables
Table 5.4 lists the significant correlations between road-crossing predictor variables and all variables for
which data was collected.
Table 5.4 Road-crossing variable correlations
Variable 1 Variable 2 Correlation
People flow (during crossing time) People density 0.790
Survey weather Weather, windy 0.785
Crossing control type Number of traffic lanes to cross -0.701
Weather, cloudy Humidity 0.505
People density Design effort 0.439
Volume of traffic (per hour) Comfort features 0.435
Entry kerb: footpath gradient Exit kerb: footpath gradient 0.424
People flow (during crossing time) Kerb: effective width 0.418
Noise in decibels Volume of traffic 0.402
Crossing-length distance (m) Number of traffic lanes to cross 0.338
Crossing-length distance (m) Number of cycle lanes to cross 0.328
Noise in decibels Crossing control type -0.315
Tactile paving or visual aids Protection from permanent hazards 0.307
Road condition Footpath condition 0.306
Deviation from desire line Refuge island 0.301
5 Model development methodology
43
The key observations from table 5.4 are as follows:
• The large negative correlation (-0.701) between crossing type and number of traffic lanes shows that
the number of traffic lanes to be crossed by pedestrians decreases from signalised crossings to
uncontrolled crossings.
• The correlation of 0.435 between hourly traffic volume and comfort features suggests that more
comfort features are provided on road crossings with a higher volume of traffic.
• As in the case of path lengths, volume of traffic is found to be correlated (0.402) to the level of noise
at a road crossing. The correlation between noise and crossing type also leads to the expected
conclusion that signalised crossings are noisier than zebra and uncontrolled crossings because of
higher traffic volumes.
• Footpath gradients on entry and exit kerbs are also found to be correlated (0.424).
5.3 Data manipulation
5.3.1 Introduction
This section describes data-adjustment and manipulation procedures that were required to convert the
raw CSR data into a form suitable for use during the model development process.
5.3.2 Adjustment of raw walkability ratings
Because of human and behavioural differences, it was expected that there would be an inherent variability
in the raw walkability scores among various participants surveying the same section or site. An initial
analysis was conducted to assess the magnitude of this variation by comparing the raw walkability ratings
for each participant on a given site. Figure 5.1 illustrates the results of this analysis for Site 16 (Park
Tce/Rolleston Ave/Salisbury St), located in Christchurch.
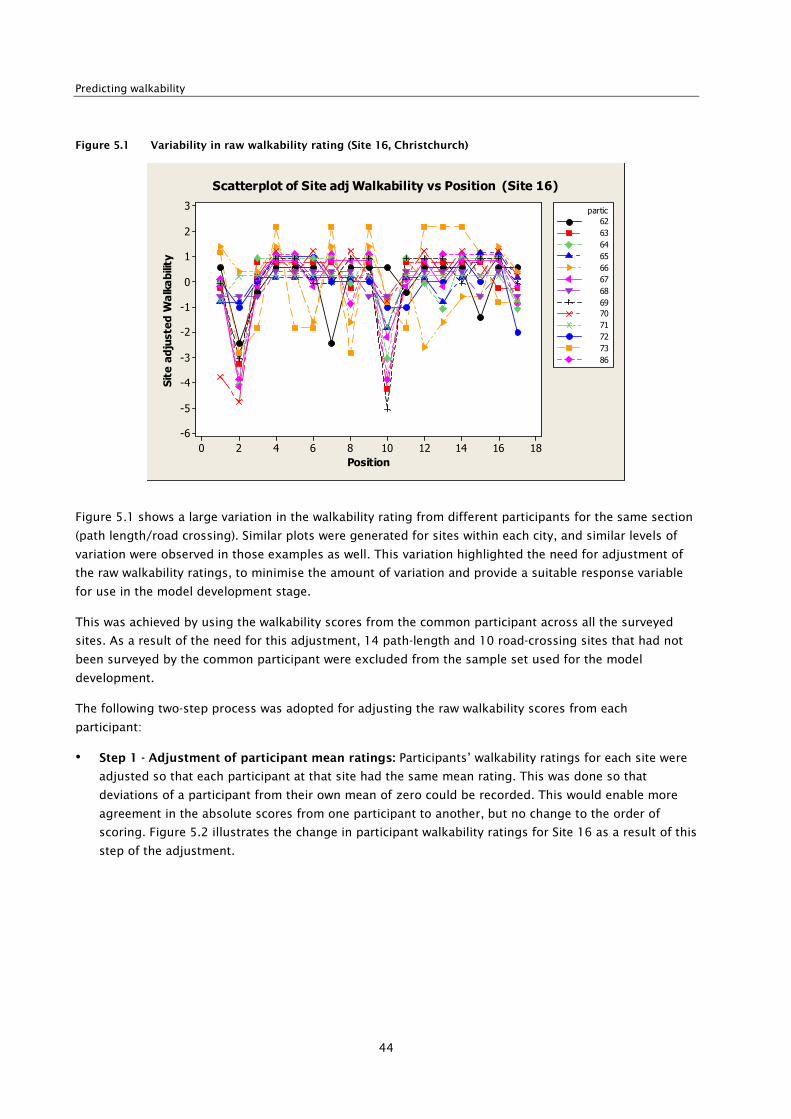
Predicting walkability
44
Figure 5.1 Variability in raw walkability rating (Site 16, Christchurch)
181614121086420
3
2
1
0
-1
-2
-3
-4
-5
-6
Position
Site adjusted Walkability
71
72
73
86
62
63
64
65
66
67
68
69
70
partic
Scatterplot of Site adj Walkability vs Position (Site 16)
Figure 5.1 shows a large variation in the walkability rating from different participants for the same section
(path length/road crossing). Similar plots were generated for sites within each city, and similar levels of
variation were observed in those examples as well. This variation highlighted the need for adjustment of
the raw walkability ratings, to minimise the amount of variation and provide a suitable response variable
for use in the model development stage.
This was achieved by using the walkability scores from the common participant across all the surveyed
sites. As a result of the need for this adjustment, 14 path-length and 10 road-crossing sites that had not
been surveyed by the common participant were excluded from the sample set used for the model
development.
The following two-step process was adopted for adjusting the raw walkability scores from each
participant:
• Step 1 - Adjustment of participant mean ratings: Participants’ walkability ratings for each site were
adjusted so that each participant at that site had the same mean rating. This was done so that
deviations of a participant from their own mean of zero could be recorded. This would enable more
agreement in the absolute scores from one participant to another, but no change to the order of
scoring. Figure 5.2 illustrates the change in participant walkability ratings for Site 16 as a result of this
step of the adjustment.

5 Model development methodology
45
Figure 5.2 Walkability adjustment step 1: mean participant rating of zero (Site 16, Christchurch)
181614121086420
3
2
1
0
-1
-2
-3
-4
-5
-6
Position
Site adjusted Walkability
71
72
73
86
62
63
64
65
66
67
68
69
70
partic
Scatterplot of Site adj Walkability vs Position (Site 16)
• Step 2 - Addition of mean common participant rating: The scores for each participant within each
site were then adjusted by the mean rating of the common participant. This was done by calculating
the average walkability score of the common participant for the given site, and adding the average
walkability score of the common participant to the values obtained from Step 1. This resulted in the
following adjusted walkability rating plot for Site 16.
Figure 5.3 Walkability adjustment step 2: adding mean rating for common participant (Site 16, Christchurch)
181614121086420
9
8
7
6
5
4
3
2
1
0
Position
Overall adjusted Walkability for Site 16
71
72
73
86
62
63
64
65
66
67
68
69
70
partic
Scatterplot of P86 adjusted Walkability vs Position (Site 16)
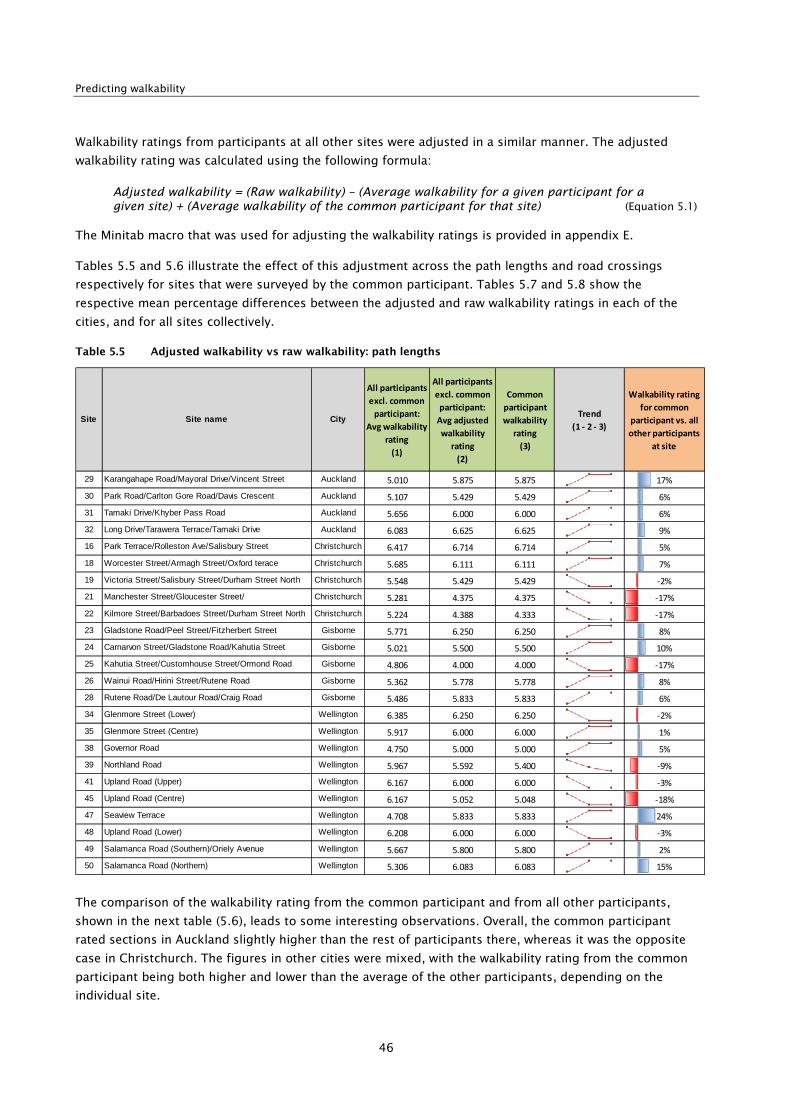
Predicting walkability
46
Walkability ratings from participants at all other sites were adjusted in a similar manner. The adjusted
walkability rating was calculated using the following formula:
Adjusted walkability = (Raw walkability) – (Average walkability for a given participant for a given site) + (Average walkability of the common participant for that site) (Equation 5.1)
The Minitab macro that was used for adjusting the walkability ratings is provided in appendix E.
Tables 5.5 and 5.6 illustrate the effect of this adjustment across the path lengths and road crossings
respectively for sites that were surveyed by the common participant. Tables 5.7 and 5.8 show the
respective mean percentage differences between the adjusted and raw walkability ratings in each of the
cities, and for all sites collectively.
Table 5.5 Adjusted walkability vs raw walkability: path lengths
The comparison of the walkability rating from the common participant and from all other participants,
shown in the next table (5.6), leads to some interesting observations. Overall, the common participant
rated sections in Auckland slightly higher than the rest of participants there, whereas it was the opposite
case in Christchurch. The figures in other cities were mixed, with the walkability rating from the common
participant being both higher and lower than the average of the other participants, depending on the
individual site.
Site Site name City
All participants
excl. common
participant:
Avg walkability
rating
(1)
All participants
excl. common
participant:
Avg adjusted
walkability
rating
(2)
Common
participant
walkability
rating
(3)
Trend
(1 - 2 - 3)
Walkability rating
for common
participant vs. all
other participants
at site
29 Karangahape Road/Mayoral Drive/Vincent Street Auckland 5.010 5.875 5.875 17%
30 Park Road/Carlton Gore Road/Davis Crescent Auckland 5.107 5.429 5.429 6%
31 Tamaki Drive/Khyber Pass Road Auckland 5.656 6.000 6.000 6%
32 Long Drive/Tarawera Terrace/Tamaki Drive Auckland 6.083 6.625 6.625 9%
16 Park Terrace/Rolleston Ave/Salisbury Street Christchurch 6.417 6.714 6.714 5%
18 Worcester Street/Armagh Street/Oxford terace Christchurch 5.685 6.111 6.111 7%
19 Victoria Street/Salisbury Street/Durham Street North Christchurch 5.548 5.429 5.429 -2%
21 Manchester Street/Gloucester Street/ Christchurch 5.281 4.375 4.375 -17%
22 Kilmore Street/Barbadoes Street/Durham Street North Christchurch 5.224 4.388 4.333 -17%
23 Gladstone Road/Peel Street/Fitzherbert Street Gisborne 5.771 6.250 6.250 8%
24 Carnarvon Street/Gladstone Road/Kahutia Street Gisborne 5.021 5.500 5.500 10%
25 Kahutia Street/Customhouse Street/Ormond Road Gisborne 4.806 4.000 4.000 -17%
26 Wainui Road/Hirini Street/Rutene Road Gisborne 5.362 5.778 5.778 8%
28 Rutene Road/De Lautour Road/Craig Road Gisborne 5.486 5.833 5.833 6%
34 Glenmore Street (Lower) Wellington 6.385 6.250 6.250 -2%
35 Glenmore Street (Centre) Wellington 5.917 6.000 6.000 1%
38 Governor Road Wellington 4.750 5.000 5.000 5%
39 Northland Road Wellington 5.967 5.592 5.400 -9%
41 Upland Road (Upper) Wellington 6.167 6.000 6.000 -3%
45 Upland Road (Centre) Wellington 6.167 5.052 5.048 -18%
47 Seaview Terrace Wellington 4.708 5.833 5.833 24%
48 Upland Road (Lower) Wellington 6.208 6.000 6.000 -3%
49 Salamanca Road (Southern)/Oriely Avenue Wellington 5.667 5.800 5.800 2%
50 Salamanca Road (Northern) Wellington 5.306 6.083 6.083 15%
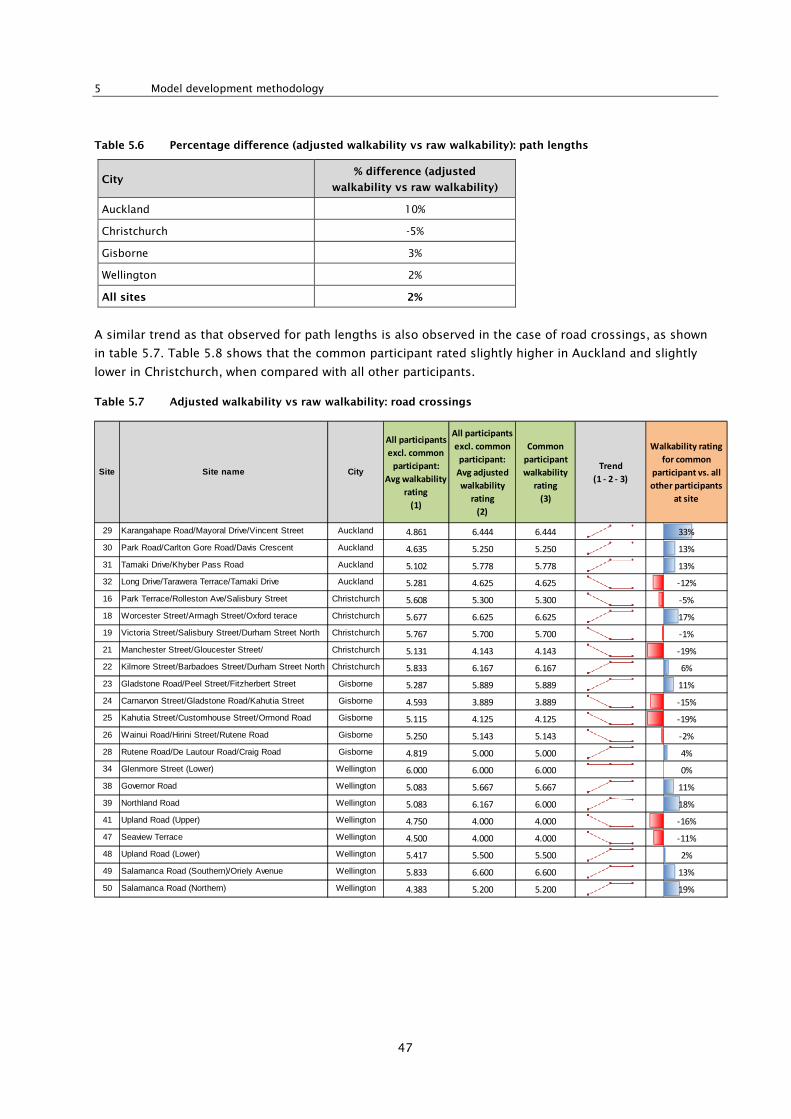
5 Model development methodology
47
Table 5.6 Percentage difference (adjusted walkability vs raw walkability): path lengths
City % difference (adjusted
walkability vs raw walkability)
Auckland 10%
Christchurch -5%
Gisborne 3%
Wellington 2%
All sites 2%
A similar trend as that observed for path lengths is also observed in the case of road crossings, as shown
in table 5.7. Table 5.8 shows that the common participant rated slightly higher in Auckland and slightly
lower in Christchurch, when compared with all other participants.
Table 5.7 Adjusted walkability vs raw walkability: road crossings
Site Site name City
All participants
excl. common
participant:
Avg walkability
rating
(1)
All participants
excl. common
participant:
Avg adjusted
walkability
rating
(2)
Common
participant
walkability
rating
(3)
Trend
(1 - 2 - 3)
Walkability rating
for common
participant vs. all
other participants
at site
29 Karangahape Road/Mayoral Drive/Vincent Street Auckland 4.861 6.444 6.444 33%
30 Park Road/Carlton Gore Road/Davis Crescent Auckland 4.635 5.250 5.250 13%
31 Tamaki Drive/Khyber Pass Road Auckland 5.102 5.778 5.778 13%
32 Long Drive/Tarawera Terrace/Tamaki Drive Auckland 5.281 4.625 4.625 -12%
16 Park Terrace/Rolleston Ave/Salisbury Street Christchurch 5.608 5.300 5.300 -5%
18 Worcester Street/Armagh Street/Oxford terace Christchurch 5.677 6.625 6.625 17%
19 Victoria Street/Salisbury Street/Durham Street North Christchurch 5.767 5.700 5.700 -1%
21 Manchester Street/Gloucester Street/ Christchurch 5.131 4.143 4.143 -19%
22 Kilmore Street/Barbadoes Street/Durham Street North Christchurch 5.833 6.167 6.167 6%
23 Gladstone Road/Peel Street/Fitzherbert Street Gisborne 5.287 5.889 5.889 11%
24 Carnarvon Street/Gladstone Road/Kahutia Street Gisborne 4.593 3.889 3.889 -15%
25 Kahutia Street/Customhouse Street/Ormond Road Gisborne 5.115 4.125 4.125 -19%
26 Wainui Road/Hirini Street/Rutene Road Gisborne 5.250 5.143 5.143 -2%
28 Rutene Road/De Lautour Road/Craig Road Gisborne 4.819 5.000 5.000 4%
34 Glenmore Street (Lower) Wellington 6.000 6.000 6.000 0%
38 Governor Road Wellington 5.083 5.667 5.667 11%
39 Northland Road Wellington 5.083 6.167 6.000 18%
41 Upland Road (Upper) Wellington 4.750 4.000 4.000 -16%
47 Seaview Terrace Wellington 4.500 4.000 4.000 -11%
48 Upland Road (Lower) Wellington 5.417 5.500 5.500 2%
49 Salamanca Road (Southern)/Oriely Avenue Wellington 5.833 6.600 6.600 13%
50 Salamanca Road (Northern) Wellington 4.383 5.200 5.200 19%
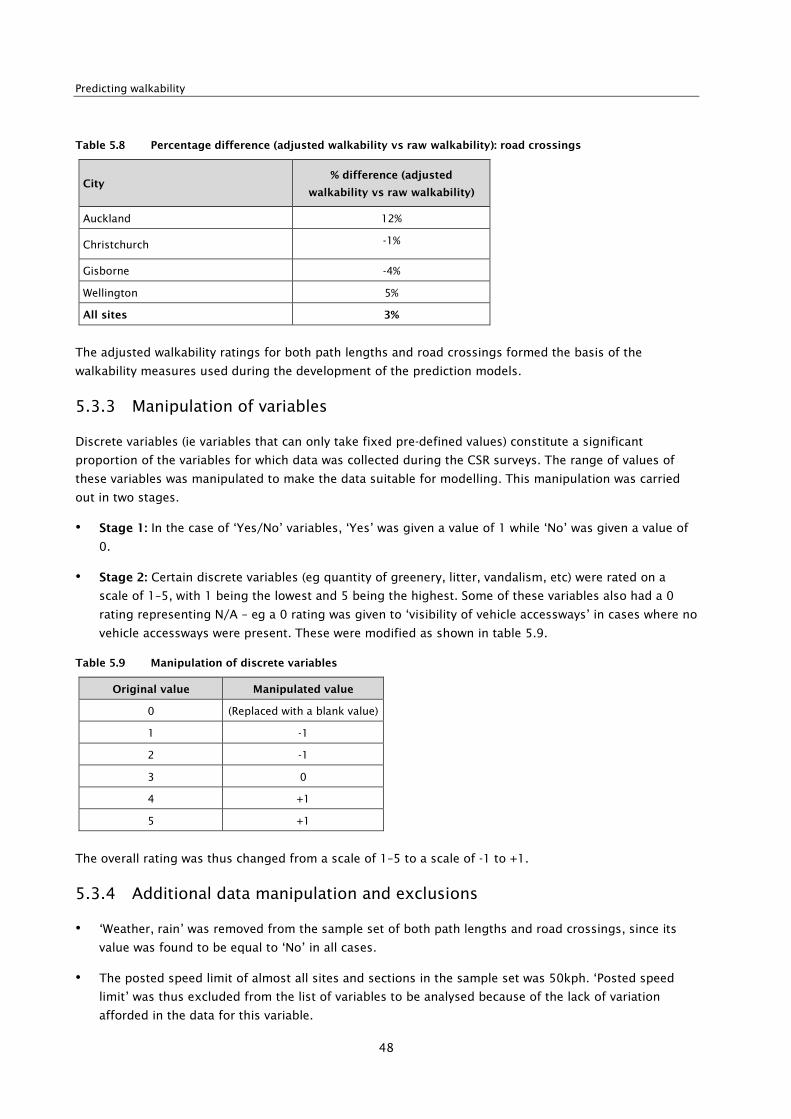
Predicting walkability
48
Table 5.8 Percentage difference (adjusted walkability vs raw walkability): road crossings
City % difference (adjusted
walkability vs raw walkability)
Auckland 12%
Christchurch -1%
Gisborne -4%
Wellington 5%
All sites 3%
The adjusted walkability ratings for both path lengths and road crossings formed the basis of the
walkability measures used during the development of the prediction models.
5.3.3 Manipulation of variables
Discrete variables (ie variables that can only take fixed pre-defined values) constitute a significant
proportion of the variables for which data was collected during the CSR surveys. The range of values of
these variables was manipulated to make the data suitable for modelling. This manipulation was carried
out in two stages.
• Stage 1: In the case of ‘Yes/No’ variables, ‘Yes’ was given a value of 1 while ‘No’ was given a value of
0.
• Stage 2: Certain discrete variables (eg quantity of greenery, litter, vandalism, etc) were rated on a
scale of 1–5, with 1 being the lowest and 5 being the highest. Some of these variables also had a 0
rating representing N/A – eg a 0 rating was given to ‘visibility of vehicle accessways’ in cases where no
vehicle accessways were present. These were modified as shown in table 5.9.
Table 5.9 Manipulation of discrete variables
Original value Manipulated value
0 (Replaced with a blank value)
1 -1
2 -1
3 0
4 +1
5 +1
The overall rating was thus changed from a scale of 1–5 to a scale of -1 to +1.
5.3.4 Additional data manipulation and exclusions
• ‘Weather, rain’ was removed from the sample set of both path lengths and road crossings, since its
value was found to be equal to ‘No’ in all cases.
• The posted speed limit of almost all sites and sections in the sample set was 50kph. ‘Posted speed
limit’ was thus excluded from the list of variables to be analysed because of the lack of variation
afforded in the data for this variable.

5 Model development methodology
49
• Values of certain variables were recorded multiple times. For example, in the case of path lengths,
‘effective footpath width’ was measured at multiple locations along a path. In such cases, a gross
average of all available measurements was taken as the final value.
• Data on land use collected during the CSR surveys was used to set up three separate land-use category
variables, each of which assume ‘Yes/No’ (+1/0) values as described earlier. These were:
– parkland/residential (pa+res)
– suburban shopping/commercial retail (ss+cr)
– commercial industrial/industrial (ci+i).
• Certain other variables, such as crossing type and vehicle speed, were manipulated to enable them to
assume numerical values.
Table 5.10 Manipulation of land-use and crossing-type variables
Variable Values
Crossing control type
Traffic light = 1
Zebra crossing = 2
Uncontrolled = 3
Vehicle speed
Below speed limit = -1
At speed limit = 0
Above speed limit = +1
Further details on data collection procedures for each of the variables can be found in the Variables
collection methodology report (Abley 2006).
5.4 Analysis of predictor variables
5.4.1 Sample size
As mentioned earlier, only those path-length and road-crossing sections that had been surveyed by the
common participant during the CSR surveys were selected for use in the final sample set for modelling.
Table 5.11 provides the number of sections (path lengths and road crossings) that were included in the
sample set, by city.
Table 5.11 Sample size for path lengths and road crossings
City Number of sections
Path lengths Road crossings
Auckland 31 34
Christchurch 40 41
Gisborne 40 39
Wellington 52 23
Total 163 137

Predicting walkability
50
5.4.2 Path-length variables
5.4.2.1 Introduction
Figures 5.4–5.8 show scatter plots of the various path-length predictor variables against the average
adjusted walkability rating from all participants on a path-length section. Table 5.1 provides descriptions
of the variable names used in the figures.
5.4.2.2 Gradient, crossfall, separation from road
Figure 5.4 shows plots of average longitudinal gradient and crossfall along the path, and separation from
the road.
Figure 5.4 Gradient, crossfall, separation from road vs adjusted walkability
Avg longgrad
Avg adj walk
100-10
8
7
6
5
4
3
2
Avg cfall
0-5-10
disveh
840
Matrix Plot of Avg adj walk vs Avg longgrad, Avg cfall, disveh
Although the plot for crossfall does not show a clear relationship with walkability, the plot for separation
from the road (disveh) indicates that a greater separation between road and footpath had a positive effect
on walkability. The range of distances of separation of paths included in the sample set for this study was
0–8.4m.
The plot for gradient shows that downhill paths, which have a negative gradient, (not unsurprisingly) were
considered to be more walkable than those that go uphill.
5.4.2.3 Vehicle accesses
Figure 5.5 suggests that increased visibility of vehicles from accessways (visacc) had a positive effect on
walkability, while higher use of vehicle accesses (useacc) tended to result in a drop in overall walkability.
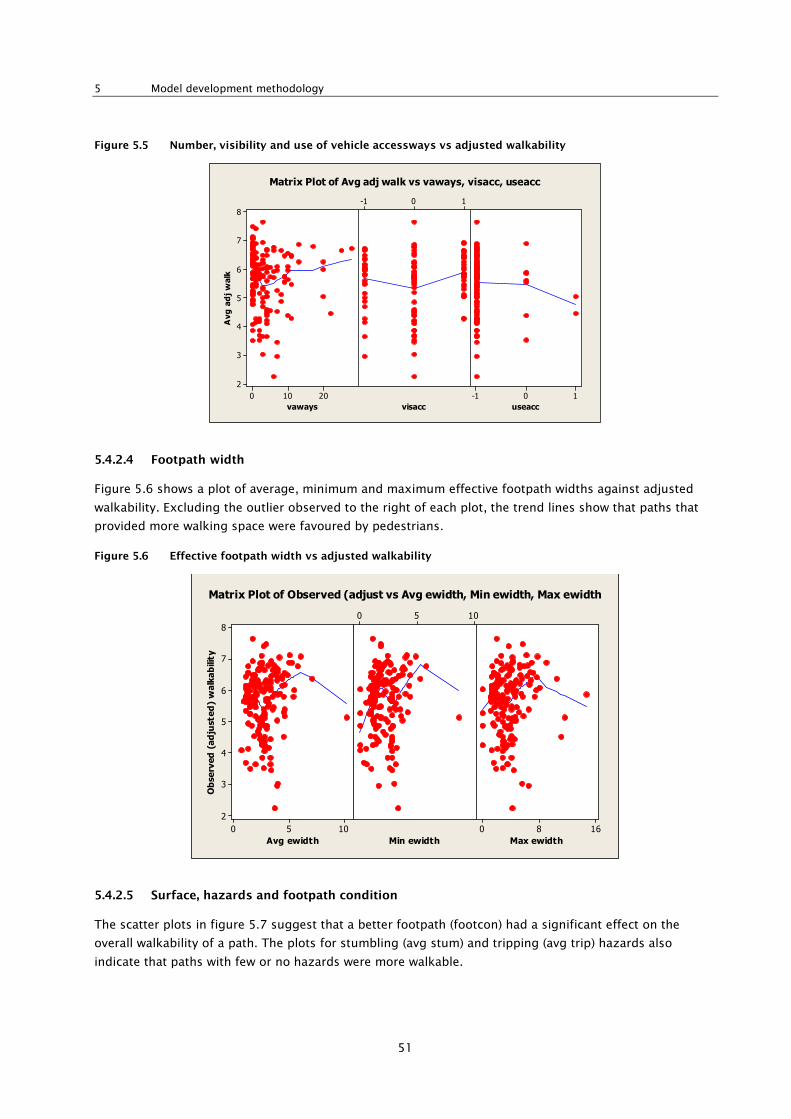
5 Model development methodology
51
Figure 5.5 Number, visibility and use of vehicle accessways vs adjusted walkability
vaways
Avg adj walk
20100
8
7
6
5
4
3
2
visacc
10-1
useacc
10-1
Matrix Plot of Avg adj walk vs vaways, visacc, useacc
5.4.2.4 Footpath width
Figure 5.6 shows a plot of average, minimum and maximum effective footpath widths against adjusted
walkability. Excluding the outlier observed to the right of each plot, the trend lines show that paths that
provided more walking space were favoured by pedestrians.
Figure 5.6 Effective footpath width vs adjusted walkability
Avg ewidth
Observed (adjusted) walkability
1050
8
7
6
5
4
3
2
Min ewidth
1050
Max ewidth
1680
Matrix Plot of Observed (adjust vs Avg ewidth, Min ewidth, Max ewidth
5.4.2.5 Surface, hazards and footpath condition
The scatter plots in figure 5.7 suggest that a better footpath (footcon) had a significant effect on the
overall walkability of a path. The plots for stumbling (avg stum) and tripping (avg trip) hazards also
indicate that paths with few or no hazards were more walkable.

Predicting walkability
52
Figure 5.7 Surface, hazards and footpath condition vs adjusted walkability
Surface
Avg adj walk
3.01.50.0
8
7
6
5
4
3
2
Avg stum
40200
Avg trip
160800
footcon
10-1
Matrix Plot of Avg adj walk vs Surface, Avg stum, Avg trip, footcon
5.4.2.6 Urban design and land use
The number of utilities (manyutil), comfort features (manycom) and the quantity of greenery (green) all
had positive effects on walkability. Path lengths located in parkland and residential land-use zones had
higher walkability ratings, while those in suburban shopping, commercial and industrial-type land zones
had lower ratings.
Figure 5.8 Number of utilities, number of comfort features, greenery and land-use types vs adjusted
walkability
manyutil
Avg adj walk
840
8
7
6
5
4
3
2
green
10-1
manycom
1050
Matrix Plot of Avg adj walk vs manyutil, green, manycom
5.4.2.7 Traffic
Figure 5.9 does not indicate a clear trend between road width (roadwid) and walkability. However, the plot
shows that a few paths that had a very wide road adjacent to them were associated with lower-than-
average walkability (adjusted) ratings.
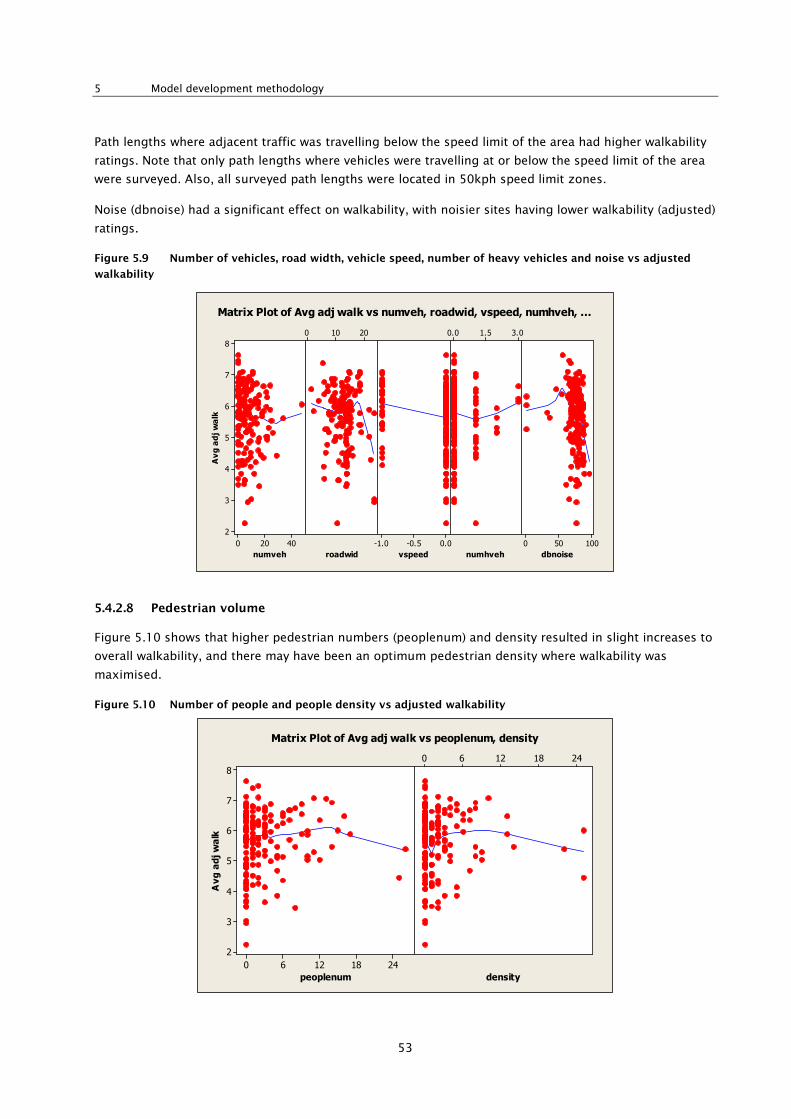
5 Model development methodology
53
Path lengths where adjacent traffic was travelling below the speed limit of the area had higher walkability
ratings. Note that only path lengths where vehicles were travelling at or below the speed limit of the area
were surveyed. Also, all surveyed path lengths were located in 50kph speed limit zones.
Noise (dbnoise) had a significant effect on walkability, with noisier sites having lower walkability (adjusted)
ratings.
Figure 5.9 Number of vehicles, road width, vehicle speed, number of heavy vehicles and noise vs adjusted
walkability
numveh
Avg adj walk
40200
8
7
6
5
4
3
2
roadwid
20100
vspeed
0.0-0.5-1.0
numhveh
3.01.50.0
dbnoise
100500
Matrix Plot of Avg adj walk vs numveh, roadwid, vspeed, numhveh, ...
5.4.2.8 Pedestrian volume
Figure 5.10 shows that higher pedestrian numbers (peoplenum) and density resulted in slight increases to
overall walkability, and there may have been an optimum pedestrian density where walkability was
maximised.
Figure 5.10 Number of people and people density vs adjusted walkability
peoplenum
Avg adj walk
24181260
8
7
6
5
4
3
2
density
24181260
Matrix Plot of Avg adj walk vs peoplenum, density
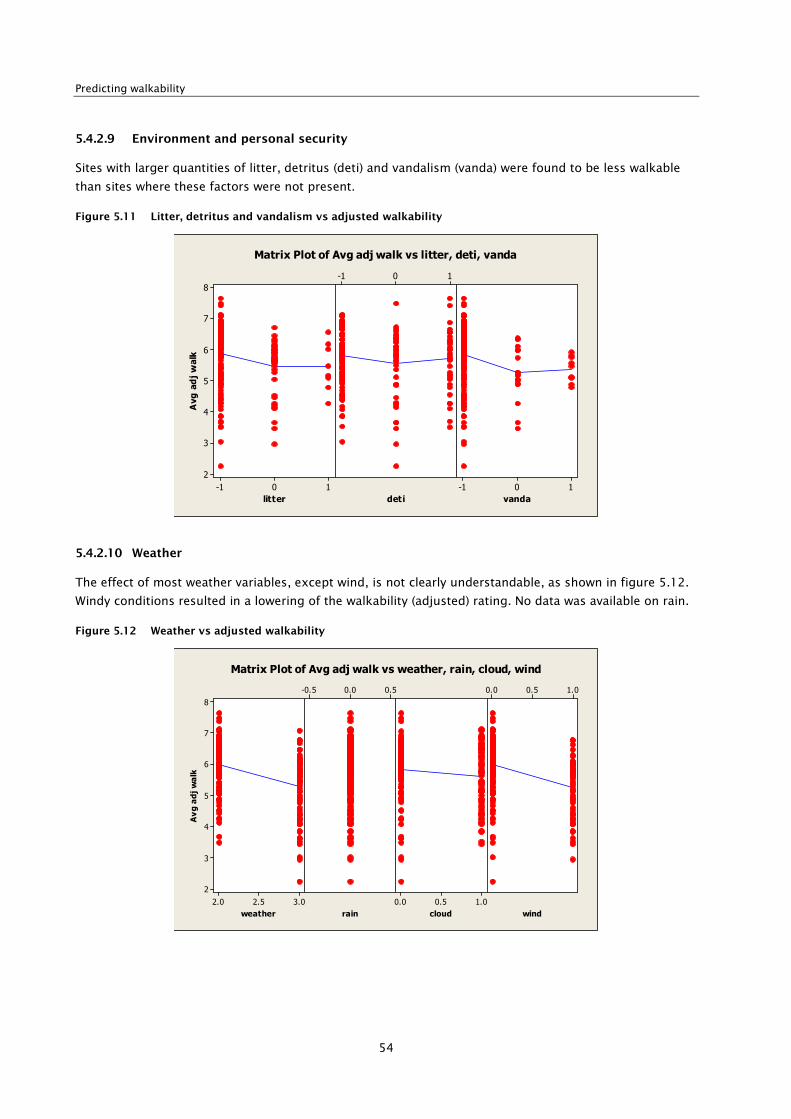
Predicting walkability
54
5.4.2.9 Environment and personal security
Sites with larger quantities of litter, detritus (deti) and vandalism (vanda) were found to be less walkable
than sites where these factors were not present.
Figure 5.11 Litter, detritus and vandalism vs adjusted walkability
litter
Avg adj walk
10-1
8
7
6
5
4
3
2
deti
10-1
vanda
10-1
Matrix Plot of Avg adj walk vs litter, deti, vanda
5.4.2.10 Weather
The effect of most weather variables, except wind, is not clearly understandable, as shown in figure 5.12.
Windy conditions resulted in a lowering of the walkability (adjusted) rating. No data was available on rain.
Figure 5.12 Weather vs adjusted walkability
weather
Avg adj walk
3.02.52.0
8
7
6
5
4
3
2
rain
0.50.0-0.5
cloud
1.00.50.0
wind
1.00.50.0
Matrix Plot of Avg adj walk vs weather, rain, cloud, wind

5 Model development methodology
55
5.4.2.11 On-street parking and shared paths
Figure 5.13 suggests that paths that were shared between multiple user types (eg cyclists and pedestrians)
were favourable for walking when conflicts with cyclist are low. The graph for use of on-street parking
(useosp) indicates a slight decrease in walkability at higher levels of parking.
Figure 5.13 On-street parking and shared path vs adjusted walkability
useosp
Avg adj walk
1.00.50.0-0.5-1.0
8
7
6
5
4
3
2
shared
1.000.750.500.250.00
Matrix Plot of Avg adj walk vs useosp, shared
5.4.3 Road-crossing variables
This section provides a breakdown of crossings, by type, in the sample set, along with scatter plots of the
road-crossing predictor variables against the average adjusted walkability rating for all participants on a
road-crossing section. Descriptions of variables used in the figures were provided earlier in table 5.3.
5.4.3.1 Crossing types
Out of the 137 road crossings that were included in the sample set, 86 were uncontrolled and 38 were
signalised. Only 13 of the 137 crossings were zebra crossings (see figure 5.14).
Figure 5.14 Number of crossings, by type
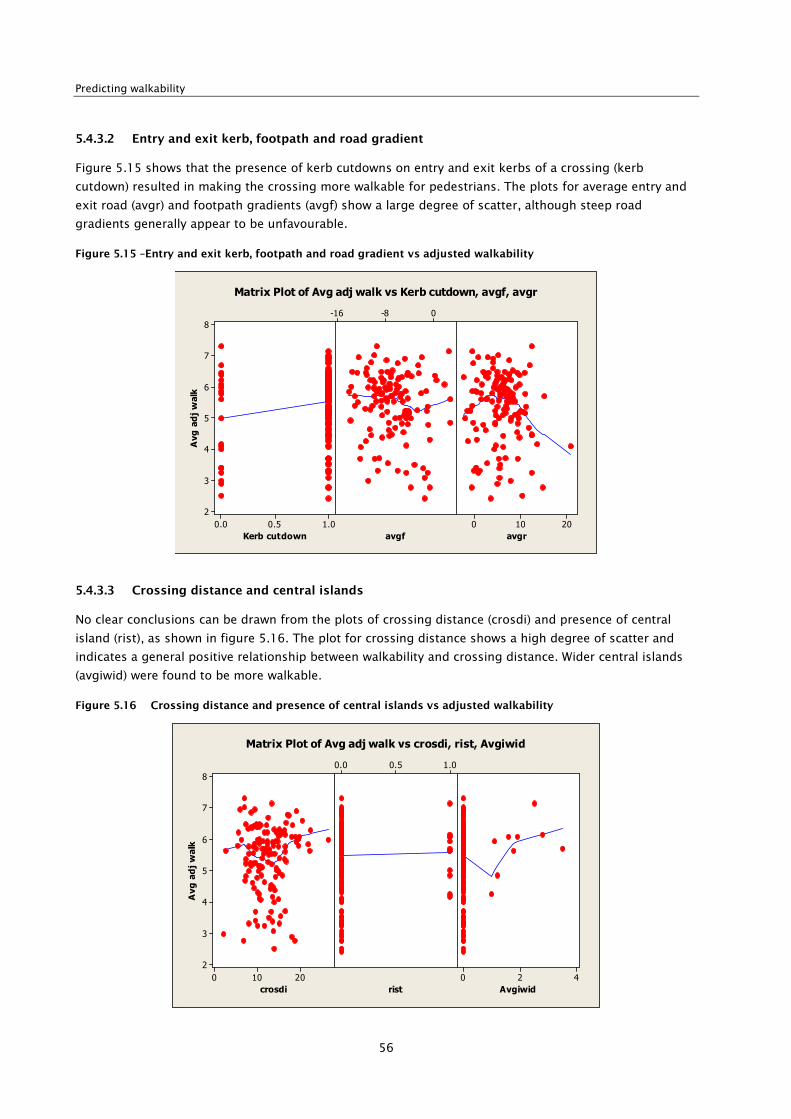
Predicting walkability
56
5.4.3.2 Entry and exit kerb, footpath and road gradient
Figure 5.15 shows that the presence of kerb cutdowns on entry and exit kerbs of a crossing (kerb
cutdown) resulted in making the crossing more walkable for pedestrians. The plots for average entry and
exit road (avgr) and footpath gradients (avgf) show a large degree of scatter, although steep road
gradients generally appear to be unfavourable.
Figure 5.15 –Entry and exit kerb, footpath and road gradient vs adjusted walkability
Kerb cutdown
Avg adj walk
1.00.50.0
8
7
6
5
4
3
2
avgf
0-8-16
avgr
20100
Matrix Plot of Avg adj walk vs Kerb cutdown, avgf, avgr
5.4.3.3 Crossing distance and central islands
No clear conclusions can be drawn from the plots of crossing distance (crosdi) and presence of central
island (rist), as shown in figure 5.16. The plot for crossing distance shows a high degree of scatter and
indicates a general positive relationship between walkability and crossing distance. Wider central islands
(avgiwid) were found to be more walkable.
Figure 5.16 Crossing distance and presence of central islands vs adjusted walkability
crosdi
Avg adj walk
20100
8
7
6
5
4
3
2
rist
1.00.50.0
Avgiwid
420
Matrix Plot of Avg adj walk vs crosdi, rist, Avgiwid

5 Model development methodology
57
5.4.3.4 Traffic
Limited traffic-volume data (traffic) was available for the road crossings in the sample set. Figure 5.17
indicates that noisy crossings with higher traffic volumes were, in general, less walkable. The walkability
of a crossing increased in environments where vehicle speeds were low. High visibility to oncoming traffic
(vis tra) also resulted in making the crossing safer, thus increasing walkability. The graphs for time taken
to cross, and delay, show mixed trends, with walkability initially decreasing with an increase in crossing
time, and showing little variation at intersections with higher crossing times.
Figure 5.17 Traffic volume, noise, vehicle speed, visibility to traffic, time taken to cross and delay vs adjusted
walkability
traffic
Avg adj walk
8004000
8
7
6
5
4
3
2
dbnoise
806040
vspeed
0.0-0.5-1.0
vis tra
10-1
Matrix Plot of Avg adj walk vs traffic, dbnoise, vspeed, vis tra
5.4.3.5 Pedestrian volume
Figure 5.18 indicates that walkability generally increased as the number of crossing pedestrians
(peoplenum) increased.
Figure 5.18 Pedestrian volume and people density vs adjusted walkability
peoplenum
Avg adj walk
6.04.53.01.50.0
8
7
6
5
4
3
2
density
4.83.62.41.20.0
Matrix Plot of Avg adj walk vs peoplenum, density

Predicting walkability
58
5.4.3.6 Crossing type
Figure 5.19 shows that uncontrolled crossings were generally rated to be less walkable than zebra
crossings and signalised crossings.
Figure 5.19 – Crossing type vs adjusted walkability
crossct
Avg adj walk
3.02.52.01.51.0
8
7
6
5
4
3
2
Matrix Plot of Avg adj walk vs crossct
5.4.3.7 Road condition, hazards and footpath condition
Figure 5.20 shows that improvements in road condition (rdcon) and footpath condition (footcon) led to
marked increases in walkability. Higher numbers of stumbling and tripping hazards were, in general, seen
to reduce the quality of the road crossing.
Figure 5.20 Road condition, stumbling hazards, tripping hazards and footpath condition vs adjusted
walkability
rdcon
Avg adj walk
10-1
8
7
6
5
4
3
2
Avg stum
20100
Avg trip
50250
footcon
10-1
Matrix Plot of Avg adj walk vs rdcon, Avg stum, Avg trip, footcon

5 Model development methodology
59
5.4.3.8 Number of cycle lanes to cross
No clear conclusion can be drawn from figure 5.21. Crossings where pedestrians were required to cross
one or more cycle lanes appeared to have similar walkability (adjusted) ratings.
Figure 5.21 Number of cycle lanes to cross vs adjusted walkability
croscyc
Avg adj walk
2.01.51.00.50.0
8
7
6
5
4
3
2
Matrix Plot of Avg adj walk vs croscyc
5.4.3.9 Comfort features, tactile aids and deviation
Most crossings had neither comfort features (manucom) installed nor required any deviation (ddl) from the
direct crossing paths of pedestrians. Tactile aids (tpva), when present, were generally found to result in a
higher walkability score.
Figure 5.22 Comfort features, tactile aids and deviation vs adjusted walkability
manucom
Avg adj walk
1050
8
7
6
5
4
3
2
tpva
1.00.50.0
ddl
1050
Matrix Plot of Avg adj walk vs manucom, tpva, ddl

Predicting walkability
60
5.4.3.10 Weather
Figure 5.23 shows that weather did not have a significant effect on the level of walkability of road
crossings.
Figure 5.23 Weather vs adjusted walkability
weather
Avg adj walk
3.02.52.0
8
7
6
5
4
3
2
cloud
1.00.50.0
wind
1.00.50.0
Matrix Plot of Avg adj walk vs weather, cloud, wind
5.4.3.11 Environment and personal security
Figure 5.24 indicates that higher quantities of litter had a detrimental effect on the walkability of road
crossings. Detritus (deti) and vandalism (vanda) do not appear to have had a significant effect on the
walkability (adjusted) values.
Figure 5.24 Litter, detritus and vandalism vs adjusted walkability
litter
Avg adj walk
0.0-0.5-1.0
8
7
6
5
4
3
2
deti
10-1
vanda
0.0-0.5-1.0
Matrix Plot of Avg adj walk vs litter, deti, vanda
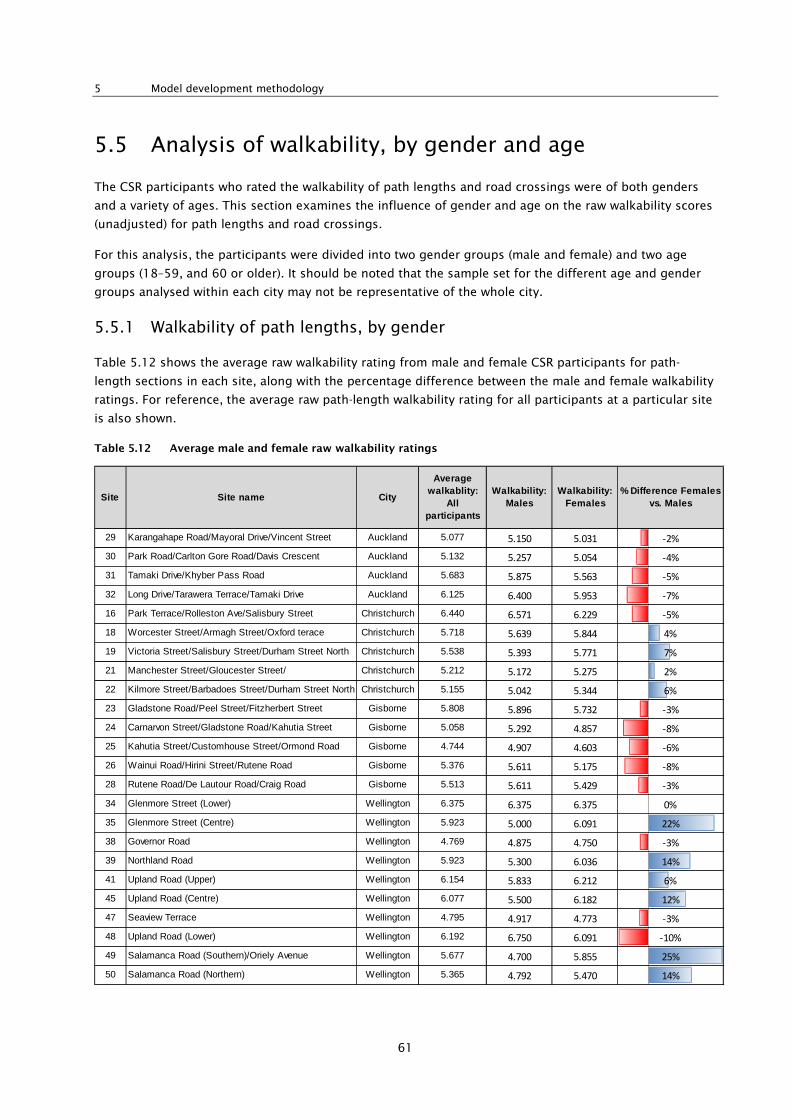
5 Model development methodology
61
5.5 Analysis of walkability, by gender and age
The CSR participants who rated the walkability of path lengths and road crossings were of both genders
and a variety of ages. This section examines the influence of gender and age on the raw walkability scores
(unadjusted) for path lengths and road crossings.
For this analysis, the participants were divided into two gender groups (male and female) and two age
groups (18–59, and 60 or older). It should be noted that the sample set for the different age and gender
groups analysed within each city may not be representative of the whole city.
5.5.1 Walkability of path lengths, by gender
Table 5.12 shows the average raw walkability rating from male and female CSR participants for path-
length sections in each site, along with the percentage difference between the male and female walkability
ratings. For reference, the average raw path-length walkability rating for all participants at a particular site
is also shown.
Table 5.12 Average male and female raw walkability ratings
Site Site name City
Average walkablity:
All participants
Walkability: Males
Walkability: Females
% Difference Females vs. Males
29 Karangahape Road/Mayoral Drive/Vincent Street Auckland 5.077 5.150 5.031 -2%
30 Park Road/Carlton Gore Road/Davis Crescent Auckland 5.132 5.257 5.054 -4%
31 Tamaki Drive/Khyber Pass Road Auckland 5.683 5.875 5.563 -5%
32 Long Drive/Tarawera Terrace/Tamaki Drive Auckland 6.125 6.400 5.953 -7%
16 Park Terrace/Rolleston Ave/Salisbury Street Christchurch 6.440 6.571 6.229 -5%
18 Worcester Street/Armagh Street/Oxford terace Christchurch 5.718 5.639 5.844 4%
19 Victoria Street/Salisbury Street/Durham Street North Christchurch 5.538 5.393 5.771 7%
21 Manchester Street/Gloucester Street/ Christchurch 5.212 5.172 5.275 2%
22 Kilmore Street/Barbadoes Street/Durham Street North Christchurch 5.155 5.042 5.344 6%
23 Gladstone Road/Peel Street/Fitzherbert Street Gisborne 5.808 5.896 5.732 -3%
24 Carnarvon Street/Gladstone Road/Kahutia Street Gisborne 5.058 5.292 4.857 -8%
25 Kahutia Street/Customhouse Street/Ormond Road Gisborne 4.744 4.907 4.603 -6%
26 Wainui Road/Hirini Street/Rutene Road Gisborne 5.376 5.611 5.175 -8%
28 Rutene Road/De Lautour Road/Craig Road Gisborne 5.513 5.611 5.429 -3%
34 Glenmore Street (Lower) Wellington 6.375 6.375 6.375 0%
35 Glenmore Street (Centre) Wellington 5.923 5.000 6.091 22%
38 Governor Road Wellington 4.769 4.875 4.750 -3%
39 Northland Road Wellington 5.923 5.300 6.036 14%
41 Upland Road (Upper) Wellington 6.154 5.833 6.212 6%
45 Upland Road (Centre) Wellington 6.077 5.500 6.182 12%
47 Seaview Terrace Wellington 4.795 4.917 4.773 -3%
48 Upland Road (Lower) Wellington 6.192 6.750 6.091 -10%
49 Salamanca Road (Southern)/Oriely Avenue Wellington 5.677 4.700 5.855 25%
50 Salamanca Road (Northern) Wellington 5.365 4.792 5.470 14%

Predicting walkability
62
Although the difference between the average male and female ratings for the Auckland, Gisborne and
Christchurch sites is less than 10%, a large proportion of the Wellington sites display a considerable
difference between the male and female ratings, with female CSR participants generally perceiving the
paths to be more walkable than their male counterparts.
Figure 5.25 shows the average male and female raw walkability ratings for path lengths, by city, and
compares them with the mean walkability of path lengths in that city.
Figure 5.25 Mean raw walkability of path lengths, by gender, for each city
Overall, Wellington had the highest mean walkability score for path lengths, followed by Christchurch and
Auckland. However, the average male walkability rating for the Wellington paths was the lowest out of all
four cities, while the average female rating was the highest. This may represent an outlier response from a
specific individual, and is not conclusive.
5.5.2 Walkability of path lengths, by age group
Table 5.13 shows the average raw walkability rating from CSR participants at each site, based on their age
group.
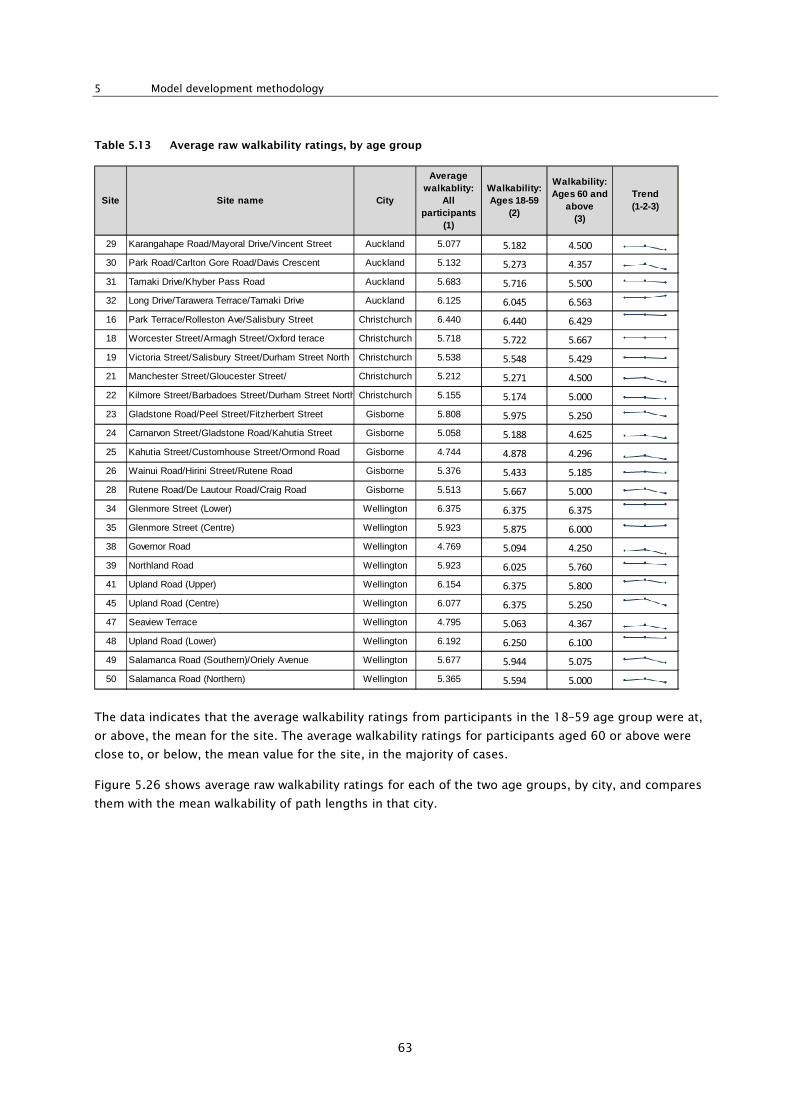
5 Model development methodology
63
Table 5.13 Average raw walkability ratings, by age group
The data indicates that the average walkability ratings from participants in the 18–59 age group were at,
or above, the mean for the site. The average walkability ratings for participants aged 60 or above were
close to, or below, the mean value for the site, in the majority of cases.
Figure 5.26 shows average raw walkability ratings for each of the two age groups, by city, and compares
them with the mean walkability of path lengths in that city.
Site Site name City
Average walkablity:
All participants
(1)
Walkability: Ages 18-59
(2)
Walkability: Ages 60 and
above (3)
Trend (1-2-3)
29 Karangahape Road/Mayoral Drive/Vincent Street Auckland 5.077 5.182 4.500
30 Park Road/Carlton Gore Road/Davis Crescent Auckland 5.132 5.273 4.357
31 Tamaki Drive/Khyber Pass Road Auckland 5.683 5.716 5.500
32 Long Drive/Tarawera Terrace/Tamaki Drive Auckland 6.125 6.045 6.563
16 Park Terrace/Rolleston Ave/Salisbury Street Christchurch 6.440 6.440 6.429
18 Worcester Street/Armagh Street/Oxford terace Christchurch 5.718 5.722 5.667
19 Victoria Street/Salisbury Street/Durham Street North Christchurch 5.538 5.548 5.429
21 Manchester Street/Gloucester Street/ Christchurch 5.212 5.271 4.500
22 Kilmore Street/Barbadoes Street/Durham Street North Christchurch 5.155 5.174 5.000
23 Gladstone Road/Peel Street/Fitzherbert Street Gisborne 5.808 5.975 5.250
24 Carnarvon Street/Gladstone Road/Kahutia Street Gisborne 5.058 5.188 4.625
25 Kahutia Street/Customhouse Street/Ormond Road Gisborne 4.744 4.878 4.296
26 Wainui Road/Hirini Street/Rutene Road Gisborne 5.376 5.433 5.185
28 Rutene Road/De Lautour Road/Craig Road Gisborne 5.513 5.667 5.000
34 Glenmore Street (Lower) Wellington 6.375 6.375 6.375
35 Glenmore Street (Centre) Wellington 5.923 5.875 6.000
38 Governor Road Wellington 4.769 5.094 4.250
39 Northland Road Wellington 5.923 6.025 5.760
41 Upland Road (Upper) Wellington 6.154 6.375 5.800
45 Upland Road (Centre) Wellington 6.077 6.375 5.250
47 Seaview Terrace Wellington 4.795 5.063 4.367
48 Upland Road (Lower) Wellington 6.192 6.250 6.100
49 Salamanca Road (Southern)/Oriely Avenue Wellington 5.677 5.944 5.075
50 Salamanca Road (Northern) Wellington 5.365 5.594 5.000
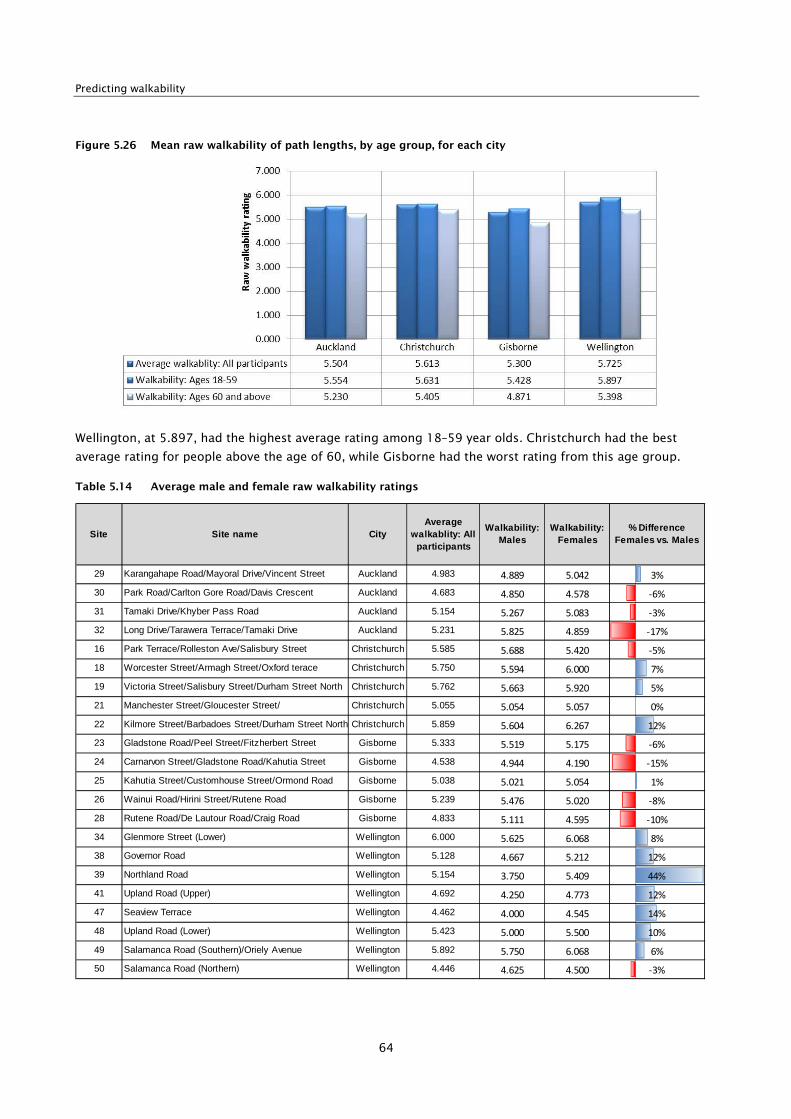
Predicting walkability
64
Figure 5.26 Mean raw walkability of path lengths, by age group, for each city
Wellington, at 5.897, had the highest average rating among 18–59 year olds. Christchurch had the best
average rating for people above the age of 60, while Gisborne had the worst rating from this age group.
Table 5.14 Average male and female raw walkability ratings
Site Site name CityAverage
walkablity: All participants
Walkability: Males
Walkability: Females
% Difference Females vs. Males
29 Karangahape Road/Mayoral Drive/Vincent Street Auckland 4.983 4.889 5.042 3%
30 Park Road/Carlton Gore Road/Davis Crescent Auckland 4.683 4.850 4.578 -6%
31 Tamaki Drive/Khyber Pass Road Auckland 5.154 5.267 5.083 -3%
32 Long Drive/Tarawera Terrace/Tamaki Drive Auckland 5.231 5.825 4.859 -17%
16 Park Terrace/Rolleston Ave/Salisbury Street Christchurch 5.585 5.688 5.420 -5%
18 Worcester Street/Armagh Street/Oxford terace Christchurch 5.750 5.594 6.000 7%
19 Victoria Street/Salisbury Street/Durham Street North Christchurch 5.762 5.663 5.920 5%
21 Manchester Street/Gloucester Street/ Christchurch 5.055 5.054 5.057 0%
22 Kilmore Street/Barbadoes Street/Durham Street North Christchurch 5.859 5.604 6.267 12%
23 Gladstone Road/Peel Street/Fitzherbert Street Gisborne 5.333 5.519 5.175 -6%
24 Carnarvon Street/Gladstone Road/Kahutia Street Gisborne 4.538 4.944 4.190 -15%
25 Kahutia Street/Customhouse Street/Ormond Road Gisborne 5.038 5.021 5.054 1%
26 Wainui Road/Hirini Street/Rutene Road Gisborne 5.239 5.476 5.020 -8%
28 Rutene Road/De Lautour Road/Craig Road Gisborne 4.833 5.111 4.595 -10%
34 Glenmore Street (Lower) Wellington 6.000 5.625 6.068 8%
38 Governor Road Wellington 5.128 4.667 5.212 12%
39 Northland Road Wellington 5.154 3.750 5.409 44%
41 Upland Road (Upper) Wellington 4.692 4.250 4.773 12%
47 Seaview Terrace Wellington 4.462 4.000 4.545 14%
48 Upland Road (Lower) Wellington 5.423 5.000 5.500 10%
49 Salamanca Road (Southern)/Oriely Avenue Wellington 5.892 5.750 6.068 6%
50 Salamanca Road (Northern) Wellington 4.446 4.625 4.500 -3%
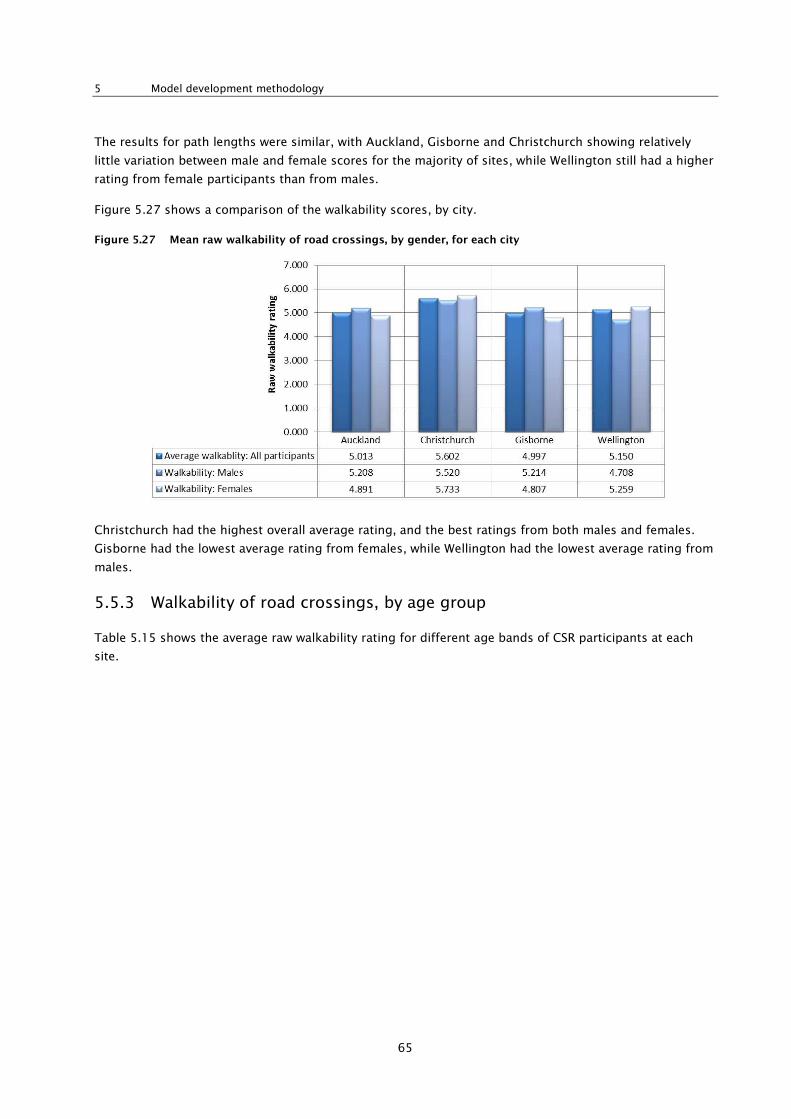
5 Model development methodology
65
The results for path lengths were similar, with Auckland, Gisborne and Christchurch showing relatively
little variation between male and female scores for the majority of sites, while Wellington still had a higher
rating from female participants than from males.
Figure 5.27 shows a comparison of the walkability scores, by city.
Figure 5.27 Mean raw walkability of road crossings, by gender, for each city
Christchurch had the highest overall average rating, and the best ratings from both males and females.
Gisborne had the lowest average rating from females, while Wellington had the lowest average rating from
males.
5.5.3 Walkability of road crossings, by age group
Table 5.15 shows the average raw walkability rating for different age bands of CSR participants at each
site.

Predicting walkability
66
Table 5.15 Average raw walkability ratings, by age group
The results shown in the table above indicate that most CSR participants in the 18–59 age bracket gave
walkability ratings at, or above, the mean walkability of the road crossing. The average walkability rating
from participants aged 60 or above was lower than the mean for the site, in most cases.
Figure 5.28 shows average raw walkability ratings for each of the three age groups, by city.
Site Site name City
Average walkablity:
All participants
(1)
Walkability: Ages 18-59
(2)
Walkability: Ages 60 and
above (3)
Trend (1-2-3)
29 Karangahape Road/Mayoral Drive/Vincent Street Auckland 4.983 5.202 3.778
30 Park Road/Carlton Gore Road/Davis Crescent Auckland 4.683 4.852 3.750
31 Tamaki Drive/Khyber Pass Road Auckland 5.154 5.293 4.389
32 Long Drive/Tarawera Terrace/Tamaki Drive Auckland 5.231 5.205 5.375
16 Park Terrace/Rolleston Ave/Salisbury Street Christchurch 5.585 5.742 3.700
18 Worcester Street/Armagh Street/Oxford terace Christchurch 5.750 5.906 3.875
19 Victoria Street/Salisbury Street/Durham Street North Christchurch 5.762 5.775 5.600
21 Manchester Street/Gloucester Street/ Christchurch 5.055 5.036 5.286
22 Kilmore Street/Barbadoes Street/Durham Street North Christchurch 5.859 5.875 5.667
23 Gladstone Road/Peel Street/Fitzherbert Street Gisborne 5.333 5.444 4.963
24 Carnarvon Street/Gladstone Road/Kahutia Street Gisborne 4.538 4.811 3.630
25 Kahutia Street/Customhouse Street/Ormond Road Gisborne 5.038 5.225 4.417
26 Wainui Road/Hirini Street/Rutene Road Gisborne 5.239 5.457 4.476
28 Rutene Road/De Lautour Road/Craig Road Gisborne 4.833 5.200 3.611
34 Glenmore Street (Lower) Wellington 6.000 6.344 5.450
38 Governor Road Wellington 5.128 5.417 4.667
39 Northland Road Wellington 5.154 5.438 4.700
41 Upland Road (Upper) Wellington 4.692 4.688 4.700
47 Seaview Terrace Wellington 4.462 4.625 4.200
48 Upland Road (Lower) Wellington 5.423 5.813 4.800
49 Salamanca Road (Southern)/Oriely Avenue Wellington 5.892 5.889 6.313
50 Salamanca Road (Northern) Wellington 4.446 4.500 4.550
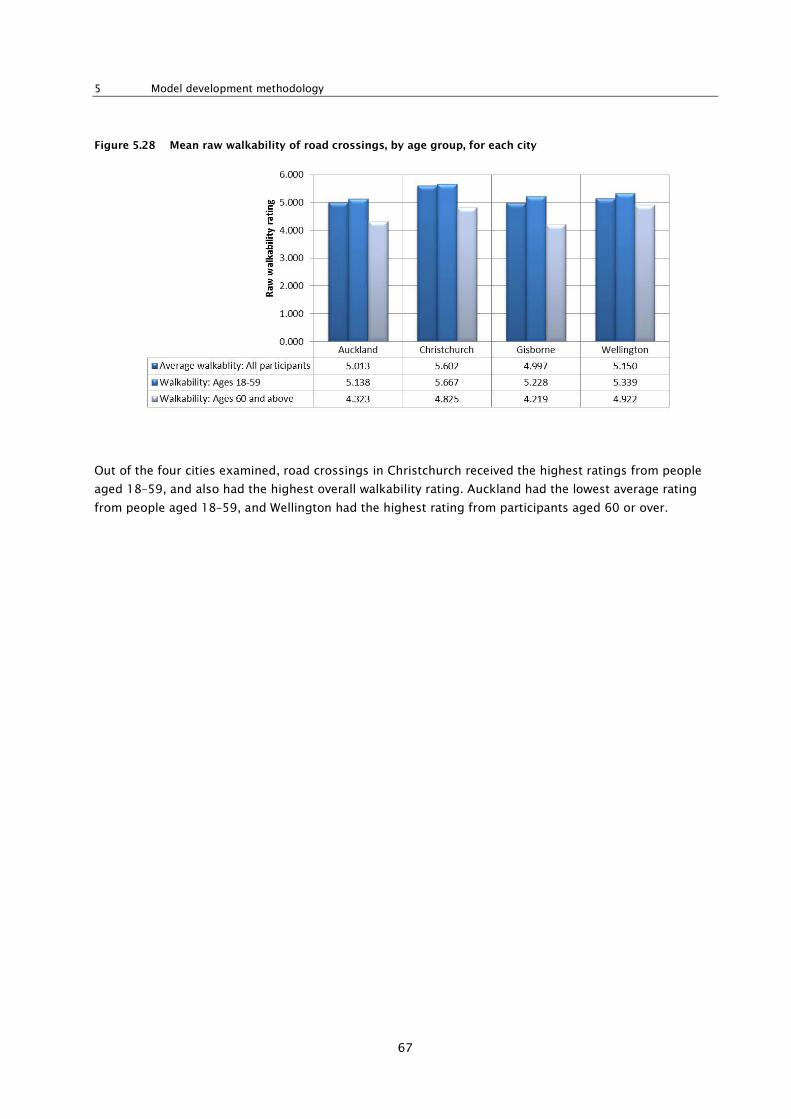
5 Model development methodology
67
Figure 5.28 Mean raw walkability of road crossings, by age group, for each city
Out of the four cities examined, road crossings in Christchurch received the highest ratings from people
aged 18–59, and also had the highest overall walkability rating. Auckland had the lowest average rating
from people aged 18–59, and Wellington had the highest rating from participants aged 60 or over.

Predicting walkability
68
6 Prediction models
6.1 Mathematical approach
Minitab was used to conduct linear regression modelling using a stepwise forward and backward
substitution approach. The average adjusted walkability for each section (ie path length or road crossing)
for each site was chosen as the response variable, and all other selected variables were added as predictor
variables while conducting the modelling exercise. The alpha (α) value for addition and elimination of
variables was set to 0.05, to enable only those variables that had a reasonable ‘fit’ to be included in the
model. The stepped results of the forward and backwards approach are shown in appendix E.
6.1.1 Predictor variables
The predictor variables for path lengths and road crossings that were identified in section 5 formed the
basis for the testing of variables during the model development process. Initial analysis resulted in a set of
best-performing variables that were subsequently shortlisted for further testing.
All possible variables for which data was collected, and which were not included in the original list of
variables identified in tables 6.1 and 6.2 (following), were tested at this stage to determine any variables
that could have a significant influence on walkability but had been overlooked earlier.
6.1.2 Models developed
The following categories of models were developed for path lengths and road crossings:
• Overall models – These are the main models that take into account the full sample set of sites and
variables available for both path lengths and crossings, and describe the best variables for predicting
the walkability of each. These models are recommended for practitioner use.
• Age-group models – Models for predicting the walkability of path lengths and road crossings were
also built for CSR survey participants belonging to different age groups. Survey participants were
classified into the groups ‘Young adult and mature adults (aged 18–59)’ and ‘Elderly (aged 60+)’.
Additional testing was undertaken by further dividing the ‘young and mature adults’ group into those
aged 18–29 and 30–59. However, the results from these subgroups did not show significant variation
between the model coefficients, so the grouping reverted to the 18–59 age bracket.
• Environment-variable models – CSR participants were asked to rate certain environment variables
(see table 6.1) in addition to the overall walkability of a section. These variables were separately
adjusted on the basis of the rating of the common participant, and used as response variables after
being averaged across each section and site to develop prediction models for the respective
environment variable.
Table 6.1 Environment-variable models
Path lengths Road crossings
• Safe from falling
• Pleasant
• Safe from traffic
• Lower waiting time

6 Prediction models
69
Figure 6.1 provides a summary illustration of the various model types for path lengths and road crossings.
In addition to the model categories described earlier, models for the different genders of CSR participants
were also built. However, because there was no significant variability between the coefficients of the male
and female participant models, these were not included in the final set of published models.
Figure 6.1 Walkability models
6.2 Path-length models
The final set of selected variables identified in section 5.4.2 was utilised for generating the final model for
predicting the walkability of path lengths. The analysis resulted in the following overall preferred
mathematical model.
WalkabilityPL = 4.426 + 0.561 footcon + 0.300 green - 0.378 vspeed + 0.294 comfort - 0.464 devi + 0.415 pa+res + 0.170 min ewidth - 0.186 numhide - 0.0034 Avg stepav + 0.201 dese (Equation 6.1)
Note: The above equation has been normalised to an ambient temperature of 22oC and non-windy
conditions. Windy conditions are found to reduce the walkability rating by 0.54, while an increase or
decrease of temperature of 1oC leads to a positive and negative change in the walkability rating of 0.065
respectively.
The descriptions and possible values of the variables in the model are shown in table 6.2.

Predicting walkability
70
Table 6.2 Path length model variable descriptions
Variable Description Possible values
footcon Footpath condition
Poor footpath condition = -1
Average footpath condition = 0
Good footpath condition = +1
green Quantity of greenery
Little or no greenery = -1
Moderate greenery = 0
Significant greenery = +1
comfort Presence of comfort features Comfort features not present = 0
Comfort features present = 1
devi Deviation around obstacles
Little or no deviation = -1
Small amount of deviation = 0
Significant deviation = +1
min ewidth Minimum path effective width In metres
vspeed Vehicle speed
Below speed limit = -1
At speed limit = 0
Above speed limit = +1
avg stepav Average step height In millimetres
dese Design effort
Not designed/very low design effort = -1
Low to medium design effort = 0
High to very high design effort = +1
numhide Number of hiding places Number of hiding places along the path
pa+res Parkland or residential land use Parkland or residential = 1
Other land use = 0
The R2 value of the path lengths model was found to be 0.59. Figure 6.2 depicts a scatter plot of the
observed values of walkability (adjusted for variation on the basis of the common survey participant)
against the modelled values as predicted by the model.
Figure 6.2 Scatter plot of observed vs modelled walkability

6 Prediction models
71
Figure 6.3 shows residual plots for the path-length model.
Figure 6.3 Residual plots: path-length model
The model shows that footpath condition, quantity of greenery, presence of comfort features, vehicle
speed, land use (parkland or residential) and deviation around obstacles are the major factors that affect
the walkability of a path. Improvements in the condition of the footpath and the presence of more trees
and comfort features are likely to have a significant positive effect on the walkability of a path. A higher
speed of vehicles on the adjacent road segment, and presence of obstacles (leading to greater deviation in
the travelled path), is likely to significantly reduce its walkability.
Land use is another factor identified in the model. The coefficient of 0.415 for parkland/residential land
use suggests that paths in parkland or residential areas are more walkable than those in industrial areas.
Because of the perceived personal security risks associated with the number of hiding places and amount
of detritus on the path, these factors also affect its walkability, although not to the same degree as
deviation around obstacles and vehicle speed.
The minimum effective width along the path has a positive relationship with walkability, as seen in the
coefficient of 0.17. This suggests that wider paths are, in general, rated to be more walkable, but the
walkability rating of a path is affected more by the presence of obstacles leading to the path being narrow,
rather than by the average or maximum widths of the path.
Higher design effort – ie the presence of functional streetscaping items and the absence of steps along the
path – also improve its walkability rating.
Table 6.3 shows model results for the two age-group models, for path lengths.
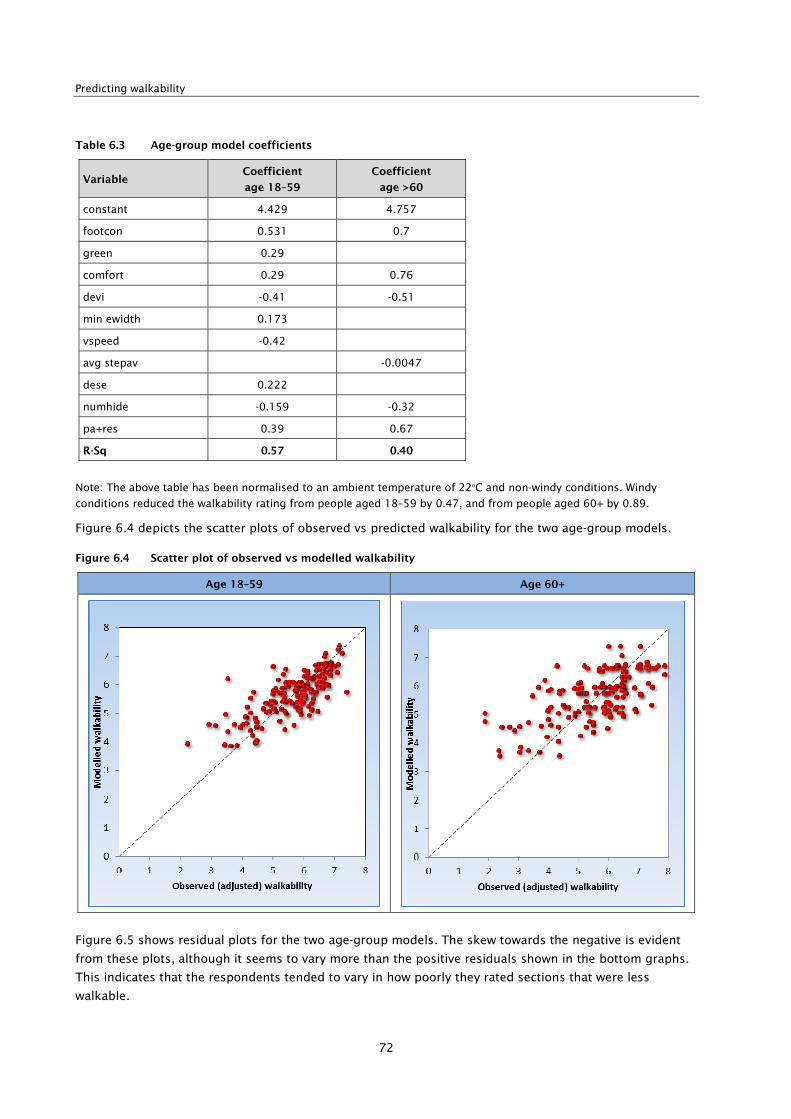
Predicting walkability
72
Table 6.3 Age-group model coefficients
Variable Coefficient
age 18–59
Coefficient
age >60
constant 4.429 4.757
footcon 0.531 0.7
green 0.29
comfort 0.29 0.76
devi -0.41 -0.51
min ewidth 0.173
vspeed -0.42
avg stepav -0.0047
dese 0.222
numhide -0.159 -0.32
pa+res 0.39 0.67
R-Sq 0.57 0.40
Note: The above table has been normalised to an ambient temperature of 22oC and non-windy conditions. Windy
conditions reduced the walkability rating from people aged 18–59 by 0.47, and from people aged 60+ by 0.89.
Figure 6.4 depicts the scatter plots of observed vs predicted walkability for the two age-group models.
Figure 6.4 Scatter plot of observed vs modelled walkability
Age 18–59 Age 60+
Figure 6.5 shows residual plots for the two age-group models. The skew towards the negative is evident
from these plots, although it seems to vary more than the positive residuals shown in the bottom graphs.
This indicates that the respondents tended to vary in how poorly they rated sections that were less
walkable.

6 Prediction models
73
Figure 6.5 Residual plots – age-group models
Age 18–59 Age 60+
The R2 value of the model for people aged 30–59 was 0.57, which indicates a well-fitting model. The R
2
value for people aged 60+ was 0.40, which represents an average level of fit between predicted and actual
values of walkability.
Once again, the importance of footpath condition, presence of comfort features, land use
(parkland/residential), number of hiding places, and level of deviation, stands out. The age-group models
also indicate that greenery, vehicle speed, design effort and minimum effective width along the path had
an influence on the walkability rating from young and mature adults, but not that from elderly
participants. However, the walkability ratings from the elderly participants were influenced by the average
combined height of steps along the path.
6.3 Environment-variable models
Models were developed for predicting the ‘safe from falling’ and ‘pleasant’ nature of path lengths. Table
6.4 lists the coefficients for the environment-variable models.

Predicting walkability
74
Table 6.4 Environment-variable model coefficients
Variable Safe from falling Pleasant
constant 5.761 2.775
footcon 0.537 0.47
green 0.547
comfort 0.46
devi -0.23 -0.41
min ewidth 0.248
vspeed -0.66
avg stepav -0.005
dese 0.27 0.38
numhide -0.174
pa+res
R-Sq 0.36 0.54
Note: The above table has been normalised to an ambient temperature of 22oC and non-windy conditions. Windy
conditions reduced the ‘pleasant’ rating by 0.57, while wind did not have an effect on the ‘safe from falling’ rating.
Figure 6.6 shows plots of observed vs predicted walkability for the categories ‘safe from falling’ and
‘pleasant’.
Figure 6.6 Scatter plot of observed vs modelled walkability
Safe from falling Pleasant
Figure 6.7 shows residual plots for environment-variable models. A large amount of variation is seen in
the residual plot for ‘pleasant’, indicating that respondents tended to differ in their perceptions of the
pleasantness of a given section.

6 Prediction models
75
Figure 6.7 Residual plots – environment-variable models
Safe from falling Pleasant
The model for ‘pleasant’ displays a moderate R2 value of 0.54. However, the R
2 value of the ‘safe from
falling’ model is quite low at 0.36.
The models for pleasantness of environment show that a well-maintained footpath, abundance of trees
and comfort facilities, reduced deviation of path, wider path, and low speed of vehicles on the adjacent
section of road all result in making a path more pleasant for pedestrians. Land-use classification, step
height and number of hiding places were not found to be significant influences in this model.
Although it is hard to draw conclusions from the ‘safe from falling model’ because of the low R2 value, the
model does suggest that footpath condition is one of the most important factors affecting the risk of
falling on a path. The amount of deviation, step height along the path and number of hiding places
negatively affected the ‘safe from falling’ rating.
6.3.1 Summary: path-length models
Table 6.5 lists the various models developed for path lengths, along with variable coefficients and model
R2 values.
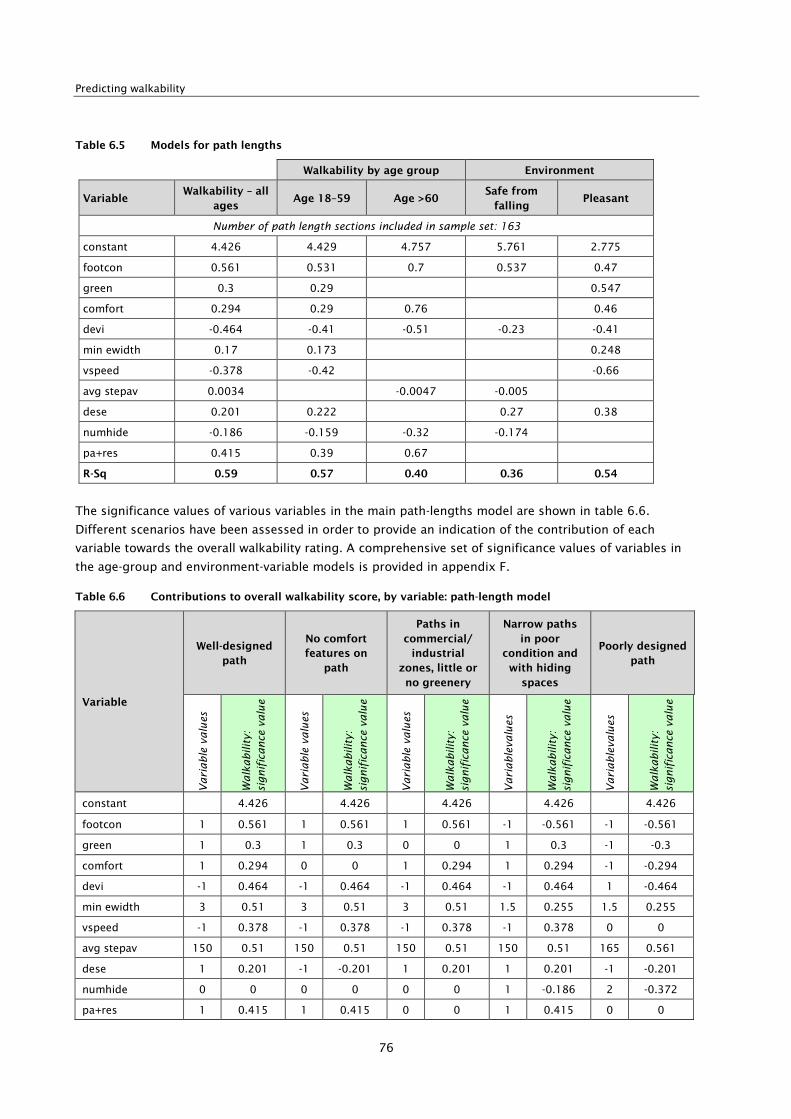
Predicting walkability
76
Table 6.5 Models for path lengths
Walkability by age group Environment
Variable Walkability – all
ages Age 18–59 Age >60
Safe from
falling Pleasant
Number of path length sections included in sample set: 163
constant 4.426 4.429 4.757 5.761 2.775
footcon 0.561 0.531 0.7 0.537 0.47
green 0.3 0.29 0.547
comfort 0.294 0.29 0.76 0.46
devi -0.464 -0.41 -0.51 -0.23 -0.41
min ewidth 0.17 0.173 0.248
vspeed -0.378 -0.42 -0.66
avg stepav 0.0034 -0.0047 -0.005
dese 0.201 0.222 0.27 0.38
numhide -0.186 -0.159 -0.32 -0.174
pa+res 0.415 0.39 0.67
R-Sq 0.59 0.57 0.40 0.36 0.54
The significance values of various variables in the main path-lengths model are shown in table 6.6.
Different scenarios have been assessed in order to provide an indication of the contribution of each
variable towards the overall walkability rating. A comprehensive set of significance values of variables in
the age-group and environment-variable models is provided in appendix F.
Table 6.6 Contributions to overall walkability score, by variable: path-length model
Variable
Well-designed
path
No comfort
features on
path
Paths in
commercial/
industrial
zones, little or
no greenery
Narrow paths
in poor
condition and
with hiding
spaces
Poorly designed
path
Variable values
Walkability:
significance value
Variable values
Walkability:
significance value
Variable values
Walkability:
significance value
Variablevalues
Walkability:
significance value
Variablevalues
Walkability:
significance value
constant 4.426 4.426 4.426 4.426 4.426
footcon 1 0.561 1 0.561 1 0.561 -1 -0.561 -1 -0.561
green 1 0.3 1 0.3 0 0 1 0.3 -1 -0.3
comfort 1 0.294 0 0 1 0.294 1 0.294 -1 -0.294
devi -1 0.464 -1 0.464 -1 0.464 -1 0.464 1 -0.464
min ewidth 3 0.51 3 0.51 3 0.51 1.5 0.255 1.5 0.255
vspeed -1 0.378 -1 0.378 -1 0.378 -1 0.378 0 0
avg stepav 150 0.51 150 0.51 150 0.51 150 0.51 165 0.561
dese 1 0.201 -1 -0.201 1 0.201 1 0.201 -1 -0.201
numhide 0 0 0 0 0 0 1 -0.186 2 -0.372
pa+res 1 0.415 1 0.415 0 0 1 0.415 0 0
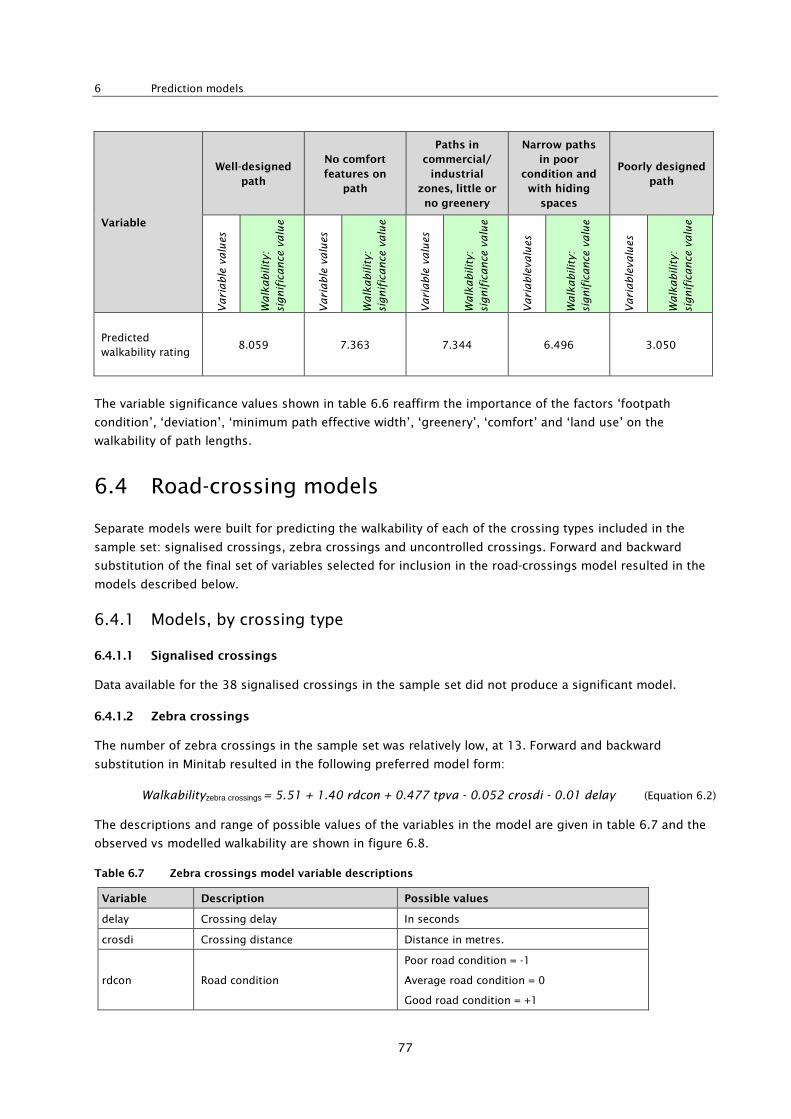
6 Prediction models
77
Variable
Well-designed
path
No comfort
features on
path
Paths in
commercial/
industrial
zones, little or
no greenery
Narrow paths
in poor
condition and
with hiding
spaces
Poorly designed
path
Variable values
Walkability:
significance value
Variable values
Walkability:
significance value
Variable values
Walkability:
significance value
Variablevalues
Walkability:
significance value
Variablevalues
Walkability:
significance value
Predicted
walkability rating 8.059 7.363 7.344 6.496 3.050
The variable significance values shown in table 6.6 reaffirm the importance of the factors ‘footpath
condition’, ‘deviation’, ‘minimum path effective width’, ‘greenery’, ‘comfort’ and ‘land use’ on the
walkability of path lengths.
6.4 Road-crossing models
Separate models were built for predicting the walkability of each of the crossing types included in the
sample set: signalised crossings, zebra crossings and uncontrolled crossings. Forward and backward
substitution of the final set of variables selected for inclusion in the road-crossings model resulted in the
models described below.
6.4.1 Models, by crossing type
6.4.1.1 Signalised crossings
Data available for the 38 signalised crossings in the sample set did not produce a significant model.
6.4.1.2 Zebra crossings
The number of zebra crossings in the sample set was relatively low, at 13. Forward and backward
substitution in Minitab resulted in the following preferred model form:
Walkabilityzebra crossings = 5.51 + 1.40 rdcon + 0.477 tpva - 0.052 crosdi - 0.01 delay (Equation 6.2)
The descriptions and range of possible values of the variables in the model are given in table 6.7 and the
observed vs modelled walkability are shown in figure 6.8.
Table 6.7 Zebra crossings model variable descriptions
Variable Description Possible values
delay Crossing delay In seconds
crosdi Crossing distance Distance in metres.
rdcon Road condition
Poor road condition = -1
Average road condition = 0
Good road condition = +1
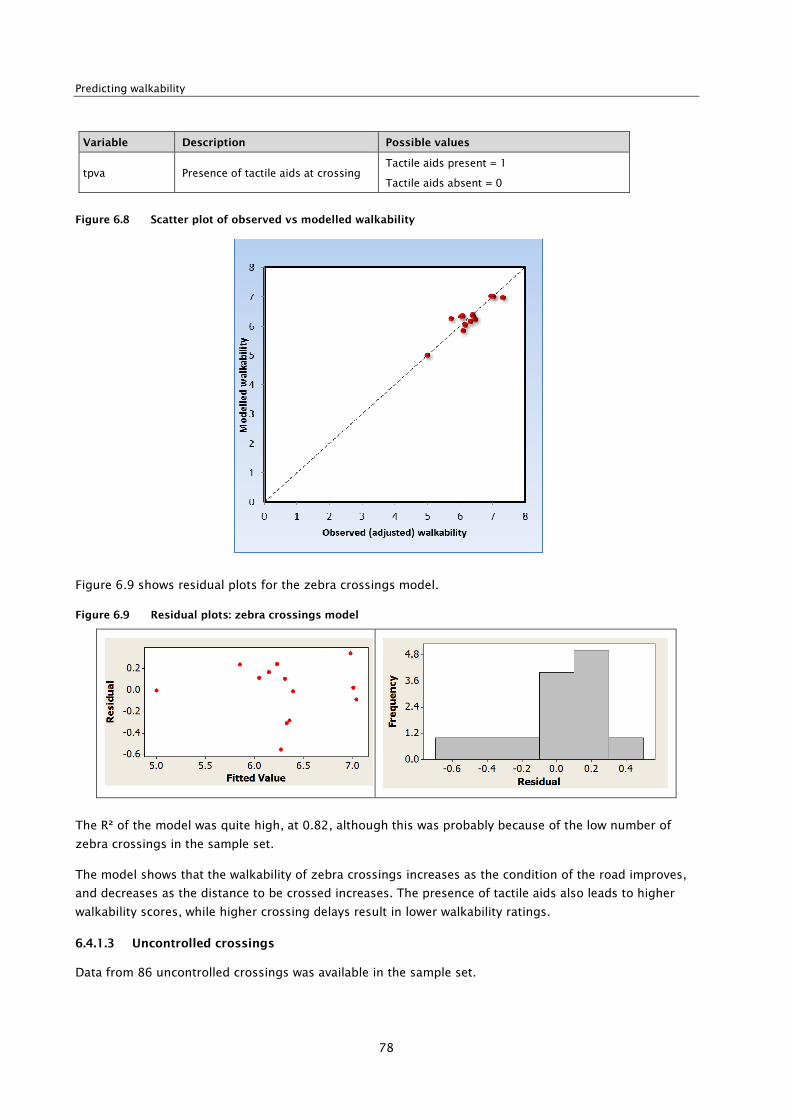
Predicting walkability
78
Variable Description Possible values
tpva Presence of tactile aids at crossing Tactile aids present = 1
Tactile aids absent = 0
Figure 6.8 Scatter plot of observed vs modelled walkability
Figure 6.9 shows residual plots for the zebra crossings model.
Figure 6.9 Residual plots: zebra crossings model
The R² of the model was quite high, at 0.82, although this was probably because of the low number of
zebra crossings in the sample set.
The model shows that the walkability of zebra crossings increases as the condition of the road improves,
and decreases as the distance to be crossed increases. The presence of tactile aids also leads to higher
walkability scores, while higher crossing delays result in lower walkability ratings.
6.4.1.3 Uncontrolled crossings
Data from 86 uncontrolled crossings was available in the sample set.
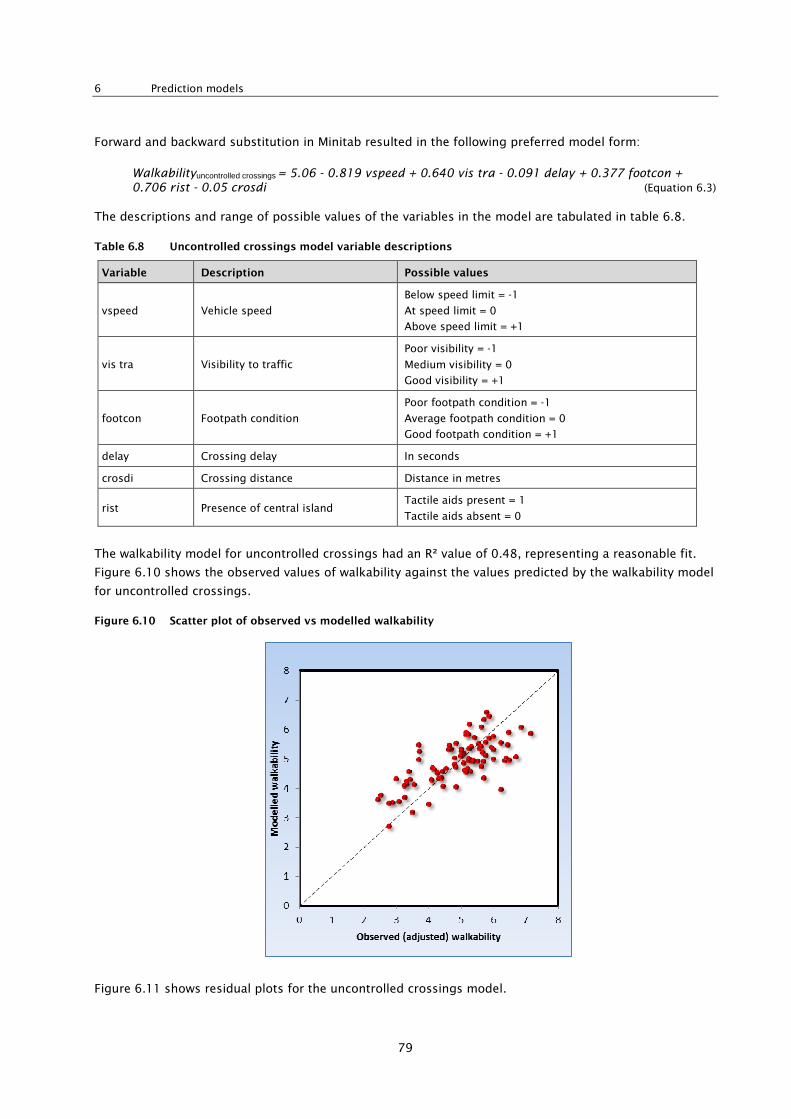
6 Prediction models
79
Forward and backward substitution in Minitab resulted in the following preferred model form:
Walkabilityuncontrolled crossings = 5.06 - 0.819 vspeed + 0.640 vis tra - 0.091 delay + 0.377 footcon + 0.706 rist - 0.05 crosdi (Equation 6.3)
The descriptions and range of possible values of the variables in the model are tabulated in table 6.8.
Table 6.8 Uncontrolled crossings model variable descriptions
Variable Description Possible values
vspeed Vehicle speed
Below speed limit = -1
At speed limit = 0
Above speed limit = +1
vis tra Visibility to traffic
Poor visibility = -1
Medium visibility = 0
Good visibility = +1
footcon Footpath condition
Poor footpath condition = -1
Average footpath condition = 0
Good footpath condition = +1
delay Crossing delay In seconds
crosdi Crossing distance Distance in metres
rist Presence of central island Tactile aids present = 1
Tactile aids absent = 0
The walkability model for uncontrolled crossings had an R² value of 0.48, representing a reasonable fit.
Figure 6.10 shows the observed values of walkability against the values predicted by the walkability model
for uncontrolled crossings.
Figure 6.10 Scatter plot of observed vs modelled walkability
Figure 6.11 shows residual plots for the uncontrolled crossings model.

Predicting walkability
80
Figure 6.11 Residual plots: uncontrolled crossings model
The model shows that vehicle speed, visibility to traffic, footpath condition and presence of a central
island are the most important factors influencing the walkability of uncontrolled crossings. Large delays
experienced while crossing, and wider crossings with larger crossing distances, have a negative effect on
the path length’s walkability.
6.4.2 Summary: road-crossing models
Table 6.9 lists the various models developed for road crossings, along with the coefficients of various
variables and model R² values.
Table 6.9 Models for road crossings
Walkability, by crossing type
Signalised Zebra Uncontrolled
Sample set
(sections) 38 13 86
constant
No
sig
nif
ican
tly c
on
verg
ing
mo
del
5.51 5.06
vspeed -0.819
vis tra 0.64
footcon 0.377
delay -0.01 -0.091
crosdi -0.052 -0.05
rdcon 1.4
tpva 0.477
rist 0.706
R-Sq 0.82 0.48
The significance values of various variables in the zebra crossing and uncontrolled crossing models are
shown in table 6.10. Different scenarios were assessed to provide an indication of the contribution of each
variable towards the overall walkability rating. A comprehensive set of significance values of variables in
the age-group and environment-variable models is provided in appendix F.

6 Prediction models
81
Table 6.10 Contributions to overall walkability score, by variable: zebra crossing and uncontrolled crossing
models
Variable
Zebra
crossing:
generic
Larger zebra
crossing with
increased
delaya
Zebra
crossing on
poorly
maintained
road with no
tactiles
Uncontrolled
crossing:
with refuge
Larger
uncontrolled
crossing with
higher
vehicle
speeds &
increased
delay
Uncontrolled
crossing with
poorly
maintained
footpath & no
central island
Variable values
Walkability:
significance value
Variable values
Walkability:
significance value
Variable values
Walkability:
significance value
Variable values
Walkability:
significance value
Variable values
Walkability:
significance value
Variable values
Walkability:
significance value
constant 5.510 5.510 5.510 5.060 5.060 5.060
vspeed -1 0.819 0 0 -1 0.819
vis tra 1 0.64 1 0.64 1 0.64
footcon 1 0.377 1 0.377 -1 -0.377
delay 5 -0.05 10 -0.1 5 -0.05 20 -1.82 30 -2.73 20 -1.82
crosdi 10 -0.52 15 -0.78 10 -0.52 10 -0.5 15 -0.75 10 -0.5
rdcon 1 1.4 1 1.4 -1 -1.4
tpva 1 0.477 1 0.477 0 0
rist 1 0.706 1 0.706 0 0
Predicted
walkability
rating
6.667 6.307 3.390 5.282 3.303 3.822
a) Note: Zebra crossings with high traffic flows can subject pedestrians to large delays as pedestrians confirm
motorists will yield and allow them to cross. In these situations a zebra crossing may not be the most appropriate
crossing facility.
The variable significance values shown in the above table reaffirm the importance of the factors ‘road
condition’, ‘delay’, ‘crossing distance’, ‘central island’, and ‘presence of tactiles’ on the walkability of road
crossings.

Predicting walkability
82
7 Discussion
While every journey, no matter how big or small, starts and ends with a single step, walking is often the
forgotten mode of transport. Other modes, especially the private motor vehicle, have a high degree of
measurability because they have already had significant study. This research fills some of the knowledge
gap regarding walking, and provides practitioners with a technique for quantifying the quality of the
pedestrian environment in a similar way to that which already exists for other modes of travel.
This research project combined the methodology for collecting people’s perceptions of the walking
environment that is outlined in the NZTA’s Guide to undertaking community street reviews (2010), with
the method for systematically collecting physical and operational variables that is outlined in Walkability
research tools – variables collection methodology (Abley 2006). These publications and other background
material can be found at www.levelofservice.com.
A number of surveys of the physical and operational characteristics of the street environment around New
Zealand were undertaken, and those measurements were correlated with how people felt about those
environments in terms of safety, pleasantness and other variables. The research then derived a number of
predictive mathematical formulas that enabled the qualitative perception of the quality of the street
environment to be calculated using quantitative measurements.
7.1 Use of the prediction models
Linear regression models for predicting walkability were developed for path lengths and road crossings.
Separate models were also built for young/middle-aged and elderly participants, and for predicting
environment variables for path lengths such as ‘safe from falling’ and ‘pleasant’.
7.1.1 Understanding the modelled walkability rating
Figure 7.1 depicts the rating scale used in the NZTA publication to rate the walkability of a site in the CSR
(2010), along with the implied LOS categories.
Figure 7.1 Community street review – level of service (NZTA 2010)
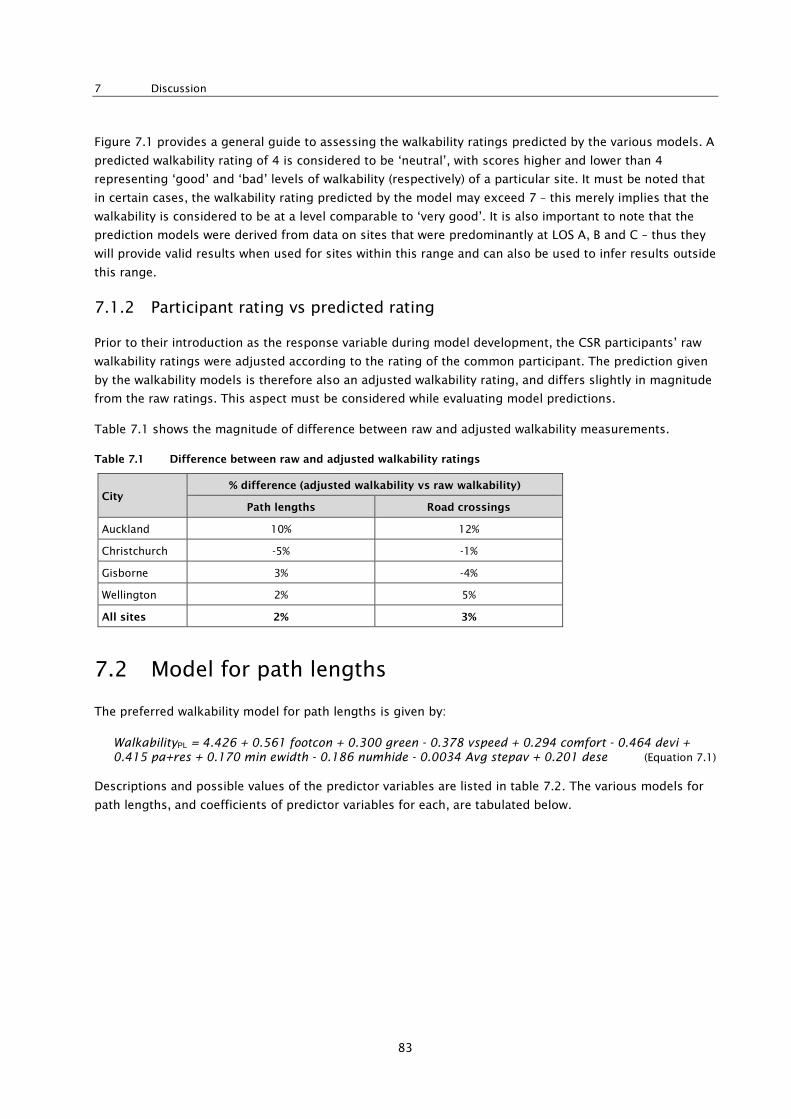
7 Discussion
83
Figure 7.1 provides a general guide to assessing the walkability ratings predicted by the various models. A
predicted walkability rating of 4 is considered to be ‘neutral’, with scores higher and lower than 4
representing ‘good’ and ‘bad’ levels of walkability (respectively) of a particular site. It must be noted that
in certain cases, the walkability rating predicted by the model may exceed 7 – this merely implies that the
walkability is considered to be at a level comparable to ‘very good’. It is also important to note that the
prediction models were derived from data on sites that were predominantly at LOS A, B and C – thus they
will provide valid results when used for sites within this range and can also be used to infer results outside
this range.
7.1.2 Participant rating vs predicted rating
Prior to their introduction as the response variable during model development, the CSR participants’ raw
walkability ratings were adjusted according to the rating of the common participant. The prediction given
by the walkability models is therefore also an adjusted walkability rating, and differs slightly in magnitude
from the raw ratings. This aspect must be considered while evaluating model predictions.
Table 7.1 shows the magnitude of difference between raw and adjusted walkability measurements.
Table 7.1 Difference between raw and adjusted walkability ratings
City % difference (adjusted walkability vs raw walkability)
Path lengths Road crossings
Auckland 10% 12%
Christchurch -5% -1%
Gisborne 3% -4%
Wellington 2% 5%
All sites 2% 3%
7.2 Model for path lengths
The preferred walkability model for path lengths is given by:
WalkabilityPL = 4.426 + 0.561 footcon + 0.300 green - 0.378 vspeed + 0.294 comfort - 0.464 devi + 0.415 pa+res + 0.170 min ewidth - 0.186 numhide - 0.0034 Avg stepav + 0.201 dese (Equation 7.1)
Descriptions and possible values of the predictor variables are listed in table 7.2. The various models for
path lengths, and coefficients of predictor variables for each, are tabulated below.
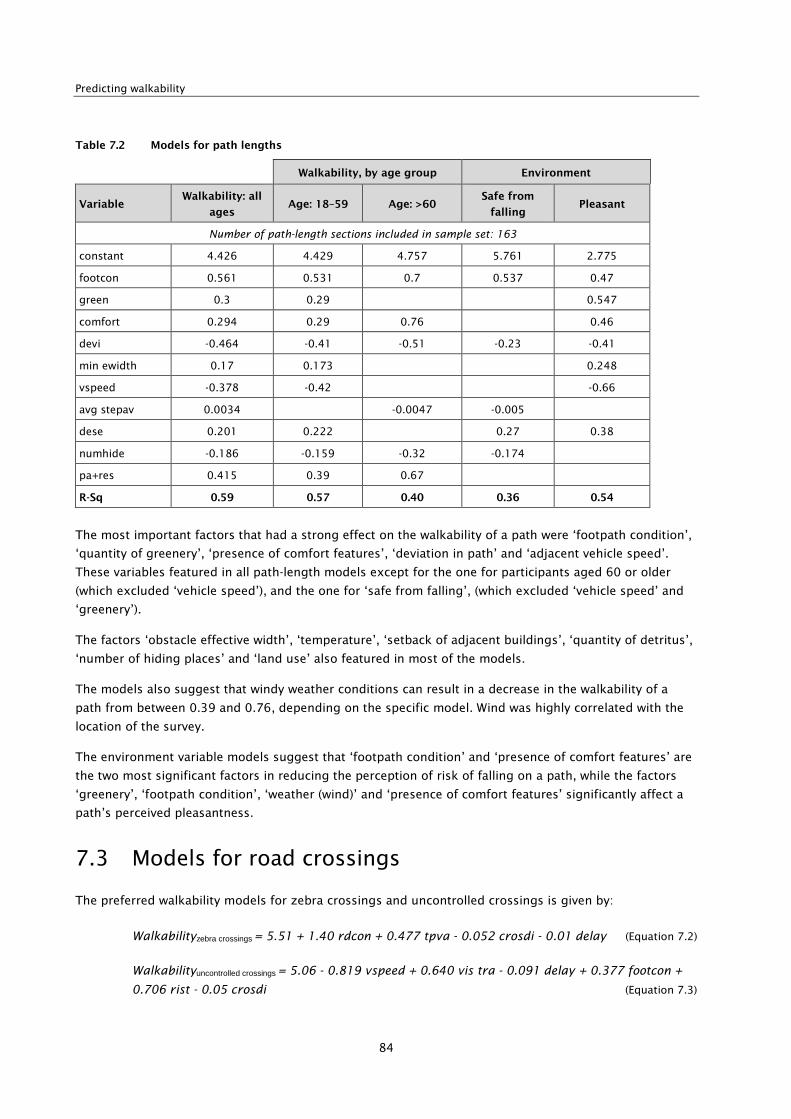
Predicting walkability
84
Table 7.2 Models for path lengths
Walkability, by age group Environment
Variable Walkability: all
ages Age: 18–59 Age: >60
Safe from
falling Pleasant
Number of path-length sections included in sample set: 163
constant 4.426 4.429 4.757 5.761 2.775
footcon 0.561 0.531 0.7 0.537 0.47
green 0.3 0.29 0.547
comfort 0.294 0.29 0.76 0.46
devi -0.464 -0.41 -0.51 -0.23 -0.41
min ewidth 0.17 0.173 0.248
vspeed -0.378 -0.42 -0.66
avg stepav 0.0034 -0.0047 -0.005
dese 0.201 0.222 0.27 0.38
numhide -0.186 -0.159 -0.32 -0.174
pa+res 0.415 0.39 0.67
R-Sq 0.59 0.57 0.40 0.36 0.54
The most important factors that had a strong effect on the walkability of a path were ‘footpath condition’,
‘quantity of greenery’, ‘presence of comfort features’, ‘deviation in path’ and ‘adjacent vehicle speed’.
These variables featured in all path-length models except for the one for participants aged 60 or older
(which excluded ‘vehicle speed’), and the one for ‘safe from falling’, (which excluded ‘vehicle speed’ and
‘greenery’).
The factors ‘obstacle effective width’, ‘temperature’, ‘setback of adjacent buildings’, ‘quantity of detritus’,
‘number of hiding places’ and ‘land use’ also featured in most of the models.
The models also suggest that windy weather conditions can result in a decrease in the walkability of a
path from between 0.39 and 0.76, depending on the specific model. Wind was highly correlated with the
location of the survey.
The environment variable models suggest that ‘footpath condition’ and ‘presence of comfort features’ are
the two most significant factors in reducing the perception of risk of falling on a path, while the factors
‘greenery’, ‘footpath condition’, ‘weather (wind)’ and ‘presence of comfort features’ significantly affect a
path’s perceived pleasantness.
7.3 Models for road crossings
The preferred walkability models for zebra crossings and uncontrolled crossings is given by:
Walkabilityzebra crossings = 5.51 + 1.40 rdcon + 0.477 tpva - 0.052 crosdi - 0.01 delay (Equation 7.2)
Walkabilityuncontrolled crossings = 5.06 - 0.819 vspeed + 0.640 vis tra - 0.091 delay + 0.377 footcon +
0.706 rist - 0.05 crosdi (Equation 7.3)

7 Discussion
85
Descriptions and possible values of the predictor variables are given in table 7.3. The various models for
road crossings, and coefficients of predictor variables for each, are tabulated.
Table 7.3 Models for road crossings
Walkability by crossing type
Variable Signalised Zebra Uncontrolled
constant
No significantly converging model
5.51 5.06
vspeed -0.819
vis tra 0.64
footcon 0.377
delay -0.01 -0.091
crosdi -0.052 -0.05
rdcon 1.4
tpva 0.477
rist 0.706
R-Sq 0.82 0.48
The most important factors affecting the walkability of road crossings were ‘crossing type’, ‘vehicle
speed’, ‘visibility to traffic’ and ‘footpath condition’, and these feature in all models except those for
zebra crossings and delay. The presence of a central island was also shown to positively affect the
walkability of a crossing.
No statistically significant model could be developed for signalised crossings. The model for zebra
crossings was based on a sample set of 13 crossings, and suggests that road condition and crossing
distance are important factors. The time taken to cross was also found to be a factor in the case of
uncontrolled crossings.
7.4 Comparison with the Landis walkability model
The linear regression approach to modelling walkability used in this study has previously been adopted in
several other walkability studies and notably in the study by Landis (2001). The pedestrian LOS model
developed by Landis is:
Ped LOS = -1.2021 ln (Wol + Wl + fpx %OSP + fb x Wb + fsw x Ws) + 0.253 ln (Vol15/L) + 0.0005 SPD2 + 5.3876
(Equation 7.4)
Where:
• Wol = width of outside lane (feet)
• Wl = width of shoulder or bike lane (feet)
• fp = on-street parking effect coefficient (= 0.20)
• %OSP = percent of segment with on-street parking
• fb = buffer area barrier coefficient (= 5.37 for trees spaced 20 feet on centre)
Predicting walkability
86
• Wb = buffer width (distance between edge of pavement and footpath, measured in feet)
• fsw = footpath presence coefficient (= 6–0.3Ws)
• Ws = width of footpath (feet)
• Vol15 = average traffic during a 15-minute period
• L = total number of (through) lanes (for road or street)
• SPD2 = average running speed of motor vehicle traffic (miles/hr).
The Landis model focused on the effects on pedestrian experience of traffic – participants were specifically
instructed to ignore aesthetic aspects.
The key difference between the Landis model and the models developed as part of this study lies in the
number of physical and operational characteristics that were assessed. Because of the significant amount
of CSR survey data available on path-length and road-crossing sections, a much broader range of variables
were analysed for their effects on walkability. However, the effect of some key traffic variables, such as
traffic volume, speed and number of heavy vehicles, could not be adequately assessed as part of this
study because they were only assessed subjectively, and were not measured as operational variables.
Both the Landis model and the models reported on in this study share some common findings, such as the
effects on perceived walkability of factors such as footpath width, vehicle speed, and provision for on-
street parking. This study builds upon the set of variables used in the Landis study, and includes
consideration of factors such as environment, personal security, urban design, presence of hazards and
comfort features, age and weather, in addition to road and footpath geometry. This consideration of a
broad cross-section of factors is expected to lead to a more holistic assessment of walkability through the
identification of key design and operational features that improve the quality of the walking environment.
The surveys in this study were conducted at quiet times of day and included fewer sites that had a poor
rating from users – this decreased the range of footpath conditions for the study.
7 Discussion
87
8 Recommendations
The following recommendations arise from this research:
• Preferred overall models: A number of mathematical models were created as part of this research. It
is recommended that in terms of practical use, only the overall main models that predict walkability
for path lengths, zebra road crossings and uncontrolled road crossings should be used by
practitioners.
• Data collection for sites at LOS D, E and F: The sample set used in this study did not include a
sufficient number of sites at LOS D, E and F to enable closer assessment and prediction of walkability
scores for such sites. Future studies should focus on data collection from a broader range of sites,
including an adequate number of sites with low pedestrian LOS ratings.
• Data collection for road crossings: The limited availability of relevant data meant that a sufficiently
converging model for signalised road crossings could not be built as part of this study. In addition,
the sample set included data from only 13 zebra crossing sites. Further research is needed to carefully
examine the pedestrian walkability of these crossing types by utilising data from additional sites.
• Collection of traffic-volume data: Because of the limited availability of data on traffic volumes at path
lengths and road crossings, traffic flow could not be included in the final walkability models. Efforts to
use the logarithmic relationship between noise and traffic volume to develop a surrogate variable for
traffic flow resulted in numerical complications during the modelling process. It is recommended that
traffic flow data should be utilised in future analyses of the walkability of path lengths and road
crossings.
• Walkability at different times of day: The data utilised for developing the walkability prediction
models was obtained from CSR surveys that were held at various times during the day. Future studies
could look at examining the walkability of sections at specific times of the day, especially in busy CBD
areas where the walking environment can differ markedly between peak and non-peak times, and
between daytime and the hours of darkness.
• Model validation: A comprehensive model validation exercise has not been undertaken as part of this
study, and could be the focus of follow-on research.
• Walkability for impaired pedestrians: Further research is also recommended on analysis of the
differences in walkability ratings between able-bodied pedestrians and those with physical and/or
visual impairments.

Predicting walkability
88
9 References
Abley, S (2005) Walkability scoping paper. 62pp. Accessed 5 July 2011.
www.levelofservice.com/walkability-research.pdf
Abley, S (2006) Walkability research tools – variables collection methodology. Christchurch: Land
Transport NZ and Abley Transportation Consultants Ltd. 65pp.
Abley, S (2008) Walkability research tools – summary report. NZ Transport Agency research report 356.
16pp.
Abley, S (2010) Community street review how to guide – parts 1–3. NZ Transport Agency, Living Streets
Aotearoa and Abley Transportation Consultants Ltd.
Baltimore Metropolitan Council (BMC) (2004) Bicycle level of service evaluation update & pedestrian level
of service evaluation. Baltimore, Maryland: Baltimore Metropolitan Council. 33pp.
Boulter, R and R Rutherford (2004) Walking audit methodology. Auckland.
Centres for Disease Control and Prevention (CDC) (2000) Walkability Audit Tool. Accessed 25 August
2011. www.cdc.gov/nccdphp/dnpao/hwi/downloads/walkability_audit_tool.pdf
Fruin, JJ (1971) Pedestrian planning and design. New York: Metropolitan Association of Urban Designers
and Environmental Planners. 206pp.
Gallin, N (2001) Quantifying pedestrian friendliness – guidelines for assessing pedestrian level of service.
Transport Research Laboratory Road and Transport research 10, no.1: 47–55.
Huang, TH and C Chiun (2007) Modelling level of service on pedestrian environment. Journal of the
Eastern Asia Society for Transportation Studies 7: 1774–1780.
Landis, BW, VR Vattikitti, RM Ottenberg, DS McLeod and M Guttenplan (2001) Modeling the roadside
walking environment: pedestrian level of service. Transportation Research Record 1773, no.1: 82–88.
Living Streets (2002) DIY community street audits. UK: Living Streets. 41pp.
Muraleetharan, T, T Adachi, T Hagiwara and S Kagaya (2005) Method to determine pedestrian level-of-
service for crosswalks at urban intersections. Journal of the Eastern Asia Society for Transportation
Studies 5: 127–136.
Muraleetharan, T, T Adachi, K Uchida, T Hagiwara and S Kagaya (2004) A study on evaluation of pedestrian
level of service along sidewalks and at crosswalks using conjoint analysis. Journal of Infrastructure
Planning, Japan Society of Civil Engineers 21, no.3: 727–735.
NZ Transport Agency (2007) Pedestrian planning and design guide. Wellington: NZ Transport Agency.
188pp.
NZ Transport Agency (2010) Guide to undertaking community street reviews. Accessed 6 July 2011.
www.nzta.govt.nz/resources/community-street-reviews/docs/csr-guide.pdf
Petritsch, TA, BW Landis, PS McLeod, HF Huang, S Challa and M Guttenplan (2004) Level-of-service model
for pedestrians at signalized intersections. Transportation Research Record 1939: 55–62.

9 References
89
Petritsch, TA, BW Landis, PS McLeod, HF Huang, S Challa, CL Skaggs, M Guttenplan and V Vattikuti (2006)
Pedestrian level-of-service model for urban arterial facilities with sidewalks. Transportation Research
Record 1982: 84–89.
Transportation Research Board (TRB) (2000) Highway capacity manual. Washington DC: Transportation
Research Board.
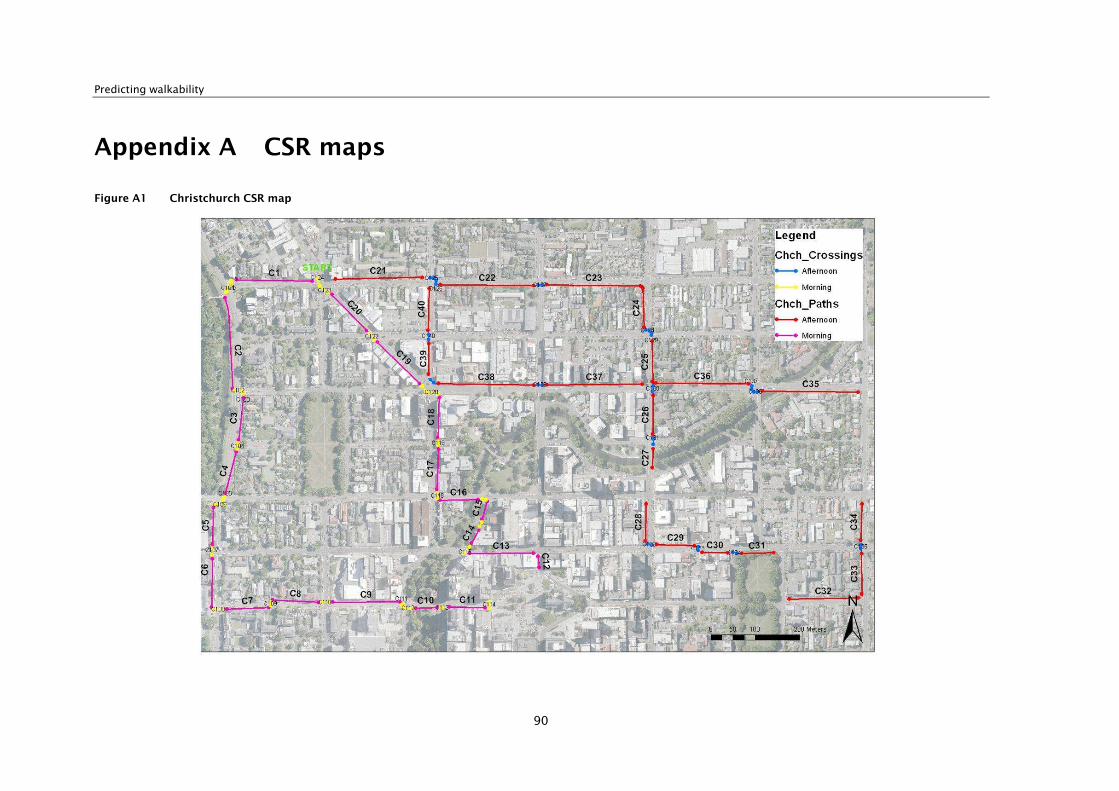
Predicting walkability
90
Appendix A CSR maps
Figure A1 Christchurch CSR map

Appendix A
91
Figure A2 Gisborne CSR map

Predicting walkability
92
Figure A3 Auckland CSR map (morning)
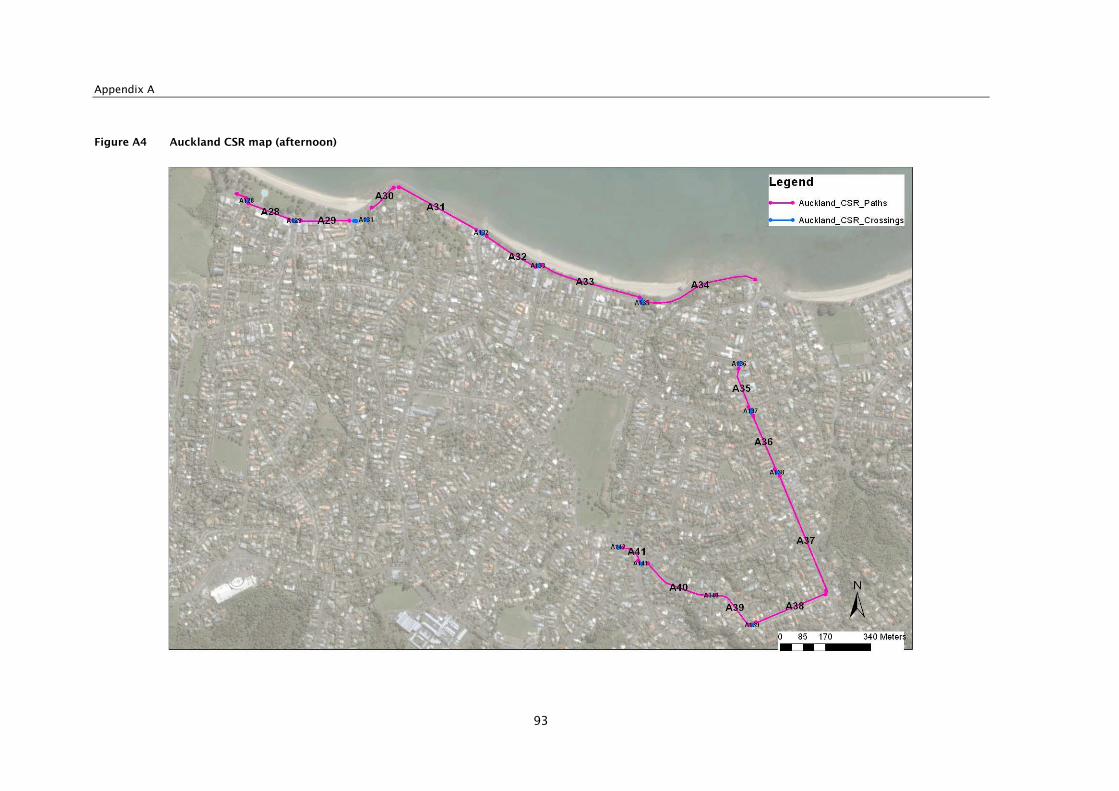
Appendix A
93
Figure A4 Auckland CSR map (afternoon)

Predicting walkability
94
Figure A5 Wellington CSR map
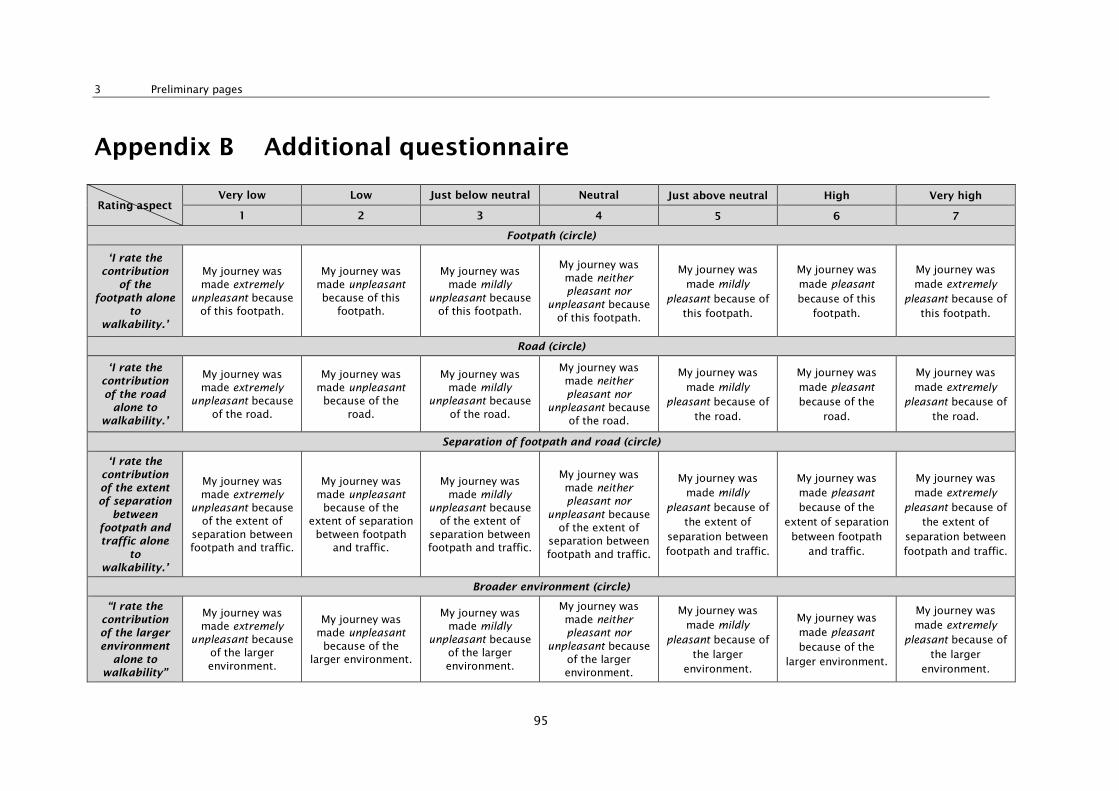
3 Preliminary pages
95
Appendix B Additional questionnaire
Rating aspect Very low Low Just below neutral Neutral Just above neutral High Very high
1 2 3 4 5 6 7
Footpath (circle)
‘I rate the
contribution
of the
footpath alone
to
walkability.’
My journey was
made extremely
unpleasant because
of this footpath.
My journey was
made unpleasant
because of this
footpath.
My journey was
made mildly
unpleasant because
of this footpath.
My journey was
made neither
pleasant nor
unpleasant because
of this footpath.
My journey was
made mildly
pleasant because of
this footpath.
My journey was
made pleasant
because of this
footpath.
My journey was
made extremely
pleasant because of
this footpath.
Road (circle)
‘I rate the
contribution
of the road
alone to
walkability.’
My journey was
made extremely
unpleasant because
of the road.
My journey was
made unpleasant
because of the
road.
My journey was
made mildly
unpleasant because
of the road.
My journey was
made neither
pleasant nor
unpleasant because
of the road.
My journey was
made mildly
pleasant because of
the road.
My journey was
made pleasant
because of the
road.
My journey was
made extremely
pleasant because of
the road.
Separation of footpath and road (circle)
‘I rate the
contribution
of the extent
of separation
between
footpath and
traffic alone
to
walkability.’
My journey was
made extremely
unpleasant because
of the extent of
separation between
footpath and traffic.
My journey was
made unpleasant
because of the
extent of separation
between footpath
and traffic.
My journey was
made mildly
unpleasant because
of the extent of
separation between
footpath and traffic.
My journey was
made neither
pleasant nor
unpleasant because
of the extent of
separation between
footpath and traffic.
My journey was
made mildly
pleasant because of
the extent of
separation between
footpath and traffic.
My journey was
made pleasant
because of the
extent of separation
between footpath
and traffic.
My journey was
made extremely
pleasant because of
the extent of
separation between
footpath and traffic.
Broader environment (circle)
“I rate the
contribution
of the larger
environment
alone to
walkability”
My journey was
made extremely
unpleasant because
of the larger
environment.
My journey was
made unpleasant
because of the
larger environment.
My journey was
made mildly
unpleasant because
of the larger
environment.
My journey was
made neither
pleasant nor
unpleasant because
of the larger
environment.
My journey was
made mildly
pleasant because of
the larger
environment.
My journey was
made pleasant
because of the
larger environment.
My journey was
made extremely
pleasant because of
the larger
environment.

Predicting walkability
96
Appendix C Variables
Table C1 Path-length variables
Variable string Description
avg adj walk Average adjusted walkability
rating for each section
vspeed Vehicle speed
vis tra Visibility to traffic
footcon Footpath condition
dbnoise Noise in decibels
avgiwid Average island eff. width
kerb cutdown Entry OR exit kerb dropped?
crosdi Crossing length distance
(m)
rist Refuge island
traffic Volume of traffic
peoplenum People flow (during crossing
time)
density People density
pospeed Posted speed limit
rdcon Road condition
avg stum Average stumbling hazards
(mm)
avg trip Average trip hazards
croscyc Number of cycle lanes to
cross
manucom How many comfort features
weather Survey weather
cloud Weather, cloudy
wind Weather, windy
tpva Tactile paving or visual aids
ddl Deviation from desire line
litter Litter
deti Detritus
vanda Vandalism
ekerbf Entry kerb: footpath
gradient
exitf Exit kerb: footpath gradient
ekerbr Entry kerb: road gradient
exitr Exit kerb: road gradient
kerbwid Kerb: effective width
kerbcross Kerb: crossfall
Variable string Description
kerb2wid Kerb: effective width
kerb2cross Kerb: crossfall
crostr Number of traffic lanes to
cross
pocrosdi Possible crossing width
distance
dese Design effort
luclass Land-use classification
refuge Type of refuge island
oddir Odd vehicle-approach
direction
comfea Comfort features
hazp Protection from permanent
hazards
thaz Temporary hazards
temp Temperature
humid Humidity
timetak (sec) Time taken

Appendix D
97
Avg adj
walkfootcon green
peoplen
um
(hourly)
Adjusted
gradientvanda weather vspeed Avg cfall disveh vaways visacc useacc
Avg
ewidthSurface Avg stum Avg trip manyutil
manyco
m
numveh
(hourly)roadwid
numhveh
(hourly)dbnoise density litter deti cloud wind useosp
Average
adj
walkabil it
y rating
for each
section
Footpath
condition
Quantity
of
greenery
People
flow per
hour
Downhill
gradient
assumed
to be zero
vandalismSurvey
weather
Vehicle
speed
Average
Crossfal l
(%)
Distance
from
moving
vehicles
(m)
Number of
vehicle
access
ways
Visibil ity
to vehicle
access
ways
Use of
access
ways
Average
effective
width of
path
Concrete
or Asphalt
Average
Stumbling
hazards
(mm)
Average
trip
hazards
How many
util ities
How many
comfort
features
Number of
adjacent
vehicles
per hour
Road
width (m)
Number of
heavy
vehicles
per hour
Noise in
decibels
People
densityl itter detritus
weather,
cloudy
weather,
windy
Use of on-
street
parking
Avg adj walkAverage adj walkability rating for each
section1.000
footcon Footpath condition 0.469 1.000green Quantity of greenery 0.282 -0.031 1.000peoplenum
(hourly)People flow per hour 0.225 0.225 -0.230 1.000
Adjusted
gradientDownhill gradient assumed to be zero -0.049 -0.105 0.278 -0.124 1.000
vanda vandalism -0.143 -0.071 -0.030 -0.090 -0.103 1.000weather Survey weather -0.368 -0.079 -0.182 -0.012 -0.272 -0.090 1.000vspeed Vehicle speed -0.191 -0.039 0.117 -0.296 0.013 0.134 0.088 1.000Avg cfall Average Crossfall (%) 0.073 0.051 0.099 0.120 -0.059 -0.040 0.072 0.060 1.000disveh Distance from moving vehicles (m) 0.019 -0.041 0.043 0.056 -0.121 -0.103 0.118 0.086 0.115 1.000vaways Number of vehicle access ways -0.007 0.042 -0.013 -0.151 -0.074 0.064 -0.056 0.242 -0.057 0.229 1.000visacc Visibility to vehicle access ways 0.092 0.039 0.204 -0.013 -0.037 -0.095 -0.141 0.043 0.066 0.077 -0.021 1.000useacc Use of access ways -0.066 0.007 -0.098 0.149 -0.015 -0.096 -0.034 -0.009 0.061 0.119 0.088 0.152 1.000Avg ewidth Average effective width of path 0.086 0.164 -0.305 0.474 -0.193 -0.213 0.035 -0.106 0.151 0.115 -0.142 -0.022 0.086 1.000Surface Concrete or Asphalt -0.069 -0.025 0.015 -0.262 0.099 0.007 -0.050 0.306 -0.113 0.023 0.279 0.037 0.167 -0.233 1.000Avg stum Average Stumbling hazards (mm) 0.013 -0.083 0.147 -0.064 -0.036 0.075 -0.061 0.006 -0.081 0.073 0.251 0.098 -0.036 -0.098 0.047 1.000Avg trip Average trip hazards -0.005 0.070 0.038 -0.077 -0.085 0.065 -0.118 -0.062 0.072 0.088 0.339 -0.024 0.028 -0.094 0.078 0.447 1.000manyutil How many utilities 0.218 0.195 -0.216 0.556 -0.155 -0.146 -0.022 -0.184 0.048 0.136 -0.085 0.060 0.104 0.470 -0.265 0.043 -0.019 1.000manycom How many comfort features 0.253 0.122 0.013 0.447 -0.097 -0.035 -0.165 -0.147 0.076 0.113 -0.162 0.044 0.063 0.372 -0.251 -0.042 -0.046 0.722 1.000numveh
(hourly)Number of adjacent vehicles per hour -0.034 0.201 -0.251 0.289 -0.277 -0.154 0.394 0.108 0.040 0.258 -0.014 0.000 0.135 0.166 -0.084 -0.092 -0.056 0.260 0.059 1.000
roadwid Road width (m) -0.116 0.008 -0.340 0.288 -0.214 -0.167 0.132 0.071 0.163 0.415 -0.074 0.026 0.237 0.429 -0.048 -0.096 -0.110 0.363 0.209 0.447 1.000numhveh
(hourly)Number of heavy vehicles per hour -0.010 0.074 -0.077 0.195 -0.131 -0.037 0.099 -0.018 -0.074 -0.005 0.042 -0.010 0.039 0.074 0.032 -0.012 -0.089 0.228 0.078 0.309 0.092 1.000
dbnoise Noise in decibels -0.150 0.039 -0.191 0.159 -0.244 -0.032 0.318 0.055 0.097 0.132 0.067 0.010 0.068 0.119 0.017 0.032 0.013 0.208 0.114 0.344 0.217 0.146 1.000density People density 0.039 0.129 -0.313 0.645 -0.088 -0.026 0.040 -0.195 0.067 -0.025 0.032 -0.102 0.294 0.318 -0.110 -0.028 -0.031 0.550 0.422 0.136 0.257 0.140 0.214 1.000litter litter -0.153 -0.194 -0.026 -0.047 -0.029 0.361 0.072 0.178 0.038 0.143 0.149 -0.107 -0.017 -0.147 0.007 0.151 0.030 -0.070 -0.048 0.008 -0.016 0.021 0.052 0.078 1.000deti detritus -0.067 -0.208 0.221 -0.213 0.356 0.181 -0.254 0.139 -0.018 -0.056 0.137 0.040 -0.089 -0.231 0.152 0.149 0.062 -0.208 -0.077 -0.318 -0.218 -0.074 -0.146 -0.143 0.389 1.000cloud weather, cloudy -0.078 0.203 -0.226 0.261 -0.169 -0.167 0.298 -0.094 0.055 -0.066 -0.090 -0.006 0.069 0.420 -0.149 -0.083 -0.070 0.260 0.208 0.214 0.275 0.096 0.294 0.311 -0.205 -0.300 1.000wind weather, windy -0.320 0.029 -0.134 -0.081 -0.209 -0.122 0.784 0.180 0.036 0.066 0.008 0.014 0.001 -0.012 0.020 -0.082 -0.091 -0.105 -0.167 0.366 0.120 0.071 0.295 -0.034 -0.026 -0.188 0.322 1.000useosp Use of on-street parking -0.057 0.054 -0.271 0.248 -0.094 -0.024 0.064 -0.160 -0.019 -0.024 -0.178 -0.011 0.054 0.297 -0.150 -0.050 -0.120 0.221 0.171 0.152 0.246 0.159 0.067 0.297 0.036 -0.056 0.413 0.003 1.000shared Shared path 0.288 0.068 0.318 0.131 -0.084 -0.106 -0.040 0.031 0.220 0.102 -0.162 0.133 0.071 0.188 -0.088 -0.052 -0.070 0.114 0.222 -0.071 0.004 -0.078 -0.051 -0.040 -0.144 -0.002 0.121 -0.120 -0.067Avg numob Average Number of regular obstacles -0.014 0.083 -0.392 0.361 -0.130 -0.148 0.219 -0.158 -0.013 0.074 -0.013 -0.068 0.290 0.389 -0.102 -0.013 -0.119 0.475 0.25536 0.351 0.334 0.197 0.212 0.476 0.007 -0.190 0.388 0.100 0.371
Avg effwAverage Effective width (M) of regular
obstacle-0.020 0.168 -0.319 0.358 -0.181 -0.194 0.253 -0.100 0.017 0.140 -0.068 -0.017 0.204 0.667 -0.165 -0.117 -0.136 0.451 0.292 0.314 0.360 0.189 0.269 0.284 -0.101 -0.287 0.454 0.182 0.278
Avg effAverage Effctive width of permanent
non regular obstacles0.013 0.115 -0.241 0.314 -0.169 -0.071 0.114 0.006 0.074 0.072 0.008 0.051 0.070 0.765 -0.197 -0.042 0.040 0.317 0.217 0.075 0.232 0.081 0.152 0.226 -0.041 -0.161 0.421 0.054 0.219
Avg nustep Average number of steps -0.053 0.018 -0.044 -0.122 0.126 0.432 -0.184 -0.008 -0.015 -0.015 -0.169 0.000 0.000 -0.126 0.179 -0.075 -0.073 -0.134 -0.086 -0.231 -0.005 -0.078 -0.159 -0.094 0.076 0.145 -0.186 -0.159 0.000Avg stepav Combined Average step height -0.021 0.042 0.050 -0.129 0.209 0.310 -0.207 -0.058 -0.046 -0.058 -0.190 0.000 0.000 -0.160 0.232 -0.088 -0.082 -0.152 -0.097 -0.239 -0.062 -0.028 -0.211 -0.098 0.020 0.121 -0.210 -0.179 0.000storeysad Number of storeys 0.048 0.103 -0.254 0.241 0.100 -0.042 -0.070 -0.103 -0.026 -0.036 -0.024 -0.049 0.052 0.315 -0.039 -0.016 -0.054 0.062 0.08552 -0.080 0.052 0.016 -0.095 0.252 0.008 0.031 0.218 0.007 0.193setbackad Buliding set back from footpath (m) 0.088 -0.060 0.298 -0.170 0.086 -0.016 0.021 0.176 0.009 0.132 0.090 0.096 0.080 -0.200 0.174 -0.006 0.021 -0.213 -0.091 0.033 0.003 -0.098 0.004 -0.187 -0.081 0.136 -0.123 0.032 -0.199storeysop Number of storeys 0.011 0.090 -0.137 0.184 -0.002 -0.056 -0.123 -0.041 -0.014 -0.064 -0.054 -0.092 -0.009 0.358 -0.077 0.017 0.015 0.083 0.082 -0.054 0.143 -0.078 -0.103 0.204 -0.034 0.024 0.175 0.000 0.093setbackop Building setback from footpath (m) -0.102 -0.116 0.164 -0.220 0.099 0.004 -0.006 0.128 -0.005 -0.018 -0.022 0.000 0.021 0.003 -0.003 0.025 0.010 -0.152 -0.117 -0.096 -0.035 -0.148 -0.019 -0.221 0.006 0.107 -0.052 0.064 -0.188ddl Deviation from desire line -0.015 -0.187 0.216 -0.058 0.116 0.222 -0.135 -0.021 0.016 -0.035 -0.135 0.018 0.007 -0.069 -0.009 0.063 0.041 -0.089 0.09159 -0.186 -0.279 -0.071 -0.072 -0.092 0.105 0.157 -0.134 -0.113 0.082streetact Street activity 0.119 0.286 -0.286 0.536 -0.153 -0.223 0.051 -0.331 0.094 0.195 -0.094 0.207 0.219 0.468 -0.361 0.002 -0.005 0.567 0.342 0.256 0.360 0.109 0.144 0.507 -0.106 -0.320 0.435 -0.009 0.298dirin Diectional information 0.240 0.274 -0.021 0.176 -0.179 0.052 -0.019 -0.137 -0.008 -0.196 0.045 0.113 -0.015 0.217 -0.190 0.055 -0.027 0.181 0.213 -0.124 -0.082 0.054 0.100 0.195 0.045 -0.006 0.236 -0.046 0.128dese Design effort 0.340 0.267 0.082 0.404 -0.168 -0.074 -0.016 -0.226 0.183 0.307 -0.066 0.058 0.017 0.412 -0.288 0.062 -0.014 0.443 0.519 0.190 0.233 -0.013 0.048 0.216 -0.059 -0.127 0.251 -0.028 0.218veranda Buliding veranda -0.069 0.128 -0.401 0.375 -0.152 -0.066 0.010 -0.177 0.042 0.061 -0.043 0.086 0.128 0.419 -0.201 -0.016 0.050 0.437 0.15026 0.166 0.281 0.192 0.153 0.319 -0.039 -0.233 0.185 -0.045 0.133luclass Land use classification -0.173 -0.118 -0.201 0.154 -0.092 0.016 -0.026 -0.008 0.110 0.132 -0.099 0.063 0.127 0.325 -0.138 0.131 -0.018 0.142 0.225 0.015 0.245 0.043 0.074 0.117 0.153 0.086 0.036 -0.079 0.172pava Tactile paving or visual aids 0.077 0.073 -0.127 0.372 -0.057 -0.091 0.043 -0.235 0.075 -0.089 -0.130 -0.114 -0.029 0.294 -0.262 -0.094 -0.044 0.380 0.380 -0.041 0.092 -0.035 0.094 0.433 -0.063 -0.127 0.232 0.003 0.125streetpark On-street parking available -0.168 -0.034 -0.080 -0.042 -0.186 -0.082 0.252 0.024 -0.179 0.329 0.372 -0.040 0.026 -0.037 -0.093 0.172 0.164 0.097 -0.006 0.228 0.191 0.160 0.190 0.103 0.132 -0.040 0.166 0.224 0.045utility Utility features 0.221 0.161 -0.007 0.298 -0.183 -0.218 0.065 0.002 0.104 0.100 -0.078 0.122 0.084 0.385 -0.227 0.037 -0.074 0.641 0.36903 0.221 0.257 0.074 0.166 0.256 0.053 -0.089 0.262 0.050 0.066protect Protection from hazards 0.007 -0.017 0.100 -0.138 0.185 0.278 -0.278 -0.015 0.164 -0.138 -0.132 0.073 -0.047 -0.024 0.021 0.016 0.083 -0.065 -0.032 -0.203 -0.182 -0.043 -0.038 -0.132 0.121 0.183 -0.183 -0.228 0.003comfort Comfort features 0.309 0.140 -0.002 0.438 -0.120 -0.046 -0.154 -0.151 0.038 0.111 0.029 0.101 0.086 0.383 -0.167 0.034 -0.003 0.650 0.648 0.114 0.193 0.170 0.075 0.376 0.072 0.090 0.137 -0.128 0.134
cane201Cane detectable permanent non regular
obstacles-0.069 0.134 -0.299 0.198 -0.228 -0.016 0.222 0.055 -0.023 -0.025 0.091 -0.041 0.088 0.445 -0.181 0.010 0.158 0.242 0.143 0.161 0.221 0.089 0.188 0.245 0.025 -0.150 0.460 0.164 0.248
caned01 Cane detectable regular obstacle -0.111 0.110 -0.360 0.285 -0.139 -0.204 0.365 -0.103 -0.103 0.035 0.004 -0.074 0.203 0.398 -0.098 -0.106 -0.136 0.337 0.17309 0.318 0.291 0.214 0.221 0.315 -0.040 -0.232 0.503 0.274 0.372avg obs
ewidthavg obstacle e width 0.167 0.169 -0.338 0.416 -0.103 -0.101 -0.001 -0.160 0.097 -0.006 0.074 0.002 0.090 0.577 -0.149 -0.030 0.019 0.447 0.281 0.159 0.210 0.077 0.203 0.333 -0.061 -0.157 0.232 -0.034 0.278
thaz Temp hazards -0.040 0.084 -0.131 0.322 -0.025 -0.066 0.139 -0.222 0.047 -0.082 -0.014 -0.108 0.082 0.260 -0.077 0.128 0.102 0.195 0.187 -0.059 0.022 0.011 0.063 0.467 0.013 -0.124 0.253 0.092 0.127temp temp 0.161 -0.051 -0.007 -0.242 0.086 0.157 -0.385 0.082 -0.166 -0.167 0.223 -0.116 -0.134 -0.154 0.203 0.074 -0.034 -0.156 -0.071 -0.362 -0.244 0.010 -0.123 -0.098 0.065 0.324 -0.402 -0.348 -0.129humid humid 0.027 0.100 0.006 0.285 0.166 -0.136 -0.022 -0.080 0.046 -0.111 -0.146 0.080 0.097 0.298 -0.018 -0.069 0.104 0.290 0.18227 0.199 0.179 0.099 0.114 0.262 -0.107 -0.082 0.521 0.043 0.076numhide Number of hiding places -0.043 0.076 -0.052 -0.101 -0.035 -0.033 -0.012 -0.008 -0.069 0.141 0.258 -0.003 -0.015 0.174 -0.020 0.063 0.100 0.059 -0.064 -0.155 -0.046 -0.010 0.080 -0.064 0.038 0.004 0.032 -0.016 -0.039devi Deviation around obstacles -0.232 -0.175 -0.156 0.141 0.154 -0.006 -0.001 -0.078 -0.045 -0.126 0.013 -0.140 0.097 0.188 0.029 -0.027 -0.029 0.146 0.109 0.018 0.007 0.131 0.118 0.343 -0.002 0.064 0.149 -0.139 0.100wheels Number of wheeled users 0.099 0.026 0.005 0.229 -0.036 -0.015 0.071 -0.076 0.114 -0.019 -0.052 -0.030 0.085 0.125 0.021 0.067 0.061 0.244 0.299 0.077 0.030 -0.006 0.138 0.379 0.026 -0.012 0.020 0.050 0.081
Correlations: Path
Lengths
Appendix D Variable correlations
Table D1 Correlations: path lengths

Predicting walkability
98
sharedAvg
numobAvg effw Avg eff
Avg
nustep
Avg
stepav
storeysa
d
setbacka
d
storeyso
p
setbacko
pddl streetact dirin dese veranda luclass pava
streetpar
kutility protect comfort cane201 caned01
avg obs
ewidththaz temp humid numhide devi wheels
Shared
path
Average
Number of
regular
obstacles
Average
Effective
width (M)
of regular
obstacle
Average
Effctive
width of
permanent
non
regular
obstacles
Average
number of
steps
Combined
Average
step
height
Number of
storeys
Bul iding
set back
from
footpath
(m)
Number of
storeys
Bui lding
setback
from
footpath
(m)
Deviation
from
desire l ine
Street
activity
Diectional
informatio
n
Design
effort
Bul iding
veranda
Land use
classificat
ion
Tactile
paving or
visual
aids
On-street
parking
avai lable
Util ity
features
Protection
from
hazards
Comfort
features
Cane
detectable
permanent
non
regular
obstacles
Cane
detectable
regular
obstacle
avg
obstacle e
width
Temp
hazardstemp humid
Number of
hiding
places
Deviation
around
obstacles
Number of
wheeled
users
Avg adj walkAverage adj walkability rating for each
section
footcon Footpath condition
green Quantity of greenery
peoplenum
(hourly)People flow per hour
Adjusted
gradientDownhill gradient assumed to be zero
vanda vandalism
weather Survey weather
vspeed Vehicle speed
Avg cfall Average Crossfall (%)
disveh Distance from moving vehicles (m)
vaways Number of vehicle access ways
visacc Visibility to vehicle access ways
useacc Use of access ways
Avg ewidth Average effective width of path
Surface Concrete or Asphalt
Avg stum Average Stumbling hazards (mm)
Avg trip Average trip hazards
manyutil How many utilities
manycom How many comfort features
numveh
(hourly)Number of adjacent vehicles per hour
roadwid Road width (m)
numhveh
(hourly)Number of heavy vehicles per hour
dbnoise Noise in decibels
density People density
litter litter
deti detritus
cloud weather, cloudy
wind weather, windy
useosp Use of on-street parking
shared Shared path 1.000Avg numob Average Number of regular obstacles -0.038 1.000
Avg effwAverage Effective width (M) of regular
obstacle0.049 0.660 1.000
Avg effAverage Effctive width of permanent
non regular obstacles0.166 0.264 0.587 1.000
Avg nustep Average number of steps -0.057 -0.137 -0.171 -0.135 1.000Avg stepav Combined Average step height -0.064 -0.147 -0.193 -0.168 0.883 1.000storeysad Number of storeys -0.112 0.205 0.103 0.272 0.053 0.035 1.000setbackad Buliding set back from footpath (m) 0.053 -0.334 -0.292 -0.197 -0.030 -0.031 -0.023 1.000storeysop Number of storeys 0.006 0.112 0.158 0.321 0.043 0.019 0.493 -0.133 1.000setbackop Building setback from footpath (m) -0.007 -0.152 0.075 0.026 -0.036 -0.035 -0.173 0.346 0.189 1.000ddl Deviation from desire line -0.024 -0.134 -0.136 0.008 0.076 0.079 0.133 -0.066 0.108 -0.038 1.000streetact Street activity 0.052 0.442 0.495 0.453 -0.145 -0.159 0.249 -0.226 0.186 -0.119 -0.119 1.000dirin Diectional information 0.163 0.022 0.088 0.292 -0.071 -0.053 0.130 -0.080 0.140 -0.139 -0.025 0.216 1.000dese Design effort 0.261 0.180 0.315 0.316 -0.121 -0.133 0.076 0.005 0.253 0.044 -0.035 0.486 0.140 1.000veranda Buliding veranda -0.124 0.258 0.340 0.371 -0.053 -0.093 0.152 -0.279 0.085 -0.105 -0.091 0.553 0.100 0.075 1.000luclass Land use classification 0.002 0.146 0.163 0.178 -0.005 -0.081 0.259 -0.004 0.153 -0.084 0.013 0.242 0.157 0.157 0.252 1.000pava Tactile paving or visual aids 0.092 0.154 0.283 0.246 -0.047 -0.053 0.076 -0.158 0.181 -0.148 -0.038 0.335 0.232 0.241 0.133 0.011 1.000streetpark On-street parking available -0.158 0.297 0.206 0.037 -0.337 -0.372 -0.059 -0.096 -0.072 -0.134 -0.194 0.133 -0.093 0.001 0.093 -0.012 -0.022 1.000utility Utility features 0.177 0.326 0.332 0.282 -0.227 -0.256 0.079 -0.117 0.168 0.010 -0.035 0.452 0.233 0.371 0.262 0.144 0.137 0.034 1.000protect Protection from hazards -0.036 -0.280 -0.176 0.014 0.273 0.300 -0.069 -0.048 -0.038 0.030 0.312 -0.136 0.053 -0.032 0.004 0.041 -0.009 -0.356 -0.050 1.000comfort Comfort features 0.161 0.255 0.225 0.245 -0.145 -0.164 0.160 -0.153 0.148 -0.194 0.026 0.332 0.216 0.458 0.206 0.206 0.175 0.080 0.555 0.016 1.000
cane201Cane detectable permanent non regular
obstacles0.033 0.267 0.355 0.763 -0.162 -0.206 0.255 -0.191 0.239 -0.184 -0.018 0.390 0.376 0.154 0.276 0.172 0.161 0.221 0.261 -0.094 0.246 1.000
caned01 Cane detectable regular obstacle -0.067 0.773 0.790 0.385 -0.173 -0.188 0.210 -0.320 0.081 -0.134 -0.154 0.408 0.105 0.104 0.231 0.131 0.213 0.374 0.262 -0.326 0.129 0.411 1.000avg obs
ewidthavg obstacle e width -0.015 0.466 0.573 0.522 -0.125 -0.156 0.038 -0.257 0.101 -0.066 -0.120 0.398 0.143 0.282 0.463 0.056 0.338 0.051 0.255 -0.059 0.240 0.327 0.435 1.000
thaz Temp hazards 0.020 0.244 0.325 0.306 -0.074 -0.083 0.091 -0.175 0.142 -0.022 -0.048 0.305 0.098 0.167 0.179 0.023 0.430 0.018 0.023 -0.086 0.043 0.178 0.241 0.340 1.000temp temp -0.031 -0.174 -0.245 -0.196 0.213 0.208 0.008 -0.026 0.010 -0.027 0.116 -0.316 0.033 -0.278 -0.109 -0.055 -0.111 -0.203 -0.220 0.089 0.002 -0.220 -0.250 -0.053 -0.100 1.000humid humid 0.029 0.227 0.228 0.299 -0.173 -0.132 0.196 -0.052 0.186 -0.001 -0.058 0.226 0.094 0.109 0.186 -0.020 0.079 0.041 0.333 0.065 0.255 0.289 0.225 0.150 0.130 -0.501 1.000numhide Number of hiding places -0.078 0.035 0.273 0.260 -0.013 -0.027 -0.009 -0.080 0.031 0.173 -0.052 0.084 -0.040 0.086 0.154 -0.043 0.039 0.058 0.007 0.094 0.015 -0.010 0.102 0.197 0.161 0.058 -0.066 1.000devi Deviation around obstacles -0.088 0.296 0.196 0.197 -0.079 -0.089 0.134 -0.065 0.061 0.010 -0.058 0.132 0.030 -0.045 0.238 0.100 0.067 0.070 -0.001 -0.075 0.081 0.155 0.214 0.229 0.294 0.134 0.147 -0.012 1.000wheels Number of wheeled users 0.064 0.238 0.133 -0.021 -0.078 -0.088 0.021 0.006 0.054 -0.067 -0.061 0.044 0.052 0.225 0.035 0.170 0.234 0.058 0.166 0.057 0.196 -0.062 0.101 0.172 0.215 -0.187 0.147 -0.116 0.073 1.000
Correlations: Path
Lengths

Appendix D
99
Avg adj
walkcrossct vspeed vis tra footcon dbnoise Avgiwid
Kerb
cutdowncrosdi rist traffic
peoplen
umdensity pospeed rdcon Avg stum Avg trip croscyc
manuco
mweather cloud wind
Average
adj
walkabili t
y rating
for each
section
Crossing
control
type
Vehicle
speed
Visibility
to traffic
Footpath
condition
Noise in
decibels
Average
island eff
width
Entry OR
exit kerb
dropped
?
Crossing
length
distance
(m)
Refuge
island
Volume
of traffic
People
flow
(during
crossing
time)
People
density
Posted
speed
limit
Road
condition
Average
Stumblin
g hazards
(mm)
Avg Trip
hazards
Number
of cycle
lanes to
cross
How
many
comfort
features
Survey
weather
weather,
cloudy
weather,
windy
Avg adj
walk
Average adj walkability rating for
each section1.000
crossct Crossing control type -0.492 1.000vspeed Vehicle speed -0.292 -0.022 1.000vis tra Visibility to traffic 0.356 -0.229 -0.109 1.000footcon Footpath condition 0.330 -0.249 -0.011 0.017 1.000dbnoise Noise in decibels 0.071 -0.315 -0.060 0.279 0.076 1.000Avgiwid Average island eff width 0.128 0.079 -0.160 0.014 -0.062 0.097 1.000Kerb
cutdownEntry OR exit kerb dropped? 0.167 -0.163 -0.134 0.256 0.033 0.060 0.037 1.000
crosdi Crossing length distance (m) 0.078 -0.264 0.140 0.094 0.030 0.158 0.020 0.073 1.000rist Refuge island 0.058 0.140 -0.105 -0.029 -0.045 0.078 0.786 -0.018 0.002 1.000traffic Volume of traffic -0.085 -0.070 -0.073 0.278 0.108 0.402 0.269 -0.002 0.158 0.209 1.000peoplenu
m
People flow (during crossing
time)0.225 -0.264 0.131 0.129 0.105 0.142 -0.038 -0.038 0.023 -0.060 -0.032 1.000
density People density 0.227 -0.225 0.060 0.135 0.110 0.163 0.065 -0.094 -0.015 0.021 0.173 0.790 1.000pospeed Posted speed limit -0.125 0.034 0.149 -0.040 -0.042 -0.003 0.021 -0.035 0.047 0.027 #DIV/0! -0.045 0.032 1.000rdcon Road condition 0.256 -0.206 -0.077 0.222 0.306 0.131 0.055 -0.045 0.094 0.048 0.219 0.126 0.143 -0.033 1.000
Avg stum Average Stumbling hazards (mm) -0.015 -0.008 0.040 0.021 0.034 -0.019 0.006 0.117 -0.011 -0.010 -0.041 0.118 0.034 0.024 0.048 1.000
Avg trip Avg Trip hazards -0.074 -0.015 0.010 -0.142 -0.021 0.147 -0.004 -0.037 -0.008 0.017 -0.002 0.076 0.071 0.021 -0.060 0.084 1.000croscyc Number of cycle lanes to cross 0.069 -0.357 0.160 0.124 0.129 0.120 -0.078 0.132 0.328 -0.099 0.178 0.070 0.097 0.027 0.043 0.133 0.086 1.000manucom How many comfort features 0.097 0.073 -0.220 0.042 0.070 0.054 0.159 0.059 -0.028 0.083 0.256 -0.062 0.122 0.012 0.055 -0.003 -0.006 -0.017 1.000weather Survey weather 0.006 -0.156 0.124 0.218 -0.148 0.263 -0.021 0.204 0.139 -0.070 0.200 -0.092 -0.118 -0.096 0.096 -0.117 0.141 0.270 -0.114 1.000cloud weather, cloudy 0.303 -0.531 -0.137 0.153 0.166 0.304 -0.036 0.316 0.191 -0.144 -0.015 0.182 0.073 -0.089 0.083 0.295 0.044 0.245 0.048 0.165 1.000wind weather, windy 0.056 -0.197 0.216 0.224 -0.004 0.235 -0.062 0.228 0.184 -0.074 0.106 -0.081 -0.172 -0.113 0.118 -0.142 0.000 0.241 -0.109 0.785 0.149 1.000tpva Tactile paving or visual aids 0.277 -0.298 -0.380 0.146 0.203 0.168 0.115 0.087 -0.025 0.131 0.168 0.155 0.192 -0.155 0.074 -0.109 -0.138 -0.043 0.226 -0.282 0.190 -0.232ddl Deviation from desire line -0.028 0.086 0.021 -0.074 0.061 -0.038 0.293 -0.057 0.031 0.301 -0.025 -0.063 -0.055 0.013 0.053 0.254 -0.036 -0.043 -0.021 -0.120 0.057 -0.101litter litter -0.199 0.170 0.168 -0.003 -0.201 -0.030 -0.057 0.002 0.001 -0.072 -0.197 -0.100 -0.087 0.020 -0.093 -0.066 -0.057 -0.074 -0.033 0.126 -0.224 0.100deti detritus -0.045 0.204 0.032 -0.112 -0.143 -0.286 -0.054 -0.346 -0.087 -0.037 -0.301 -0.068 -0.032 0.036 -0.162 -0.119 -0.102 -0.134 -0.060 -0.191 -0.247 -0.182vanda vandalism 0.000 0.056 -0.135 0.071 -0.308 0.008 0.147 -0.078 -0.001 0.133 0.135 -0.066 -0.057 0.013 0.055 -0.043 -0.037 -0.049 -0.022 0.070 -0.148 -0.008ekerbf Entry kerb: Footpath gradient -0.137 0.256 0.032 0.048 -0.054 -0.041 0.128 -0.060 -0.074 0.158 -0.093 0.041 -0.011 -0.110 -0.109 -0.028 -0.035 -0.184 -0.069 -0.107 -0.203 -0.115exitf Exit kerb: footpath gradient -0.082 0.219 -0.021 -0.061 -0.091 -0.027 0.087 -0.136 -0.068 0.088 0.022 0.050 0.057 -0.079 -0.102 -0.052 0.045 -0.235 0.028 -0.110 -0.155 -0.117ekerbr Entry kerb: road gradient -0.130 0.112 0.134 -0.175 -0.013 -0.258 -0.056 -0.085 0.014 0.000 0.158 -0.173 -0.122 0.091 0.134 -0.098 0.079 -0.068 0.023 -0.014 -0.273 0.016exitr Exit kerb: road gradient 0.029 0.010 0.022 -0.055 -0.015 -0.040 -0.109 -0.269 -0.049 -0.078 0.032 -0.221 -0.143 0.075 0.158 -0.084 -0.025 0.020 0.02003 0.007 -0.169 -0.001kerbwid Kerb: effective width 0.099 0.009 -0.170 -0.004 -0.011 -0.023 -0.032 -0.037 -0.079 -0.093 -0.007 0.137 0.172 -0.168 0.109 0.110 -0.007 -0.010 0.248 -0.155 0.085 -0.109kerbcross Kerb: crossfall 0.073 -0.082 0.031 0.145 0.025 -0.010 0.035 -0.147 0.047 0.094 -0.125 0.160 0.019 -0.064 0.088 0.160 0.068 0.153 -0.074 0.030 0.101 0.081kerb2wid Kerb: effective width 0.105 0.025 -0.027 0.056 0.062 0.032 -0.016 -0.235 -0.053 -0.036 0.002 0.418 0.471 -0.090 0.078 0.003 -0.009 -0.027 0.120 -0.122 0.153 -0.086kerb2cross Kerb: crossfall -0.092 0.052 0.016 -0.017 0.083 -0.091 -0.096 -0.159 -0.050 -0.071 -0.030 0.096 -0.006 -0.149 0.012 0.195 0.035 0.116 -0.051 -0.049 0.113 -0.047crostr Number of traffic lanes to cross 0.288 -0.701 0.134 0.166 0.141 0.244 -0.039 0.151 0.338 -0.062 traffic 0.317 0.174 0.041 0.179 0.013 -0.009 0.105 -0.0527 -0.021 0.398 0.092pocrosdi Possible crossing width distance 0.040 0.248 -0.087 0.028 -0.008 -0.061 0.004 -0.157 -0.152 0.141 -0.110 0.032 0.116 -0.134 0.039 0.026 -0.003 -0.151 0.007 -0.132 -0.145 -0.114dese Design effort 0.192 -0.115 -0.269 0.111 0.117 0.023 0.033 0.019 -0.073 0.118 0.325 0.319 0.439 -0.216 0.148 0.029 0.057 0.083 0.339 -0.205 0.097 -0.201luclass Land use classification 0.090 -0.164 -0.147 0.093 -0.045 0.145 -0.083 -0.082 -0.065 -0.126 -0.139 0.255 0.206 -0.033 -0.014 0.062 0.008 -0.029 0.047 -0.083 0.184 -0.141refuge Type of refuge island 0.050 0.142 -0.062 0.015 -0.019 0.060 0.743 0.019 0.012 0.954 0.149 -0.061 0.020 0.027 0.042 0.028 0.016 -0.100 0.082 -0.093 -0.094 -0.098oddir Odd vehicle approach direction 0.172 -0.267 0.063 0.137 0.094 0.171 -0.073 0.047 0.290 -0.092 0.229 0.076 0.088 0.026 0.040 -0.004 -0.034 0.333 -0.043 0.220 0.251 0.221comfea Comfort features 0.048 0.073 -0.219 -0.023 0.107 -0.019 0.187 0.091 -0.018 0.185 0.435 -0.091 0.070 0.019 0.079 0.131 0.093 0.075 0.672 -0.121 0.010 -0.159
hazpProtection from permanent
hazards0.122 0.047 -0.203 0.130 0.084 0.096 0.129 0.037 -0.012 0.310 0.191 0.039 0.133 0.024 0.107 0.005 -0.068 -0.090 0.291 -0.195 -0.046 -0.154
thaz Temp hazards 0.072 -0.043 -0.015 -0.006 -0.009 -0.011 -0.041 0.069 -0.056 -0.053 -0.200 0.119 0.209 0.016 0.071 0.105 -0.045 0.045 -0.027 0.150 0.083 0.077temp temp -0.150 0.222 0.040 -0.183 -0.281 -0.144 -0.037 -0.125 -0.162 0.011 -0.200 -0.052 -0.054 0.089 -0.155 -0.161 -0.006 -0.223 -0.118 -0.266 -0.330 -0.331humid humid 0.338 -0.360 -0.090 0.133 0.280 0.171 0.120 0.122 0.183 0.013 0.008 0.152 0.104 0.009 0.149 -0.041 -0.027 -0.046 0.020 -0.116 0.505 -0.066
Correlations: Road
Crossings
Table D2 Correlations: road crossings
Note: Cells that display #Div/0! mean there was no variation (and hence correlation) between variables

Predicting walkability
100
tpva ddl litter deti vanda ekerbf exitf ekerbr exitr kerbwid kerbcross kerb2widkerb2cro
sscrostr pocrosdi dese luclass refuge oddir comfea hazp thaz temp humid
Tactile
paving or
visual
aids
Deviatio
n from
desire
line
l itter detritus vandalism
Entry kerb:
Footpath
gradient
Exit kerb:
footpath
gradient
Entry kerb:
road
gradient
Exit kerb:
road
gradient
Kerb:
effective
width
Kerb:
crossfal l
Kerb:
effective
width
Kerb:
crossfall
Number of
traffic
lanes to
cross
Possible
crossing
width
distance
Design
effort
Land use
classificat
ion
Type of
refuge
island
Odd
vehicle
approach
direction
Comfort
features
Protection
from
permanent
hazards
Temp
hazardstemp humid
Avg adj
walk
Average adj walkability rating for
each section
crossct Crossing control type
vspeed Vehicle speed
vis tra Visibility to traffic
footcon Footpath condition
dbnoise Noise in decibels
Avgiwid Average island eff width
Kerb
cutdownEntry OR exit kerb dropped?
crosdi Crossing length distance (m)
rist Refuge island
traffic Volume of traffic
peoplenu
m
People flow (during crossing
time)
density People density
pospeed Posted speed limit
rdcon Road condition
Avg stum Average Stumbling hazards (mm)
Avg trip Avg Trip hazards
croscyc Number of cycle lanes to cross
manucom How many comfort features
weather Survey weather
cloud weather, cloudy
wind weather, windy
tpva Tactile paving or visual aids 1.000ddl Deviation from desire line -0.044 1.000litter litter -0.053 -0.029 1.000deti detritus -0.199 -0.051 0.081 1.000vanda vandalism -0.058 0.003 0.191 0.204 1.000ekerbf Entry kerb: Footpath gradient 0.012 -0.015 0.031 0.151 0.012 1.000exitf Exit kerb: footpath gradient 0.096 -0.028 0.136 0.093 0.120 0.424 1.000ekerbr Entry kerb: road gradient -0.142 -0.112 0.045 0.180 -0.144 -0.105 -0.095 1.000exitr Exit kerb: road gradient -0.017 0.010 0.056 -0.021 -0.002 -0.299 -0.138 0.196 1.000kerbwid Kerb: effective width 0.096 0.000 -0.008 0.117 0.145 0.096 0.236 -0.178 -0.140 1.000kerbcross Kerb: crossfall -0.103 0.028 -0.042 0.097 0.074 0.359 0.088 -0.182 -0.164 0.185 1.000kerb2wid Kerb: effective width 0.064 0.003 -0.073 0.142 0.011 0.114 0.195 -0.153 -0.177 0.422 0.108 1.000kerb2cross Kerb: crossfall -0.034 0.089 -0.090 -0.149 -0.055 0.131 0.341 -0.244 -0.081 0.230 0.348 0.198 1.000crostr Number of traffic lanes to cross 0.276 0.052 -0.111 -0.229 -0.073 -0.152 -0.150 0.002 -0.076 -0.017 0.030 0.000 -0.067 1.000pocrosdi Possible crossing width distance -0.008 -0.009 0.000 0.250 -0.011 0.136 0.128 0.000 -0.008 0.536 0.035 0.299 0.095 -0.238 1.000dese Design effort 0.224 -0.034 -0.114 -0.033 0.044 -0.048 0.002 -0.025 -0.085 0.284 0.124 0.332 0.128 0.091 0.228 1.000luclass Land use classification 0.160 -0.062 0.112 0.030 -0.037 0.029 0.162 -0.258 -0.154 0.168 0.219 0.248 0.134 0.031 0.139 0.321 1.000refuge Type of refuge island 0.099 0.406 -0.062 -0.061 0.044 0.121 0.065 -0.012 -0.074 -0.082 0.093 -0.039 0.005 -0.035 0.141 0.096 -0.106 1.000oddir Odd vehicle approach direction -0.085 -0.044 -0.069 -0.028 -0.046 -0.120 -0.113 -0.046 0.004 0.139 0.036 0.058 0.020 0.126 0.102 0.029 -0.001 -0.093 1.000comfea Comfort features 0.215 -0.032 -0.051 -0.092 -0.033 -0.098 0.039 0.044 -0.011 0.167 -0.045 0.045 -0.009 -0.058 -0.007 0.424 0.039 0.184 -0.065 1.000
hazpProtection from permanent
hazards0.307 0.275 -0.065 0.033 0.149 0.104 0.184 -0.066 -0.012 0.234 0.010 0.146 -0.005 0.022 0.353 0.392 0.091 0.310 0.020 0.213 1.000
thaz Temp hazards 0.022 -0.024 0.076 0.016 -0.028 -0.150 -0.065 0.016 -0.033 0.092 0.069 0.044 0.051 -0.086 0.062 0.119 0.019 -0.056 0.137 -0.041 -0.052 1.000temp temp -0.057 -0.066 0.074 0.078 0.064 0.091 0.117 0.093 0.108 0.023 -0.253 -0.133 -0.149 -0.063 0.000 -0.238 -0.233 0.006 -0.165 -0.175 -0.161 -0.138 1.000humid humid 0.297 -0.043 -0.250 0.059 -0.154 0.016 -0.030 -0.109 -0.132 0.005 0.043 0.112 -0.100 0.292 0.068 -0.016 0.115 0.032 0.025 -0.001 0.097 -0.044 -0.341 1.000
Correlations: Road
Crossings

Appendix D
101
Appendix E Walkability adjustment
The adjusted walkability rating was calculated by using the following formula:
Adjusted walkability = (Raw walkability) – (Average walkability rating from a given participant for a given site) + (Average walkability rating from the common participant for that site)
Minitab worksheet structure:
• c18 has raw walkability measurements.
• c19 has the mean for a given participant in a given site (calculated using the macro given below).
• c20 has the mean for the common participant (participant 86) at each site.
Minitab macro:
gmacro
adjust
let k90 = count(c18)
Set C19
1( 1 : 1 / 1 )k90
End.
let c19 = c19-c19
do k1 = 6:50
do k2 = 11:112
let k3 = mean(((c4 = k1)and(c7 = k2))*c18)
let k4 = sum((c4 = k1)and(c7 = k2))
if (sum((c4 = k1)and(c7 = k2))>0)
let c19 = (k3*k90/k4)*((c4 = k1)and(c7 = k2))+c19
endif
enddo
enddo
endmacro

Predicting walkability
102
Appendix F Model results
Figure F1 Model: ‘path length’ – overall
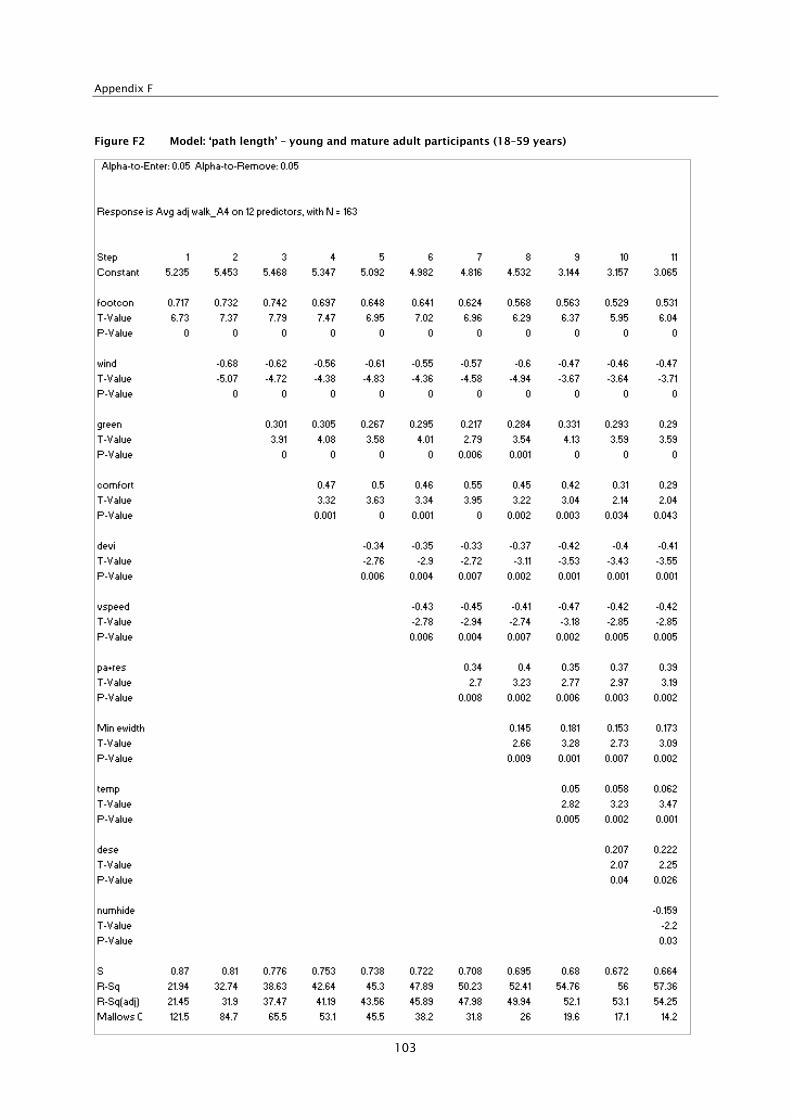
Appendix F
103
Figure F2 Model: ‘path length’ – young and mature adult participants (18–59 years)

Predicting walkability
104
Figure F3 Model: ‘path length’, elderly participants (aged 60 or older)

Appendix F
105
Figure F4 Model: ‘path length’, ‘environment variables’, ‘safe from falling’
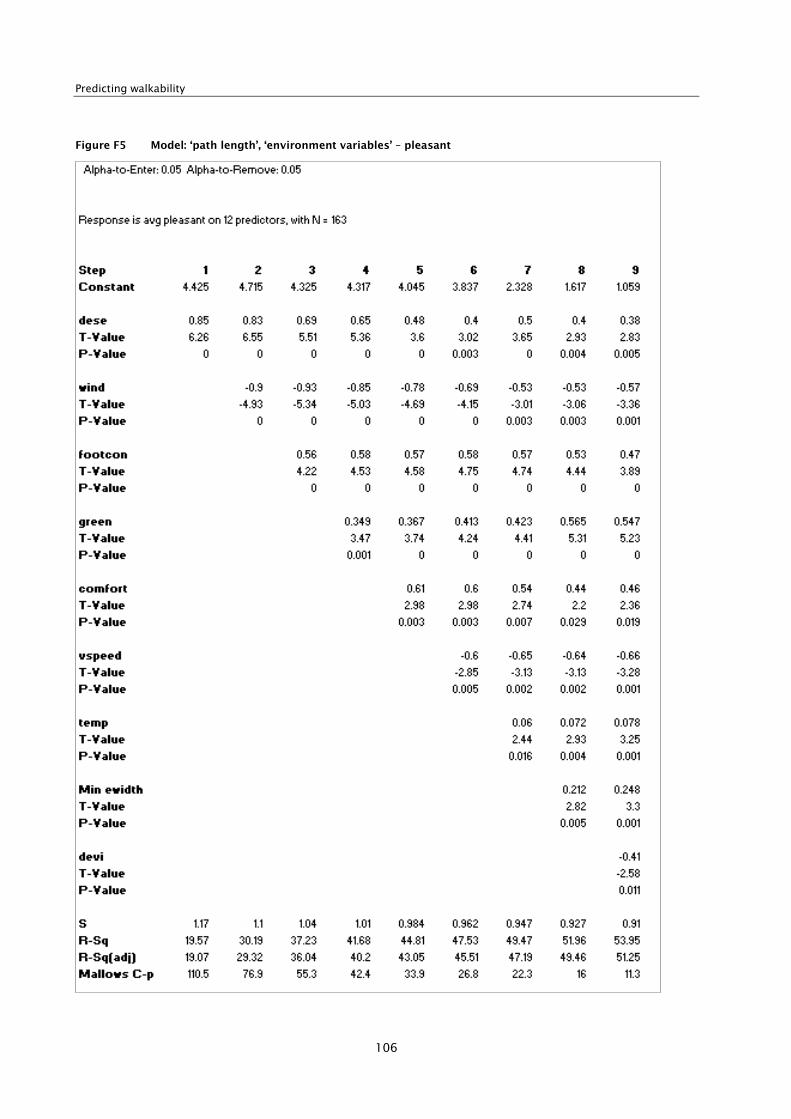
Predicting walkability
106
Figure F5 Model: ‘path length’, ‘environment variables’ – pleasant
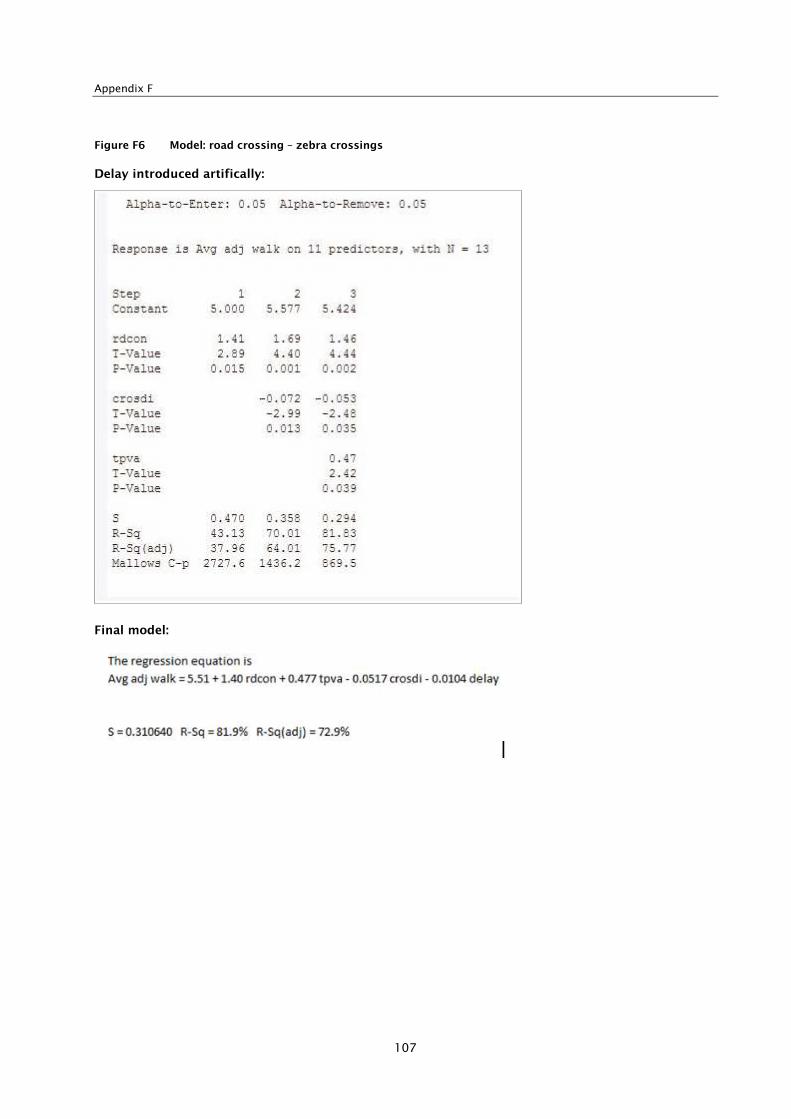
Appendix F
107
Figure F6 Model: road crossing – zebra crossings
Delay introduced artifically:
Final model:

Predicting walkability
108
Figure F7 Model: road crossing – uncontrolled crossings

Appendix G
109
Appendix G Contributions to overall walkability score, by variable
The following tables describe various scenarios along with the associated model variable values and
predicted walkability ratings for each.
The scenarios describe the effects of changes in one or more physical and operational variables on the
overall predicted rating. For example, in the case of ‘path lengths’, the scenario describing a ‘well-
designed path’ considers wide paths in good condition, located in residential zones, having comfort
features and greenery, causing minimum deviation, with traffic travelling at below the speed limit, and no
hiding places along the path.
Individual variables (such as presence of comfort features and land use) are then changed, while keeping
all other variables the same, to describe the effect of changes in these physical and operational
characteristics on the predicted rating.
Table G1 Path length
Variable
Wide path No comfort
features on path
Paths in
commercial/
industrial zones,
little or no
greenery
Narrower path in
poor condition
and with hiding
places
Poorly designed
path
Variable values
Walkability:
significance value
Variable values
Walkability:
significance value
Variable values
Walkability:
significance value
Variable values
Walkability:
significance value
Variable values
Walkability:
significance value
constant 4.426 4.426 4.426 4.426 4.426
footcon 1 0.561 1 0.561 1 0.561 -1 -0.561 -1 -0.561
green 1 0.3 1 0.3 0 0 1 0.3 -1 -0.3
comfort 1 0.294 0 0 1 0.294 1 0.294 -1 -0.294
devi -1 0.464 -1 0.464 -1 0.464 -1 0.464 1 -0.464
min ewidth 3 0.51 3 0.51 3 0.51 1.5 0.255 1.5 0.255
vspeed -1 0.378 -1 0.378 -1 0.378 -1 0.378 0 0
avg stepav 150 0.51 150 0.51 150 0.51 150 0.51 165 0.561
dese 1 0.201 -1 -0.201 1 0.201 1 0.201 -1 -0.201
numhide 0 0 0 0 0 0 1 -0.186 2 -0.372
pa+res 1 0.415 1 0.415 0 0 1 0.415 0 0
Predicted
walkability
rating
8.059 7.363 7.344 6.496 3.050

Predicting walkability
110
Table G2 Path length – ages 18–59
Variable
Wide path No comfort
features on path
Paths in
commercial/
industrial zones,
little or no
greenery
Narrower path in
poor condition
and with hiding
places
Poorly designed
path
Variable values
Walkability:
significance value
Variable values
Walkability:
significance value
Variable values
Walkability:
significance value
Variable values
Walkability:
significance value
Variable values
Walkability:
significance value
constant 4.429 4.429 4.429 4.429 4.429
footcon 1 0.531 1 0.531 1 0.531 -1 -0.531 -1 -0.531
wind 0 0 0 0 0 0 0 0 0 0
green 1 0.29 1 0.29 0 0 1 0.29 -1 -0.29
comfort 1 0.29 0 0 1 0.29 1 0.29 -1 -0.29
devi -1 0.41 -1 0.41 -1 0.41 -1 0.41 1 -0.41
min ewidth 3 0.519 3 0.519 3 0.519 1.5 0.2595 1.5 0.2595
vspeed -1 0.42 -1 0.42 -1 0.42 -1 0.42 0 0
avg stepav
dese 1 0.222 -1 -0.222 1 0.222 1 0.222 -1 -0.222
numhide 0 0 0 0 0 0 1 -0.159 2 -0.318
pa+res 1 0.39 1 0.39 0 0 1 0.39 0 0
Predicted
walkability
rating
7.501 6.767 6.821 6.021 2.628
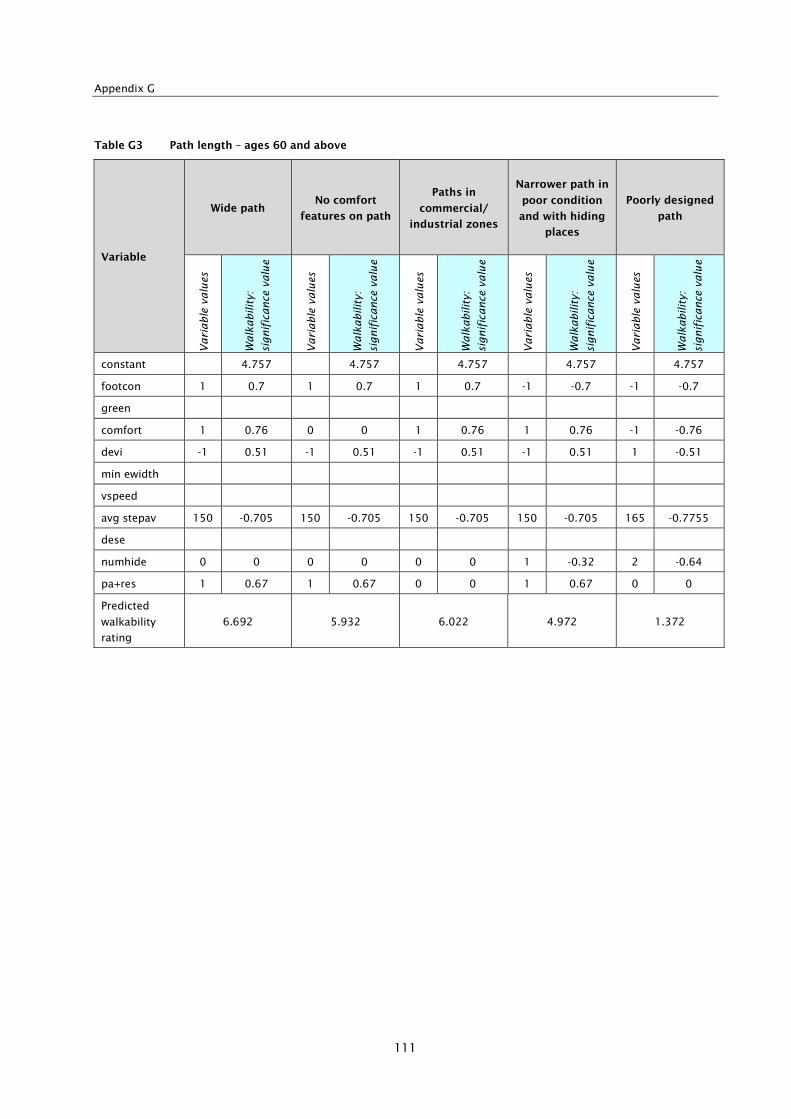
Appendix G
111
Table G3 Path length – ages 60 and above
Variable
Wide path No comfort
features on path
Paths in
commercial/
industrial zones
Narrower path in
poor condition
and with hiding
places
Poorly designed
path Variable values
Walkability:
significance value
Variable values
Walkability:
significance value
Variable values
Walkability:
significance value
Variable values
Walkability:
significance value
Variable values
Walkability:
significance value
constant 4.757 4.757 4.757 4.757 4.757
footcon 1 0.7 1 0.7 1 0.7 -1 -0.7 -1 -0.7
green
comfort 1 0.76 0 0 1 0.76 1 0.76 -1 -0.76
devi -1 0.51 -1 0.51 -1 0.51 -1 0.51 1 -0.51
min ewidth
vspeed
avg stepav 150 -0.705 150 -0.705 150 -0.705 150 -0.705 165 -0.7755
dese
numhide 0 0 0 0 0 0 1 -0.32 2 -0.64
pa+res 1 0.67 1 0.67 0 0 1 0.67 0 0
Predicted
walkability
rating
6.692 5.932 6.022 4.972 1.372
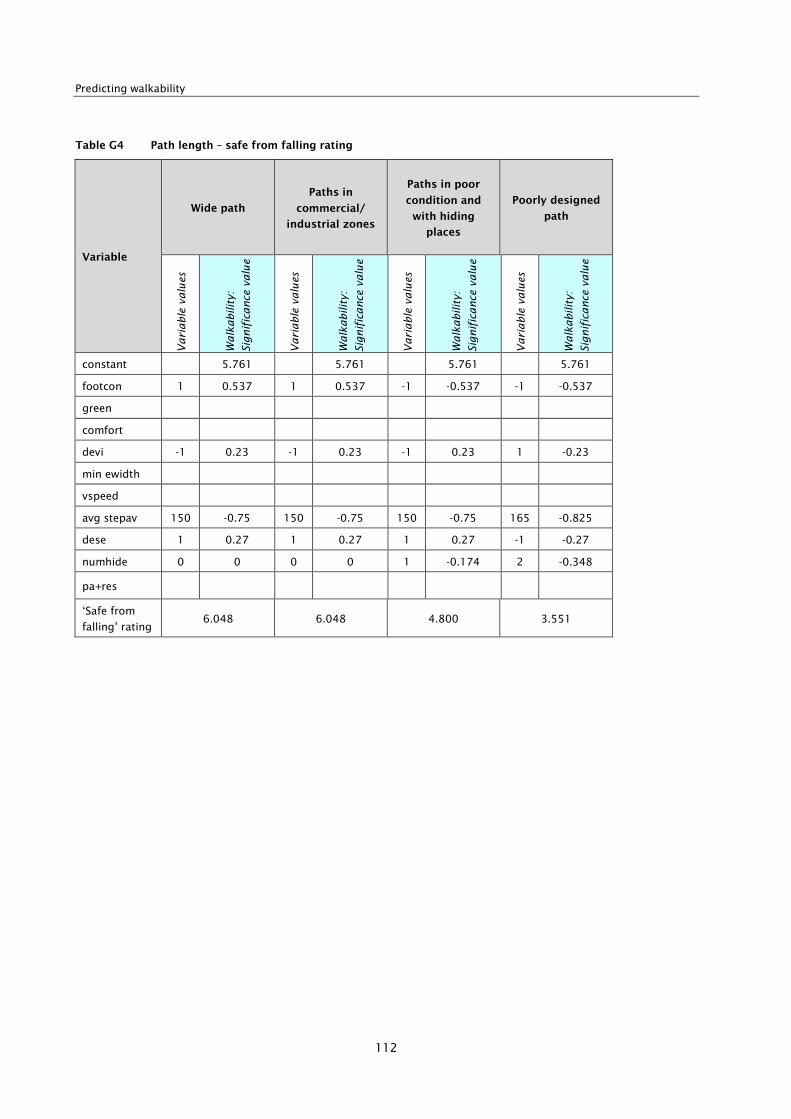
Predicting walkability
112
Table G4 Path length – safe from falling rating
Variable
Wide path
Paths in
commercial/
industrial zones
Paths in poor
condition and
with hiding
places
Poorly designed
path
Variable values
Walkability:
Significance value
Variable values
Walkability:
Significance value
Variable values
Walkability:
Significance value
Variable values
Walkability:
Significance value
constant 5.761 5.761 5.761 5.761
footcon 1 0.537 1 0.537 -1 -0.537 -1 -0.537
green
comfort
devi -1 0.23 -1 0.23 -1 0.23 1 -0.23
min ewidth
vspeed
avg stepav 150 -0.75 150 -0.75 150 -0.75 165 -0.825
dese 1 0.27 1 0.27 1 0.27 -1 -0.27
numhide 0 0 0 0 1 -0.174 2 -0.348
pa+res
‘Safe from
falling’ rating 6.048 6.048 4.800 3.551

Appendix G
113
Table G5 Path length – pleasant rating
Variable
Wide path No comfort
features on path
Paths with little
or no greenery
Narrower path
in poor
condition
Poorly designed
path
Variable values
Walkability:
significance
Variable values
Walkability:
significance
value
Variable values
Walkability:
significance
value
Variable values
Walkability:
significance
value
Variable values
Walkability:
significance
value
constant 2.775 2.775 2.775 2.775 2.775
footcon 1 0.47 1 0.47 1 0.47 -1 -0.47 -1 -0.47
green 1 0.547 1 0.547 0 0 1 0.547 -1 -0.547
comfort 1 0.46 0 0 1 0.46 1 0.46 -1 -0.46
devi -1 0.41 -1 0.41 -1 0.41 -1 0.41 1 -0.41
min ewidth 3 0.744 3 0.744 3 0.744 1.5 0.372 1.5 0.372
vspeed -1 0.66 -1 0.66 -1 0.66 -1 0.66 0 0
avg stepav
dese 1 0.38 -1 -0.38 1 0.38 1 0.38 -1 -0.38
numhide
pa+res
‘Pleasant’
rating 6.446 5.226 5.899 5.134 0.880

Predicting walkability
114
Table G6 Road crossing
Variable
Zebra
crossing:
generic
Larger zebra
crossing with
increased
delaya
Zebra
crossing on a
poorly
maintained
road, no
tactiles
Uncontrolled
crossing,
with refuge
Larger
uncontrolled
crossing, with
higher vehicle
speeds and
increased
delay
Uncontrolled
crossing with
a poorly
maintained
footpath and
no central
island
Variable values
Walkability:
significance value
Variable values
Walkability:
significance value
Variable values
Walkability:
significance value
Variable values
Walkability:
significance value
Variable values
Walkability:
significance value
Variable values
Walkability:
significance value
constant 5.510 5.510 5.510 5.060 5.060 5.060
vspeed -1 0.819 0 0 -1 0.819
vis tra 1 0.64 1 0.64 1 0.64
footcon 1 0.377 1 0.377 -1 -0.377
delay 5 -0.05 10 -0.1 5 -0.05 20 -1.82 30 -2.73 20 -1.82
crosdi 10 -0.52 15 -0.78 10 -0.52 10 -0.5 15 -0.75 10 -0.5
rdcon 1 1.4 1 1.4 -1 -1.4
tpva 1 0.477 1 0.477 0 0
rist 1 0.706 1 0.706 0 0
Predicted
walkability
rating
6.667 6.307 3.390 5.282 3.303 3.422
a) Note: Zebra crossings with high traffic flows can subject pedestrians to large delays as pedestrians confirm
motorists will yield and allow them to cross. In these situations, a zebra crossing may not be the most appropriate
crossing facility.