
Precision Irrigation Management: What’s Now and ... - Almond
58
Precision Irrigation Management: What’s Now and What’s New (Part 1) December 7, 2016
Transcript of Precision Irrigation Management: What’s Now and ... - Almond
Precision Irrigation
Management: What’s Now
and What’s New (Part 1)
December 7, 2016

Precision Irrigation
Management: What’s Now and
What’s New (Part 1)
Bob Curtis, Almond Board of California
(Moderator)
Bruce Lampinen, UC Davis
Shrini Upadhyaya, UC Davis
Ken Shackel, UC Davis
Bob Curtis,
Almond Board of California
Bruce Lampinen,
UC Davis
Plant Water Status- Overview
of Existing ToolsBruce Lampinen, UC Davis Plant
Sciences
6
7
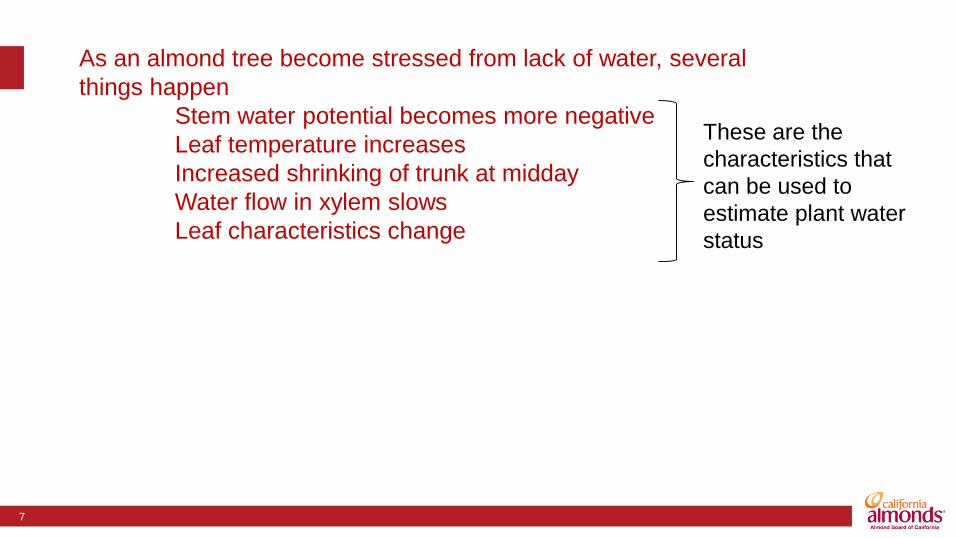
As an almond tree become stressed from lack of water, several
things happen
Stem water potential becomes more negative
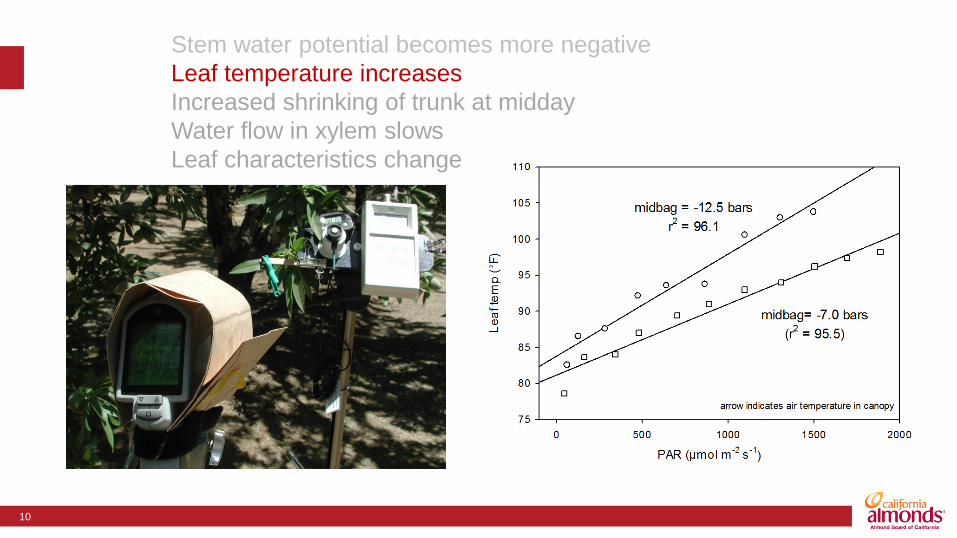
Leaf temperature increases
Increased shrinking of trunk at midday
Water flow in xylem slows
Leaf characteristics change
These are the
characteristics that
can be used to
estimate plant water
status
8
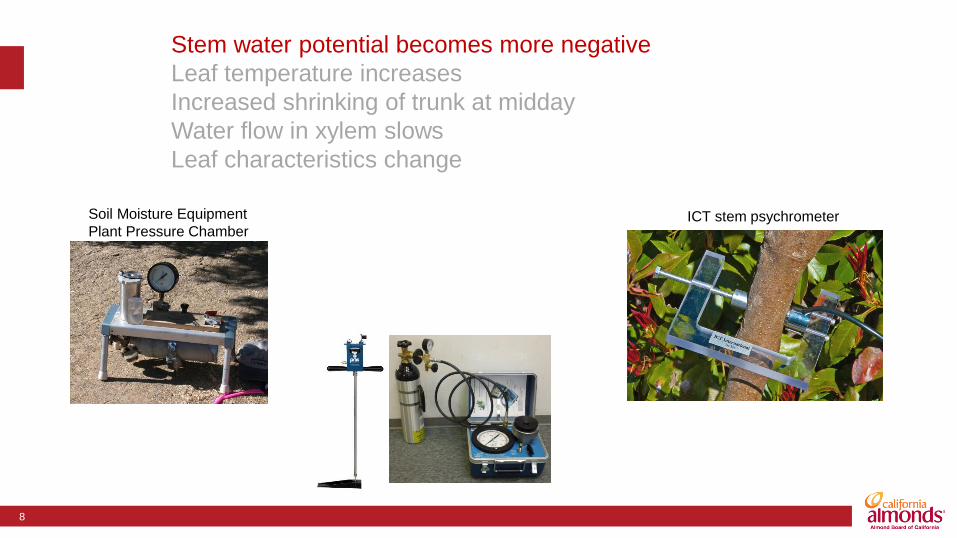
Stem water potential becomes more negative
Leaf temperature increases
Increased shrinking of trunk at midday
Water flow in xylem slows
Leaf characteristics change
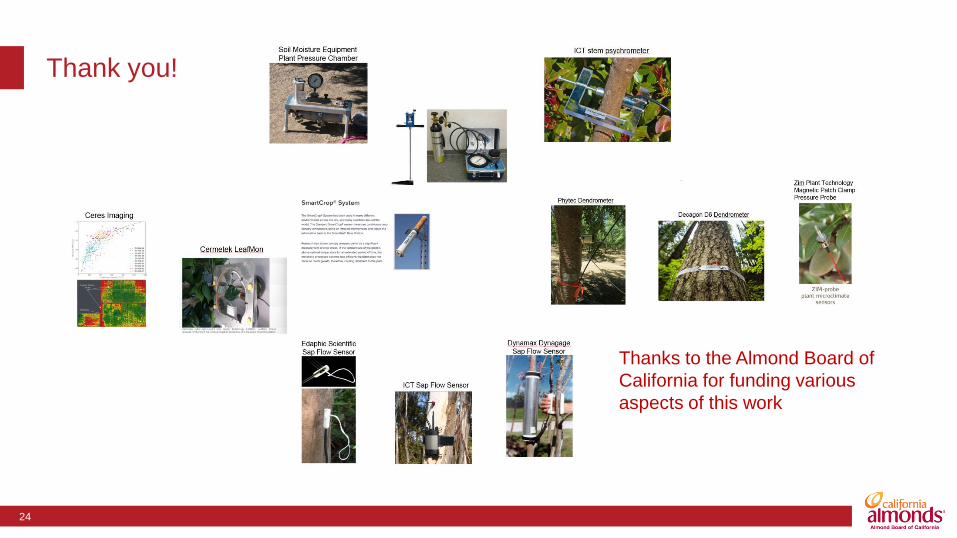
ICT stem psychrometerSoil Moisture Equipment
Plant Pressure Chamber

9
Stem water potential becomes more negative
Leaf temperature increases
Increased shrinking of trunk at midday
Water flow in xylem slows
Leaf characteristics change
Soil Moisture Equipment
Plant Pressure Chamber
Mid
da
y s
tem
wate
r pote
ntial (b
ars
)
T1 (+water, +nitrogen)
T2 (+water, -nitrogen)
T3 (-water, +nitrogen)
T4 (-water, -nitrogen)
April May June July Aug Sep-35
-30
-25
-20
-15
-10
-5
0
**
**
**
* *
**
***
100% etc
70% etc
116%
74%
110%
70%
110%
70%
Month
Mid
da
y s
tem
wa
ter
po
ten
tia
l (b
ars
)
MonthMid
da
y s
tem
wa
ter
po
ten
tia
l (b
ars
)
10
Stem water potential becomes more negative
Leaf temperature increases
Increased shrinking of trunk at midday
Water flow in xylem slows
Leaf characteristics change
11
Stem water potential becomes more negative
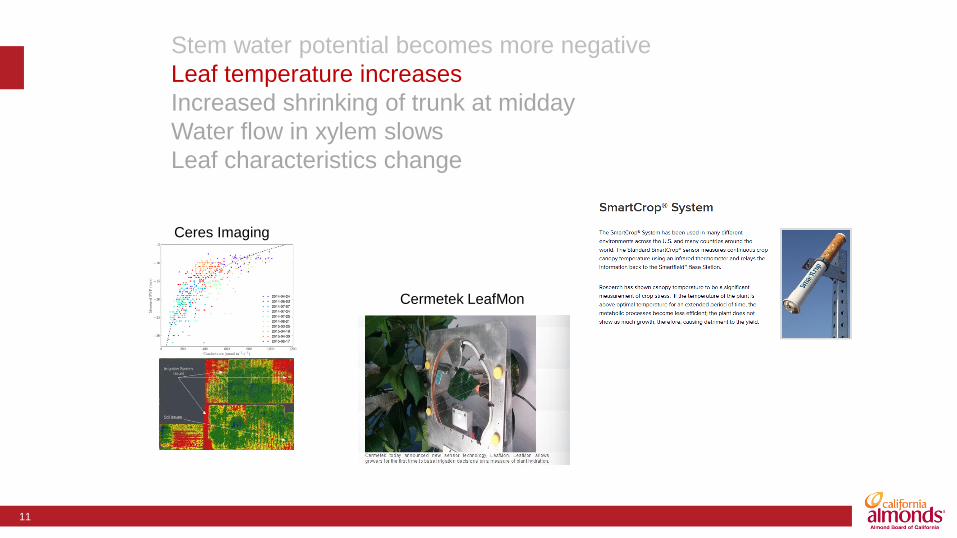
Leaf temperature increases
Increased shrinking of trunk at midday
Water flow in xylem slows
Leaf characteristics change
Cermetek LeafMon
Ceres Imaging
12
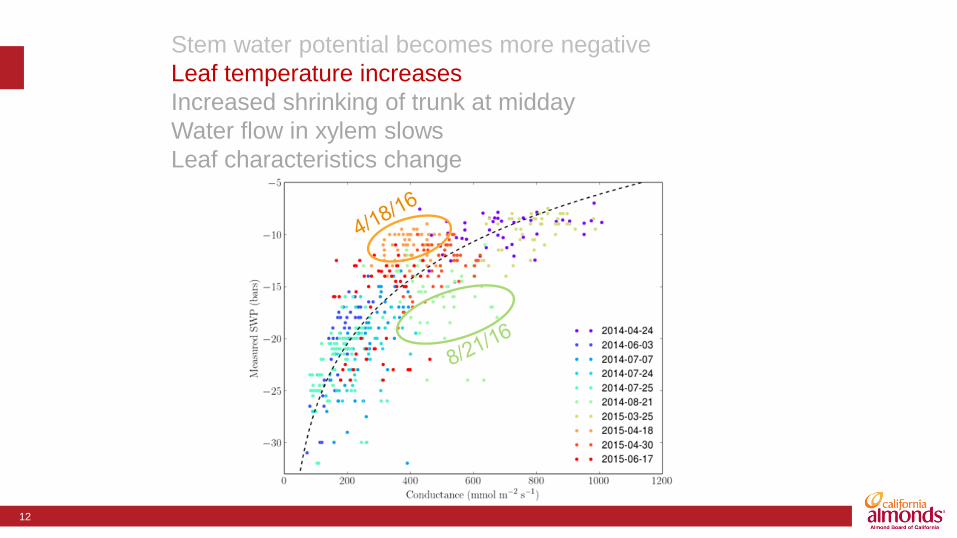
Stem water potential becomes more negative
Leaf temperature increases
Increased shrinking of trunk at midday
Water flow in xylem slows
Leaf characteristics change
13
Stem water potential becomes more negative
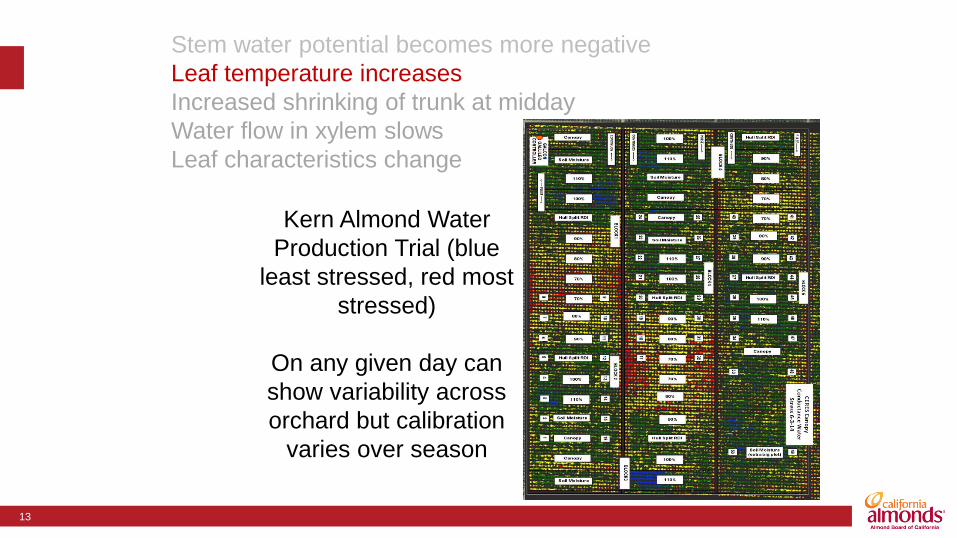
Leaf temperature increases
Increased shrinking of trunk at midday
Water flow in xylem slows
Leaf characteristics change
Kern Almond Water
Production Trial (blue
least stressed, red most
stressed)
On any given day can
show variability across
orchard but calibration
varies over season
14
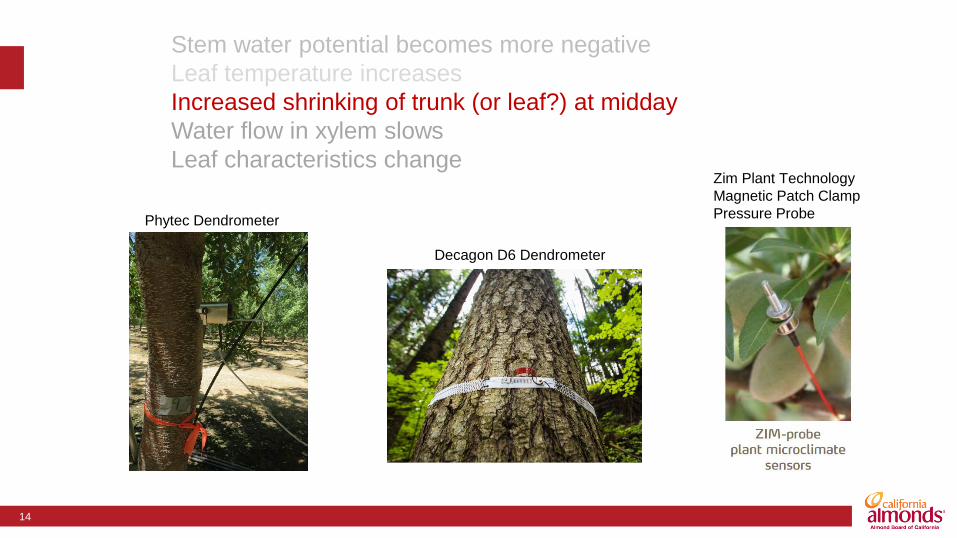
Stem water potential becomes more negative
Leaf temperature increases
Increased shrinking of trunk (or leaf?) at midday
Water flow in xylem slows
Leaf characteristics change
Phytec Dendrometer
Zim Plant Technology
Magnetic Patch Clamp
Pressure Probe
Decagon D6 Dendrometer
15
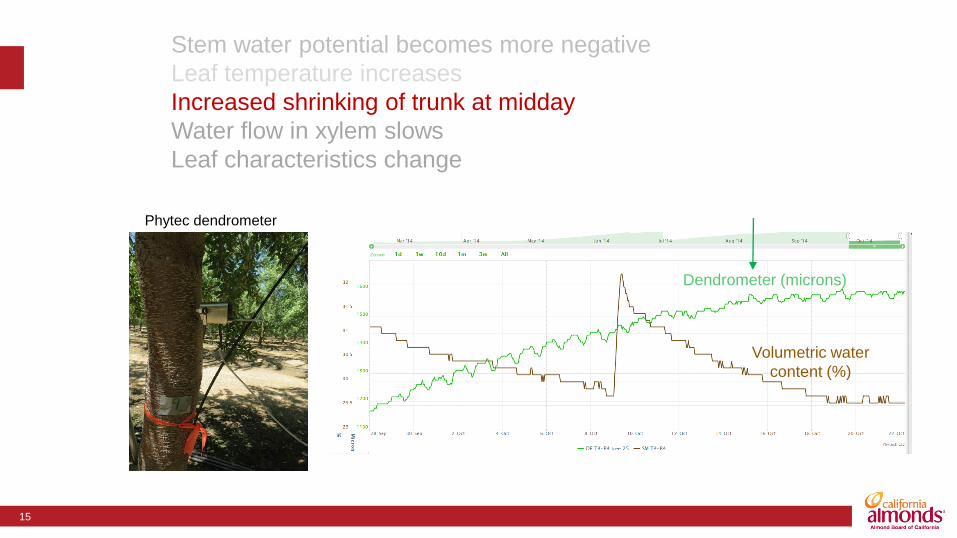
Stem water potential becomes more negative
Leaf temperature increases
Increased shrinking of trunk at midday
Water flow in xylem slows
Leaf characteristics change
Phytec dendrometer
Volumetric water
content (%)
Dendrometer (microns)

16
Stem water potential becomes more negative
Leaf temperature increases
Increased shrinking of trunk at midday
Water flow in xylem slows
Leaf characteristics change
Dynamax Dynagage
Sap Flow Sensor
ICT Sap Flow Sensor
Edaphic Scientific
Sap Flow Sensor
17
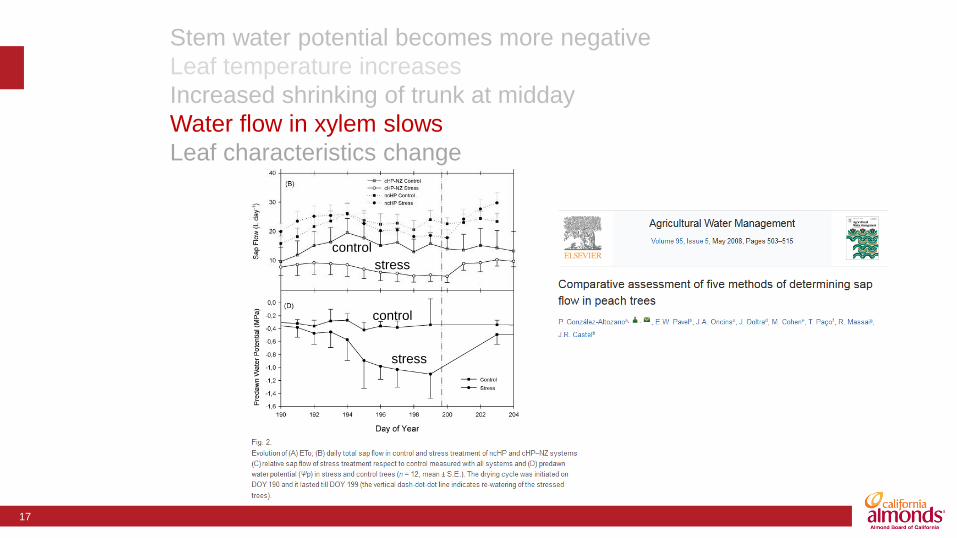
Stem water potential becomes more negative
Leaf temperature increases
Increased shrinking of trunk at midday
Water flow in xylem slows
Leaf characteristics change
control
stress
control
stress
18
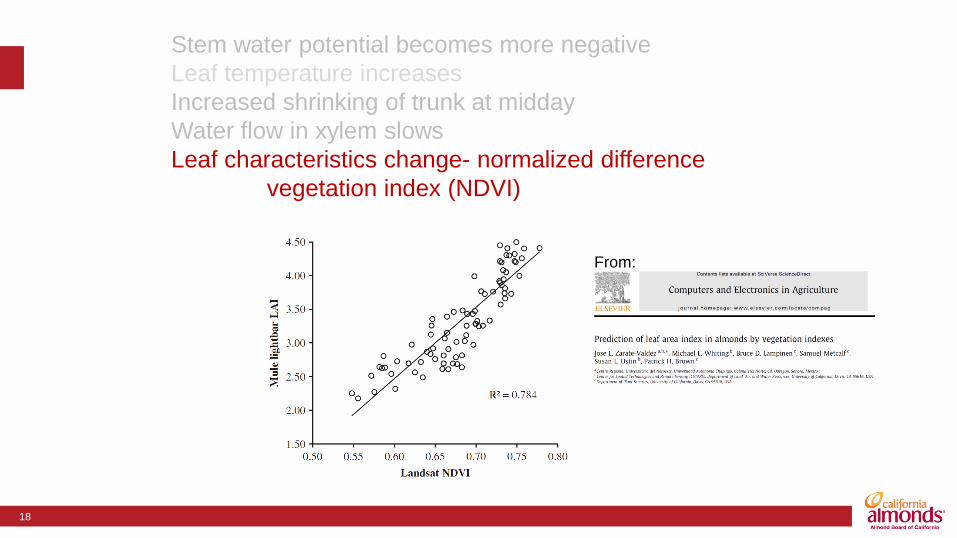
Stem water potential becomes more negative
Leaf temperature increases
Increased shrinking of trunk at midday
Water flow in xylem slows
Leaf characteristics change- normalized difference
vegetation index (NDVI)
From:
19
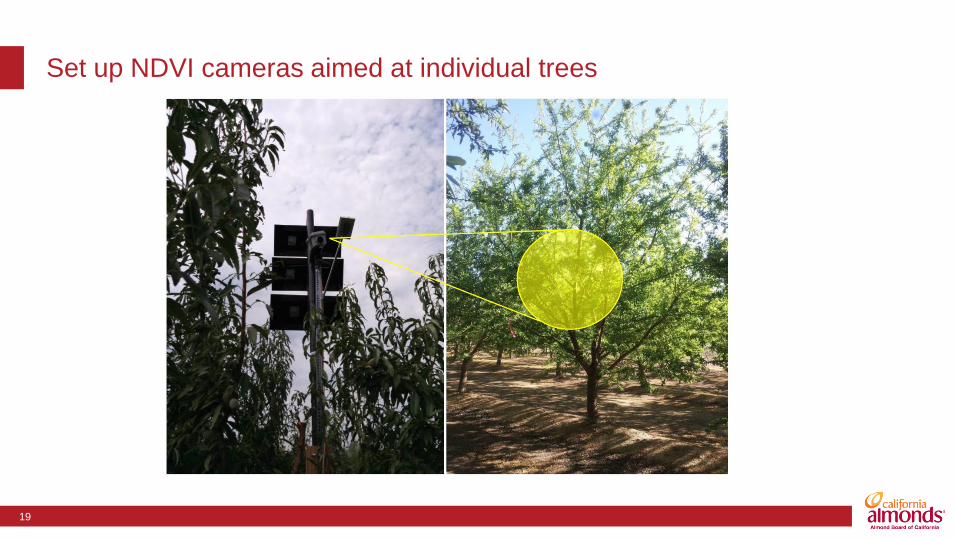
Set up NDVI cameras aimed at individual trees
20
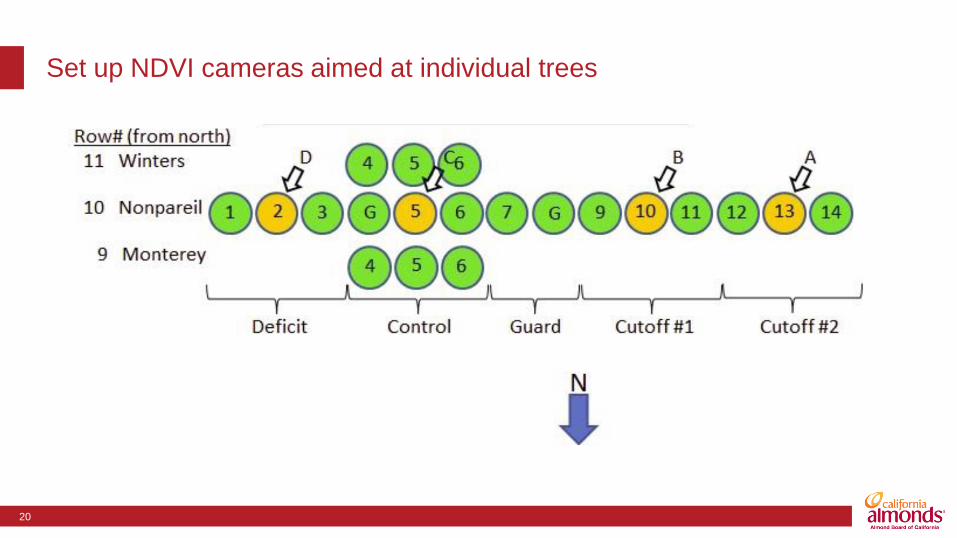
Set up NDVI cameras aimed at individual trees
21
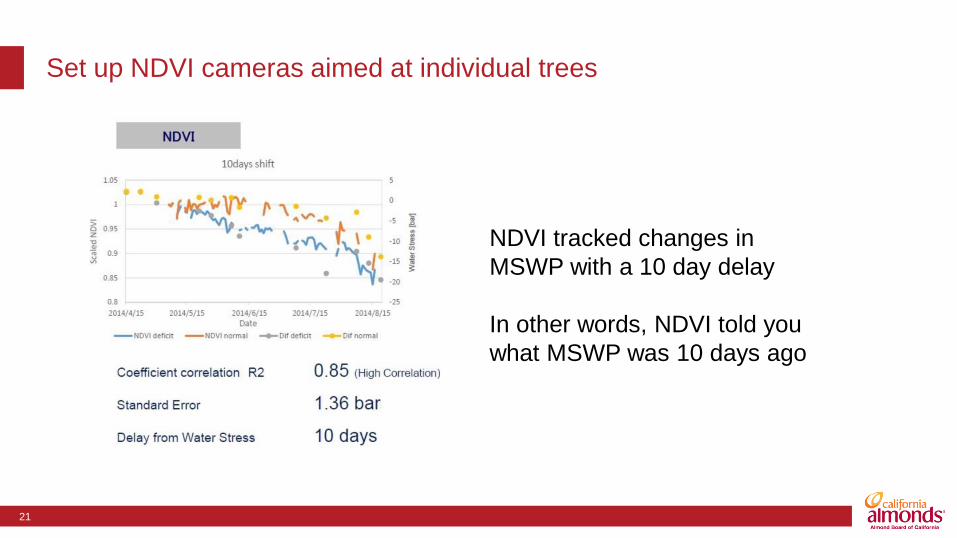
Set up NDVI cameras aimed at individual trees
NDVI tracked changes in
MSWP with a 10 day delay
In other words, NDVI told you
what MSWP was 10 days ago
22
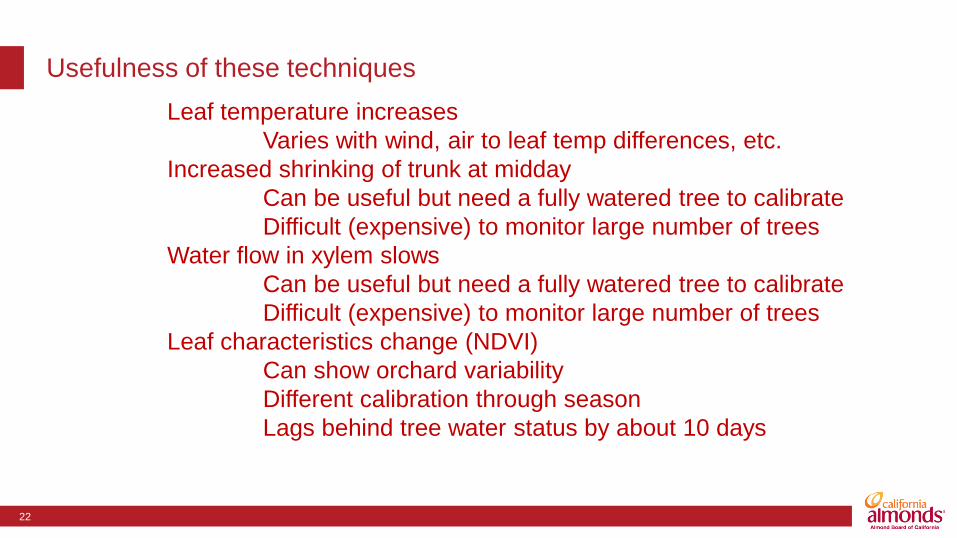
Usefulness of these techniques
Leaf temperature increases
Varies with wind, air to leaf temp differences, etc.
Increased shrinking of trunk at midday
Can be useful but need a fully watered tree to calibrate
Difficult (expensive) to monitor large number of trees
Water flow in xylem slows
Can be useful but need a fully watered tree to calibrate
Difficult (expensive) to monitor large number of trees
Leaf characteristics change (NDVI)
Can show orchard variability
Different calibration through season
Lags behind tree water status by about 10 days

23
Usefulness of these techniques
Whichever of these techniques you use, be sure to calibrate it
against stem water potential
Soil Moisture Equipment
Plant Pressure Chamber
24
Thank you!
Thanks to the Almond Board of
California for funding various
aspects of this work
Shrini Upadhyaya,
UC Davis
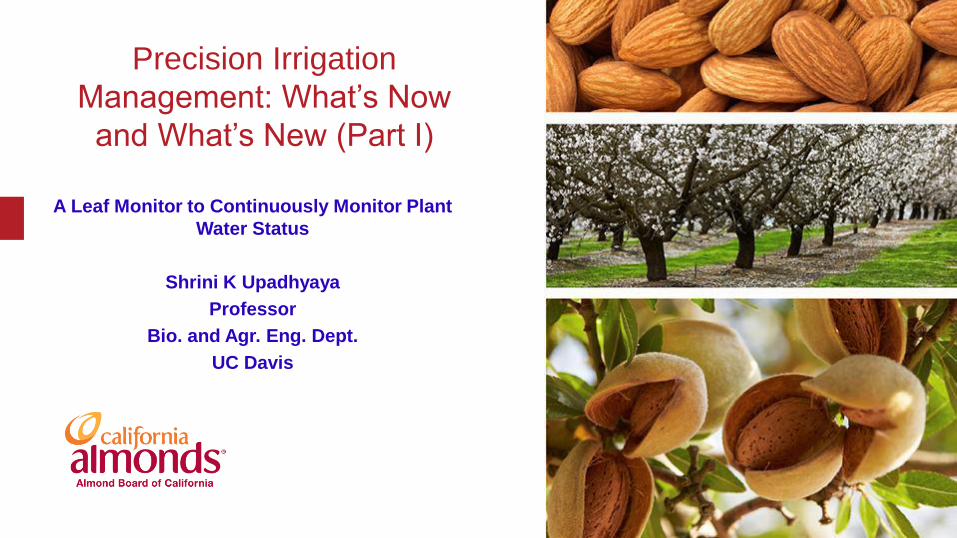
Precision Irrigation
Management: What’s Now
and What’s New (Part I)
A Leaf Monitor to Continuously Monitor Plant
Water Status
Shrini K Upadhyaya
Professor
Bio. and Agr. Eng. Dept.
UC Davis
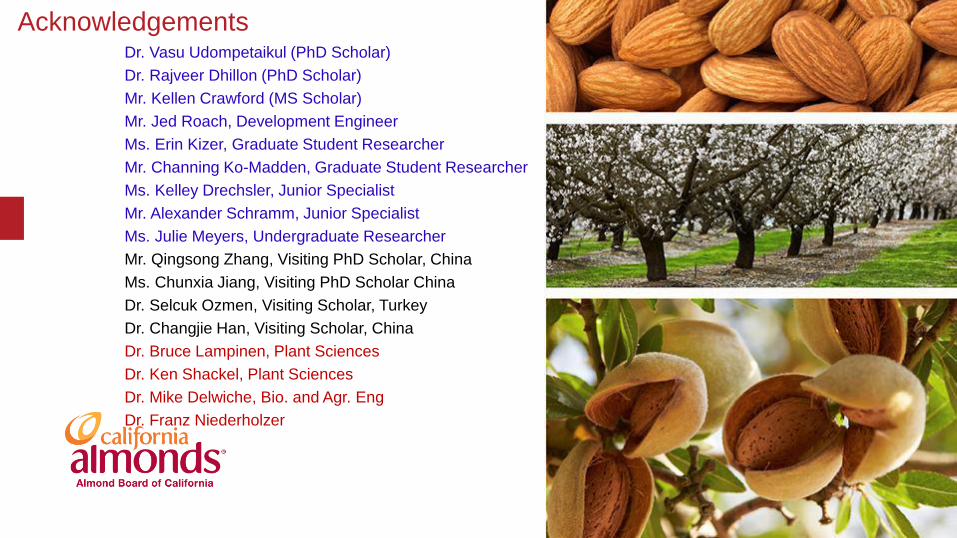
AcknowledgementsDr. Vasu Udompetaikul (PhD Scholar)
Dr. Rajveer Dhillon (PhD Scholar)
Mr. Kellen Crawford (MS Scholar)
Mr. Jed Roach, Development Engineer
Ms. Erin Kizer, Graduate Student Researcher
Mr. Channing Ko-Madden, Graduate Student Researcher
Ms. Kelley Drechsler, Junior Specialist
Mr. Alexander Schramm, Junior Specialist
Ms. Julie Meyers, Undergraduate Researcher
Mr. Qingsong Zhang, Visiting PhD Scholar, China
Ms. Chunxia Jiang, Visiting PhD Scholar China
Dr. Selcuk Ozmen, Visiting Scholar, Turkey
Dr. Changjie Han, Visiting Scholar, China
Dr. Bruce Lampinen, Plant Sciences
Dr. Ken Shackel, Plant Sciences
Dr. Mike Delwiche, Bio. and Agr. Eng
Dr. Franz Niederholzer

What Plant Physiologists recommend -
For almonds it is important to manage plant
water status
Between 12 to 14 bars pre- and post-hull
split period, and
Between 14 to 18 bars during the hull
split period
To achieve good quality, water use
efficiency, and disease resistance

Stomatal Conductance and Leaf
Temperature
Plant has
enough
water
Opens
stomata
More CO2
for Photo-
synthesis More water
vapor loss -
transpiration
Cooler leaf
temperature
Leaf
temp.
less than
air temp.
Plant is
under no
water
stressIs it that simple?
More
cooling of
leaf

Sensor Suite System
Leaf
temperature
Air
temperature
+ RH
PAR
Wind speed
Data logger
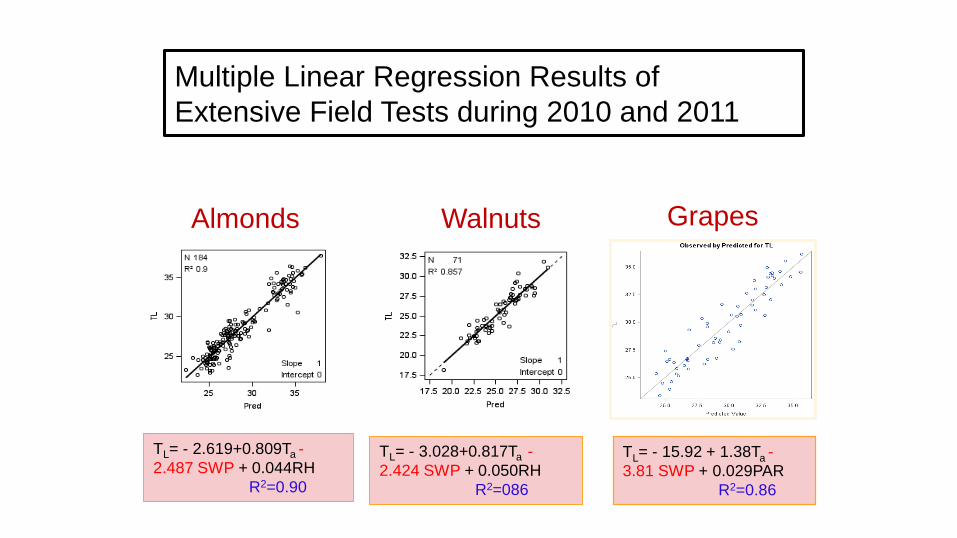
Multiple Linear Regression Results of
Extensive Field Tests during 2010 and 2011
Grapes
TL= - 2.619+0.809Ta -
2.487 SWP + 0.044RH
R2=0.90
TL= - 3.028+0.817Ta -
2.424 SWP + 0.050RH
R2=086
TL= - 15.92 + 1.38Ta -
3.81 SWP + 0.029PAR
R2=0.86
Almonds Walnuts

Further Developments
Still bulky and
needs field visitPAR
Leaf Temperature
Air Temp.
and
Relative humidity
Wind speed
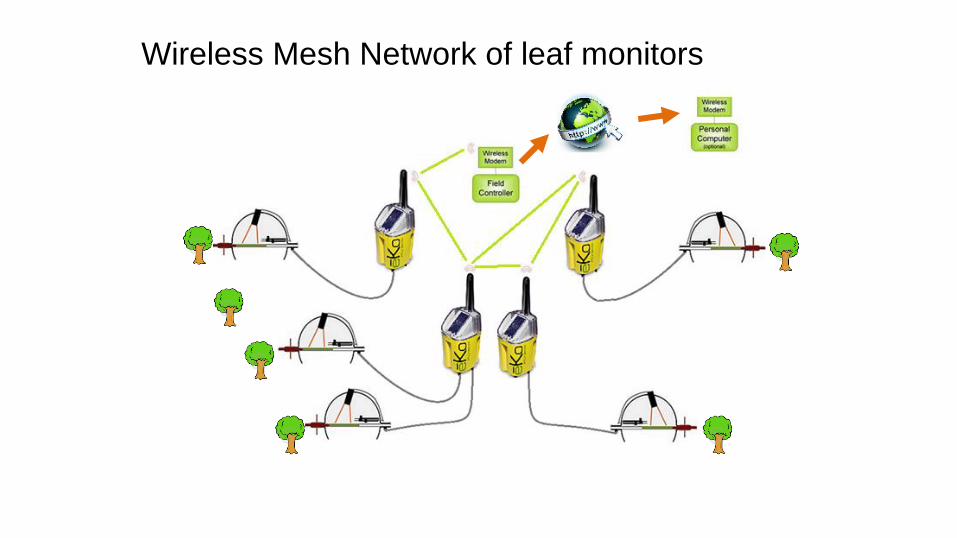
Wireless Mesh Network of leaf monitors

Status of a Plant
• A fully saturated tree/vine:
• A not so happy tree/vine:
• Representative tree/vine:
SatALDryAL
SatALAL
TTTT
TTTTCWSI
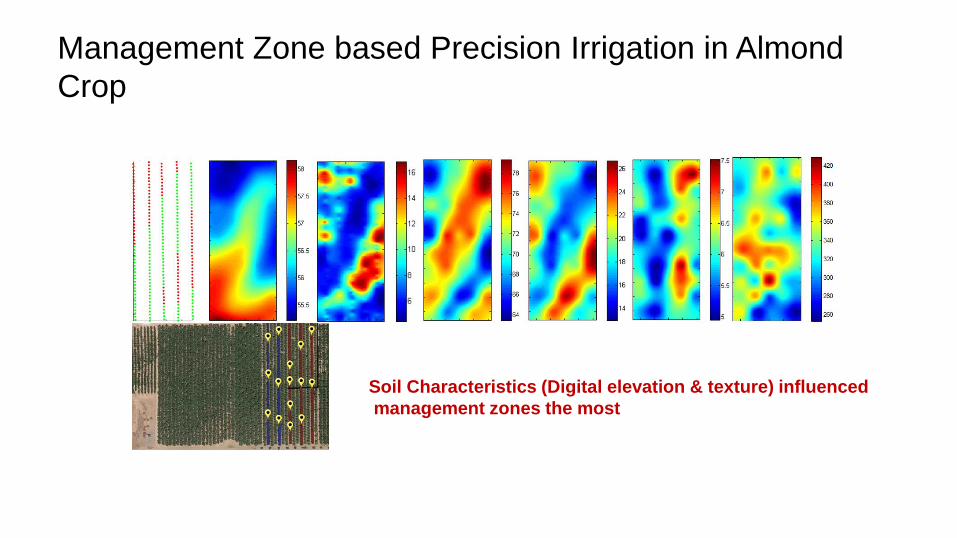
Management Zone based Precision Irrigation in Almond
Crop
Soil Characteristics (Digital elevation & texture) influenced
management zones the most
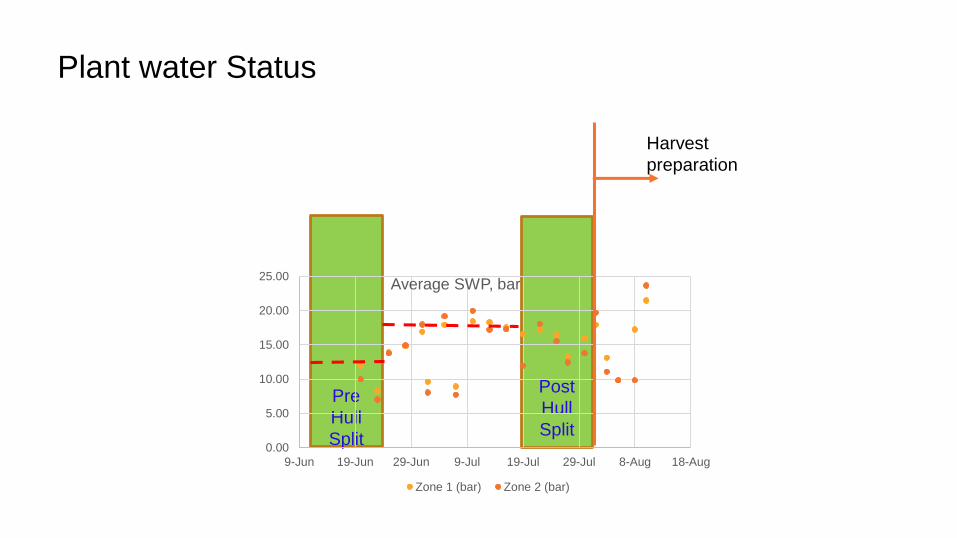
Post
Hull
Split
Pre
Hull
Split
Plant water Status
0.00
5.00
10.00
15.00
20.00
25.00
9-Jun 19-Jun 29-Jun 9-Jul 19-Jul 29-Jul 8-Aug 18-Aug
Average SWP, bar
Zone 1 (bar) Zone 2 (bar)
Harvest
preparation
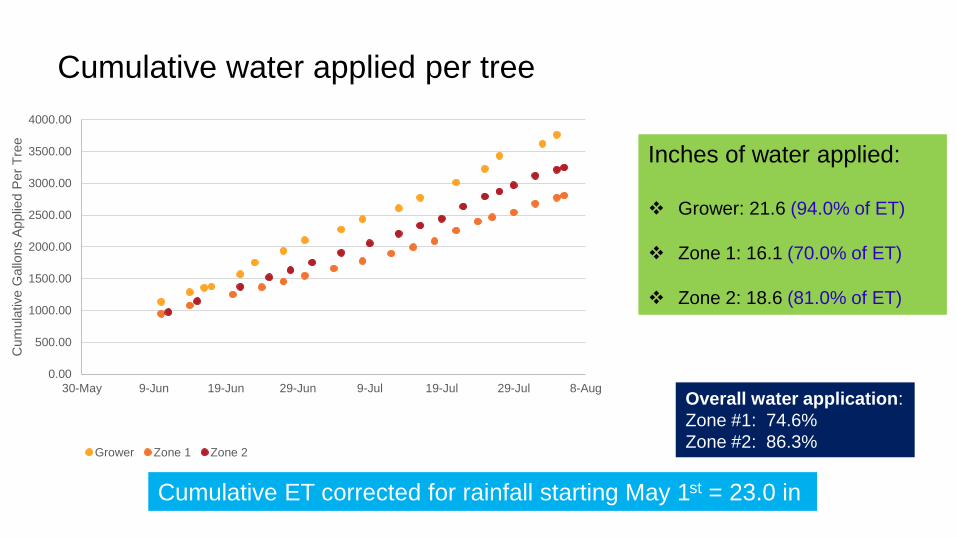
Cumulative water applied per tree
Overall water application:
Zone #1: 74.6%
Zone #2: 86.3%
0.00
500.00
1000.00
1500.00
2000.00
2500.00
3000.00
3500.00
4000.00
30-May 9-Jun 19-Jun 29-Jun 9-Jul 19-Jul 29-Jul 8-Aug
Cum
ula
tive G
allo
ns A
pplie
d P
er
Tre
e
Grower Zone 1 Zone 2
Inches of water applied:
Grower: 21.6 (94.0% of ET)
Zone 1: 16.1 (70.0% of ET)
Zone 2: 18.6 (81.0% of ET)
Cumulative ET corrected for rainfall starting May 1st = 23.0 in
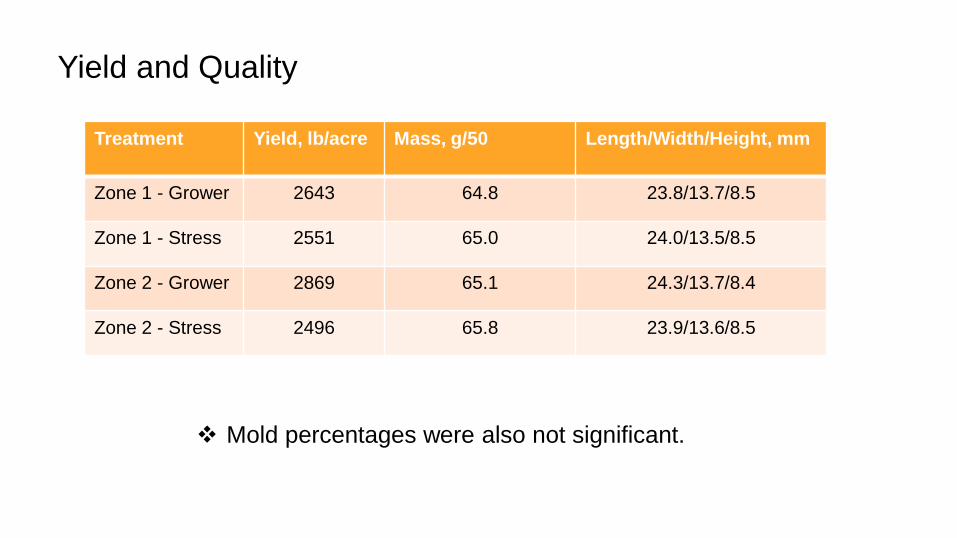
Yield and Quality
Treatment Yield, lb/acre Mass, g/50 Length/Width/Height, mm
Zone 1 - Grower 2643 64.8 23.8/13.7/8.5
Zone 1 - Stress 2551 65.0 24.0/13.5/8.5
Zone 2 - Grower 2869 65.1 24.3/13.7/8.4
Zone 2 - Stress 2496 65.8 23.9/13.6/8.5
Mold percentages were also not significant.

Ken Shackel,
UC Davis

Precision Irrigation
Management: What’s Now
and What’s New (Part 1)
Ken Shackel
Water production function research
42
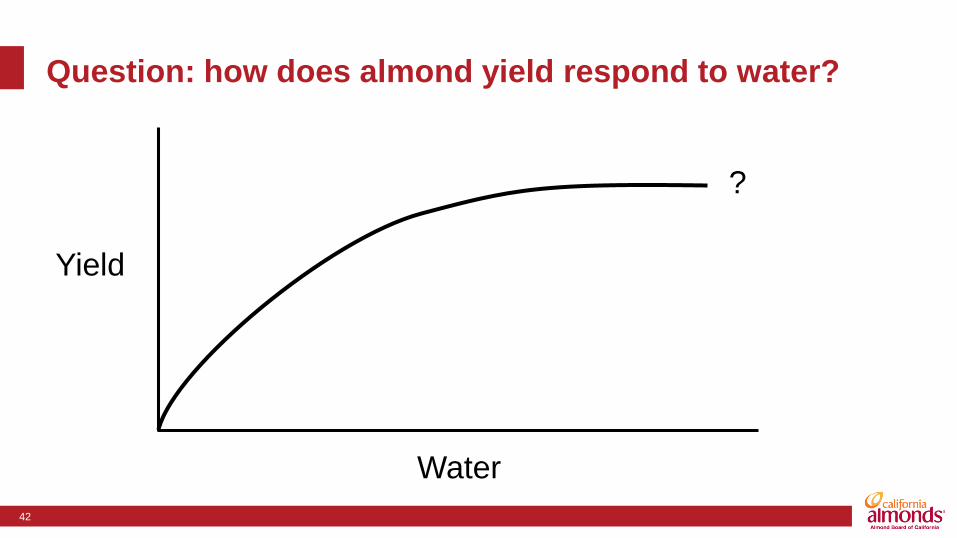
Question: how does almond yield respond to water?
How much irrigation is required for maximum yield?
Is it the same on different soils?
Do you get the same ‘crop per drop’ as irrigation increases?
…etc…
Best estimate so far: about 70 kernel pounds per acre
increase for every inch of water
Yield
Water
?

43
Summary (c/o B. Lampinen) of Previous Almond Research
Relating Yield to PAR and Applied Irrigation Water
PAR (shade):
• More shade on the ground
means that trees are collecting
and using more sunlight to grow
the crop.
• Good orchards can achieve
about 50 kernel pounds for every
1% of ground shaded (PAR).
• Average orchards are around 38
kernel pounds per 1% PAR
44
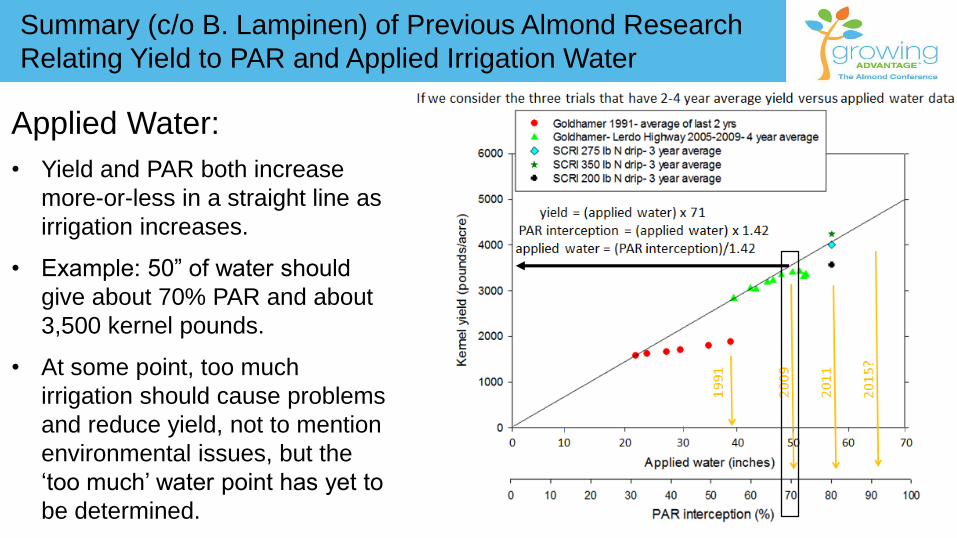
Summary (c/o B. Lampinen) of Previous Almond Research
Relating Yield to PAR and Applied Irrigation Water
Applied Water:
• Yield and PAR both increase
more-or-less in a straight line as
irrigation increases.
• Example: 50” of water should
give about 70% PAR and about
3,500 kernel pounds.
• At some point, too much
irrigation should cause problems
and reduce yield, not to mention
environmental issues, but the
‘too much’ water point has yet to
be determined.

Almond Water Production Function Project
• 3 sites.
• 3-4 irrigation levels per site,
range: 70% to 110% ET.
• Irrigation treatments since
2013.
• Yield since 2012 (pre-
treatment).
4000
3000
2000
10002012 2013 2014 2015 2016
Kern
el pounds p
er
acre
Year
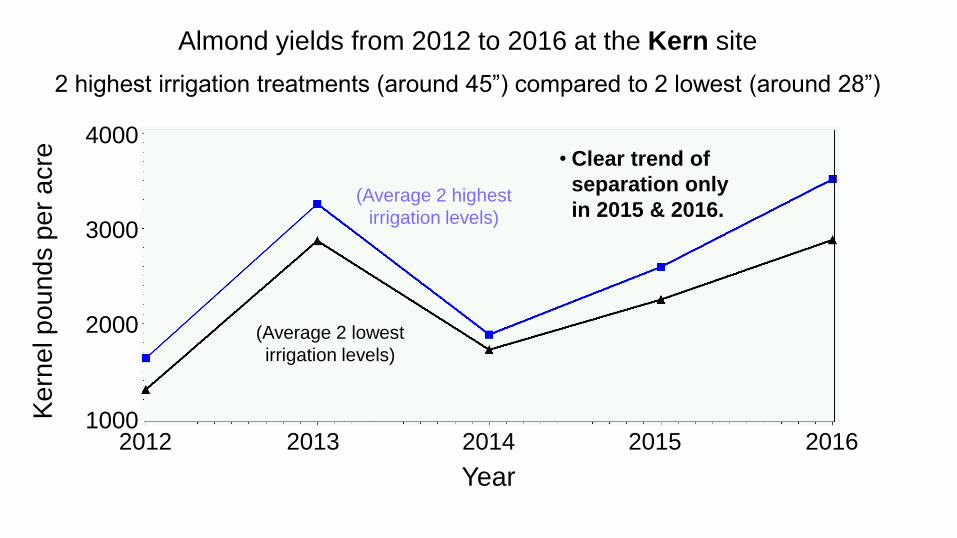
Almond yields from 2012 to 2016 at the Kern site
2 highest irrigation treatments (around 45”) compared to 2 lowest (around 28”)
(Average 2 highest
irrigation levels)
(Average 2 lowest
irrigation levels)
• Clear trend of
separation only
in 2015 & 2016.
4000
3000
2000
10002012 2013 2014 2015 2016
Kern
el pounds p
er
acre
Year
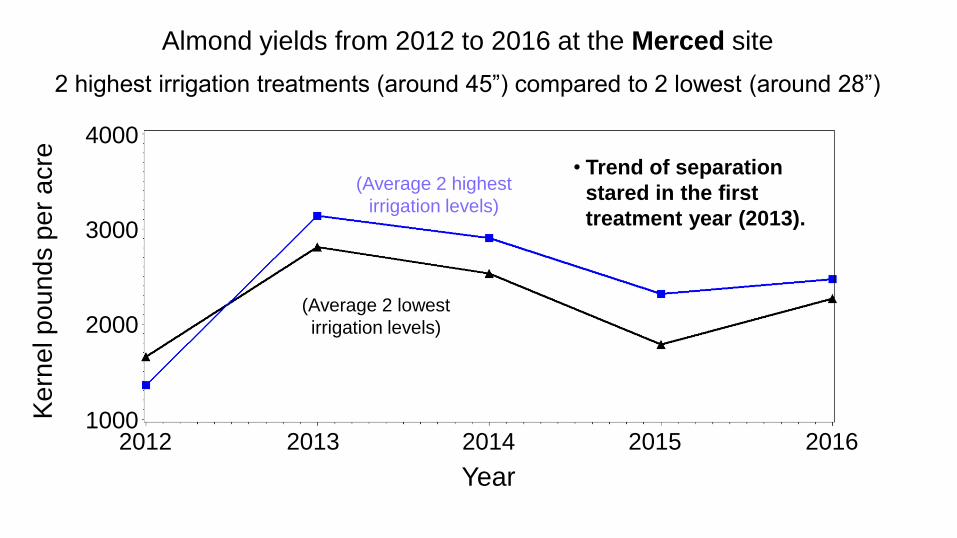
Almond yields from 2012 to 2016 at the Merced site
2 highest irrigation treatments (around 45”) compared to 2 lowest (around 28”)
(Average 2 highest
irrigation levels)
(Average 2 lowest
irrigation levels)
• Trend of separation
stared in the first
treatment year (2013).
4000
3000
2000
10002012 2013 2014 2015 2016
Kern
el pounds p
er
acre
Year
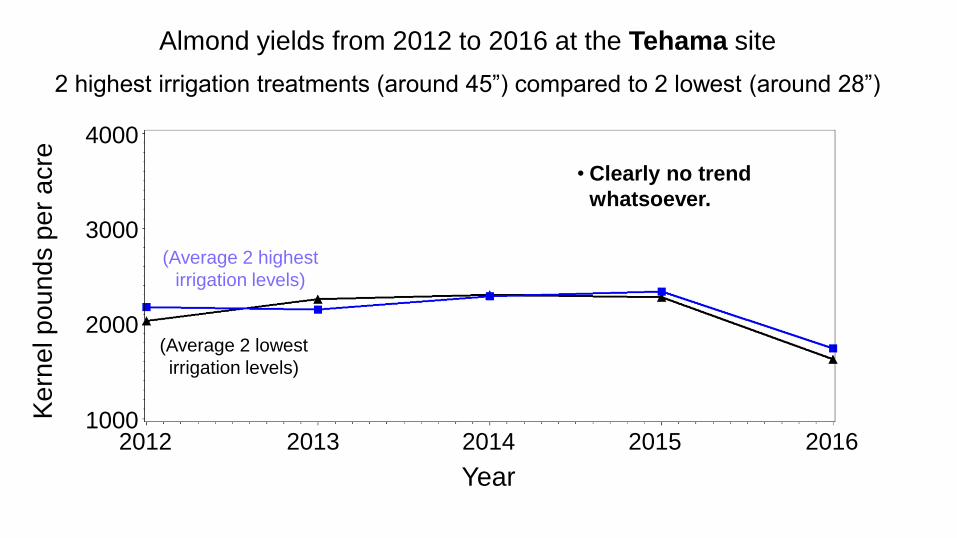
Almond yields from 2012 to 2016 at the Tehama site
2 highest irrigation treatments (around 45”) compared to 2 lowest (around 28”)
(Average 2 highest
irrigation levels)
(Average 2 lowest
irrigation levels)
• Clearly no trend
whatsoever.

20 30 40 50 60 70
4000
3000
2000
1000
0
Kern
el pounds p
er
acre
Seasonal applied Irrigation + Rain + Soil Depletion (inches)
Almond yield response to water at the Kern site(2014-2016)
2015
2014
2016• Upward trend every year,
with more-or-less the same
response to water (parallel
lines) each year.
20 30 40 50 60 70
4000
3000
2000
1000
0
Kern
el pounds p
er
acre
Seasonal applied Irrigation + Rain + Soil Depletion (inches)
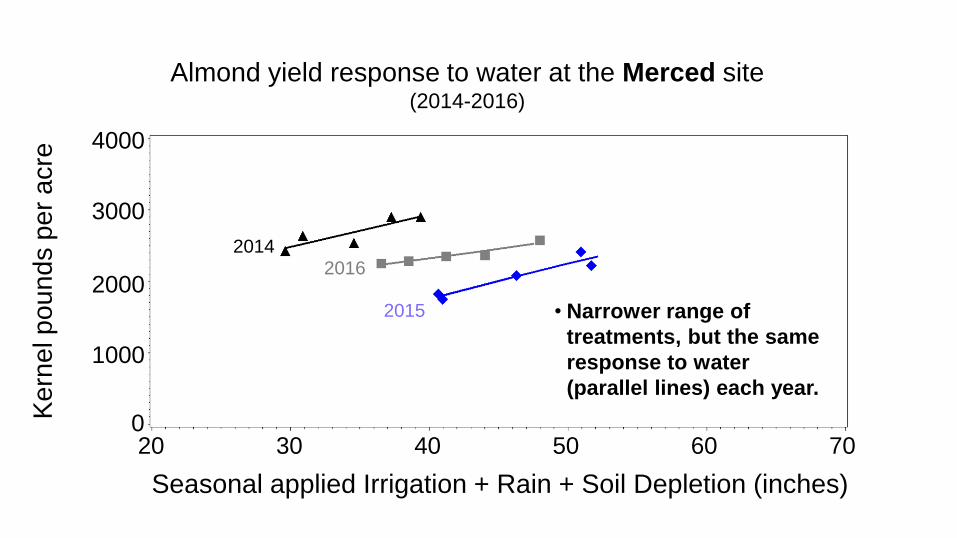
Almond yield response to water at the Merced site(2014-2016)
2015
20142016
• Narrower range of
treatments, but the same
response to water
(parallel lines) each year.
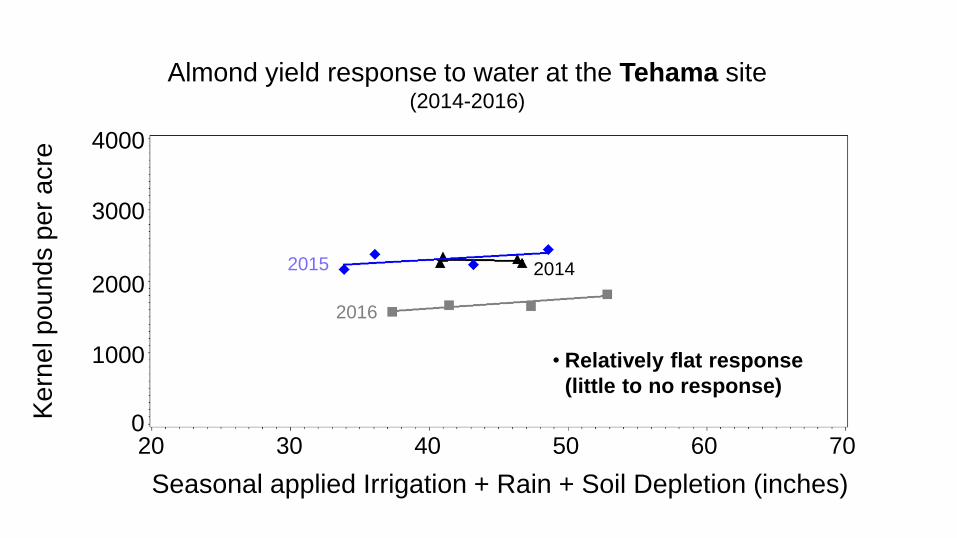
20 30 40 50 60 70
4000
3000
2000
1000
0
Kern
el pounds p
er
acre
Seasonal applied Irrigation + Rain + Soil Depletion (inches)
Almond yield response to water at the Tehama site(2014-2016)
2015 2014
2016
• Relatively flat response
(little to no response)
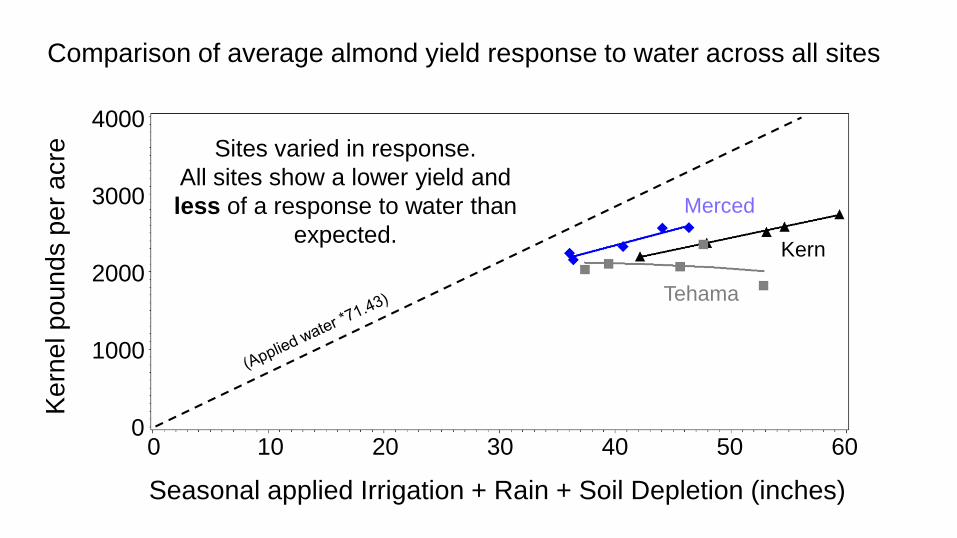
4000
3000
2000
1000
010 30 40 50 60200
Seasonal applied Irrigation + Rain + Soil Depletion (inches)
Ke
rne
l p
ou
nd
s p
er
acre
Comparison of average almond yield response to water across all sites
Merced
Kern
Tehama
Sites varied in response.
All sites show a lower yield and
less of a response to water than
expected.
53
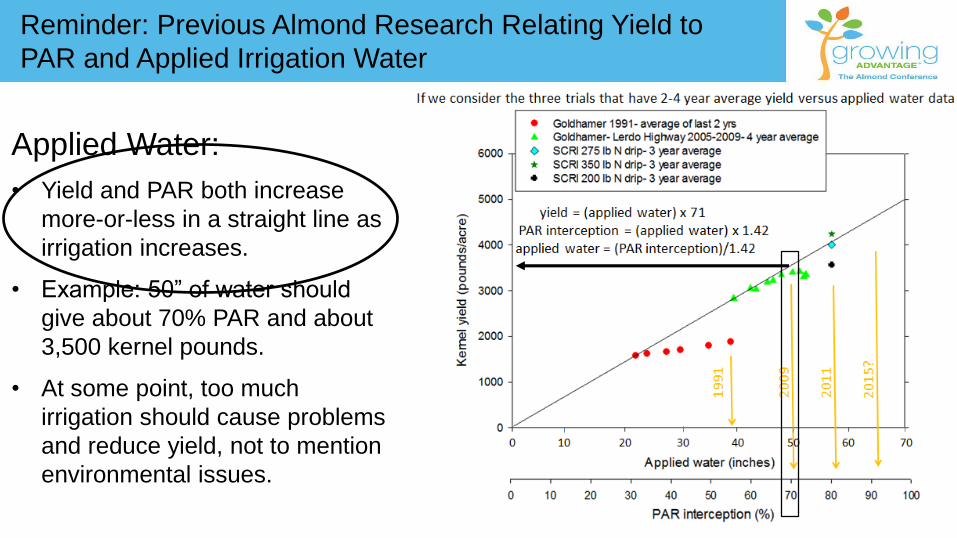
Reminder: Previous Almond Research Relating Yield to
PAR and Applied Irrigation Water
Applied Water:
• Yield and PAR both increase
more-or-less in a straight line as
irrigation increases.
• Example: 50” of water should
give about 70% PAR and about
3,500 kernel pounds.
• At some point, too much
irrigation should cause problems
and reduce yield, not to mention
environmental issues.
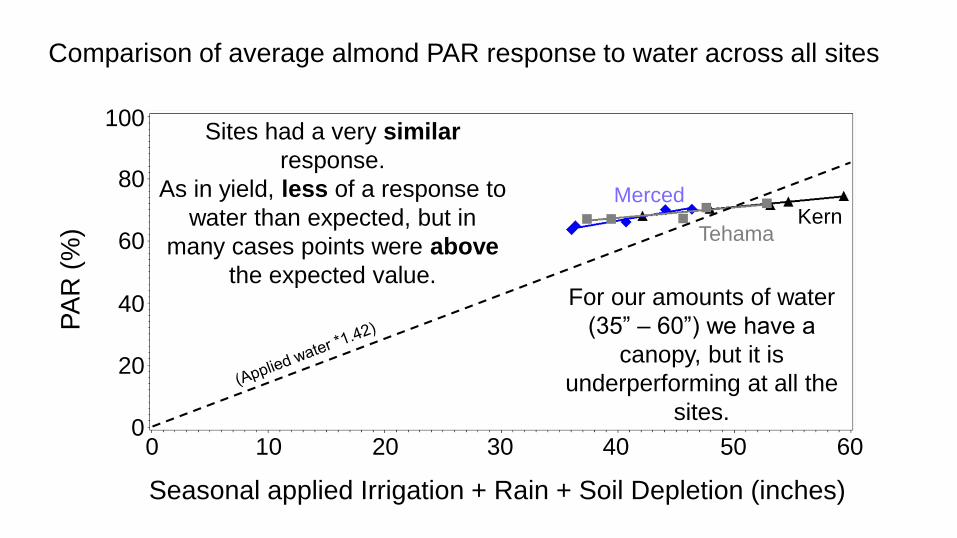
80
60
40
20
010 30 40 50 60200
Seasonal applied Irrigation + Rain + Soil Depletion (inches)
PA
R (
%)
Comparison of average almond PAR response to water across all sites
MercedKern
Tehama
Sites had a very similar
response.
As in yield, less of a response to
water than expected, but in
many cases points were above
the expected value.
100
For our amounts of water
(35” – 60”) we have a
canopy, but it is
underperforming at all the
sites.

• Orchards with the
same PAR should
require about the same
amount of irrigation.
• These data indicate
that yields for the
same PAR can be
substantially different.
• Making gains in water
productivity will
probably require us to
determine why
orchards with a
sufficient canopy are
not generating high
yields.

56
Conclusions
• At all sites, the trees have consistently responded to irrigation in
terms of their physiological water stress levels starting on the first
year of irrigation treatments.
• Despite this, across a relatively wide range of seasonal water
regimes (35” to 60”) we have only seen modest increases in yield,
on average giving about 35 kernel pounds of additional yield per
acre for every additional inch of water.
• Nonpareil yield at the Tehama site has been largely unresponsive to
water, but the Monterey yield at that location has shown a similar
response to Nonpareil at the other sites.
• Together, these indicate that a factor/s other than water stress may
be preventing yields from reaching their potential.

57
Thanks to my cooperators:
Dave Doll
Allan Fulton
Bruce Lampinen
Blake Sanden
Sam Metcalf
Thanks for your support and attention!

Questions?