Precipitation on ridges - infosys.ars.usda.gov · ,4BSTRACE The influence of precipitation on soil...
3
Precipitation e s on ridges created by Leon Lyles and John Tatarko ,4BSTRACE The influence of precipitation on soil ridge height persistence was measured at 15 sites in five counties across Kansas. Multiple regression equations were developed to describe how ridges created by grain drills change in height over time. Cumulative precipitation was the major factor affecting ridge persistence. Secondary factors were soil texture (sand, silt, clay), soil organic matter, and exchangeable calcium. These results will be useful in modeling wind erosion across ridged surfaces and in determining the soil ridge roughness factor in the present wind erosion equation. URFACE ridges prewnt or reduce wind S erosion by influencing soil particle transport in the saltation and surface creep modes. Ridges properly oriented to wind di- rection trap saltation and surface creep ag- gregates and affect both mean and turbulent wind flow profiles over the ridges. Ridge height influences trapping efficien- cy and sheltered trapping volume, which may determine if ridges fail during erosive storms on long fields (4). Wind tunnel work by Armbrust and associates (1) led to devel- opment of a relationship between ridge height and spacing and the soil ridge rough- ness factor, K, in the wind erosion equation (5). The K factor is a measure of the effect of ridges on erosion rates compared with a smooth (nonridged) surface. Because rainfall dissipates soil ridges cre- ated by tillage operations, we sought to determine how long ridges created by grain Leon Lyles is a research leader with the Agri- cultural Research Service, U.S. Department of Agriculture, and John Tatarko is a research assis- tant in the Agronomy Department, Kansas State University, Manhattan, 66506. This article is a contribution from the U.S. Department of Agri- culture, Agricultural Research Service, in coop- eration with the Department of Agronomy and the Kansas Agricultural Experiment Station, Con- tribution Number 87-41-1. drills persist for several soil textures and rain- fall regimes. Study methods In 1983-1984 we selected three sites of dif- ferent soil textures in Riley County, Kansas. To establish different rainfall regimes, we selected two sites per county in 1984-1985 in Bourbon, Riley, Russell, Ford, and Stan- ton Counties, spanning Kansas from east to west. In 1985-1986 we selected two sites in Riley County. We installed height measur- ing devices across three or four drill ridges after seeding winter wheat with disk or hoe- type drills. Wheat was planted in the fur- rows. No additional surface cover was pre- sent. We used two or three replications on each soil. We measured ridge-furrow heights to the nearest 0.5 mm following fall wheat seeding (usually in October) and four to eight more times until about the first week in May of the next year. We made the measurements in Riley County (1983-1986). Measurements in the other four counties were made by Soil Conservation Service personnel (1984-1985). We installed rainfall gauges at each soil site in Riley County; rainfall data for the other counties came from the nearest gaug- ing station. Reprinted from the Journal of Soil and Water Conservation July-August 1987, Volume 42, Number 4 Copyright 1987 Soil Conservation Society of America From surface soil samples (0-8 cm), we determined particle size distribution (sand, silt, clay) using standard pipette methods (Table 1). Organic matter and exchangeable calcium were determined by the Kansas State University Soil Testing Laboratory. Results and discussion We correlated the main variables (Table 1) and their interactionswith two dependent variables using stepwise multiple regression techniques. The first dependent variable was the ratio of ridge height at any given time after drilling to the original ridge height (HilHo). The best one-, two-, and three-variable regression equations, using data from all sites, were as follows: Hi/Ho = 0.9948 - 0.1087 (Pc)"."; Hi/Ho = 1.0269 - 0.1106 (Pc)"~ Hi/Ho = 1.0754 - 0.1095 (PC)".~ - 0.0197 S/Si - 0.0067 (OM)2; where Pc = cumulative precipitation (cm), S = sand content (%), Si = silt content (%), and OM = organic matter (%). We separated the Riley County data from the other data and repeated the regression procedures because there were 3 years of data available, all collected by the same per- son, and precipitation was measured on-site. Corresponding single- and two-variable re- gression equations were as follows: r2 = .714 111 - 0.0146 S/Si; R2 = [21 .749 R2 = .781 [31 Hi/Ho = 1.0181 - 0.1464 (Pc)"~; Hi/Ho = 1.0582 - 0.1417 (Pc)"~ r2 = .903 [41 - 3~10.~ SSiCa; R2 = .932 [51 where Ca is exchangeable calcium (ppm). As expected, cumulative precipitation was the primary factor influencing changes in ridge height over time. However, secondary soil properties were highly significant in ac- counting for variation in ridge height, es- pecially when all the sites were included in the analyses (Equations 2 and 3). These re- sults agree with those of Dexter (3), who related changes in random roughness cre- ated by tillage in Australia to cumulative kinetic energy of rainfall. That parameter may describe rainfall effects on ridges bet- ter than cumulative precipitation, but rain- fall intensity data were not available in our study. Also, it is not clear how kinetic energy can be used when part of the precipitation occurs as snow, as it did in our study. Re- gardless, we obtained good correlations with Pc, which is much easier to determine than kinetic energy. Figure 1 shows the Riley County data used in developing equation 4. The soil ridge roughness factor, K, in the wind erosion equation is a function of a
-
Upload
hoanghuong -
Category
Documents
-
view
215 -
download
0
Transcript of Precipitation on ridges - infosys.ars.usda.gov · ,4BSTRACE The influence of precipitation on soil...
Precipitation e s on ridges created by Leon Lyles and John Tatarko
,4BSTRACE The influence of precipitation on soil ridge height persistence was measured at 15 sites in five counties across Kansas. Multiple regression equations were developed to describe how ridges created by grain drills change in height over time. Cumulative precipitation was the major factor affecting ridge persistence. Secondary factors were soil texture (sand, silt, clay), soil organic matter, and exchangeable calcium. These results will be useful in modeling wind erosion across ridged surfaces and in determining the soil ridge roughness factor in the present wind erosion equation.
URFACE ridges prewnt or reduce wind S erosion by influencing soil particle transport in the saltation and surface creep modes. Ridges properly oriented to wind di- rection trap saltation and surface creep ag- gregates and affect both mean and turbulent wind flow profiles over the ridges.
Ridge height influences trapping efficien- cy and sheltered trapping volume, which may determine if ridges fail during erosive storms on long fields (4) . Wind tunnel work by Armbrust and associates (1) led to devel- opment of a relationship between ridge height and spacing and the soil ridge rough- ness factor, K, in the wind erosion equation (5) . The K factor is a measure of the effect of ridges on erosion rates compared with a smooth (nonridged) surface.
Because rainfall dissipates soil ridges cre- ated by tillage operations, we sought to determine how long ridges created by grain
Leon Lyles is a research leader with the Agri- cultural Research Service, U.S. Department of Agriculture, and John Tatarko is a research assis- tant in the Agronomy Department, Kansas State University, Manhattan, 66506. This article is a contribution from the U.S. Department of Agri- culture, Agricultural Research Service, in coop- eration with the Department of Agronomy and the Kansas Agricultural Experiment Station, Con- tribution Number 87-41-1.
drills persist for several soil textures and rain- fall regimes.
Study methods
In 1983-1984 we selected three sites of dif- ferent soil textures in Riley County, Kansas. To establish different rainfall regimes, we selected two sites per county in 1984-1985 in Bourbon, Riley, Russell, Ford, and Stan- ton Counties, spanning Kansas from east to west. In 1985-1986 we selected two sites in Riley County. We installed height measur- ing devices across three or four drill ridges after seeding winter wheat with disk or hoe- type drills. Wheat was planted in the fur- rows. No additional surface cover was pre- sent. We used two or three replications on each soil.
We measured ridge-furrow heights to the nearest 0.5 mm following fall wheat seeding (usually in October) and four to eight more times until about the first week in May of the next year. We made the measurements in Riley County (1983-1986). Measurements in the other four counties were made by Soil Conservation Service personnel (1984-1985).
We installed rainfall gauges at each soil site in Riley County; rainfall data for the other counties came from the nearest gaug- ing station.
Reprinted from the Journal of Soil and Water Conservation July-August 1987, Volume 42, Number 4
Copyright 1987 Soil Conservation Society of America
From surface soil samples (0-8 cm), we determined particle size distribution (sand, silt, clay) using standard pipette methods (Table 1). Organic matter and exchangeable calcium were determined by the Kansas State University Soil Testing Laboratory.
Results and discussion
We correlated the main variables (Table 1) and their interactions with two dependent variables using stepwise multiple regression techniques. The first dependent variable was the ratio of ridge height at any given time after drilling to the original ridge height (HilHo). The best one-, two-, and three-variable regression equations, using data from all sites, were as follows:
Hi/Ho = 0.9948 - 0.1087 (Pc)".";
Hi/Ho = 1.0269 - 0.1106 (Pc)"~
Hi/Ho = 1.0754 - 0.1095 (PC)".~ - 0.0197 S/Si - 0.0067 (OM)2;
where Pc = cumulative precipitation (cm), S = sand content (%), Si = silt content (%), and OM = organic matter (%).
We separated the Riley County data from the other data and repeated the regression procedures because there were 3 years of data available, all collected by the same per- son, and precipitation was measured on-site. Corresponding single- and two-variable re- gression equations were as follows:
r2 = .714 111
- 0.0146 S/Si; R2 = [21 .749
R2 = .781 [31
Hi/Ho = 1.0181 - 0.1464 (Pc)"~;
Hi/Ho = 1.0582 - 0.1417 (Pc)"~ r2 = .903 [41
- 3 ~ 1 0 . ~ SSiCa; R2 = .932 [51 where Ca is exchangeable calcium (ppm).
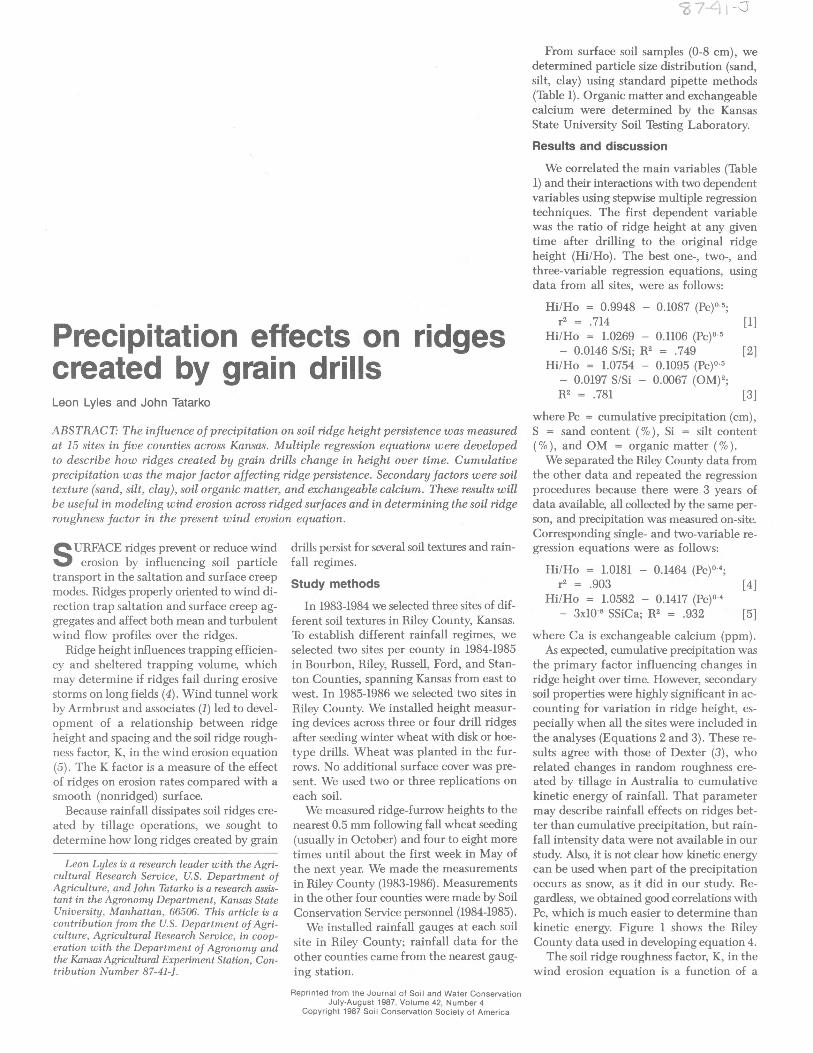
As expected, cumulative precipitation was the primary factor influencing changes in ridge height over time. However, secondary soil properties were highly significant in ac- counting for variation in ridge height, es- pecially when all the sites were included in the analyses (Equations 2 and 3). These re- sults agree with those of Dexter (3), who related changes in random roughness cre- ated by tillage in Australia to cumulative kinetic energy of rainfall. That parameter may describe rainfall effects on ridges bet- ter than cumulative precipitation, but rain- fall intensity data were not available in our study. Also, it is not clear how kinetic energy can be used when part of the precipitation occurs as snow, as it did in our study. Re- gardless, we obtained good correlations with Pc, which is much easier to determine than kinetic energy. Figure 1 shows the Riley County data used in developing equation 4.
The soil ridge roughness factor, K, in the wind erosion equation is a function of a

e
0 4 . 1. 2. f. I . 5 .
I (CUMULATIVE PRECIPITATION).^ - p S . e m
Figure 1. Changes in drill ridge heights due to precipitation, Riley County, Kansas, 1983-1986.
measure of ridge roughness, Kr (5) , which is determined from the equation Kr =
4H2/A, [SI where H = ridge height (cm) and A = ridge spacing (cm). From the height- spacing measurement at each site, we cal- culated Kr and correlated this second de- pendent variable with the same variables as the Hi/Ho ratio using the same regression procedures. The regression equations using data from all sites were as follows:
Kr = 6.9114 - 1.8167 (PC)O.~~~; r2 = .730 [71
Kr = 7.9082 - 1.8341 (Pc)O.~~~ - 21.6186 OM/%; R2 = .781 [SI
Kr = 9.7014 - 1.8320 (Pc)O.’” - 0.1955 SlSi - 1.7163 (OM)0.5; R2 = .812[9]
where the variables have already been defined.
Again, after separating the Riley County data alone and repeating the regression pro- cedure, we obtained the following equa- tions:
Kr = 7.1808 - 1.8657 (Pc)O.~~~; r2 = .749 [lo1
Kr = 8.3284 - 2.1097 (Pc)”~ - 0.0264 OMC; R2 = .861 [111
Kr = 8.4415 -1.8240 (Pc)”~ - 0.0358 OMC - 1.7~10.~ TcS; R2 = .892[12]
where C = clay content (%) and Tc = cu- mulative time after seeding (days).
Application of the regression equations would be simplified if a relationship be- tween ridge height and ridge spacing (row spacing) were available. Using the data ob- tained in this study for drills and unpub- lished data from Texas on listers, we devel- oped the following simple power equation:
Ho = 0.329 A0.s15; r2 = .932 ~ 3 1 where Ho = the ridge height (cm) imme- diately after tillage and A = ridge (row) spacing (cm). In the drill data, Ho varied from 3.8 to 10.2 cm and A from 18 to 30 cm. Corresponding values for the lister data were 15 to 36 cm and 81 to 102 cm. Equa-
tion 13 should not be used at ridge spacings outside those used in its development.
A new wind erosion prediction model now under development by the Agricultural Research Service is expected to need ridge height data over time as input data when erosive windstorms occur. The following ex- amples illustrate how to use the regression equations for estimating ridge height.
Assume a silt loam field in western Kan- sas has been drilled to winter wheat on Sep- tember 30, using 25.4 cm row spacings. Assume 31 days have elapsed and records show 3.3 cm of cumulative precipitation. What is the ridge height now?
Step 1: Using equation 13 with A = 25.4 cm, Ho = 6.35cm. Step 2: Using Pc = 3.3 cm in equation 4, Hi/Ho = 0.7827 or Hi = 4.97 cm, the expected ridge height after 31 days. Equation 1 could have been used in step 2, yielding Hi = 5.06 cm.
If additional data on soil properties were available, equations 2, 3, or 5 could be used in step 2. Assume the silt loam is the one located at site 41 in Ford County, Kansas (Table 1). Then, using equation 5 with sand (S) = 11.1%, silt (Si) = 63.6%, and ex- changeable calcium (Ca) = 3,470 ppm, Hi = 4.80 cm.
Consider the same data with 182 days elapsed time and applying the wind erosion equation to the field in question using crop stage periods (2). Thus, the Kr value is needed to determine the soil ridge roughness factor K, one of the five factors in the wind erosion equation. Assume that cumulative precipitation (October-March) is 12.80 cm (the normal for Dodge City, Kansas). Using equations 9 and 12 with OM = 2.1 % , clay (C) = 25.3 %, and cumulative time (Tc) = 182 days, Kr = 2.89 cm and Kr = 2.28 cm, respectively. From Woodruff and Siddoway (5), the K value associated with a Kr of 2.28 cm is about 0.60; that compares to a value of 1.00 for a nonridged surface.
We should note that regression equations should not be used with data exceeding the
Table 1. Cumulative time and precipitation and soil data for 15 study sites across Kansas. _ _ ___. . _ _ Cumulative
Site Numbed Cumulative Precipitation Sand Silt Clay OM Exchangeable Ca Soi/ County Year Days (cm) (Yo) ( O W P / O ) ( O W (PPW Series
1llBourbon 1984-1985 183 48.44 9.9 67.0 23.1 5.4 3,760 Zaar SiL 12/Bourbon 1984-1985 177 62.16 9.2 72.3 18.5 2.6 2,530 Catoosa SiL 21IRiley 1983-1984 186 57.47 14.4 62.4 23.2 2.4 2,600 Sutphen SiL 22/Riley 1983-1984 186 50.24 70.8 24.5 4.7 0.7 600 Carr SL 23/Riley 1983-1984 185 46.03 6.8 73.7 19.5 4.2 5,700 Smolan SiL 24/Riley 1984-1985 207 41.22 54.9 38.1 7.0 0.6 1,390 Haynie SL 25/Riley 1984-1985 180 28.70 7.9 72.1 20.0 3.1 2,570 Reading SiL 26/Riley 1985-1986 198 18.97 1.2 89.6 9.2 1.6 1,900 Eudora Si 27/Riley 1985-1986 206 27.77 1.1 72.6 26.3 2.2 4,500 Reading SiL 31/Russell 1984-1985 186 34.99 10.2 68.1 21.7 2.5 4,300 Roxbury SiL 32/Russell 1984-1985 186 34.99 15.8 60.5 23.7 2.1 3,370 Arrno SiL 41IFord 1984-1985 224 28.59 11.1 63.6 25.3 2.1 3,470 Harney SiL 42/Ford 1984-1985 181 22.02 80.9 11.0 8.1 1.1 910 Carwile LS 51/Stanton 1984-1985 221 15.11 61.0 27.6 11.4 1.2 1,210 Richfield SL 52IStanton 1984-1985 221 15.11 88.7 6.4 4.9 0.6 800 Manter S
270 Journal of Soil and Water Conservation

range that was used in developing them. All the equations become negative as cumula- tive precipitation increased beyond some value, indicating that the ridges have dissi- pated (ridge height goes to zero). For Hi/Ho or Kr values less than 0, the equations would be invalid.
Equations 1 through 5 are based on the assumption that the effect of cumulative precipitation on ridge persistence depends on the initial ridge heights (Ho). Until addi- tional data are available, these equations should not be extended to larger ridges. For example, lister ridges are unlikely to become leveled at the rates indicated here for drill ridges.
Finally, the equations do not account for the effects of wind erosion, which could also flatten ridges created by tillage. The only sites that may have experienced wind ero-
sion during the study period were sites 42 and 52 in western Kansas. However, no wind erosion was reported by the SCS personnel making the ridge height measurements.
1. Armbrust, D. V., W. S. Che il, andE H. Sid- doway. 1964. Effects of T ~ & B on erosion of soil by wind. Soil Sci. SOC. Am. Proc. 28(4): 557-560.
2. Bondv. E.. L. Lvles. and W. A. Haves. 1980.
REFERENCES CITED
Computing soil erosion by periods &ng wind energy distribution. J. Soil and Water Cons. 35(4): 173-176.
3. Dexter, A. R. 1977. Effect of rainfall on the surface mim-relief of tilled soil. 1. Terramech- anics 14(1): 11-22:
4. Hagen, L. J., andD. V. Armbrust. 1985. Ef- fects of field ridges on soil transport b wind. Proc. Internat. Workshop on Physics of Blown Sand, Univ. Aarhus, Denmark 3(8): 563-586.
5. Woodruff, N. P, and F. H. Siddoway. 1965. A wind erosion equation. Soil Sci. SOC. Am. Proc. 29(5): 602-608. 0