Practice Problems for Exam 1 - Loyola University...
7
Practice Problems for Exam 1 Basic Linear Functions : 1. Find the equation of the line that has slope -2 and y-intercept equal to 100. 2. Find the equation of the line that has slope 1.5 and passes through the point (3, -1). 3. Find the equation of the line that passes through the points (-1, 4) and (-3, 0.5). 4. Find the slope and y-intercept of the linear function 4x - 6y = 8. Applications of Linear Functions : 5. Throughout Ecuador temperature is determined by altitude. With each ascent of 200 meters in alti- tude, temperature drops 1 ◦ C (this phenomenon is particularly significant in the Sierra, www.photius.com/countrie The temperature T is a function of altitude A so T = f (A). (a) Interpret the statement f (1800) = 20 in terms of the altitude in meters and the temperature in degrees Celsius. (b) Given the point in (a) and the information above, find the equation that gives T as a function of A. (c) According to your model what is the temperature when the altitude is 2000 meters? (d) According to your model what is the altitude when the temperature is 25 ◦ C ? 6. The graph Figure 6 below shows the distance from home, in miles, of a person on a 5 hour trip. Figure 1: (a) Estimate the vertical intercept. Give units and interpret in terms of distance and time. (b) Estimate the slope of this linear function. Give units and interpret in terms of distance and time. (c) Give a formula for your distance from home D, in miles, as a function of time t, in hours. Applications to Economics : 7. A company that sells E-phones has fixed costs $800, 000. For each E-phone they manufacture cost increases by $80. The price of an E-phone is $200. (a) Write the total cost, C (q), and total revenue, R(q) functions for the company in terms of the number of E-pods q they sell and produce. 1
Transcript of Practice Problems for Exam 1 - Loyola University...
Practice Problems for Exam 1
Basic Linear Functions:
1. Find the equation of the line that has slope −2 and y-intercept equal to 100.
2. Find the equation of the line that has slope 1.5 and passes through the point (3,−1).
3. Find the equation of the line that passes through the points (−1, 4) and (−3, 0.5).
4. Find the slope and y-intercept of the linear function 4x− 6y = 8.
Applications of Linear Functions:
5. Throughout Ecuador temperature is determined by altitude. With each ascent of 200 meters in alti-tude, temperature drops 1◦C (this phenomenon is particularly significant in the Sierra, www.photius.com/countries/ecuador/climate.html).The temperature T is a function of altitude A so T = f(A).
(a) Interpret the statement f(1800) = 20 in terms of the altitude in meters and the temperature indegrees Celsius.
(b) Given the point in (a) and the information above, find the equation that gives T as a functionof A.
(c) According to your model what is the temperature when the altitude is 2000 meters?
(d) According to your model what is the altitude when the temperature is 25◦C?
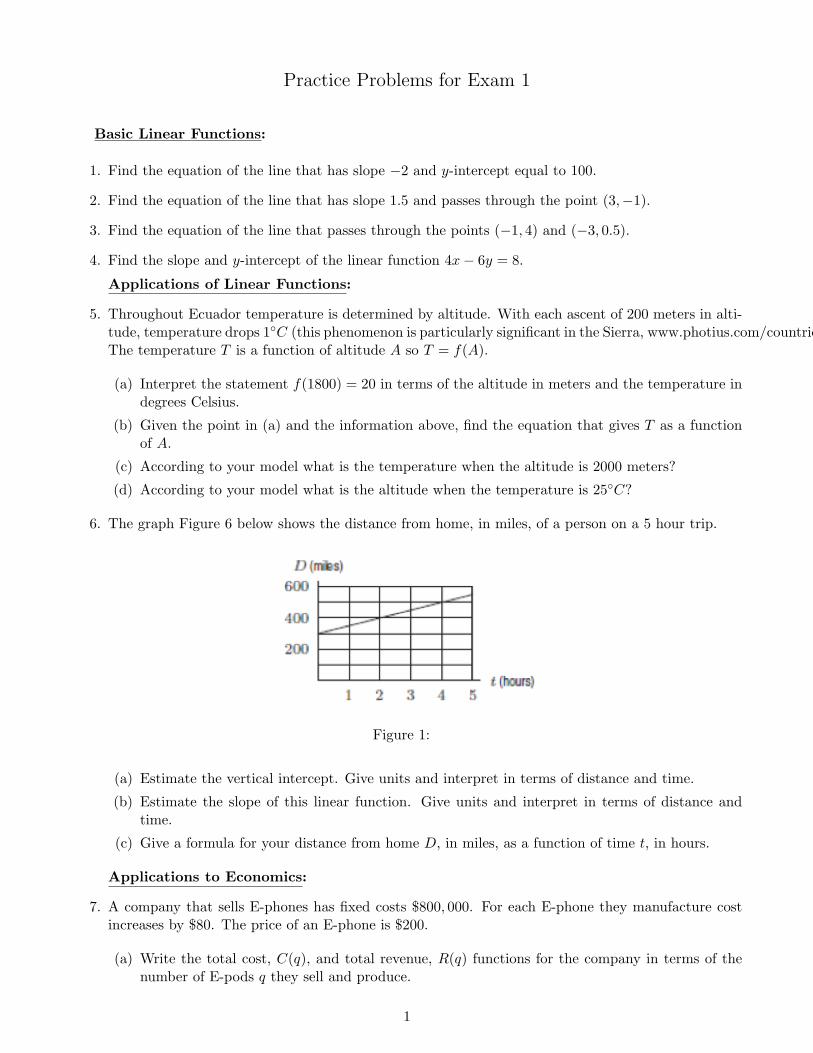
6. The graph Figure 6 below shows the distance from home, in miles, of a person on a 5 hour trip.
Figure 1:
(a) Estimate the vertical intercept. Give units and interpret in terms of distance and time.
(b) Estimate the slope of this linear function. Give units and interpret in terms of distance andtime.
(c) Give a formula for your distance from home D, in miles, as a function of time t, in hours.
Applications to Economics:
7. A company that sells E-phones has fixed costs $800, 000. For each E-phone they manufacture costincreases by $80. The price of an E-phone is $200.
(a) Write the total cost, C(q), and total revenue, R(q) functions for the company in terms of thenumber of E-pods q they sell and produce.
1

(b) What does the y-intercept of the cost function mean?
(c) What are the marginal cost and marginal revenue?
(d) How many E-pods does the company need to sell in order to make a positive profit?
(e) Sketch a graph of both the cost and revenue functions on the same axes and clearly illustratethe graphical meaning of your answer in part (d).
8. Below is a table that gives data for the linear demand curve for a product, where p is the price ofthe product and q is the quantity that is demand at that price.
p 3 6 9 12 15q 250 190 130 70 10
(a) Find a formula for q as a function of p. Explain the meaning in practical of the slope andq-intercept of your formula.
(b) Find a formula for p as a function of q. Explain the meaning in practical of the slope andp-intercept of your formula.
9. The following equations give the demand and the supply curve for a product:
q = 25000− 20p and q = 10p− 500
(a) Which of the above equations represents the supply curve and which one represents the demandcurve? Why?
(b) Explain the meaning (in practical terms) of the slopes of the supply and demand curves.
(c) Explain the meaning of the q and p intercepts of the demand curve.
(d) Explain the meaning of the p intercept of the supply curve, and why the q intercept does notmake practical sense in this setting.
(e) Find the equilibrium price and quantity..
(f) Graph both the supply and demand on the same axes and illustrate your answer in part (e).
2

Basic Exponential Functions:
10. Find a formula for the exponential function which passes through the points (0, 40) and (3, 8).
11. Find a formula for the exponential function graphed in Figure 2 below.
t
PP=fHtL
H2,12L
H8,65L
Figure 2:
Applications of Exponential Functions and Logs:
12. The total number of coalition military fatalities in Afghanistan in 2005 was 131. The number ofcoalition military fatalities in Afghanistan in 2007 was 232.
(a) Let N represent the total number of coalition military fatalities in Afghanistan t years after2005. If N is an exponential function of t, find a formula of the form N = N0 · at for thisfunction.
(b) Explain the meaning of the N0 and the a in practical terms.
(c) Sketch a graph of this function.
(d) In what is the total number of coalition military fatalities in Afghanistan predicted to be 500?
(e) The total number of fatalities in 2009 was 521. Explain why your prediction above was notaccurate.
(f) Based on your equation in (a), what is the continous growth rate?
13. World population is approximately p(t) = 6.4 · (1.0126)t, with P in billions of peopler and t in yearssince 2004.
(a) What is the yearly percent rate of growth of the world population?
(b) What was the world population in 2004? What does this model predict for the world populationin 2010?
(c) Find P (5) and interpret it.
(d) Use part (b) to find the average rate of change of the world population between 2004 and 2010.Explain the meaning of the value you find for the average rate of change.
14. The number of internet users in Mexico in 2001 was 2.5 million and in 2008 was 22 million.
(a) Assuming exponential growth, find the annual growth rate of the number of internet users inMexico. Explain what this rate tells you in practical terms.
(b) Find an equation for the number of internet users in millions, N , as a function of years since2001, t.
(c) What will be the number of internet hosts in 2010?
(d) In what year will the number of internet hosts reach 495 million?
3
(e) What was the average rate of change of the number of internet users in Mexico from 2001 to2008? Explain the meaning of your answer. What is the difference in the meaning of this answercompared to the meaning of your answer in part (a).
15. Angola is projected to have the highest infant mortality rate for 2010. The estimated infant mortalityrate (deaths/1,000 live births) for Angola in 2010 is 180.21.
(a) If we assume that the infant mortality rate will be decreasing at a continuous rate of 2% peryear, write a formula for the infant mortality rate, M , as a function of years since 2010.
(b) What will the infant mortality rate be in 2015?
(c) In what year will the infant mortality rate be half of what it is projected to be in 2010?
(d) What is the annual rate of decay of Angola’s infant mortality rate?
16. You have the option of renewing the service contract on your three-year old dishwasher. The newservice contract is for three years at a price of $200. The interest rate is 7.25% compounded annually.You estimate the cost of repairs if you do not buy the service contract will be $50 at the end of thefirst year, $100 at the end of the second year, and $150 at the end of the third year. Should you buythe service contract? Explain and show the mathematical work needed to back up your explanation.
Comparing Linear and Exponential Functions
17. You purchase a car for $20, 000. Find an equation for the value of your car in t years if
(a) the cars value decreases by $300 each year.
(b) the cars value is decreasing at an annual rate of 3% per year.
(c) the cars value is decreasing at a continuous rate of 3% per year.
18. You are hired by an organization and offered two potential salary options. Below your salary S isgiven in terms of the number of years since beginning work, t. Interpret the meaning of each of thesalary functions below in terms of starting salary and raise.
(a) S(t) = 80, 000 + 2, 000t
(b) S(t) = 70000(1.04)t.
(c) If you plan on working at this organization for 3 years, which option should you choose?
Composition of Functions:
19. If f(x) = 3x2 − 2x + 1, simplify the following:
(a) f(2 + h)
(b) f(2 + h)− f(2)
(c)f(2 + h)− f(2)
h
20. Decompose the following functions into a pair of functions f(x) and g(x) such that y = f(g(x)).
(a) y = e2x−1
(b) y = 5 cos (x)− 7
(c) y = (sinx)2 + 4
(d) y =1√
3x− 1
4

21. Given the values for f(x) and g(x) in the table below, evaluate the following,
x 2 4 6 8 10f(x) 6 2 10 4 8g(x) 8 10 8 2 6
(a) f(g(4)) (b) g(f(8)) (c) f(f(6)) (d) g(g(10))
Trigonometric Functions:
22. Sketch graphs of y = cos (x) and y = −6 cos (3x) + 2.
23. Find a possible formula for the graph below.
2 4 6 8 10 12x
-8
2
yy=fHxL
Figure 3:
24. A population of animals, P , varies periodically between a low of 700 an January 1 and a high of 900on July 1.
(a) Sketch a graph of the function P = f(t) where t denotes the number of days since January 1st.
(b) What are the midline, amplitude, and period of the graph of P = f(t) where t is the number ofdays since January 1?
(c) Find a possible formular for P + f(t).
Instantaneous Rate of Change and the Derivative:
25. Values for y = f(x) are given in the table below:
x 0 2 4 6 8 10 12f(x) 10 18 24 21 20 18 15
(a) Estimate f ′(2) using the values of f in the table.
(b) When (if ever) does f ′(x) appear to be positive? negative?
26. In a time t seconds, a particle moves a distance of s meters from its starting point, where s(t) = 6t2+2.
(a) Find the average velocity of the particle over the period t = 1 to t = 3 seconds. Include unitsin your answer.
(b) Approximate the instananeous velocity of the particle at t = 1 by computing the average rateof change from t = 1 to t = 1 + h for
5

(a) h = 1 (b) h = 0.1 (c) h = 0.01
27. Consider the graph of the function y = g(x) in the figure below.
9/25/10 7:35 PMReview Problems for Chapter Two
Page 1 of 12http://edugen.wiley.com/edugen/courses/crs5137/hugheshallett0526…VnaGVzaGFsbGV0dDA1MjZjMDJfN18wLnhmb3Jt.enc?course=crs5137&id=ref
Print this page
REVIEW PROBLEMS FOR CHAPTER TWO
1. In a time of t seconds, a particle moves a distance of s meters from its starting point, where s = 4t2 + 3.
(a) Find the average velocity between t = 1 and t = 1 + h if:
i. h = 0.1,
ii. h = 0.01,
iii. h = 0.001.
(b) Use your answers to part (a) to estimate the instantaneous velocity of the particle at time t = 1.
Answer:
2. Match the points labeled on the curve in Figure 2.59 with the given slopes.
Figure 2.59
Slope Point
-3
-1
0
1/2
1
2
3.
(a) Use a graph of f(x) = 2 - x3 to decide whether f!(1) is positive or negative. Give reasons.
(b) Use a small interval to estimate f!(1).
Figure 4:
(a) At which points is g′(x) positive? negative?
(b) At which point is g′(x) greatest? least?
28. At which of the marked x-values in the figure below can the following statements be true?
9/25/10 7:35 PMReview Problems for Chapter Two
Page 9 of 12http://edugen.wiley.com/edugen/courses/crs5137/hugheshallett0526…VnaGVzaGFsbGV0dDA1MjZjMDJfN18wLnhmb3Jt.enc?course=crs5137&id=ref
x 1.0 1.1 1.2 1.3 1.4 1.5
f(x) 1000 1010 1015 1018 1020 1021
37. The length L of the day in minutes (sunrise to sunset) x kilometers north of the equator on June 21 is givenby L = f(x). What are the units of
(a) f!(3000)?
(b) f"(3000)?
Answer:
38. Sketch the graph of a function whose first and second derivatives are everywhere positive.
39. At which of the marked x-values in Figure 2.65 can the following statements be true?
(a) f(x) < 0
(b) f!(x) < 0
(c) f(x) is decreasing
(d) f!(x) is decreasing
(e) Slope of f(x) is positive
(f) Slope of f(x) is increasing
Figure 2.65
Answer:
40. Sketch the graph of the height of a particle against time if velocity is positive and acceleration is negative.
41. Figure 2.66 gives the position, f(t), of a particle at time t. At which of the marked values of t can thefollowing statements be true?
Figure 5:
(a) f(x) > 0
(b) f ′(x) > 0
(c) f(x) is increasing?
(d) f ′(x) is increasing?
(e) Slope of f(x) is positive?
(f) Slope of f(x) is increasing?
29. A person with a certain liver disease first exhibits larger and larger concentrations of enzymes (calledSGOT and SGPT) in the blood. As the disease progresses, the concentration of enzymes drops, firstto the predisease level and eventually to zero (when almost all liver cells have died). Montoring levelsof these enzymes allows doctors to track the prgress of a patient with this disease. If C = f(t) is theconcentration of enzymes in the blood as a function of time t,
(a) Sketch a possible graph of C = f(t).
6
(b) Mark on your graph the intervals where f ′ > 0 and where f ′ < 0.
(c) What does f ′(t) represent in practical terms?
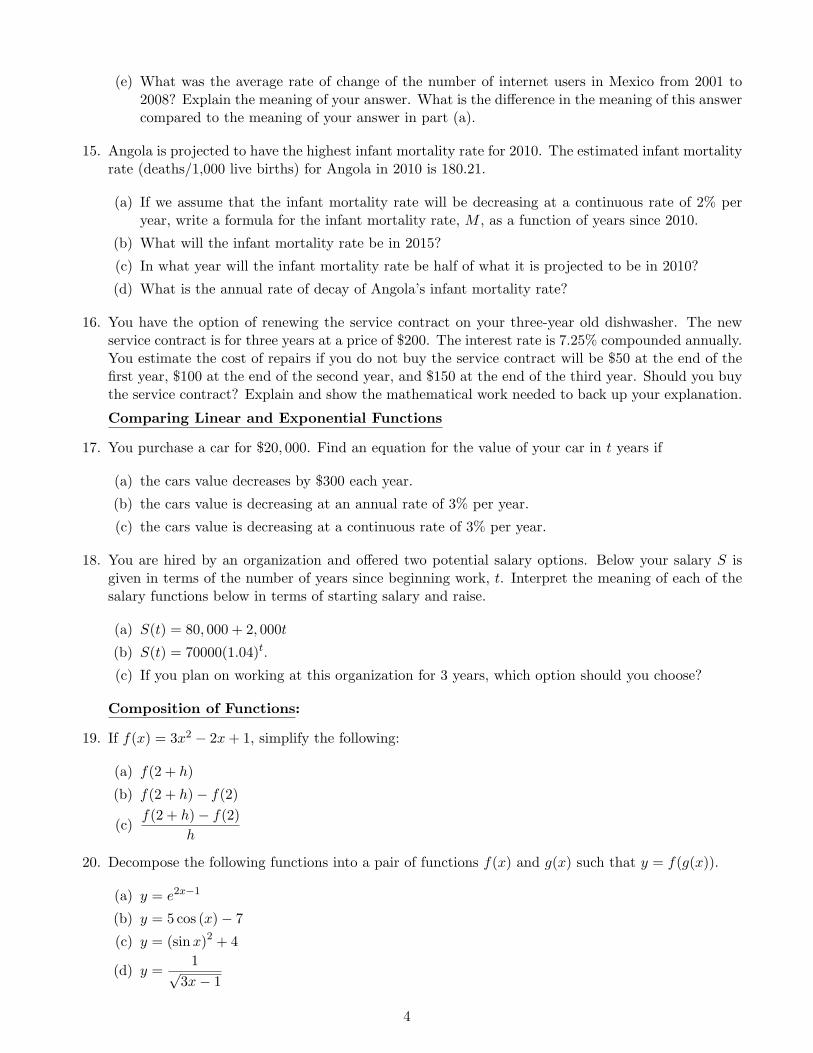
30. The graph below shows world solar energy output, in megawatts, as a function of years since 1990.
9/25/10 7:35 PMReview Problems for Chapter Two
Page 5 of 12http://edugen.wiley.com/edugen/courses/crs5137/hugheshallett0526…VnaGVzaGFsbGV0dDA1MjZjMDJfN18wLnhmb3Jt.enc?course=crs5137&id=ref
Figure 2.62 Graph of f!, not f
Answer:
16. The average weight W of an oak tree in kilograms that is x meters tall is given by the function W = f(x). Whatare the units of measurement of f!(x)?
17. The percent, P, of US households with a personal computer is a function of the number of years, t, since1982 (when the percent was essentially zero), so P = f(t). Interpret the statements f(20) = 57 and f!(20) = 3.
18. A yam has just been taken out of the oven and is cooling off before being eaten. The temperature, T, of theyam (measured in degrees Fahrenheit) is a function of how long it has been out of the oven, t (measured inminutes). Thus, we have T = f(t).
(a) Is f!(t) positive or negative? Why?
(b) What are the units for f!(t)?
19. The quantity sold, q, of a certain product is a function of the price, p, so q = f(p). Interpret each of thefollowing statements in terms of demand for the product:
(a) f(15) = 200
(b) f!(15) = -25.
20. Figure 2.63 shows world solar energy output, in megawatts, as a function of years since 1990.19 Estimatef!(6). Give units and interpret your answer.
Figure 2.63
21. For a function f(x), we know that f(20) = 68 and f!(20) = -3. Estimate f(21), f(19) and f(25).
Answer:
Figure 6:
(a) What is the average rate of change over the interval from 1994 to 1998? Interpret the meaningof your answer (include units).
(b) Approximate f ′(4). Interpret the meaning of your answer (include units).
31. A climber on Mount Everest is 6000 meters from the start of the trail and at an elevation of 8000meters above sea level. At x meters from the start of the trail, the elevation of the trail is h(x) metersabove sea level.
(a) Evaluate and interpret h(6000).
(b) Explain the meaning in practical terms ofdH
dx
∣∣∣∣x=6000
= 0.5.
(c) What is the approximate elevation another 3 meters ahead along the trail?
32. The temperature, H, in degrees Celsius, of a cup of coffee placed on the kitchen counter is given byH = f(t), where t is in minutes since the coffee was put on the counter.
(a) Is f ′(t) positive or negative? Give a reason for your answer.
(b) What are the units of f ′(20)? What is the practical meaning in terms of temperature of thecoffee?
33. Sketch derivatives for each of the following functions:
(a)
9/25/10 7:35 PMReview Problems for Chapter Two
Page 3 of 12http://edugen.wiley.com/edugen/courses/crs5137/hugheshallett0526…VnaGVzaGFsbGV0dDA1MjZjMDJfN18wLnhmb3Jt.enc?course=crs5137&id=ref
(a) Find the average velocity between t = 1 and t = 1 + h if:
i. h = 0.1,
ii. h = 0.01,
iii. h = 0.001.
(b) Use your answers to part (a) to estimate the instantaneous velocity of the particle at time t = 1.
Answer:
For Problems 8, 9, 10, 11, 12 and 13, sketch the graph of f!(x).
8.
9.
Answer:
10.
11.
(b)
9/25/10 7:35 PMReview Problems for Chapter Two
Page 3 of 12http://edugen.wiley.com/edugen/courses/crs5137/hugheshallett0526…VnaGVzaGFsbGV0dDA1MjZjMDJfN18wLnhmb3Jt.enc?course=crs5137&id=ref
(a) Find the average velocity between t = 1 and t = 1 + h if:
i. h = 0.1,
ii. h = 0.01,
iii. h = 0.001.
(b) Use your answers to part (a) to estimate the instantaneous velocity of the particle at time t = 1.
Answer:
For Problems 8, 9, 10, 11, 12 and 13, sketch the graph of f!(x).
8.
9.
Answer:
10.
11.
(c)
9/25/10 7:35 PMReview Problems for Chapter Two
Page 4 of 12http://edugen.wiley.com/edugen/courses/crs5137/hugheshallett0526…VnaGVzaGFsbGV0dDA1MjZjMDJfN18wLnhmb3Jt.enc?course=crs5137&id=ref
11.
Answer:
12.
13.
Answer:
14.
(a) Estimate f!(2) using the values of f in the table.
(b) For what values of x does f!(x) appear to be positive? Negative?
x 0 2 4 6 8 10 12
f(x) 10 18 24 21 20 18 15
15. Figure 2.62 is the graph of f!, the derivative of a function f. On what interval(s) is the function f
(a) Increasing?
(b) Decreasing?
Figure 7:
7


![Untitled-2 []premium luhers. Dar\Graÿlire Graohile aaanaa Oœskin anaaaa pebble Oritraood Mahoganþ lauve tuscanv The use MidmaM barracuda 8. Ct.coal exotics](https://static.fdocuments.us/doc/165x107/60170d34d7a1c871346fcd13/untitled-2-premium-luhers-dargralire-graohile-aaanaa-oskin-anaaaa-pebble.jpg)