PowerPoint Presentation · for large technology & software consolidators – Apple could bring back...
48
Important disclosures appear at the back of this report GP Bullhound LLP is authorized and regulated by the Financial Conduct Authority GP Bullhound Inc is a member of FINRA Global Software Market Perspectives Q1 2018
Transcript of PowerPoint Presentation · for large technology & software consolidators – Apple could bring back...
Important disclosures appear at the back of this report
GP Bullhound LLP is authorized and regulated by the Financial Conduct Authority GP Bullhound Inc is a member of FINRA
Global Software Market PerspectivesQ1 2018
2
Key Sector Takeaways
Recent Software Transaction Trends
Public Market SaaS Analyses
Key SaaS Metrics
Appendix A: GP Bullhound SaaS Index
Appendix B: Software Public Comps by Category
1
2
3
4
6
7
8Appendix C: GP Bullhound Software Report
Overview, Software Credentials & Team
5 SaaS CEO Commentary

3
▪ Software consolidators are hyper focused on “growth acquisitions”
– SaaS companies with as little as $5 million of ARR have attracted such interest when growing north of 100%
– Acquirers are not evaluating build vs. buy as often in these scenarios
– Targets are being integrated, but left alone to continue momentum and growth
▪ Strategic M&A processes have been catalyzed through “market checks” in parallel to companies’ investment processes
– Companies are weighing the advantages of exiting prior to their next financing as opposed to further dilution and time horizon
– Investor interest and term sheets can often drive strategics to act
– All opportunities should be considered and we have seen founders benefit from exploring and understanding their options
▪ We have also started to see a number of “soft landing” exits for start-ups
– Companies exiting to strategics or PE buyers in lieu of raising fresh capital and continued standalone growth
– This is a trend in difficult sub-sectors (consumer, parts of digital marketing) and with non-category leading companies
▪ Despite the initial tailwinds for a robust IPO market in 2018, volatility could threaten the IPO market in the near-term
– Market volatility spiked dramatically in early February as the Dow had one of its biggest point losses in recent times
– We will look to see if planned IPOs will price below initial guidance and/or last privately marked valuations
▪ Dropbox is a marquee software IPO – fastest SaaS company to $1B in revenue – it will be a bellwether IPO in ‘18
– Dropbox is primarily a consumer-focused SaaS business with much different metrics than most enterprise SaaS companies
– Dropbox’s net revenue retention of 100% is low for a SaaS company; land & expand efforts may not be working as well as others
– S&M expenses are much lower than Box’s S&M spend due to their consumer customer base
Q1 SaaS Market Highlights
4
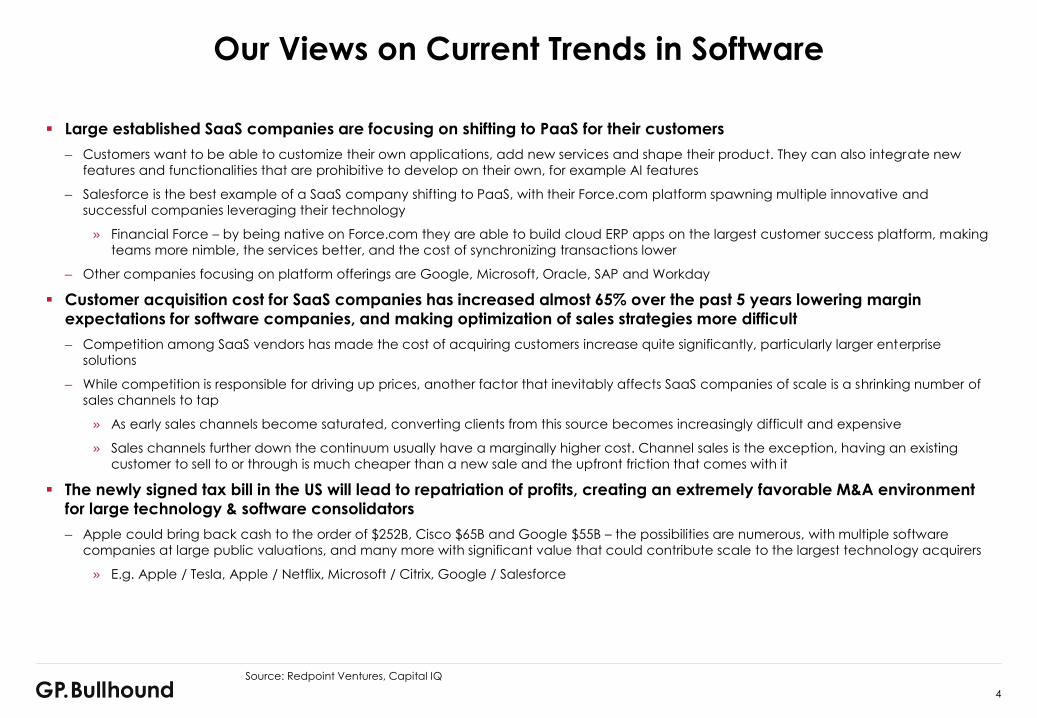
▪ Large established SaaS companies are focusing on shifting to PaaS for their customers
– Customers want to be able to customize their own applications, add new services and shape their product. They can also integrate new
features and functionalities that are prohibitive to develop on their own, for example AI features
– Salesforce is the best example of a SaaS company shifting to PaaS, with their Force.com platform spawning multiple innovative and
successful companies leveraging their technology
» Financial Force – by being native on Force.com they are able to build cloud ERP apps on the largest customer success platform, making
teams more nimble, the services better, and the cost of synchronizing transactions lower
– Other companies focusing on platform offerings are Google, Microsoft, Oracle, SAP and Workday
▪ Customer acquisition cost for SaaS companies has increased almost 65% over the past 5 years lowering margin
expectations for software companies, and making optimization of sales strategies more difficult
– Competition among SaaS vendors has made the cost of acquiring customers increase quite significantly, particularly larger enterprise
solutions
– While competition is responsible for driving up prices, another factor that inevitably affects SaaS companies of scale is a shrinking number of
sales channels to tap
» As early sales channels become saturated, converting clients from this source becomes increasingly difficult and expensive
» Sales channels further down the continuum usually have a marginally higher cost. Channel sales is the exception, having an existing
customer to sell to or through is much cheaper than a new sale and the upfront friction that comes with it
▪ The newly signed tax bill in the US will lead to repatriation of profits, creating an extremely favorable M&A environment
for large technology & software consolidators
– Apple could bring back cash to the order of $252B, Cisco $65B and Google $55B – the possibilities are numerous, with multiple software
companies at large public valuations, and many more with significant value that could contribute scale to the largest technology acquirers
» E.g. Apple / Tesla, Apple / Netflix, Microsoft / Citrix, Google / Salesforce
Our Views on Current Trends in Software
Source: Redpoint Ventures, Capital IQ
5
Key Sector Takeaways
Recent Software Transaction Trends
Public Market SaaS Analyses
Key SaaS Metrics
Appendix A: GP Bullhound SaaS Index
Appendix B: Software Public Comps by Category
1
2
3
4
6
7
8Appendix C: GP Bullhound Software Report
Overview, Software Credentials & Team
5 SaaS CEO Commentary
6
Announce
DateIssuer Selected Investors Issuer Description
Capital
Raised ($)
Mar 13 MoogsoftGoldman Sachs, HCL,
Northgate, Redpoint, Singtel
Real-time IT operations
analytics40
Feb 28 Collective HealthNEA, GV, Founders Fund,
Maverick Ventures
Cloud-based integrated
health benefits platform110
Feb 16 Reflektive TPG, Lightspeed, A16 Employee engagement 60
Jan 31 AsanaGeneration Investment
Management
Collaboration and
productivity software75
Dec 19 Domo
Blackrock, Castor Ventures,
GGV Capital, Glynn Capital,
SharesPost, The Capital
Group, The Yard Ventures
Business management
platform115
Dec 19 Convercent Rho VenturesCorporate compliance
management25
Dec 14 Squarespeace General AtlanticContent management
platform200
Dec 4 Contentful
General Catalyst,
Benchmark, Balderton, Point
Nine
Content management
platform28
Nov 30 UptakeBallie Gifford, Revolution,
GreatPoint VenturesPredictive analytics 117
Nov 1 InVisionApp
Accel. Battery Ventures,
FirstMark Capital, Geodisic,
ICONIQ, Spark Capital, Tiger
Design collaboration
platform100
Oct 31 MetricStream
Clearlake Capital, EDB
Investments, Sageview,
Goldman Sachs
Governance, risk and
compliance63.4
Oct 24 Skybox SecurityCVC Capital, Pantheon
Ventures
Cyber secruity
management150
Oct 16 Duo Security
Geodisic, Index, Lead Edge,
Meritech, Redpoint, True
Venture, Workday
Authentication and mobile
security70
Oct 12 HappyOrNot Northzone VenturesCustomer feedback
monitoring14.5
Announce
DateTarget Buyer Target Description Value ($)
Implied
EV/LTM Rev
Mar 13 Salesforce CloudCraze B2B commerce platform - -
Mar 12 Booker Software MINDBODY Enterprise management 150 6.0x
Mar 6 Togetherwork GI Partners Group management - -
Feb 8 Alfresco SoftwareThomas H. Lee
Partners
Enterprise content
management- -
Feb 8Jive
CommunicationsLogMeIn
Cloud-based
communications342 4.3x
Jan 29 Callidus Software SAP Customer experience 2,425.9 9.6x
Jan 29 ThreatMetrix RELX Security/fraud prevention 830 -
Jan 11 Talkwalker Marlin Equity Social media listening - -
Dec 28 BravoSolution Accel-KKR/JAGGAER Procurement & sourcing 217.8 2.3x
Dec 18 Aconnex Oracle Document management 1,222.8 9.8x
Dec 12 Black Duck SynopsysOpen source & license
management547 7.3x
Dec 11 Shazam Apple Music recognition 400 7.3x
Dec 5 TSheets.com IntuitTime tracking and
scheduling340 8.5x
Dec 5 Simply Measured Sprout Social Social analytics - -
Nov 27 Skyhigh Networks McAfee Cloud access security - -
Nov 21 Cloudmark Proofpoint Messaging security 110 -
Nov 16 Qvidian Upland Software Sales execution 50 -
Nov 14 IntraLinks Siris Capital Content collaboration 1,000 -
Nov 8 ABC Financial Thoma BravoHealth club software &
billing- -
Nov 1 ZiriMed Navicure/BainFinancial & clinical
performance750 -
Oct 23 Vista/Bullhorn Insight, GenstarCRM for service-based
industries- -
Oct 23 BroadSoft CiscoEnterprise
communication1,528.9 4.2x
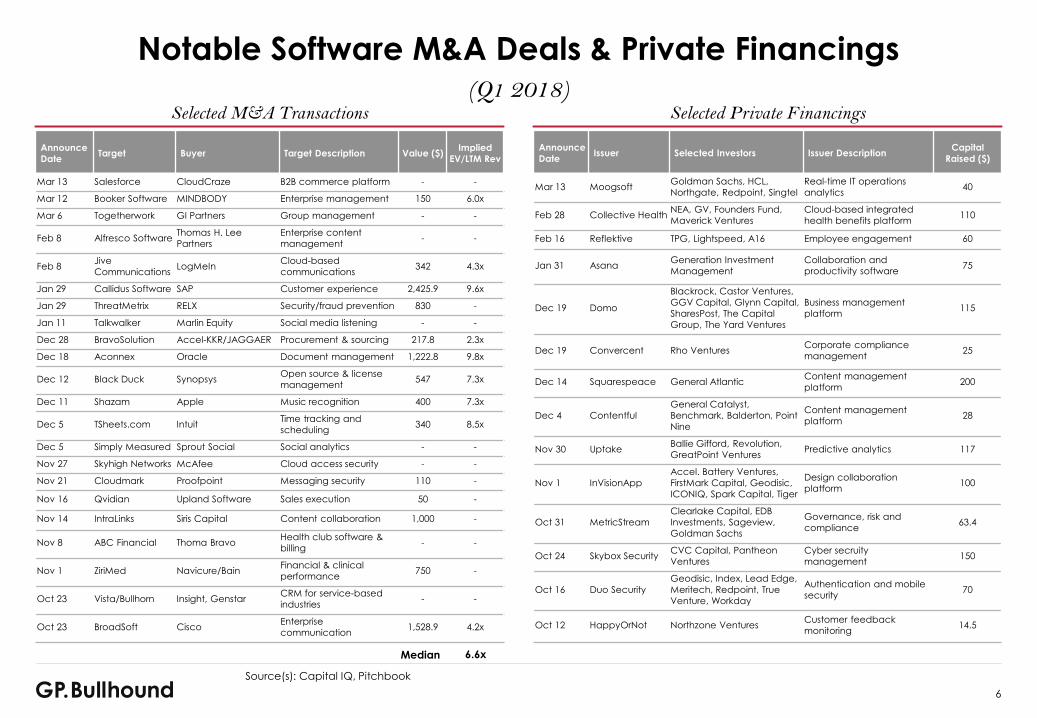
Notable Software M&A Deals & Private Financings(Q1 2018)
Selected M&A Transactions Selected Private Financings
Source(s): Capital IQ, Pitchbook
Median 6.6x

7
0
500
1,000
1,500
2,000
2,500
3,000
3,500
4,000
$0M
$5B
$10B
$15B
$20B
$25B
$30B
$35B
2015
Q1
2015
Q2
2015
Q3
2015
Q4
2016
Q1
2016
Q2
2016
Q3
2016
Q4
2017
Q1
2017
Q2
2017
Q3
2017
Q4
2018
Q1
Value Deals
0%
10%
20%
30%
40%
50%
60%
70%
80%
90%
100%
2015
Q1
2015
Q2
2015
Q3
2015
Q4
2016
Q1
2016
Q2
2016
Q3
2016
Q4
2017
Q1
2017
Q2
2017
Q3
2017
Q4
2018
Q1
U.S. & Canada Europe Asia Other
0%
10%
20%
30%
40%
50%
60%
70%
80%
90%
100%
2015
Q1
2015
Q2
2015
Q3
2015
Q4
2016
Q1
2016
Q2
2016
Q3
2016
Q4
2017
Q1
2017
Q2
2017
Q3
2017
Q4
2018
Q1
U.S. & Canada Europe Asia Other
0
100
200
300
400
500
600
$0M
$20B
$40B
$60B
$80B
$100B
$120B
2015
Q1
2015
Q2
2015
Q3
2015
Q4
2016
Q1
2016
Q2
2016
Q3
2016
Q4
2017
Q1
2017
Q2
2017
Q3
2017
Q4
2018
Q1
M&A Buyout M&A Deals Buyout Deals
Global Software Transaction TrendsM&A and Private Placement Activity by Quarter
Source(s): Pitchbook as of 2/28/2018
Note: Data includes all “SaaS” M&A and private placement deals as defined by Pitchbook regardless of geography or transaction size
M&A Deal Value is Picking Up, Driven by PE Fewer, Larger Private Placements are Still Occurring
The US and Europe Continue to Dominate M&A Deal Volume Private Placement Deal Volume by Region has Stayed Consistent
8
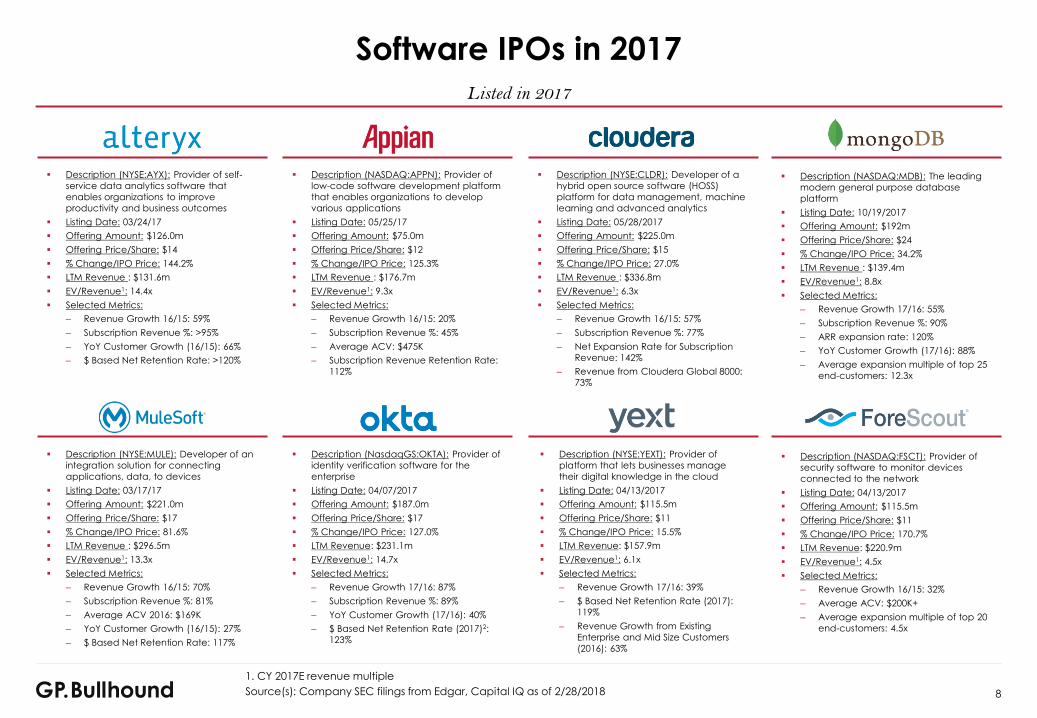
▪ Description (NASDAQ:APPN): Provider of
low-code software development platform
that enables organizations to develop
various applications
▪ Listing Date: 05/25/17
▪ Offering Amount: $75.0m
▪ Offering Price/Share: $12
▪ % Change/IPO Price: 125.3%
▪ LTM Revenue : $176.7m
▪ EV/Revenue1: 9.3x
▪ Selected Metrics:
– Revenue Growth 16/15: 20%
– Subscription Revenue %: 45%
– Average ACV: $475K
– Subscription Revenue Retention Rate:
112%
▪ Description (NYSE:AYX): Provider of self-
service data analytics software that
enables organizations to improve
productivity and business outcomes
▪ Listing Date: 03/24/17
▪ Offering Amount: $126.0m
▪ Offering Price/Share: $14
▪ % Change/IPO Price: 144.2%
▪ LTM Revenue : $131.6m
▪ EV/Revenue1: 14.4x
▪ Selected Metrics:
– Revenue Growth 16/15: 59%
– Subscription Revenue %: >95%
– YoY Customer Growth (16/15): 66%
– $ Based Net Retention Rate: >120%
Software IPOs in 2017
▪ Description (NYSE:CLDR): Developer of a
hybrid open source software (HOSS)
platform for data management, machine
learning and advanced analytics
▪ Listing Date: 05/28/2017
▪ Offering Amount: $225.0m
▪ Offering Price/Share: $15
▪ % Change/IPO Price: 27.0%
▪ LTM Revenue : $336.8m
▪ EV/Revenue1: 6.3x
▪ Selected Metrics:
– Revenue Growth 16/15: 57%
– Subscription Revenue %: 77%
– Net Expansion Rate for Subscription
Revenue: 142%
– Revenue from Cloudera Global 8000:
73%
▪ Description (NYSE:MULE): Developer of an
integration solution for connecting
applications, data, to devices
▪ Listing Date: 03/17/17
▪ Offering Amount: $221.0m
▪ Offering Price/Share: $17
▪ % Change/IPO Price: 81.6%
▪ LTM Revenue : $296.5m
▪ EV/Revenue1: 13.3x
▪ Selected Metrics:
– Revenue Growth 16/15: 70%
– Subscription Revenue %: 81%
– Average ACV 2016: $169K
– YoY Customer Growth (16/15): 27%
– $ Based Net Retention Rate: 117%
▪ Description (NasdaqGS:OKTA): Provider of
identity verification software for the
enterprise
▪ Listing Date: 04/07/2017
▪ Offering Amount: $187.0m
▪ Offering Price/Share: $17
▪ % Change/IPO Price: 127.0%
▪ LTM Revenue: $231.1m
▪ EV/Revenue1: 14.7x
▪ Selected Metrics:
– Revenue Growth 17/16: 87%
– Subscription Revenue %: 89%
– YoY Customer Growth (17/16): 40%
– $ Based Net Retention Rate (2017)2:
123%
▪ Description (NYSE:YEXT): Provider of
platform that lets businesses manage
their digital knowledge in the cloud
▪ Listing Date: 04/13/2017
▪ Offering Amount: $115.5m
▪ Offering Price/Share: $11
▪ % Change/IPO Price: 15.5%
▪ LTM Revenue: $157.9m
▪ EV/Revenue1: 6.1x
▪ Selected Metrics:
– Revenue Growth 17/16: 39%
– $ Based Net Retention Rate (2017):
119%
– Revenue Growth from Existing
Enterprise and Mid Size Customers
(2016): 63%
1. CY 2017E revenue multiple
Source(s): Company SEC filings from Edgar, Capital IQ as of 2/28/2018
▪ Description (NASDAQ:MDB): The leading
modern general purpose database
platform
▪ Listing Date: 10/19/2017
▪ Offering Amount: $192m
▪ Offering Price/Share: $24
▪ % Change/IPO Price: 34.2%
▪ LTM Revenue : $139.4m
▪ EV/Revenue1: 8.8x
▪ Selected Metrics:
– Revenue Growth 17/16: 55%
– Subscription Revenue %: 90%
– ARR expansion rate: 120%
– YoY Customer Growth (17/16): 88%
– Average expansion multiple of top 25
end-customers: 12.3x
▪ Description (NASDAQ:FSCT): Provider of
security software to monitor devices
connected to the network
▪ Listing Date: 04/13/2017
▪ Offering Amount: $115.5m
▪ Offering Price/Share: $11
▪ % Change/IPO Price: 170.7%
▪ LTM Revenue: $220.9m
▪ EV/Revenue1: 4.5x
▪ Selected Metrics:
– Revenue Growth 16/15: 32%
– Average ACV: $200K+
– Average expansion multiple of top 20
end-customers: 4.5x
Listed in 2017
9
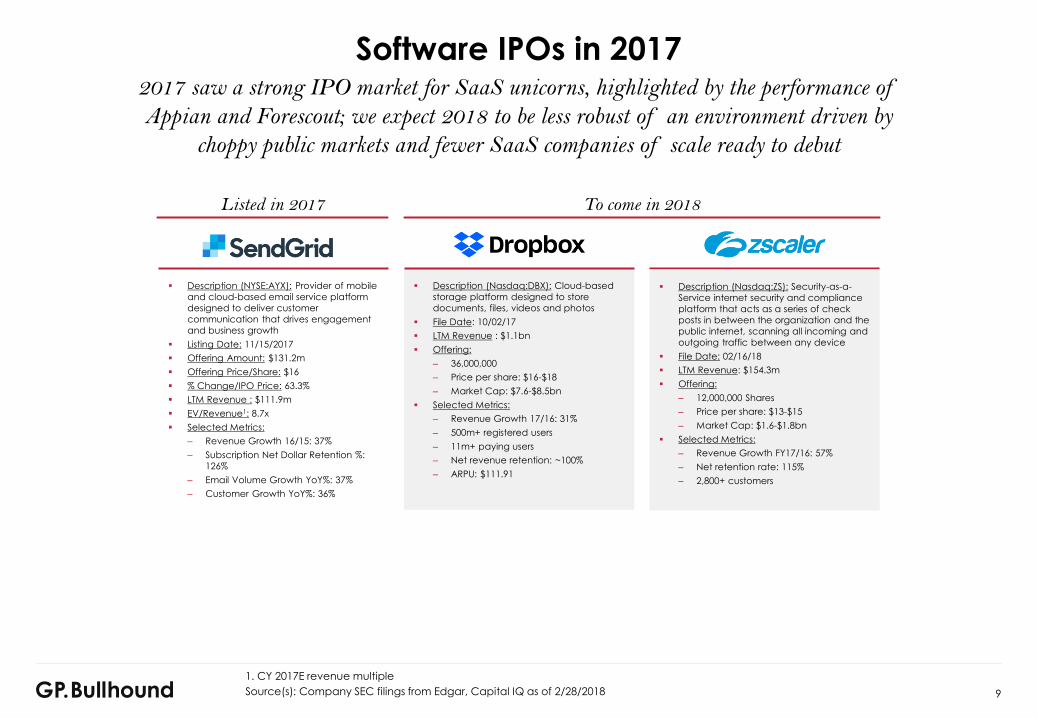
▪ Description (NYSE:AYX): Provider of mobile
and cloud-based email service platform
designed to deliver customer
communication that drives engagement
and business growth
▪ Listing Date: 11/15/2017
▪ Offering Amount: $131.2m
▪ Offering Price/Share: $16
▪ % Change/IPO Price: 63.3%
▪ LTM Revenue : $111.9m
▪ EV/Revenue1: 8.7x
▪ Selected Metrics:
– Revenue Growth 16/15: 37%
– Subscription Net Dollar Retention %:
126%
– Email Volume Growth YoY%: 37%
– Customer Growth YoY%: 36%
Software IPOs in 2017
1. CY 2017E revenue multiple
Source(s): Company SEC filings from Edgar, Capital IQ as of 2/28/2018
▪ Description (Nasdaq:DBX): Cloud-based
storage platform designed to store
documents, files, videos and photos
▪ File Date: 10/02/17
▪ LTM Revenue : $1.1bn
▪ Offering:
– 36,000,000
– Price per share: $16-$18
– Market Cap: $7.6-$8.5bn
▪ Selected Metrics:
– Revenue Growth 17/16: 31%
– 500m+ registered users
– 11m+ paying users
– Net revenue retention: ~100%
– ARPU: $111.91
Listed in 2017 To come in 2018
▪ Description (Nasdaq:ZS): Security-as-a-
Service internet security and compliance
platform that acts as a series of check
posts in between the organization and the
public internet, scanning all incoming and
outgoing traffic between any device
▪ File Date: 02/16/18
▪ LTM Revenue: $154.3m
▪ Offering:
– 12,000,000 Shares
– Price per share: $13-$15
– Market Cap: $1.6-$1.8bn
▪ Selected Metrics:
– Revenue Growth FY17/16: 57%
– Net retention rate: 115%
– 2,800+ customers
2017 saw a strong IPO market for SaaS unicorns, highlighted by the performance of
Appian and Forescout; we expect 2018 to be less robust of an environment driven by
choppy public markets and fewer SaaS companies of scale ready to debut
10
Key Sector Takeaways
Recent Software Transaction Trends
Public Market SaaS Analyses
Key SaaS Metrics
Appendix A: GP Bullhound SaaS Index
Appendix B: Software Public Comps by Category
1
2
3
4
6
7
8Appendix C: GP Bullhound Software Report
Overview, Software Credentials & Team
5 SaaS CEO Commentary

11
18.3
14.5
13.2
12.6
9.9
7.3
6.1
5.9
5.6
5.4
4.9
4.5
4.4
4.3
4.2
4.1
4.0
Salesforce
ServiceNow
Workday
Square
j2 Global
Splunk
Atlassian
Veeva
Ultimate Software
LogMeIn
Paycom
athenahealth
Proofpoint
RingCentral
Zendesk
2U
RealPage
HubSpot
MuleSoft
New Relic
GP Bullhound Selected SaaS Index Market Valuations
Source(s): Capital IQ as of 02/28/2018
Note: Includes the 20 largest companies by market cap from the GP Bullhound SaaS index, constituents can be found in Appendix A
(Market Cap Values in $ in billions)
84.0
28.1
26.6
12
3.0x
4.0x
5.0x
6.0x
7.0x
8.0x
9.0x
10.0x
11.0x
12.0x
13.0x
14.0x
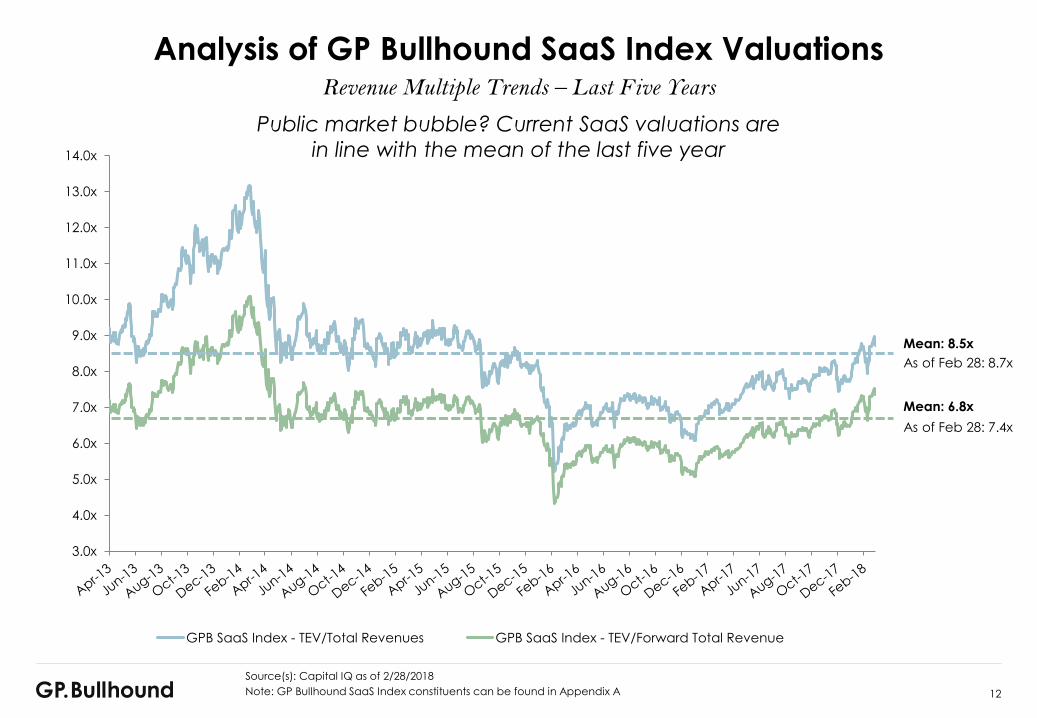
GPB SaaS Index - TEV/Total Revenues GPB SaaS Index - TEV/Forward Total Revenue
Analysis of GP Bullhound SaaS Index ValuationsRevenue Multiple Trends – Last Five Years
Source(s): Capital IQ as of 2/28/2018
Note: GP Bullhound SaaS Index constituents can be found in Appendix A
Mean: 8.5x
Mean: 6.8x
As of Feb 28: 8.7x
As of Feb 28: 7.4x
Public market bubble? Current SaaS valuations are
in line with the mean of the last five year
13
VEEV
BL
PAYC
WDAY
WIX
QTWO
APPF
PFPT
SQ
SPLK
COUP
ZEN
TWLO
HUBS
ULTI
MDSO
MB
CRM
PCTY
NEWR
TLND
MIME
QLYS
EVBG
CALD
FIVN
CSOD
EGHT
RP
RNG
INST
BOX
SPSC
ATHN
BNFT
WK
VIT B
AMBR
CSLT
CARB
APTI
ECOM LPSN
MOBL
BCOVSCWX
AYX
CLDR
YEXT
MULEOKTA
(30%)
(25%)
(20%)
(15%)
(10%)
(5%)
0%
5%
10%
15%
20%
25%
30%
(5%) 0% 5% 10% 15% 20% 25% 30% 35% 40% 45% 50% 55% 60% 65%
2018E U
nle
ve
red
FC
F M
arg
in
2018E Revenue Growth
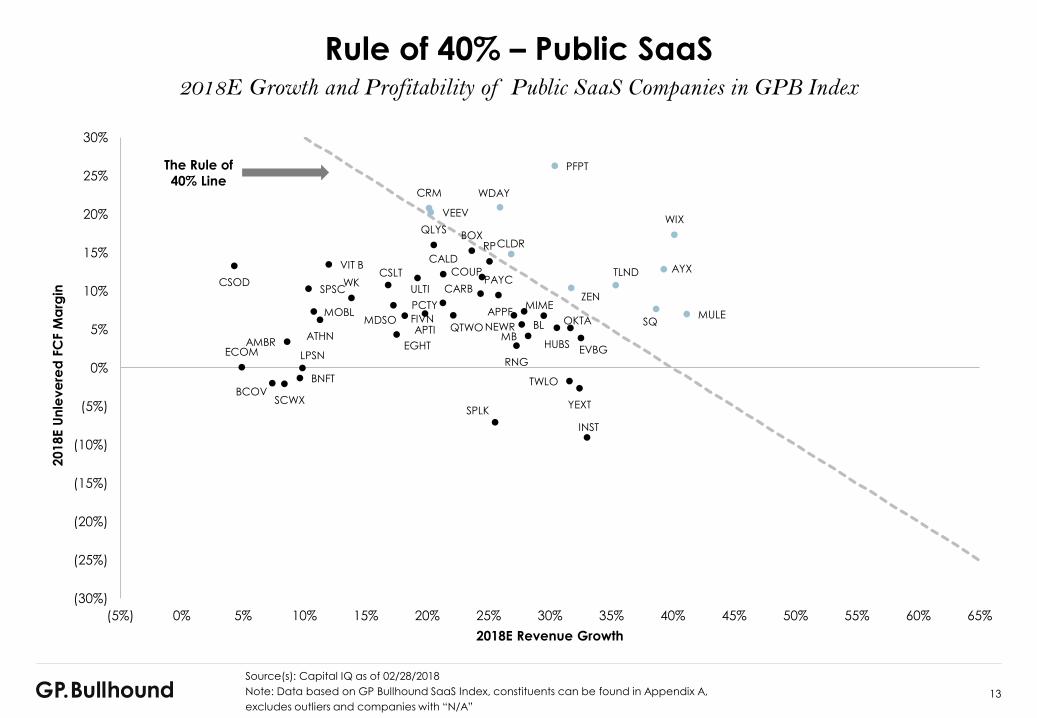
Rule of 40% – Public SaaS2018E Growth and Profitability of Public SaaS Companies in GPB Index
Source(s): Capital IQ as of 02/28/2018
Note: Data based on GP Bullhound SaaS Index, constituents can be found in Appendix A,
excludes outliers and companies with “N/A”
The Rule of
40% Line
14
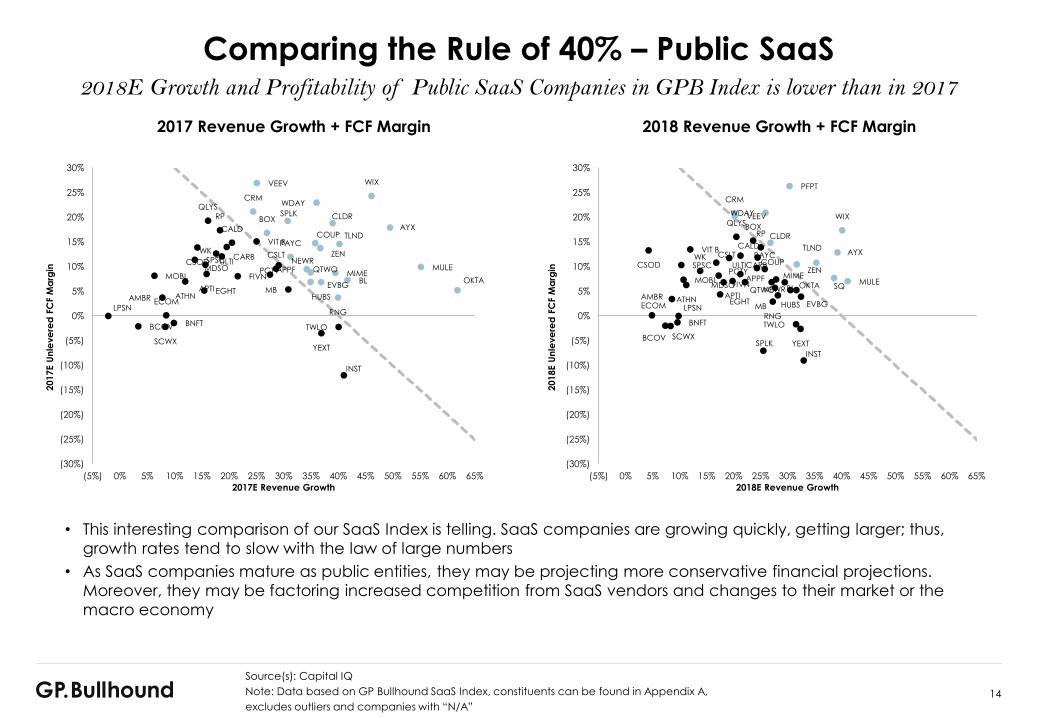
Comparing the Rule of 40% – Public SaaS2018E Growth and Profitability of Public SaaS Companies in GPB Index is lower than in 2017
Source(s): Capital IQ
Note: Data based on GP Bullhound SaaS Index, constituents can be found in Appendix A,
excludes outliers and companies with “N/A”
VEEV
BL
PAYC
WDAY WIX
QTWO
APPF
PFPT
SQ
SPLK
COUPZEN
TWLO
HUBS
ULTI
MDSO
MB
CRM
PCTY
NEWR
TLND
MIME
QLYS
EVBG
CALD
FIVN
CSOD
EGHT
RP
RNG
INST
BOX
SPSC
ATHN
BNFT
WKVIT B
AMBR
CSLT
CARB
APTI
ECOM LPSN
MOBL
BCOV SCWX
AYX
CLDR
YEXT
MULEOKTA
(30%)
(25%)
(20%)
(15%)
(10%)
(5%)
0%
5%
10%
15%
20%
25%
30%
(5%) 0% 5% 10% 15% 20% 25% 30% 35% 40% 45% 50% 55% 60% 65%
2018E U
nle
ve
red
FC
F M
arg
in
2018E Revenue Growth
2018 Revenue Growth + FCF Margin
VEEV
BL
PAYC
WDAY
WIX
QTWOAPPF
SPLK
COUP
ZEN
TWLO
HUBS
ULTIMDSO
MB
CRM
PCTY
NEWR
TLND
MIME
QLYS
EVBG
CALD
FIVN
CSOD
EGHT
RP
RNG
INST
BOX
SPSC
ATHN
BNFT
WKVIT B
AMBR
CSLTCARB
APTI
ECOMLPSN
MOBL
BCOV
SCWX
AYX
CLDR
YEXT
MULE
OKTA
(30%)
(25%)
(20%)
(15%)
(10%)
(5%)
0%
5%
10%
15%
20%
25%
30%
(5%) 0% 5% 10% 15% 20% 25% 30% 35% 40% 45% 50% 55% 60% 65%
2017E U
nle
ve
red
FC
F M
arg
in
2017E Revenue Growth
2017 Revenue Growth + FCF Margin
• This interesting comparison of our SaaS Index is telling. SaaS companies are growing quickly, getting larger; thus,
growth rates tend to slow with the law of large numbers
• As SaaS companies mature as public entities, they may be projecting more conservative financial projections.
Moreover, they may be factoring increased competition from SaaS vendors and changes to their market or the
macro economy
15
91%
65%
54%50% 49%
37%
29%
42%
0%
10%
20%
30%
40%
50%
60%
70%
80%
90%
100%
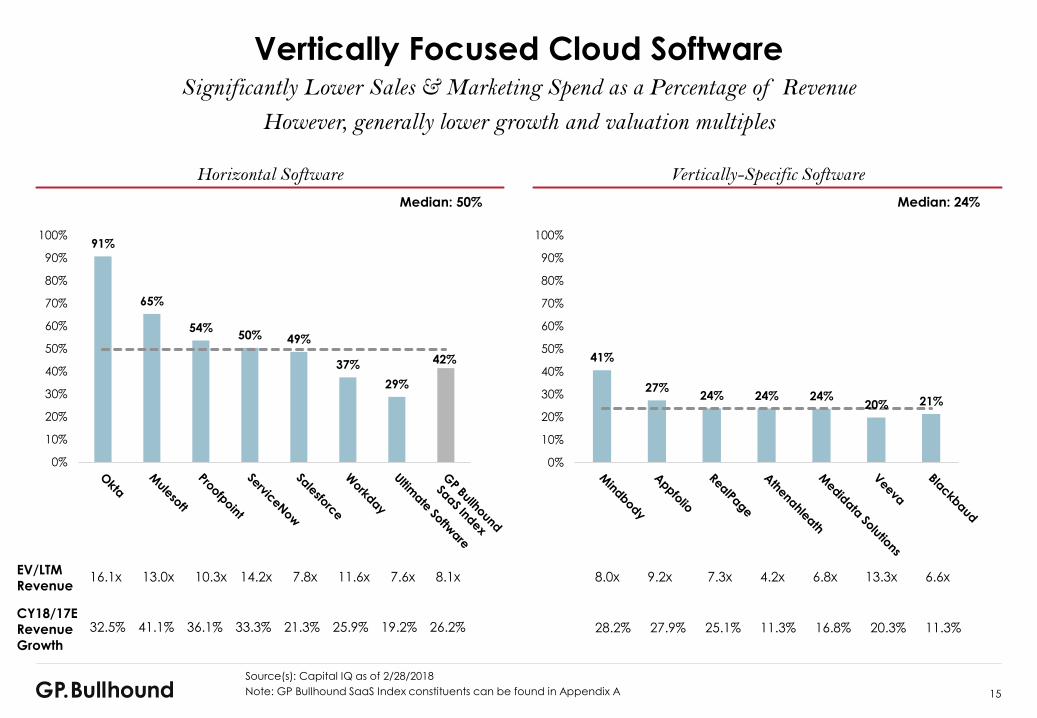
Vertically Focused Cloud SoftwareSignificantly Lower Sales & Marketing Spend as a Percentage of Revenue
However, generally lower growth and valuation multiples
Horizontal Software Vertically-Specific Software
Median: 24%Median: 50%
Source(s): Capital IQ as of 2/28/2018
Note: GP Bullhound SaaS Index constituents can be found in Appendix A
41%
27%24% 24% 24%
20% 21%
0%
10%
20%
30%
40%
50%
60%
70%
80%
90%
100%
16.1x 13.0x 10.3x 14.2x 7.8x 11.6x 7.6x 8.1x 8.0x 9.2x 7.3x 4.2x 6.8x 13.3x 6.6xEV/LTM
Revenue
CY18/17E
Revenue
Growth
32.5% 41.1% 36.1% 33.3% 21.3% 25.9% 19.2% 26.2% 28.2% 27.9% 25.1% 11.3% 16.8% 20.3% 11.3%
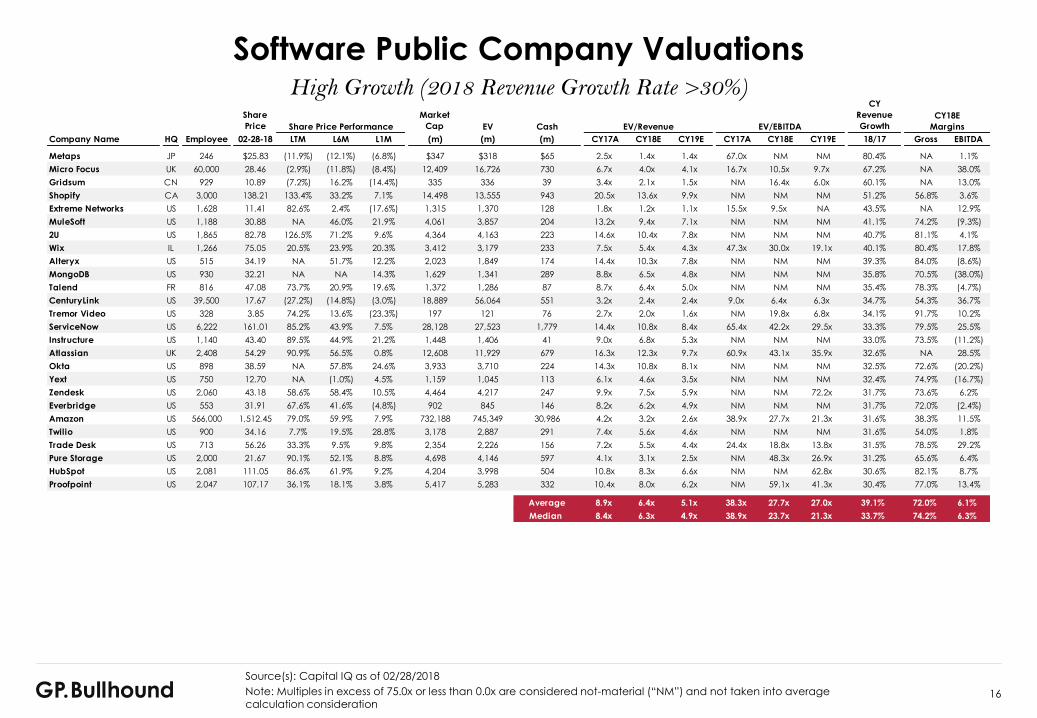
16
Software Public Company ValuationsHigh Growth (2018 Revenue Growth Rate >30%)
Source(s): Capital IQ as of 02/28/2018
Note: Multiples in excess of 75.0x or less than 0.0x are considered not-material (“NM”) and not taken into average calculation consideration
Share
Price
Market
Cap EV Cash EV/Revenue EV/EBITDA
CY
Revenue
Growth
Company Name HQ Employee 02-28-18 LTM L6M L1M (m) (m) (m) CY17A CY18E CY19E CY17A CY18E CY19E 18/17 Gross EBITDA
Share Price Performance
CY18E
Margins
Metaps JP 246 $25.83 (11.9%) (12.1%) (6.8%) $347 $318 $65 2.5x 1.4x 1.4x 67.0x NM NM 80.4% NA 1.1%
Micro Focus UK 60,000 28.46 (2.9%) (11.8%) (8.4%) 12,409 16,726 730 6.7x 4.0x 4.1x 16.7x 10.5x 9.7x 67.2% NA 38.0%
Gridsum CN 929 10.89 (7.2%) 16.2% (14.4%) 335 336 39 3.4x 2.1x 1.5x NM 16.4x 6.0x 60.1% NA 13.0%
Shopify CA 3,000 138.21 133.4% 33.2% 7.1% 14,498 13,555 943 20.5x 13.6x 9.9x NM NM NM 51.2% 56.8% 3.6%
Extreme Networks US 1,628 11.41 82.6% 2.4% (17.6%) 1,315 1,370 128 1.8x 1.2x 1.1x 15.5x 9.5x NA 43.5% NA 12.9%
MuleSoft US 1,188 30.88 NA 46.0% 21.9% 4,061 3,857 204 13.2x 9.4x 7.1x NM NM NM 41.1% 74.2% (9.3%)
2U US 1,865 82.78 126.5% 71.2% 9.6% 4,364 4,163 223 14.6x 10.4x 7.8x NM NM NM 40.7% 81.1% 4.1%
Wix IL 1,266 75.05 20.5% 23.9% 20.3% 3,412 3,179 233 7.5x 5.4x 4.3x 47.3x 30.0x 19.1x 40.1% 80.4% 17.8%
Alteryx US 515 34.19 NA 51.7% 12.2% 2,023 1,849 174 14.4x 10.3x 7.8x NM NM NM 39.3% 84.0% (8.6%)
MongoDB US 930 32.21 NA NA 14.3% 1,629 1,341 289 8.8x 6.5x 4.8x NM NM NM 35.8% 70.5% (38.0%)
Talend FR 816 47.08 73.7% 20.9% 19.6% 1,372 1,286 87 8.7x 6.4x 5.0x NM NM NM 35.4% 78.3% (4.7%)
CenturyLink US 39,500 17.67 (27.2%) (14.8%) (3.0%) 18,889 56,064 551 3.2x 2.4x 2.4x 9.0x 6.4x 6.3x 34.7% 54.3% 36.7%
Tremor Video US 328 3.85 74.2% 13.6% (23.3%) 197 121 76 2.7x 2.0x 1.6x NM 19.8x 6.8x 34.1% 91.7% 10.2%
ServiceNow US 6,222 161.01 85.2% 43.9% 7.5% 28,128 27,523 1,779 14.4x 10.8x 8.4x 65.4x 42.2x 29.5x 33.3% 79.5% 25.5%
Instructure US 1,140 43.40 89.5% 44.9% 21.2% 1,448 1,406 41 9.0x 6.8x 5.3x NM NM NM 33.0% 73.5% (11.2%)
Atlassian UK 2,408 54.29 90.9% 56.5% 0.8% 12,608 11,929 679 16.3x 12.3x 9.7x 60.9x 43.1x 35.9x 32.6% NA 28.5%
Okta US 898 38.59 NA 57.8% 24.6% 3,933 3,710 224 14.3x 10.8x 8.1x NM NM NM 32.5% 72.6% (20.2%)
Yext US 750 12.70 NA (1.0%) 4.5% 1,159 1,045 113 6.1x 4.6x 3.5x NM NM NM 32.4% 74.9% (16.7%)
Zendesk US 2,060 43.18 58.6% 58.4% 10.5% 4,464 4,217 247 9.9x 7.5x 5.9x NM NM 72.2x 31.7% 73.6% 6.2%
Everbridge US 553 31.91 67.6% 41.6% (4.8%) 902 845 146 8.2x 6.2x 4.9x NM NM NM 31.7% 72.0% (2.4%)
Amazon US 566,000 1,512.45 79.0% 59.9% 7.9% 732,188 745,349 30,986 4.2x 3.2x 2.6x 38.9x 27.7x 21.3x 31.6% 38.3% 11.5%
Twilio US 900 34.16 7.7% 19.5% 28.8% 3,178 2,887 291 7.4x 5.6x 4.6x NM NM NM 31.6% 54.0% 1.8%
Trade Desk US 713 56.26 33.3% 9.5% 9.8% 2,354 2,226 156 7.2x 5.5x 4.4x 24.4x 18.8x 13.8x 31.5% 78.5% 29.2%
Pure Storage US 2,000 21.67 90.1% 52.1% 8.8% 4,698 4,146 597 4.1x 3.1x 2.5x NM 48.3x 26.9x 31.2% 65.6% 6.4%
HubSpot US 2,081 111.05 86.6% 61.9% 9.2% 4,204 3,998 504 10.8x 8.3x 6.6x NM NM 62.8x 30.6% 82.1% 8.7%
Proofpoint US 2,047 107.17 36.1% 18.1% 3.8% 5,417 5,283 332 10.4x 8.0x 6.2x NM 59.1x 41.3x 30.4% 77.0% 13.4%
Average 8.9x 6.4x 5.1x 38.3x 27.7x 27.0x 39.1% 72.0% 6.1%
Median 8.4x 6.3x 4.9x 38.9x 23.7x 21.3x 33.7% 74.2% 6.3%
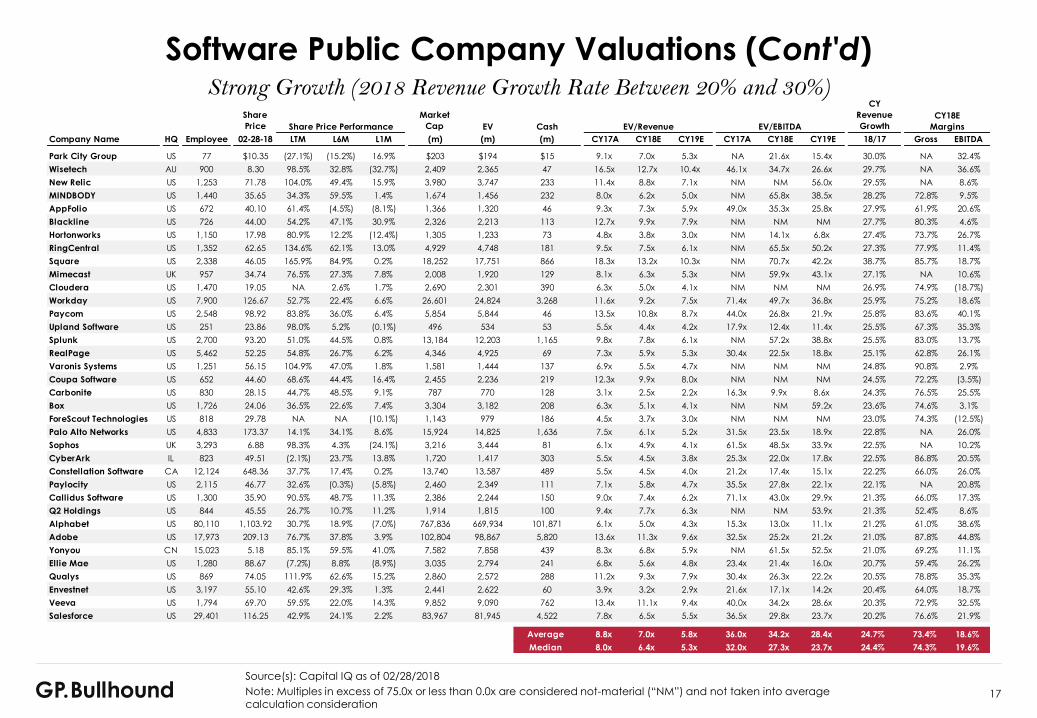
17
Software Public Company Valuations (Cont'd)Strong Growth (2018 Revenue Growth Rate Between 20% and 30%)
Source(s): Capital IQ as of 02/28/2018
Note: Multiples in excess of 75.0x or less than 0.0x are considered not-material (“NM”) and not taken into average calculation consideration
Share
Price
Market
Cap EV Cash EV/Revenue EV/EBITDA
CY
Revenue
Growth
Company Name HQ Employee 02-28-18 LTM L6M L1M (m) (m) (m) CY17A CY18E CY19E CY17A CY18E CY19E 18/17 Gross EBITDA
Share Price Performance
CY18E
Margins
Park City Group US 77 $10.35 (27.1%) (15.2%) 16.9% $203 $194 $15 9.1x 7.0x 5.3x NA 21.6x 15.4x 30.0% NA 32.4%
Wisetech AU 900 8.30 98.5% 32.8% (32.7%) 2,409 2,365 47 16.5x 12.7x 10.4x 46.1x 34.7x 26.6x 29.7% NA 36.6%
New Relic US 1,253 71.78 104.0% 49.4% 15.9% 3,980 3,747 233 11.4x 8.8x 7.1x NM NM 56.0x 29.5% NA 8.6%
MINDBODY US 1,440 35.65 34.3% 59.5% 1.4% 1,674 1,456 232 8.0x 6.2x 5.0x NM 65.8x 38.5x 28.2% 72.8% 9.5%
AppFolio US 672 40.10 61.4% (4.5%) (8.1%) 1,366 1,320 46 9.3x 7.3x 5.9x 49.0x 35.3x 25.8x 27.9% 61.9% 20.6%
Blackline US 726 44.00 54.2% 47.1% 30.9% 2,326 2,213 113 12.7x 9.9x 7.9x NM NM NM 27.7% 80.3% 4.6%
Hortonworks US 1,150 17.98 80.9% 12.2% (12.4%) 1,305 1,233 73 4.8x 3.8x 3.0x NM 14.1x 6.8x 27.4% 73.7% 26.7%
RingCentral US 1,352 62.65 134.6% 62.1% 13.0% 4,929 4,748 181 9.5x 7.5x 6.1x NM 65.5x 50.2x 27.3% 77.9% 11.4%
Square US 2,338 46.05 165.9% 84.9% 0.2% 18,252 17,751 866 18.3x 13.2x 10.3x NM 70.7x 42.2x 38.7% 85.7% 18.7%
Mimecast UK 957 34.74 76.5% 27.3% 7.8% 2,008 1,920 129 8.1x 6.3x 5.3x NM 59.9x 43.1x 27.1% NA 10.6%
Cloudera US 1,470 19.05 NA 2.6% 1.7% 2,690 2,301 390 6.3x 5.0x 4.1x NM NM NM 26.9% 74.9% (18.7%)
Workday US 7,900 126.67 52.7% 22.4% 6.6% 26,601 24,824 3,268 11.6x 9.2x 7.5x 71.4x 49.7x 36.8x 25.9% 75.2% 18.6%
Paycom US 2,548 98.92 83.8% 36.0% 6.4% 5,854 5,844 46 13.5x 10.8x 8.7x 44.0x 26.8x 21.9x 25.8% 83.6% 40.1%
Upland Software US 251 23.86 98.0% 5.2% (0.1%) 496 534 53 5.5x 4.4x 4.2x 17.9x 12.4x 11.4x 25.5% 67.3% 35.3%
Splunk US 2,700 93.20 51.0% 44.5% 0.8% 13,184 12,203 1,165 9.8x 7.8x 6.1x NM 57.2x 38.8x 25.5% 83.0% 13.7%
RealPage US 5,462 52.25 54.8% 26.7% 6.2% 4,346 4,925 69 7.3x 5.9x 5.3x 30.4x 22.5x 18.8x 25.1% 62.8% 26.1%
Varonis Systems US 1,251 56.15 104.9% 47.0% 1.8% 1,581 1,444 137 6.9x 5.5x 4.7x NM NM NM 24.8% 90.8% 2.9%
Coupa Software US 652 44.60 68.6% 44.4% 16.4% 2,455 2,236 219 12.3x 9.9x 8.0x NM NM NM 24.5% 72.2% (3.5%)
Carbonite US 830 28.15 44.7% 48.5% 9.1% 787 770 128 3.1x 2.5x 2.2x 16.3x 9.9x 8.6x 24.3% 76.5% 25.5%
Box US 1,726 24.06 36.5% 22.6% 7.4% 3,304 3,182 208 6.3x 5.1x 4.1x NM NM 59.2x 23.6% 74.6% 3.1%
ForeScout Technologies US 818 29.78 NA NA (10.1%) 1,143 979 186 4.5x 3.7x 3.0x NM NM NM 23.0% 74.3% (12.5%)
Palo Alto Networks US 4,833 173.37 14.1% 34.1% 8.6% 15,924 14,825 1,636 7.5x 6.1x 5.2x 31.5x 23.5x 18.9x 22.8% NA 26.0%
Sophos UK 3,293 6.88 98.3% 4.3% (24.1%) 3,216 3,444 81 6.1x 4.9x 4.1x 61.5x 48.5x 33.9x 22.5% NA 10.2%
CyberArk IL 823 49.51 (2.1%) 23.7% 13.8% 1,720 1,417 303 5.5x 4.5x 3.8x 25.3x 22.0x 17.8x 22.5% 86.8% 20.5%
Constellation Software CA 12,124 648.36 37.7% 17.4% 0.2% 13,740 13,587 489 5.5x 4.5x 4.0x 21.2x 17.4x 15.1x 22.2% 66.0% 26.0%
Paylocity US 2,115 46.77 32.6% (0.3%) (5.8%) 2,460 2,349 111 7.1x 5.8x 4.7x 35.5x 27.8x 22.1x 22.1% NA 20.8%
Callidus Software US 1,300 35.90 90.5% 48.7% 11.3% 2,386 2,244 150 9.0x 7.4x 6.2x 71.1x 43.0x 29.9x 21.3% 66.0% 17.3%
Q2 Holdings US 844 45.55 26.7% 10.7% 11.2% 1,914 1,815 100 9.4x 7.7x 6.3x NM NM 53.9x 21.3% 52.4% 8.6%
Alphabet US 80,110 1,103.92 30.7% 18.9% (7.0%) 767,836 669,934 101,871 6.1x 5.0x 4.3x 15.3x 13.0x 11.1x 21.2% 61.0% 38.6%
Adobe US 17,973 209.13 76.7% 37.8% 3.9% 102,804 98,867 5,820 13.6x 11.3x 9.6x 32.5x 25.2x 21.2x 21.0% 87.8% 44.8%
Yonyou CN 15,023 5.18 85.1% 59.5% 41.0% 7,582 7,858 439 8.3x 6.8x 5.9x NM 61.5x 52.5x 21.0% 69.2% 11.1%
Ellie Mae US 1,280 88.67 (7.2%) 8.8% (8.9%) 3,035 2,794 241 6.8x 5.6x 4.8x 23.4x 21.4x 16.0x 20.7% 59.4% 26.2%
Qualys US 869 74.05 111.9% 62.6% 15.2% 2,860 2,572 288 11.2x 9.3x 7.9x 30.4x 26.3x 22.2x 20.5% 78.8% 35.3%
Envestnet US 3,197 55.10 42.6% 29.3% 1.3% 2,441 2,622 60 3.9x 3.2x 2.9x 21.6x 17.1x 14.2x 20.4% 64.0% 18.7%
Veeva US 1,794 69.70 59.5% 22.0% 14.3% 9,852 9,090 762 13.4x 11.1x 9.4x 40.0x 34.2x 28.6x 20.3% 72.9% 32.5%
Salesforce US 29,401 116.25 42.9% 24.1% 2.2% 83,967 81,945 4,522 7.8x 6.5x 5.5x 36.5x 29.8x 23.7x 20.2% 76.6% 21.9%
Average 8.8x 7.0x 5.8x 36.0x 34.2x 28.4x 24.7% 73.4% 18.6%
Median 8.0x 6.4x 5.3x 32.0x 27.3x 23.7x 24.4% 74.3% 19.6%
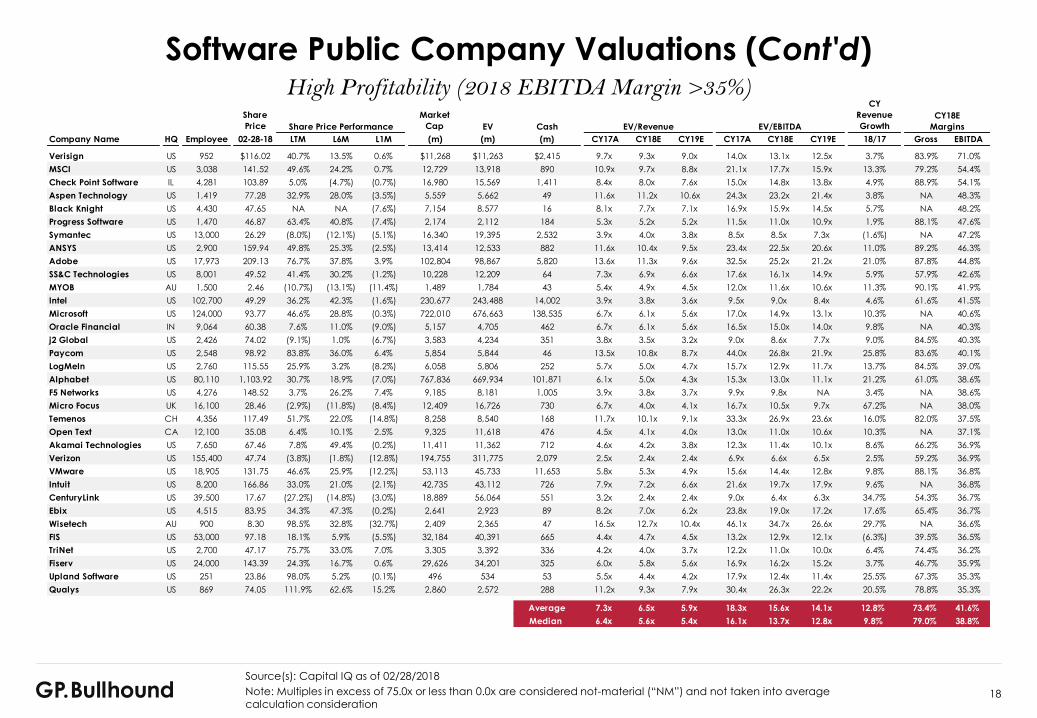
18
Software Public Company Valuations (Cont'd)High Profitability (2018 EBITDA Margin >35%)
Source(s): Capital IQ as of 02/28/2018
Note: Multiples in excess of 75.0x or less than 0.0x are considered not-material (“NM”) and not taken into average calculation consideration
Share
Price
Market
Cap EV Cash EV/Revenue EV/EBITDA
CY
Revenue
Growth
Company Name HQ Employee 02-28-18 LTM L6M L1M (m) (m) (m) CY17A CY18E CY19E CY17A CY18E CY19E 18/17 Gross EBITDA
Share Price Performance
CY18E
Margins
Verisign US 952 $116.02 40.7% 13.5% 0.6% $11,268 $11,263 $2,415 9.7x 9.3x 9.0x 14.0x 13.1x 12.5x 3.7% 83.9% 71.0%
MSCI US 3,038 141.52 49.6% 24.2% 0.7% 12,729 13,918 890 10.9x 9.7x 8.8x 21.1x 17.7x 15.9x 13.3% 79.2% 54.4%
Check Point Software IL 4,281 103.89 5.0% (4.7%) (0.7%) 16,980 15,569 1,411 8.4x 8.0x 7.6x 15.0x 14.8x 13.8x 4.9% 88.9% 54.1%
Aspen Technology US 1,419 77.28 32.9% 28.0% (3.5%) 5,559 5,662 49 11.6x 11.2x 10.6x 24.3x 23.2x 21.4x 3.8% NA 48.3%
Black Knight US 4,430 47.65 NA NA (7.6%) 7,154 8,577 16 8.1x 7.7x 7.1x 16.9x 15.9x 14.5x 5.7% NA 48.2%
Progress Software US 1,470 46.87 63.4% 40.8% (7.4%) 2,174 2,112 184 5.3x 5.2x 5.2x 11.5x 11.0x 10.9x 1.9% 88.1% 47.6%
Symantec US 13,000 26.29 (8.0%) (12.1%) (5.1%) 16,340 19,395 2,532 3.9x 4.0x 3.8x 8.5x 8.5x 7.3x (1.6%) NA 47.2%
ANSYS US 2,900 159.94 49.8% 25.3% (2.5%) 13,414 12,533 882 11.6x 10.4x 9.5x 23.4x 22.5x 20.6x 11.0% 89.2% 46.3%
Adobe US 17,973 209.13 76.7% 37.8% 3.9% 102,804 98,867 5,820 13.6x 11.3x 9.6x 32.5x 25.2x 21.2x 21.0% 87.8% 44.8%
SS&C Technologies US 8,001 49.52 41.4% 30.2% (1.2%) 10,228 12,209 64 7.3x 6.9x 6.6x 17.6x 16.1x 14.9x 5.9% 57.9% 42.6%
MYOB AU 1,500 2.46 (10.7%) (13.1%) (11.4%) 1,489 1,784 43 5.4x 4.9x 4.5x 12.0x 11.6x 10.6x 11.3% 90.1% 41.9%
Intel US 102,700 49.29 36.2% 42.3% (1.6%) 230,677 243,488 14,002 3.9x 3.8x 3.6x 9.5x 9.0x 8.4x 4.6% 61.6% 41.5%
Microsoft US 124,000 93.77 46.6% 28.8% (0.3%) 722,010 676,663 138,535 6.7x 6.1x 5.6x 17.0x 14.9x 13.1x 10.3% NA 40.6%
Oracle Financial IN 9,064 60.38 7.6% 11.0% (9.0%) 5,157 4,705 462 6.7x 6.1x 5.6x 16.5x 15.0x 14.0x 9.8% NA 40.3%
j2 Global US 2,426 74.02 (9.1%) 1.0% (6.7%) 3,583 4,234 351 3.8x 3.5x 3.2x 9.0x 8.6x 7.7x 9.0% 84.5% 40.3%
Paycom US 2,548 98.92 83.8% 36.0% 6.4% 5,854 5,844 46 13.5x 10.8x 8.7x 44.0x 26.8x 21.9x 25.8% 83.6% 40.1%
LogMeIn US 2,760 115.55 25.9% 3.2% (8.2%) 6,058 5,806 252 5.7x 5.0x 4.7x 15.7x 12.9x 11.7x 13.7% 84.5% 39.0%
Alphabet US 80,110 1,103.92 30.7% 18.9% (7.0%) 767,836 669,934 101,871 6.1x 5.0x 4.3x 15.3x 13.0x 11.1x 21.2% 61.0% 38.6%
F5 Networks US 4,276 148.52 3.7% 26.2% 7.4% 9,185 8,181 1,005 3.9x 3.8x 3.7x 9.9x 9.8x NA 3.4% NA 38.6%
Micro Focus UK 16,100 28.46 (2.9%) (11.8%) (8.4%) 12,409 16,726 730 6.7x 4.0x 4.1x 16.7x 10.5x 9.7x 67.2% NA 38.0%
Temenos CH 4,356 117.49 51.7% 22.0% (14.8%) 8,258 8,540 168 11.7x 10.1x 9.1x 33.3x 26.9x 23.6x 16.0% 82.0% 37.5%
Open Text CA 12,100 35.08 6.4% 10.1% 2.5% 9,325 11,618 476 4.5x 4.1x 4.0x 13.0x 11.0x 10.6x 10.3% NA 37.1%
Akamai Technologies US 7,650 67.46 7.8% 49.4% (0.2%) 11,411 11,362 712 4.6x 4.2x 3.8x 12.3x 11.4x 10.1x 8.6% 66.2% 36.9%
Verizon US 155,400 47.74 (3.8%) (1.8%) (12.8%) 194,755 311,775 2,079 2.5x 2.4x 2.4x 6.9x 6.6x 6.5x 2.5% 59.2% 36.9%
VMware US 18,905 131.75 46.6% 25.9% (12.2%) 53,113 45,733 11,653 5.8x 5.3x 4.9x 15.6x 14.4x 12.8x 9.8% 88.1% 36.8%
Intuit US 8,200 166.86 33.0% 21.0% (2.1%) 42,735 43,112 726 7.9x 7.2x 6.6x 21.6x 19.7x 17.9x 9.6% NA 36.8%
CenturyLink US 39,500 17.67 (27.2%) (14.8%) (3.0%) 18,889 56,064 551 3.2x 2.4x 2.4x 9.0x 6.4x 6.3x 34.7% 54.3% 36.7%
Ebix US 4,515 83.95 34.3% 47.3% (0.2%) 2,641 2,923 89 8.2x 7.0x 6.2x 23.8x 19.0x 17.2x 17.6% 65.4% 36.7%
Wisetech AU 900 8.30 98.5% 32.8% (32.7%) 2,409 2,365 47 16.5x 12.7x 10.4x 46.1x 34.7x 26.6x 29.7% NA 36.6%
FIS US 53,000 97.18 18.1% 5.9% (5.5%) 32,184 40,391 665 4.4x 4.7x 4.5x 13.2x 12.9x 12.1x (6.3%) 39.5% 36.5%
TriNet US 2,700 47.17 75.7% 33.0% 7.0% 3,305 3,392 336 4.2x 4.0x 3.7x 12.2x 11.0x 10.0x 6.4% 74.4% 36.2%
Fiserv US 24,000 143.39 24.3% 16.7% 0.6% 29,626 34,201 325 6.0x 5.8x 5.6x 16.9x 16.2x 15.2x 3.7% 46.7% 35.9%
Upland Software US 251 23.86 98.0% 5.2% (0.1%) 496 534 53 5.5x 4.4x 4.2x 17.9x 12.4x 11.4x 25.5% 67.3% 35.3%
Qualys US 869 74.05 111.9% 62.6% 15.2% 2,860 2,572 288 11.2x 9.3x 7.9x 30.4x 26.3x 22.2x 20.5% 78.8% 35.3%
Average 7.3x 6.5x 5.9x 18.3x 15.6x 14.1x 12.8% 73.4% 41.6%
Median 6.4x 5.6x 5.4x 16.1x 13.7x 12.8x 9.8% 79.0% 38.8%
19
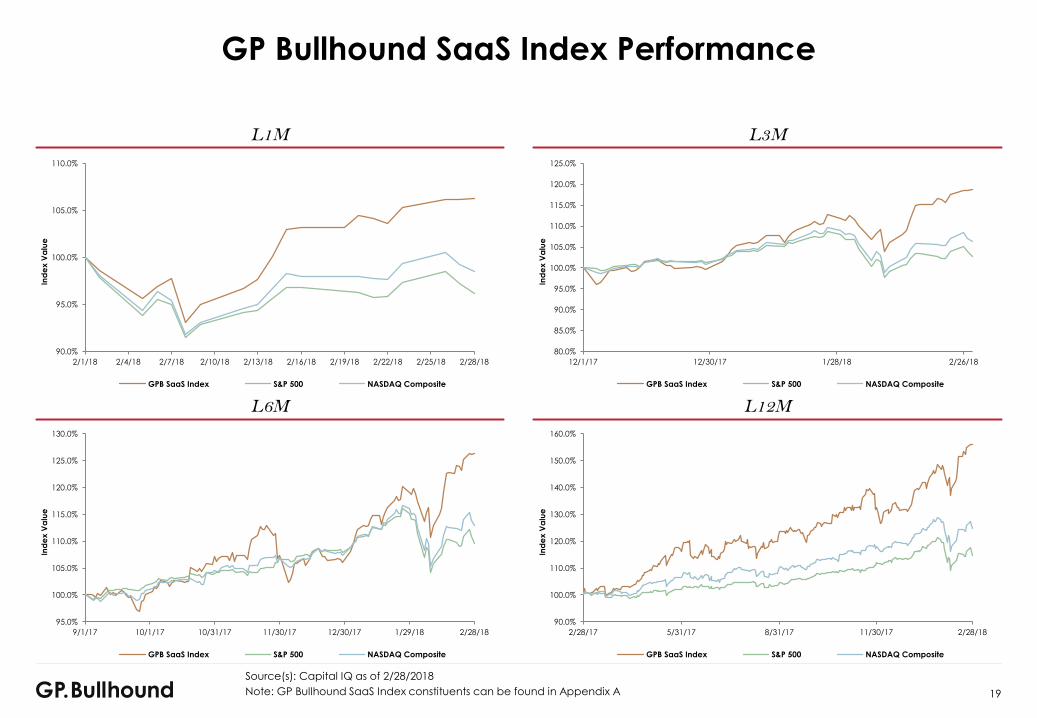
GP Bullhound SaaS Index Performance
L1M L3M
L6M L12M
Source(s): Capital IQ as of 2/28/2018
Note: GP Bullhound SaaS Index constituents can be found in Appendix A
80.0%
85.0%
90.0%
95.0%
100.0%
105.0%
110.0%
115.0%
120.0%
125.0%
12/1/17 12/30/17 1/28/18 2/26/18
Ind
ex V
alu
e
GPB SaaS Index S&P 500 NASDAQ Composite
95.0%
100.0%
105.0%
110.0%
115.0%
120.0%
125.0%
130.0%
9/1/17 10/1/17 10/31/17 11/30/17 12/30/17 1/29/18 2/28/18
Ind
ex
Va
lue
GPB SaaS Index S&P 500 NASDAQ Composite
90.0%
100.0%
110.0%
120.0%
130.0%
140.0%
150.0%
160.0%
2/28/17 5/31/17 8/31/17 11/30/17 2/28/18
Ind
ex
Va
lue
GPB SaaS Index S&P 500 NASDAQ Composite
90.0%
95.0%
100.0%
105.0%
110.0%
2/1/18 2/4/18 2/7/18 2/10/18 2/13/18 2/16/18 2/19/18 2/22/18 2/25/18 2/28/18
Ind
ex V
alu
e
GPB SaaS Index S&P 500 NASDAQ Composite
20
Key Sector Takeaways
Recent Software Transaction Trends
Public Market SaaS Analyses
Key SaaS Metrics
Appendix A: GP Bullhound SaaS Index
Appendix B: Software Public Comps by Category
1
2
3
4
6
7
8Appendix C: GP Bullhound Software Report
Overview, Software Credentials & Team
5 SaaS CEO Commentary
21
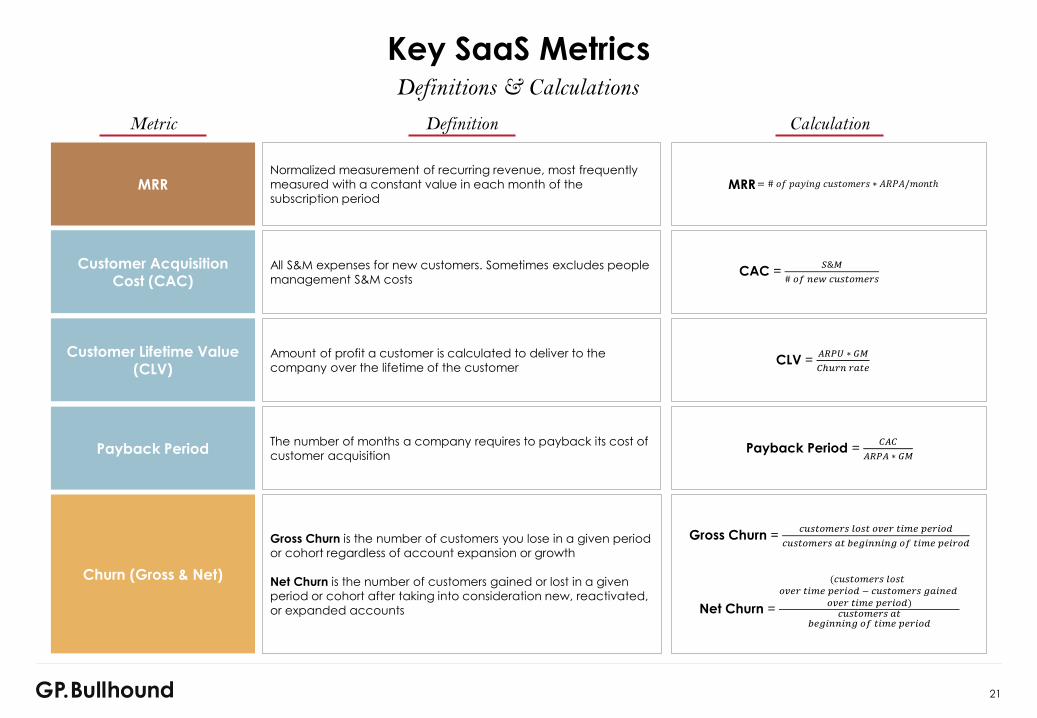
Key SaaS MetricsDefinitions & Calculations
Metric Definition Calculation
Normalized measurement of recurring revenue, most frequently
measured with a constant value in each month of the
subscription periodMRR
All S&M expenses for new customers. Sometimes excludes people
management S&M costsCAC =
𝑆&𝑀
# 𝑜𝑓 𝑛𝑒𝑤 𝑐𝑢𝑠𝑡𝑜𝑚𝑒𝑟𝑠
Customer Acquisition Cost (CAC)
Amount of profit a customer is calculated to deliver to the
company over the lifetime of the customerCLV =
𝐴𝑅𝑃𝑈 ∗ 𝐺𝑀
𝐶ℎ𝑢𝑟𝑛 𝑟𝑎𝑡𝑒
Customer Lifetime Value (CLV)
The number of months a company requires to payback its cost of
customer acquisitionPayback Period =
𝐶𝐴𝐶
𝐴𝑅𝑃𝐴 ∗ 𝐺𝑀Payback Period
Churn (Gross & Net)
Gross Churn is the number of customers you lose in a given period
or cohort regardless of account expansion or growth
Net Churn is the number of customers gained or lost in a given
period or cohort after taking into consideration new, reactivated,
or expanded accounts Net Churn =
(𝑐𝑢𝑠𝑡𝑜𝑚𝑒𝑟𝑠 𝑙𝑜𝑠𝑡𝑜𝑣𝑒𝑟 𝑡𝑖𝑚𝑒 𝑝𝑒𝑟𝑖𝑜𝑑 − 𝑐𝑢𝑠𝑡𝑜𝑚𝑒𝑟𝑠 𝑔𝑎𝑖𝑛𝑒𝑑
𝑜𝑣𝑒𝑟 𝑡𝑖𝑚𝑒 𝑝𝑒𝑟𝑖𝑜𝑑)𝑐𝑢𝑠𝑡𝑜𝑚𝑒𝑟𝑠 𝑎𝑡
𝑏𝑒𝑔𝑖𝑛𝑛𝑖𝑛𝑔 𝑜𝑓 𝑡𝑖𝑚𝑒 𝑝𝑒𝑟𝑖𝑜𝑑
Gross Churn = 𝑐𝑢𝑠𝑡𝑜𝑚𝑒𝑟𝑠 𝑙𝑜𝑠𝑡 𝑜𝑣𝑒𝑟 𝑡𝑖𝑚𝑒 𝑝𝑒𝑟𝑖𝑜𝑑
𝑐𝑢𝑠𝑡𝑜𝑚𝑒𝑟𝑠 𝑎𝑡 𝑏𝑒𝑔𝑖𝑛𝑛𝑖𝑛𝑔 𝑜𝑓 𝑡𝑖𝑚𝑒 𝑝𝑒𝑖𝑟𝑜𝑑
MRR= # 𝑜𝑓 𝑝𝑎𝑦𝑖𝑛𝑔 𝑐𝑢𝑠𝑡𝑜𝑚𝑒𝑟𝑠 ∗ 𝐴𝑅𝑃𝐴/𝑚𝑜𝑛𝑡ℎ
22
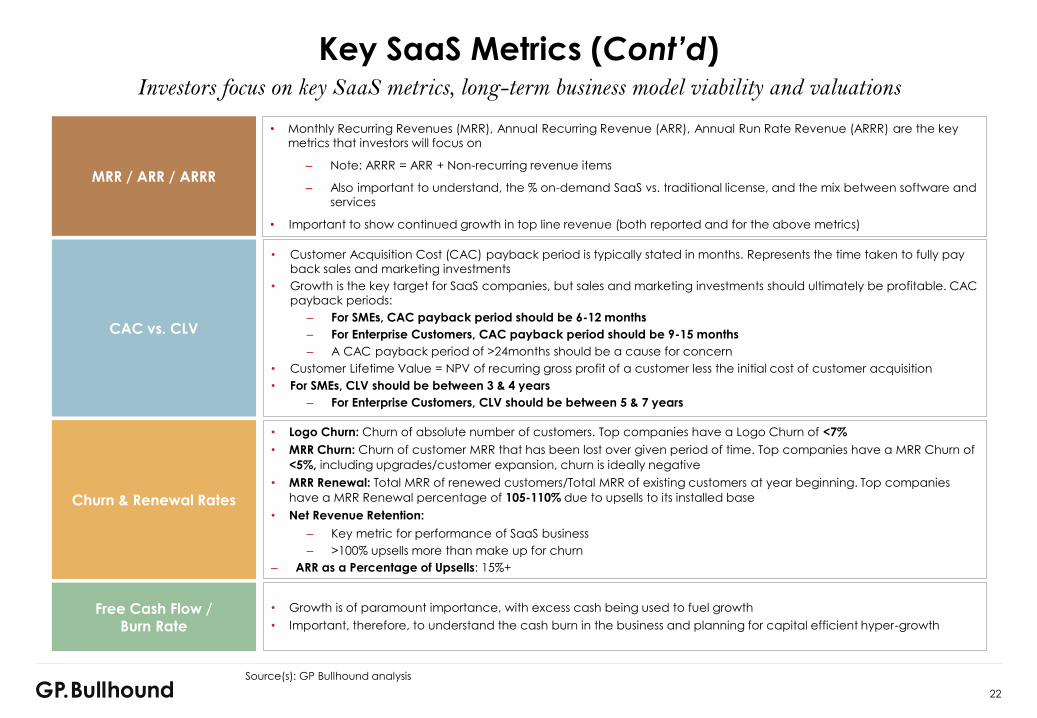
Key SaaS Metrics (Cont’d)
• Monthly Recurring Revenues (MRR), Annual Recurring Revenue (ARR), Annual Run Rate Revenue (ARRR) are the key
metrics that investors will focus on
– Note: ARRR = ARR + Non-recurring revenue items
– Also important to understand, the % on-demand SaaS vs. traditional license, and the mix between software and
services
• Important to show continued growth in top line revenue (both reported and for the above metrics)
MRR / ARR / ARRR
• Customer Acquisition Cost (CAC) payback period is typically stated in months. Represents the time taken to fully pay
back sales and marketing investments
• Growth is the key target for SaaS companies, but sales and marketing investments should ultimately be profitable. CAC
payback periods:
– For SMEs, CAC payback period should be 6-12 months
– For Enterprise Customers, CAC payback period should be 9-15 months
– A CAC payback period of >24months should be a cause for concern
• Customer Lifetime Value = NPV of recurring gross profit of a customer less the initial cost of customer acquisition
• For SMEs, CLV should be between 3 & 4 years
– For Enterprise Customers, CLV should be between 5 & 7 years
CAC vs. CLV
• Logo Churn: Churn of absolute number of customers. Top companies have a Logo Churn of <7%
• MRR Churn: Churn of customer MRR that has been lost over given period of time. Top companies have a MRR Churn of
<5%, including upgrades/customer expansion, churn is ideally negative
• MRR Renewal: Total MRR of renewed customers/Total MRR of existing customers at year beginning. Top companies
have a MRR Renewal percentage of 105-110% due to upsells to its installed base
• Net Revenue Retention:
– Key metric for performance of SaaS business
– >100% upsells more than make up for churn
– ARR as a Percentage of Upsells: 15%+
Churn & Renewal Rates
• Growth is of paramount importance, with excess cash being used to fuel growth
• Important, therefore, to understand the cash burn in the business and planning for capital efficient hyper-growth
Free Cash Flow / Burn Rate
Source(s): GP Bullhound analysis
Investors focus on key SaaS metrics, long-term business model viability and valuations
23
Key Sector Takeaways
Recent Software Transaction Trends
Public Market SaaS Analyses
Key SaaS Metrics
Appendix A: GP Bullhound SaaS Index
Appendix B: Software Public Comps by Category
1
2
3
4
6
7
8Appendix C: GP Bullhound Software Report
Overview, Software Credentials & Team
5 SaaS CEO Commentary
24
SaaS Company Executive Commentary
Celigo is redefining the future of cloud-based
application integration through an easy-to-use,
next-generation integration Platform-as-a-Service
(iPaaS) that enables companies to integrate almost
anything to anything.
JAN ARENDTSZFounder & CEO
"The phenomenal success of SaaS over the last ten years has
spawned thousands of new cloud applications. The
proliferation of these apps is a direct result of the
consumerization of enterprise software, where clunky
interfaces and complex implementations are a relic of the past.
Today, most mid-market companies use well over 100
specialized cloud-based apps and services that are easy to
purchase by line managers and quick to deploy. That’s the easy
part. They soon find out that to be successful, they need to
integrate the enterprise. These apps need to be connected with a
simplicity that matches the simplicity of the underlying apps
themselves."
25
SaaS Company Executive Commentary (Cont’d)
GERO DECKERCo-Founder & CEO
"Many companies are overwhelmed with the pace, volume and
complexity of change. Faced with disruption in the market,
new technologies and complex regulatory requirements,
organizations are desperate to become more agile. SaaS
offerings like the Signavio suite come at a perfect time to help
these businesses solve their challenges and fundamentally
improve the way they work. With a focus on delivering
customer success, SaaS providers can make a sustainable
difference at scale - and yield fantastic returns for their
investors along the way."
Signavio enables companies to translate between
strategy and execution. Its Business Transformation
Suite helps analyze, improve, reinvent and
automate business processes across the enterprise.
26
SaaS Company Executive Commentary (Cont’d)
JOERG WIEMERCo-Founder & CEO
“As any scrappy entrepreneur will tell you, cash burn rates
provide a very good sense for the steady-state health of the
business. Detailed cash flow metrics are a must have.
However, large organizations rarely use this metrics to run
their business. They still rely on accounting data. This triggers
some problems, because accounting data is an opinion from
yesterday, after the accountant has dome his work. Only cash
tells you the truth in real time. CXO`s have realized that cash
flow is the lifeblood of a business and payment processes are
carrying this lifeblood. We deliver smart payment processes to
help great organizations to make better decisions in real time.”
TIS is a leading global cloud platform for managing
corporate payments and cash flows. The platform
provides bank account management, payments,
business discovery, cash flow, ERP integration, and
certification solutions for treasurers, CFOs, and firms
in the accounting and IT industry.
27
Key Sector Takeaways
Recent Software Transaction Trends
Public Market SaaS Analyses
Key SaaS Metrics
Appendix A: GP Bullhound SaaS Index
Appendix B: Software Public Comps by Category
1
2
3
4
6
7
8Appendix C: GP Bullhound Software Report
Overview, Software Credentials & Team
5 SaaS CEO Commentary
28
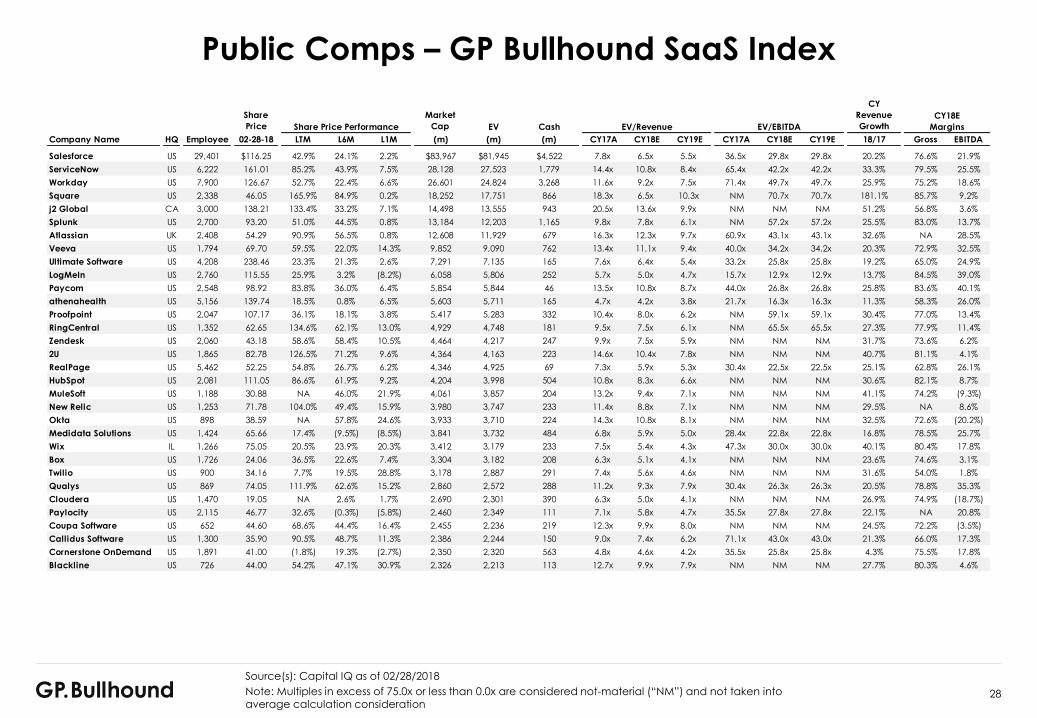
Public Comps – GP Bullhound SaaS Index
Source(s): Capital IQ as of 02/28/2018
Note: Multiples in excess of 75.0x or less than 0.0x are considered not-material (“NM”) and not taken into average calculation consideration
Salesforce US 29,401 $116.25 42.9% 24.1% 2.2% $83,967 $81,945 $4,522 7.8x 6.5x 5.5x 36.5x 29.8x 29.8x 20.2% 76.6% 21.9%
ServiceNow US 6,222 161.01 85.2% 43.9% 7.5% 28,128 27,523 1,779 14.4x 10.8x 8.4x 65.4x 42.2x 42.2x 33.3% 79.5% 25.5%
Workday US 7,900 126.67 52.7% 22.4% 6.6% 26,601 24,824 3,268 11.6x 9.2x 7.5x 71.4x 49.7x 49.7x 25.9% 75.2% 18.6%
Square US 2,338 46.05 165.9% 84.9% 0.2% 18,252 17,751 866 18.3x 6.5x 10.3x NM 70.7x 70.7x 181.1% 85.7% 9.2%
j2 Global CA 3,000 138.21 133.4% 33.2% 7.1% 14,498 13,555 943 20.5x 13.6x 9.9x NM NM NM 51.2% 56.8% 3.6%
Splunk US 2,700 93.20 51.0% 44.5% 0.8% 13,184 12,203 1,165 9.8x 7.8x 6.1x NM 57.2x 57.2x 25.5% 83.0% 13.7%
Atlassian UK 2,408 54.29 90.9% 56.5% 0.8% 12,608 11,929 679 16.3x 12.3x 9.7x 60.9x 43.1x 43.1x 32.6% NA 28.5%
Veeva US 1,794 69.70 59.5% 22.0% 14.3% 9,852 9,090 762 13.4x 11.1x 9.4x 40.0x 34.2x 34.2x 20.3% 72.9% 32.5%
Ultimate Software US 4,208 238.46 23.3% 21.3% 2.6% 7,291 7,135 165 7.6x 6.4x 5.4x 33.2x 25.8x 25.8x 19.2% 65.0% 24.9%
LogMeIn US 2,760 115.55 25.9% 3.2% (8.2%) 6,058 5,806 252 5.7x 5.0x 4.7x 15.7x 12.9x 12.9x 13.7% 84.5% 39.0%
Paycom US 2,548 98.92 83.8% 36.0% 6.4% 5,854 5,844 46 13.5x 10.8x 8.7x 44.0x 26.8x 26.8x 25.8% 83.6% 40.1%
athenahealth US 5,156 139.74 18.5% 0.8% 6.5% 5,603 5,711 165 4.7x 4.2x 3.8x 21.7x 16.3x 16.3x 11.3% 58.3% 26.0%
Proofpoint US 2,047 107.17 36.1% 18.1% 3.8% 5,417 5,283 332 10.4x 8.0x 6.2x NM 59.1x 59.1x 30.4% 77.0% 13.4%
RingCentral US 1,352 62.65 134.6% 62.1% 13.0% 4,929 4,748 181 9.5x 7.5x 6.1x NM 65.5x 65.5x 27.3% 77.9% 11.4%
Zendesk US 2,060 43.18 58.6% 58.4% 10.5% 4,464 4,217 247 9.9x 7.5x 5.9x NM NM NM 31.7% 73.6% 6.2%
2U US 1,865 82.78 126.5% 71.2% 9.6% 4,364 4,163 223 14.6x 10.4x 7.8x NM NM NM 40.7% 81.1% 4.1%
RealPage US 5,462 52.25 54.8% 26.7% 6.2% 4,346 4,925 69 7.3x 5.9x 5.3x 30.4x 22.5x 22.5x 25.1% 62.8% 26.1%
HubSpot US 2,081 111.05 86.6% 61.9% 9.2% 4,204 3,998 504 10.8x 8.3x 6.6x NM NM NM 30.6% 82.1% 8.7%
MuleSoft US 1,188 30.88 NA 46.0% 21.9% 4,061 3,857 204 13.2x 9.4x 7.1x NM NM NM 41.1% 74.2% (9.3%)
New Relic US 1,253 71.78 104.0% 49.4% 15.9% 3,980 3,747 233 11.4x 8.8x 7.1x NM NM NM 29.5% NA 8.6%
Okta US 898 38.59 NA 57.8% 24.6% 3,933 3,710 224 14.3x 10.8x 8.1x NM NM NM 32.5% 72.6% (20.2%)
Medidata Solutions US 1,424 65.66 17.4% (9.5%) (8.5%) 3,841 3,732 484 6.8x 5.9x 5.0x 28.4x 22.8x 22.8x 16.8% 78.5% 25.7%
Wix IL 1,266 75.05 20.5% 23.9% 20.3% 3,412 3,179 233 7.5x 5.4x 4.3x 47.3x 30.0x 30.0x 40.1% 80.4% 17.8%
Box US 1,726 24.06 36.5% 22.6% 7.4% 3,304 3,182 208 6.3x 5.1x 4.1x NM NM NM 23.6% 74.6% 3.1%
Twilio US 900 34.16 7.7% 19.5% 28.8% 3,178 2,887 291 7.4x 5.6x 4.6x NM NM NM 31.6% 54.0% 1.8%
Qualys US 869 74.05 111.9% 62.6% 15.2% 2,860 2,572 288 11.2x 9.3x 7.9x 30.4x 26.3x 26.3x 20.5% 78.8% 35.3%
Cloudera US 1,470 19.05 NA 2.6% 1.7% 2,690 2,301 390 6.3x 5.0x 4.1x NM NM NM 26.9% 74.9% (18.7%)
Paylocity US 2,115 46.77 32.6% (0.3%) (5.8%) 2,460 2,349 111 7.1x 5.8x 4.7x 35.5x 27.8x 27.8x 22.1% NA 20.8%
Coupa Software US 652 44.60 68.6% 44.4% 16.4% 2,455 2,236 219 12.3x 9.9x 8.0x NM NM NM 24.5% 72.2% (3.5%)
Callidus Software US 1,300 35.90 90.5% 48.7% 11.3% 2,386 2,244 150 9.0x 7.4x 6.2x 71.1x 43.0x 43.0x 21.3% 66.0% 17.3%
Cornerstone OnDemand US 1,891 41.00 (1.8%) 19.3% (2.7%) 2,350 2,320 563 4.8x 4.6x 4.2x 35.5x 25.8x 25.8x 4.3% 75.5% 17.8%
Blackline US 726 44.00 54.2% 47.1% 30.9% 2,326 2,213 113 12.7x 9.9x 7.9x NM NM NM 27.7% 80.3% 4.6%
Share
Price
Market
Cap EV Cash EV/Revenue EV/EBITDA
CY
Revenue
Growth
Company Name HQ Employee 02-28-18 LTM L6M L1M (m) (m) (m) CY17A CY18E CY19E CY17A CY18E CY19E 18/17 Gross EBITDA
Share Price Performance
CY18E
Margins
29
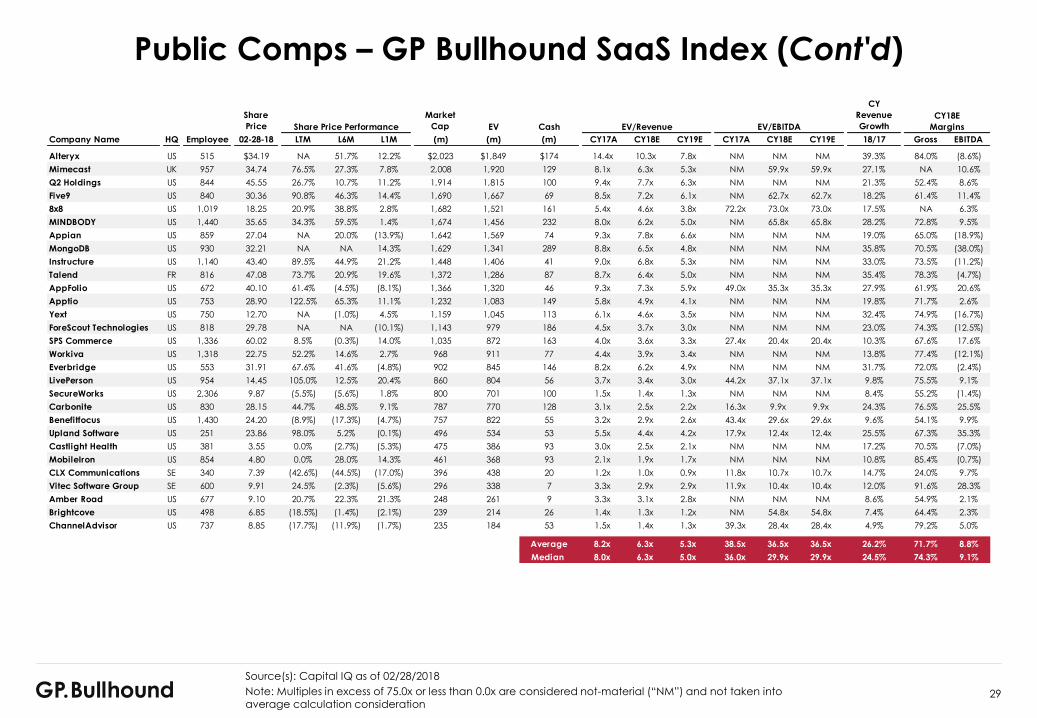
Public Comps – GP Bullhound SaaS Index (Cont'd)
Source(s): Capital IQ as of 02/28/2018
Note: Multiples in excess of 75.0x or less than 0.0x are considered not-material (“NM”) and not taken into average calculation consideration
Alteryx US 515 $34.19 NA 51.7% 12.2% $2,023 $1,849 $174 14.4x 10.3x 7.8x NM NM NM 39.3% 84.0% (8.6%)
Mimecast UK 957 34.74 76.5% 27.3% 7.8% 2,008 1,920 129 8.1x 6.3x 5.3x NM 59.9x 59.9x 27.1% NA 10.6%
Q2 Holdings US 844 45.55 26.7% 10.7% 11.2% 1,914 1,815 100 9.4x 7.7x 6.3x NM NM NM 21.3% 52.4% 8.6%
Five9 US 840 30.36 90.8% 46.3% 14.4% 1,690 1,667 69 8.5x 7.2x 6.1x NM 62.7x 62.7x 18.2% 61.4% 11.4%
8x8 US 1,019 18.25 20.9% 38.8% 2.8% 1,682 1,521 161 5.4x 4.6x 3.8x 72.2x 73.0x 73.0x 17.5% NA 6.3%
MINDBODY US 1,440 35.65 34.3% 59.5% 1.4% 1,674 1,456 232 8.0x 6.2x 5.0x NM 65.8x 65.8x 28.2% 72.8% 9.5%
Appian US 859 27.04 NA 20.0% (13.9%) 1,642 1,569 74 9.3x 7.8x 6.6x NM NM NM 19.0% 65.0% (18.9%)
MongoDB US 930 32.21 NA NA 14.3% 1,629 1,341 289 8.8x 6.5x 4.8x NM NM NM 35.8% 70.5% (38.0%)
Instructure US 1,140 43.40 89.5% 44.9% 21.2% 1,448 1,406 41 9.0x 6.8x 5.3x NM NM NM 33.0% 73.5% (11.2%)
Talend FR 816 47.08 73.7% 20.9% 19.6% 1,372 1,286 87 8.7x 6.4x 5.0x NM NM NM 35.4% 78.3% (4.7%)
AppFolio US 672 40.10 61.4% (4.5%) (8.1%) 1,366 1,320 46 9.3x 7.3x 5.9x 49.0x 35.3x 35.3x 27.9% 61.9% 20.6%
Apptio US 753 28.90 122.5% 65.3% 11.1% 1,232 1,083 149 5.8x 4.9x 4.1x NM NM NM 19.8% 71.7% 2.6%
Yext US 750 12.70 NA (1.0%) 4.5% 1,159 1,045 113 6.1x 4.6x 3.5x NM NM NM 32.4% 74.9% (16.7%)
ForeScout Technologies US 818 29.78 NA NA (10.1%) 1,143 979 186 4.5x 3.7x 3.0x NM NM NM 23.0% 74.3% (12.5%)
SPS Commerce US 1,336 60.02 8.5% (0.3%) 14.0% 1,035 872 163 4.0x 3.6x 3.3x 27.4x 20.4x 20.4x 10.3% 67.6% 17.6%
Workiva US 1,318 22.75 52.2% 14.6% 2.7% 968 911 77 4.4x 3.9x 3.4x NM NM NM 13.8% 77.4% (12.1%)
Everbridge US 553 31.91 67.6% 41.6% (4.8%) 902 845 146 8.2x 6.2x 4.9x NM NM NM 31.7% 72.0% (2.4%)
LivePerson US 954 14.45 105.0% 12.5% 20.4% 860 804 56 3.7x 3.4x 3.0x 44.2x 37.1x 37.1x 9.8% 75.5% 9.1%
SecureWorks US 2,306 9.87 (5.5%) (5.6%) 1.8% 800 701 100 1.5x 1.4x 1.3x NM NM NM 8.4% 55.2% (1.4%)
Carbonite US 830 28.15 44.7% 48.5% 9.1% 787 770 128 3.1x 2.5x 2.2x 16.3x 9.9x 9.9x 24.3% 76.5% 25.5%
Benefitfocus US 1,430 24.20 (8.9%) (17.3%) (4.7%) 757 822 55 3.2x 2.9x 2.6x 43.4x 29.6x 29.6x 9.6% 54.1% 9.9%
Upland Software US 251 23.86 98.0% 5.2% (0.1%) 496 534 53 5.5x 4.4x 4.2x 17.9x 12.4x 12.4x 25.5% 67.3% 35.3%
Castlight Health US 381 3.55 0.0% (2.7%) (5.3%) 475 386 93 3.0x 2.5x 2.1x NM NM NM 17.2% 70.5% (7.0%)
MobileIron US 854 4.80 0.0% 28.0% 14.3% 461 368 93 2.1x 1.9x 1.7x NM NM NM 10.8% 85.4% (0.7%)
CLX Communications SE 340 7.39 (42.6%) (44.5%) (17.0%) 396 438 20 1.2x 1.0x 0.9x 11.8x 10.7x 10.7x 14.7% 24.0% 9.7%
Vitec Software Group SE 600 9.91 24.5% (2.3%) (5.6%) 296 338 7 3.3x 2.9x 2.9x 11.9x 10.4x 10.4x 12.0% 91.6% 28.3%
Amber Road US 677 9.10 20.7% 22.3% 21.3% 248 261 9 3.3x 3.1x 2.8x NM NM NM 8.6% 54.9% 2.1%
Brightcove US 498 6.85 (18.5%) (1.4%) (2.1%) 239 214 26 1.4x 1.3x 1.2x NM 54.8x 54.8x 7.4% 64.4% 2.3%
ChannelAdvisor US 737 8.85 (17.7%) (11.9%) (1.7%) 235 184 53 1.5x 1.4x 1.3x 39.3x 28.4x 28.4x 4.9% 79.2% 5.0%
Average 8.2x 6.3x 5.3x 38.5x 36.5x 36.5x 26.2% 71.7% 8.8%
Median 8.0x 6.3x 5.0x 36.0x 29.9x 29.9x 24.5% 74.3% 9.1%
Share
Price
Market
Cap EV Cash EV/Revenue EV/EBITDA
CY
Revenue
Growth
Company Name HQ Employee 02-28-18 LTM L6M L1M (m) (m) (m) CY17A CY18E CY19E CY17A CY18E CY19E 18/17 Gross EBITDA
Share Price Performance
CY18E
Margins
30
Key Sector Takeaways
Recent Software Transaction Trends
Public Market SaaS Analyses
Key SaaS Metrics
Appendix A: GP Bullhound SaaS Index
Appendix B: Software Public Comps by Category
1
2
3
4
6
7
8Appendix C: GP Bullhound Software Report
Overview, Software Credentials & Team
5 SaaS CEO Commentary
31
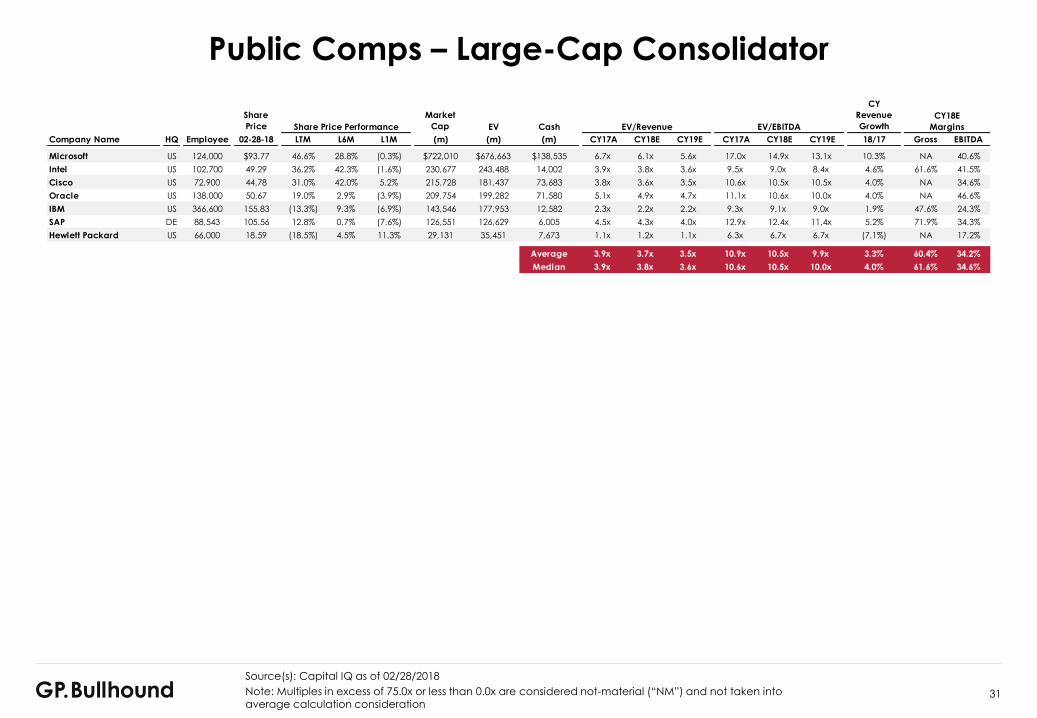
Public Comps – Large-Cap Consolidator
Source(s): Capital IQ as of 02/28/2018
Note: Multiples in excess of 75.0x or less than 0.0x are considered not-material (“NM”) and not taken into average calculation consideration
Microsoft US 124,000 $93.77 46.6% 28.8% (0.3%) $722,010 $676,663 $138,535 6.7x 6.1x 5.6x 17.0x 14.9x 13.1x 10.3% NA 40.6%
Intel US 102,700 49.29 36.2% 42.3% (1.6%) 230,677 243,488 14,002 3.9x 3.8x 3.6x 9.5x 9.0x 8.4x 4.6% 61.6% 41.5%
Cisco US 72,900 44.78 31.0% 42.0% 5.2% 215,728 181,437 73,683 3.8x 3.6x 3.5x 10.6x 10.5x 10.5x 4.0% NA 34.6%
Oracle US 138,000 50.67 19.0% 2.9% (3.9%) 209,754 199,282 71,580 5.1x 4.9x 4.7x 11.1x 10.6x 10.0x 4.0% NA 46.6%
IBM US 366,600 155.83 (13.3%) 9.3% (6.9%) 143,546 177,953 12,582 2.3x 2.2x 2.2x 9.3x 9.1x 9.0x 1.9% 47.6% 24.3%
SAP DE 88,543 105.56 12.8% 0.7% (7.6%) 126,551 126,629 6,005 4.5x 4.3x 4.0x 12.9x 12.4x 11.4x 5.2% 71.9% 34.3%
Hewlett Packard US 66,000 18.59 (18.5%) 4.5% 11.3% 29,131 35,451 7,673 1.1x 1.2x 1.1x 6.3x 6.7x 6.7x (7.1%) NA 17.2%
Average 3.9x 3.7x 3.5x 10.9x 10.5x 9.9x 3.3% 60.4% 34.2%
Median 3.9x 3.8x 3.6x 10.6x 10.5x 10.0x 4.0% 61.6% 34.6%
Share
Price
Market
Cap EV Cash EV/Revenue EV/EBITDA
CY
Revenue
Growth
Company Name HQ Employee 02-28-18 LTM L6M L1M (m) (m) (m) CY17A CY18E CY19E CY17A CY18E CY19E 18/17 Gross EBITDA
Share Price Performance
CY18E
Margins
32
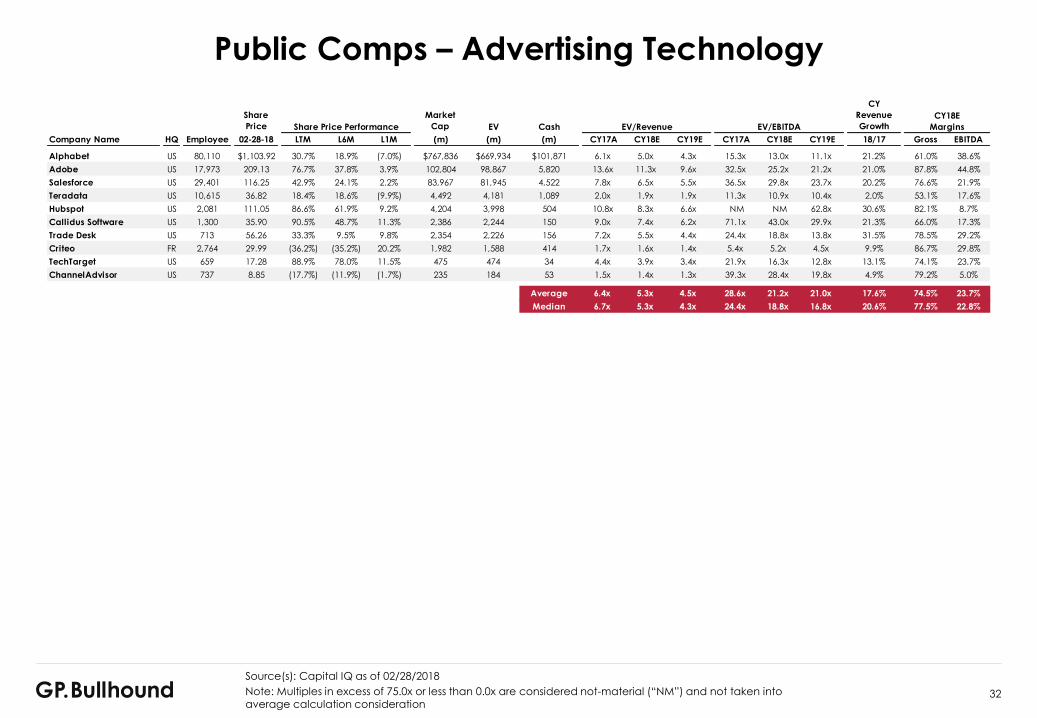
Public Comps – Advertising Technology
Source(s): Capital IQ as of 02/28/2018
Note: Multiples in excess of 75.0x or less than 0.0x are considered not-material (“NM”) and not taken into average calculation consideration
Alphabet US 80,110 $1,103.92 30.7% 18.9% (7.0%) $767,836 $669,934 $101,871 6.1x 5.0x 4.3x 15.3x 13.0x 11.1x 21.2% 61.0% 38.6%
Adobe US 17,973 209.13 76.7% 37.8% 3.9% 102,804 98,867 5,820 13.6x 11.3x 9.6x 32.5x 25.2x 21.2x 21.0% 87.8% 44.8%
Salesforce US 29,401 116.25 42.9% 24.1% 2.2% 83,967 81,945 4,522 7.8x 6.5x 5.5x 36.5x 29.8x 23.7x 20.2% 76.6% 21.9%
Teradata US 10,615 36.82 18.4% 18.6% (9.9%) 4,492 4,181 1,089 2.0x 1.9x 1.9x 11.3x 10.9x 10.4x 2.0% 53.1% 17.6%
Hubspot US 2,081 111.05 86.6% 61.9% 9.2% 4,204 3,998 504 10.8x 8.3x 6.6x NM NM 62.8x 30.6% 82.1% 8.7%
Callidus Software US 1,300 35.90 90.5% 48.7% 11.3% 2,386 2,244 150 9.0x 7.4x 6.2x 71.1x 43.0x 29.9x 21.3% 66.0% 17.3%
Trade Desk US 713 56.26 33.3% 9.5% 9.8% 2,354 2,226 156 7.2x 5.5x 4.4x 24.4x 18.8x 13.8x 31.5% 78.5% 29.2%
Criteo FR 2,764 29.99 (36.2%) (35.2%) 20.2% 1,982 1,588 414 1.7x 1.6x 1.4x 5.4x 5.2x 4.5x 9.9% 86.7% 29.8%
TechTarget US 659 17.28 88.9% 78.0% 11.5% 475 474 34 4.4x 3.9x 3.4x 21.9x 16.3x 12.8x 13.1% 74.1% 23.7%
ChannelAdvisor US 737 8.85 (17.7%) (11.9%) (1.7%) 235 184 53 1.5x 1.4x 1.3x 39.3x 28.4x 19.8x 4.9% 79.2% 5.0%
Average 6.4x 5.3x 4.5x 28.6x 21.2x 21.0x 17.6% 74.5% 23.7%
Median 6.7x 5.3x 4.3x 24.4x 18.8x 16.8x 20.6% 77.5% 22.8%
Share
Price
Market
Cap EV Cash EV/Revenue EV/EBITDA
CY
Revenue
Growth
Company Name HQ Employee 02-28-18 LTM L6M L1M (m) (m) (m) CY17A CY18E CY19E CY17A CY18E CY19E 18/17 Gross EBITDA
Share Price Performance
CY18E
Margins
33
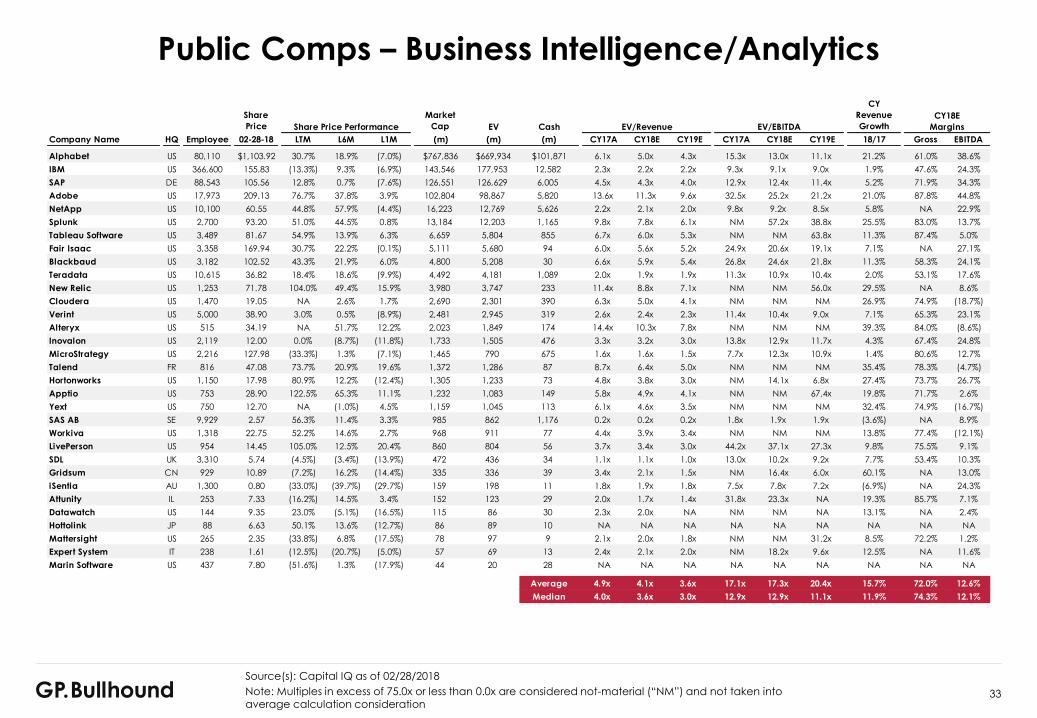
Public Comps – Business Intelligence/Analytics
Source(s): Capital IQ as of 02/28/2018
Note: Multiples in excess of 75.0x or less than 0.0x are considered not-material (“NM”) and not taken into average calculation consideration
Alphabet US 80,110 $1,103.92 30.7% 18.9% (7.0%) $767,836 $669,934 $101,871 6.1x 5.0x 4.3x 15.3x 13.0x 11.1x 21.2% 61.0% 38.6%
IBM US 366,600 155.83 (13.3%) 9.3% (6.9%) 143,546 177,953 12,582 2.3x 2.2x 2.2x 9.3x 9.1x 9.0x 1.9% 47.6% 24.3%
SAP DE 88,543 105.56 12.8% 0.7% (7.6%) 126,551 126,629 6,005 4.5x 4.3x 4.0x 12.9x 12.4x 11.4x 5.2% 71.9% 34.3%
Adobe US 17,973 209.13 76.7% 37.8% 3.9% 102,804 98,867 5,820 13.6x 11.3x 9.6x 32.5x 25.2x 21.2x 21.0% 87.8% 44.8%
NetApp US 10,100 60.55 44.8% 57.9% (4.4%) 16,223 12,769 5,626 2.2x 2.1x 2.0x 9.8x 9.2x 8.5x 5.8% NA 22.9%
Splunk US 2,700 93.20 51.0% 44.5% 0.8% 13,184 12,203 1,165 9.8x 7.8x 6.1x NM 57.2x 38.8x 25.5% 83.0% 13.7%
Tableau Software US 3,489 81.67 54.9% 13.9% 6.3% 6,659 5,804 855 6.7x 6.0x 5.3x NM NM 63.8x 11.3% 87.4% 5.0%
Fair Isaac US 3,358 169.94 30.7% 22.2% (0.1%) 5,111 5,680 94 6.0x 5.6x 5.2x 24.9x 20.6x 19.1x 7.1% NA 27.1%
Blackbaud US 3,182 102.52 43.3% 21.9% 6.0% 4,800 5,208 30 6.6x 5.9x 5.4x 26.8x 24.6x 21.8x 11.3% 58.3% 24.1%
Teradata US 10,615 36.82 18.4% 18.6% (9.9%) 4,492 4,181 1,089 2.0x 1.9x 1.9x 11.3x 10.9x 10.4x 2.0% 53.1% 17.6%
New Relic US 1,253 71.78 104.0% 49.4% 15.9% 3,980 3,747 233 11.4x 8.8x 7.1x NM NM 56.0x 29.5% NA 8.6%
Cloudera US 1,470 19.05 NA 2.6% 1.7% 2,690 2,301 390 6.3x 5.0x 4.1x NM NM NM 26.9% 74.9% (18.7%)
Verint US 5,000 38.90 3.0% 0.5% (8.9%) 2,481 2,945 319 2.6x 2.4x 2.3x 11.4x 10.4x 9.0x 7.1% 65.3% 23.1%
Alteryx US 515 34.19 NA 51.7% 12.2% 2,023 1,849 174 14.4x 10.3x 7.8x NM NM NM 39.3% 84.0% (8.6%)
Inovalon US 2,119 12.00 0.0% (8.7%) (11.8%) 1,733 1,505 476 3.3x 3.2x 3.0x 13.8x 12.9x 11.7x 4.3% 67.4% 24.8%
MicroStrategy US 2,216 127.98 (33.3%) 1.3% (7.1%) 1,465 790 675 1.6x 1.6x 1.5x 7.7x 12.3x 10.9x 1.4% 80.6% 12.7%
Talend FR 816 47.08 73.7% 20.9% 19.6% 1,372 1,286 87 8.7x 6.4x 5.0x NM NM NM 35.4% 78.3% (4.7%)
Hortonworks US 1,150 17.98 80.9% 12.2% (12.4%) 1,305 1,233 73 4.8x 3.8x 3.0x NM 14.1x 6.8x 27.4% 73.7% 26.7%
Apptio US 753 28.90 122.5% 65.3% 11.1% 1,232 1,083 149 5.8x 4.9x 4.1x NM NM 67.4x 19.8% 71.7% 2.6%
Yext US 750 12.70 NA (1.0%) 4.5% 1,159 1,045 113 6.1x 4.6x 3.5x NM NM NM 32.4% 74.9% (16.7%)
SAS AB SE 9,929 2.57 56.3% 11.4% 3.3% 985 862 1,176 0.2x 0.2x 0.2x 1.8x 1.9x 1.9x (3.6%) NA 8.9%
Workiva US 1,318 22.75 52.2% 14.6% 2.7% 968 911 77 4.4x 3.9x 3.4x NM NM NM 13.8% 77.4% (12.1%)
LivePerson US 954 14.45 105.0% 12.5% 20.4% 860 804 56 3.7x 3.4x 3.0x 44.2x 37.1x 27.3x 9.8% 75.5% 9.1%
SDL UK 3,310 5.74 (4.5%) (3.4%) (13.9%) 472 436 34 1.1x 1.1x 1.0x 13.0x 10.2x 9.2x 7.7% 53.4% 10.3%
Gridsum CN 929 10.89 (7.2%) 16.2% (14.4%) 335 336 39 3.4x 2.1x 1.5x NM 16.4x 6.0x 60.1% NA 13.0%
iSentia AU 1,300 0.80 (33.0%) (39.7%) (29.7%) 159 198 11 1.8x 1.9x 1.8x 7.5x 7.8x 7.2x (6.9%) NA 24.3%
Attunity IL 253 7.33 (16.2%) 14.5% 3.4% 152 123 29 2.0x 1.7x 1.4x 31.8x 23.3x NA 19.3% 85.7% 7.1%
Datawatch US 144 9.35 23.0% (5.1%) (16.5%) 115 86 30 2.3x 2.0x NA NM NM NA 13.1% NA 2.4%
Hottolink JP 88 6.63 50.1% 13.6% (12.7%) 86 89 10 NA NA NA NA NA NA NA NA NA
Mattersight US 265 2.35 (33.8%) 6.8% (17.5%) 78 97 9 2.1x 2.0x 1.8x NM NM 31.2x 8.5% 72.2% 1.2%
Expert System IT 238 1.61 (12.5%) (20.7%) (5.0%) 57 69 13 2.4x 2.1x 2.0x NM 18.2x 9.6x 12.5% NA 11.6%
Marin Software US 437 7.80 (51.6%) 1.3% (17.9%) 44 20 28 NA NA NA NA NA NA NA NA NA
Average 4.9x 4.1x 3.6x 17.1x 17.3x 20.4x 15.7% 72.0% 12.6%
Median 4.0x 3.6x 3.0x 12.9x 12.9x 11.1x 11.9% 74.3% 12.1%
Share
Price
Market
Cap EV Cash EV/Revenue EV/EBITDA
CY
Revenue
Growth
Company Name HQ Employee 02-28-18 LTM L6M L1M (m) (m) (m) CY17A CY18E CY19E CY17A CY18E CY19E 18/17 Gross EBITDA
Share Price Performance
CY18E
Margins
34
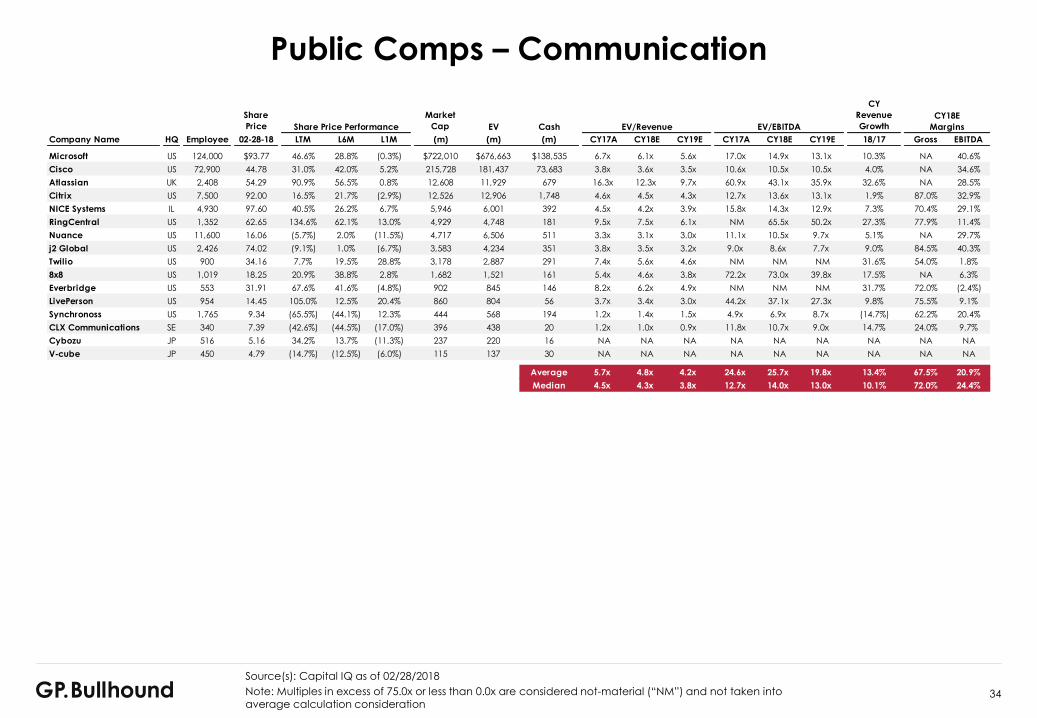
Public Comps – Communication
Source(s): Capital IQ as of 02/28/2018
Note: Multiples in excess of 75.0x or less than 0.0x are considered not-material (“NM”) and not taken into average calculation consideration
Microsoft US 124,000 $93.77 46.6% 28.8% (0.3%) $722,010 $676,663 $138,535 6.7x 6.1x 5.6x 17.0x 14.9x 13.1x 10.3% NA 40.6%
Cisco US 72,900 44.78 31.0% 42.0% 5.2% 215,728 181,437 73,683 3.8x 3.6x 3.5x 10.6x 10.5x 10.5x 4.0% NA 34.6%
Atlassian UK 2,408 54.29 90.9% 56.5% 0.8% 12,608 11,929 679 16.3x 12.3x 9.7x 60.9x 43.1x 35.9x 32.6% NA 28.5%
Citrix US 7,500 92.00 16.5% 21.7% (2.9%) 12,526 12,906 1,748 4.6x 4.5x 4.3x 12.7x 13.6x 13.1x 1.9% 87.0% 32.9%
NICE Systems IL 4,930 97.60 40.5% 26.2% 6.7% 5,946 6,001 392 4.5x 4.2x 3.9x 15.8x 14.3x 12.9x 7.3% 70.4% 29.1%
RingCentral US 1,352 62.65 134.6% 62.1% 13.0% 4,929 4,748 181 9.5x 7.5x 6.1x NM 65.5x 50.2x 27.3% 77.9% 11.4%
Nuance US 11,600 16.06 (5.7%) 2.0% (11.5%) 4,717 6,506 511 3.3x 3.1x 3.0x 11.1x 10.5x 9.7x 5.1% NA 29.7%
j2 Global US 2,426 74.02 (9.1%) 1.0% (6.7%) 3,583 4,234 351 3.8x 3.5x 3.2x 9.0x 8.6x 7.7x 9.0% 84.5% 40.3%
Twilio US 900 34.16 7.7% 19.5% 28.8% 3,178 2,887 291 7.4x 5.6x 4.6x NM NM NM 31.6% 54.0% 1.8%
8x8 US 1,019 18.25 20.9% 38.8% 2.8% 1,682 1,521 161 5.4x 4.6x 3.8x 72.2x 73.0x 39.8x 17.5% NA 6.3%
Everbridge US 553 31.91 67.6% 41.6% (4.8%) 902 845 146 8.2x 6.2x 4.9x NM NM NM 31.7% 72.0% (2.4%)
LivePerson US 954 14.45 105.0% 12.5% 20.4% 860 804 56 3.7x 3.4x 3.0x 44.2x 37.1x 27.3x 9.8% 75.5% 9.1%
Synchronoss US 1,765 9.34 (65.5%) (44.1%) 12.3% 444 568 194 1.2x 1.4x 1.5x 4.9x 6.9x 8.7x (14.7%) 62.2% 20.4%
CLX Communications SE 340 7.39 (42.6%) (44.5%) (17.0%) 396 438 20 1.2x 1.0x 0.9x 11.8x 10.7x 9.0x 14.7% 24.0% 9.7%
Cybozu JP 516 5.16 34.2% 13.7% (11.3%) 237 220 16 NA NA NA NA NA NA NA NA NA
V-cube JP 450 4.79 (14.7%) (12.5%) (6.0%) 115 137 30 NA NA NA NA NA NA NA NA NA
Average 5.7x 4.8x 4.2x 24.6x 25.7x 19.8x 13.4% 67.5% 20.9%
Median 4.5x 4.3x 3.8x 12.7x 14.0x 13.0x 10.1% 72.0% 24.4%
Share
Price
Market
Cap EV Cash EV/Revenue EV/EBITDA
CY
Revenue
Growth
Company Name HQ Employee 02-28-18 LTM L6M L1M (m) (m) (m) CY17A CY18E CY19E CY17A CY18E CY19E 18/17 Gross EBITDA
Share Price Performance
CY18E
Margins
35
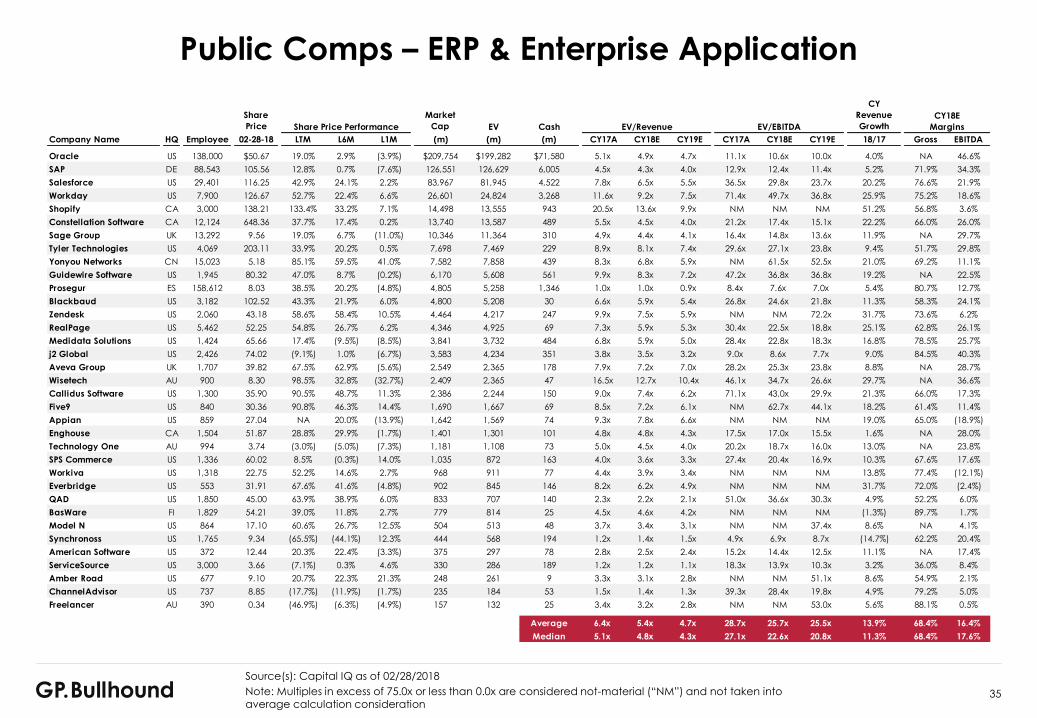
Public Comps – ERP & Enterprise Application
Source(s): Capital IQ as of 02/28/2018
Note: Multiples in excess of 75.0x or less than 0.0x are considered not-material (“NM”) and not taken into average calculation consideration
Oracle US 138,000 $50.67 19.0% 2.9% (3.9%) $209,754 $199,282 $71,580 5.1x 4.9x 4.7x 11.1x 10.6x 10.0x 4.0% NA 46.6%
SAP DE 88,543 105.56 12.8% 0.7% (7.6%) 126,551 126,629 6,005 4.5x 4.3x 4.0x 12.9x 12.4x 11.4x 5.2% 71.9% 34.3%
Salesforce US 29,401 116.25 42.9% 24.1% 2.2% 83,967 81,945 4,522 7.8x 6.5x 5.5x 36.5x 29.8x 23.7x 20.2% 76.6% 21.9%
Workday US 7,900 126.67 52.7% 22.4% 6.6% 26,601 24,824 3,268 11.6x 9.2x 7.5x 71.4x 49.7x 36.8x 25.9% 75.2% 18.6%
Shopify CA 3,000 138.21 133.4% 33.2% 7.1% 14,498 13,555 943 20.5x 13.6x 9.9x NM NM NM 51.2% 56.8% 3.6%
Constellation Software CA 12,124 648.36 37.7% 17.4% 0.2% 13,740 13,587 489 5.5x 4.5x 4.0x 21.2x 17.4x 15.1x 22.2% 66.0% 26.0%
Sage Group UK 13,292 9.56 19.0% 6.7% (11.0%) 10,346 11,364 310 4.9x 4.4x 4.1x 16.4x 14.8x 13.6x 11.9% NA 29.7%
Tyler Technologies US 4,069 203.11 33.9% 20.2% 0.5% 7,698 7,469 229 8.9x 8.1x 7.4x 29.6x 27.1x 23.8x 9.4% 51.7% 29.8%
Yonyou Networks CN 15,023 5.18 85.1% 59.5% 41.0% 7,582 7,858 439 8.3x 6.8x 5.9x NM 61.5x 52.5x 21.0% 69.2% 11.1%
Guidewire Software US 1,945 80.32 47.0% 8.7% (0.2%) 6,170 5,608 561 9.9x 8.3x 7.2x 47.2x 36.8x 36.8x 19.2% NA 22.5%
Prosegur ES 158,612 8.03 38.5% 20.2% (4.8%) 4,805 5,258 1,346 1.0x 1.0x 0.9x 8.4x 7.6x 7.0x 5.4% 80.7% 12.7%
Blackbaud US 3,182 102.52 43.3% 21.9% 6.0% 4,800 5,208 30 6.6x 5.9x 5.4x 26.8x 24.6x 21.8x 11.3% 58.3% 24.1%
Zendesk US 2,060 43.18 58.6% 58.4% 10.5% 4,464 4,217 247 9.9x 7.5x 5.9x NM NM 72.2x 31.7% 73.6% 6.2%
RealPage US 5,462 52.25 54.8% 26.7% 6.2% 4,346 4,925 69 7.3x 5.9x 5.3x 30.4x 22.5x 18.8x 25.1% 62.8% 26.1%
Medidata Solutions US 1,424 65.66 17.4% (9.5%) (8.5%) 3,841 3,732 484 6.8x 5.9x 5.0x 28.4x 22.8x 18.3x 16.8% 78.5% 25.7%
j2 Global US 2,426 74.02 (9.1%) 1.0% (6.7%) 3,583 4,234 351 3.8x 3.5x 3.2x 9.0x 8.6x 7.7x 9.0% 84.5% 40.3%
Aveva Group UK 1,707 39.82 67.5% 62.9% (5.6%) 2,549 2,365 178 7.9x 7.2x 7.0x 28.2x 25.3x 23.8x 8.8% NA 28.7%
Wisetech AU 900 8.30 98.5% 32.8% (32.7%) 2,409 2,365 47 16.5x 12.7x 10.4x 46.1x 34.7x 26.6x 29.7% NA 36.6%
Callidus Software US 1,300 35.90 90.5% 48.7% 11.3% 2,386 2,244 150 9.0x 7.4x 6.2x 71.1x 43.0x 29.9x 21.3% 66.0% 17.3%
Five9 US 840 30.36 90.8% 46.3% 14.4% 1,690 1,667 69 8.5x 7.2x 6.1x NM 62.7x 44.1x 18.2% 61.4% 11.4%
Appian US 859 27.04 NA 20.0% (13.9%) 1,642 1,569 74 9.3x 7.8x 6.6x NM NM NM 19.0% 65.0% (18.9%)
Enghouse CA 1,504 51.87 28.8% 29.9% (1.7%) 1,401 1,301 101 4.8x 4.8x 4.3x 17.5x 17.0x 15.5x 1.6% NA 28.0%
Technology One AU 994 3.74 (3.0%) (5.0%) (7.3%) 1,181 1,108 73 5.0x 4.5x 4.0x 20.2x 18.7x 16.0x 13.0% NA 23.8%
SPS Commerce US 1,336 60.02 8.5% (0.3%) 14.0% 1,035 872 163 4.0x 3.6x 3.3x 27.4x 20.4x 16.9x 10.3% 67.6% 17.6%
Workiva US 1,318 22.75 52.2% 14.6% 2.7% 968 911 77 4.4x 3.9x 3.4x NM NM NM 13.8% 77.4% (12.1%)
Everbridge US 553 31.91 67.6% 41.6% (4.8%) 902 845 146 8.2x 6.2x 4.9x NM NM NM 31.7% 72.0% (2.4%)
QAD US 1,850 45.00 63.9% 38.9% 6.0% 833 707 140 2.3x 2.2x 2.1x 51.0x 36.6x 30.3x 4.9% 52.2% 6.0%
BasWare FI 1,829 54.21 39.0% 11.8% 2.7% 779 814 25 4.5x 4.6x 4.2x NM NM NM (1.3%) 89.7% 1.7%
Model N US 864 17.10 60.6% 26.7% 12.5% 504 513 48 3.7x 3.4x 3.1x NM NM 37.4x 8.6% NA 4.1%
Synchronoss US 1,765 9.34 (65.5%) (44.1%) 12.3% 444 568 194 1.2x 1.4x 1.5x 4.9x 6.9x 8.7x (14.7%) 62.2% 20.4%
American Software US 372 12.44 20.3% 22.4% (3.3%) 375 297 78 2.8x 2.5x 2.4x 15.2x 14.4x 12.5x 11.1% NA 17.4%
ServiceSource US 3,000 3.66 (7.1%) 0.3% 4.6% 330 286 189 1.2x 1.2x 1.1x 18.3x 13.9x 10.3x 3.2% 36.0% 8.4%
Amber Road US 677 9.10 20.7% 22.3% 21.3% 248 261 9 3.3x 3.1x 2.8x NM NM 51.1x 8.6% 54.9% 2.1%
ChannelAdvisor US 737 8.85 (17.7%) (11.9%) (1.7%) 235 184 53 1.5x 1.4x 1.3x 39.3x 28.4x 19.8x 4.9% 79.2% 5.0%
Freelancer AU 390 0.34 (46.9%) (6.3%) (4.9%) 157 132 25 3.4x 3.2x 2.8x NM NM 53.0x 5.6% 88.1% 0.5%
Average 6.4x 5.4x 4.7x 28.7x 25.7x 25.5x 13.9% 68.4% 16.4%
Median 5.1x 4.8x 4.3x 27.1x 22.6x 20.8x 11.3% 68.4% 17.6%
Share
Price
Market
Cap EV Cash EV/Revenue EV/EBITDA
CY
Revenue
Growth
Company Name HQ Employee 02-28-18 LTM L6M L1M (m) (m) (m) CY17A CY18E CY19E CY17A CY18E CY19E 18/17 Gross EBITDA
Share Price Performance
CY18E
Margins
36
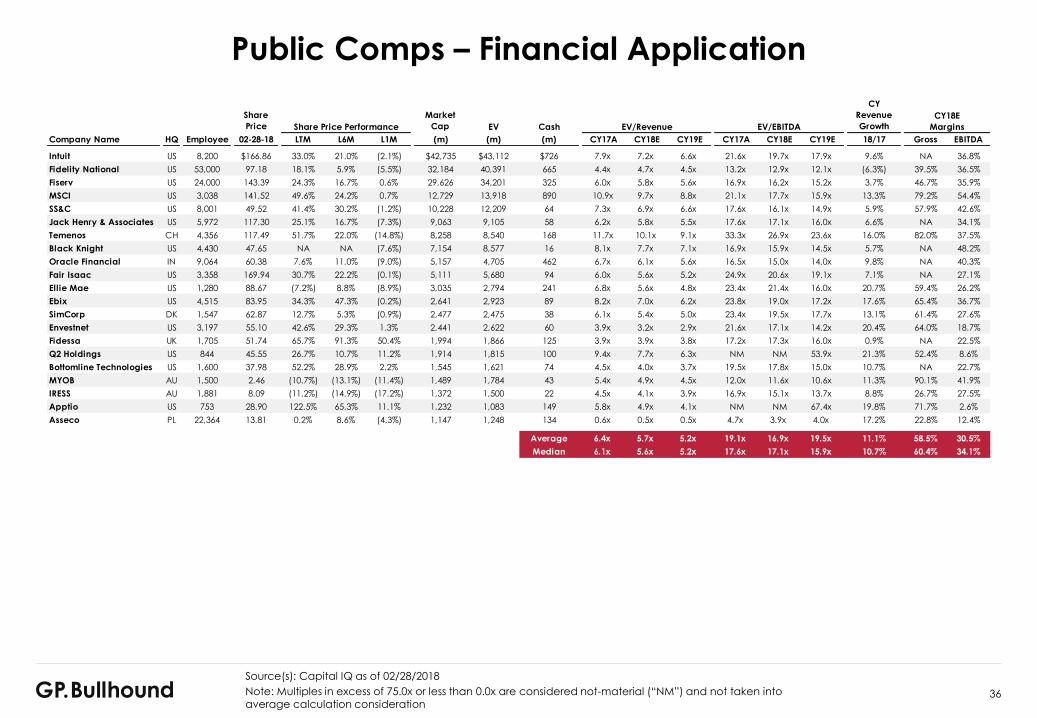
Public Comps – Financial Application
Source(s): Capital IQ as of 02/28/2018
Note: Multiples in excess of 75.0x or less than 0.0x are considered not-material (“NM”) and not taken into average calculation consideration
Intuit US 8,200 $166.86 33.0% 21.0% (2.1%) $42,735 $43,112 $726 7.9x 7.2x 6.6x 21.6x 19.7x 17.9x 9.6% NA 36.8%
Fidelity National US 53,000 97.18 18.1% 5.9% (5.5%) 32,184 40,391 665 4.4x 4.7x 4.5x 13.2x 12.9x 12.1x (6.3%) 39.5% 36.5%
Fiserv US 24,000 143.39 24.3% 16.7% 0.6% 29,626 34,201 325 6.0x 5.8x 5.6x 16.9x 16.2x 15.2x 3.7% 46.7% 35.9%
MSCI US 3,038 141.52 49.6% 24.2% 0.7% 12,729 13,918 890 10.9x 9.7x 8.8x 21.1x 17.7x 15.9x 13.3% 79.2% 54.4%
SS&C US 8,001 49.52 41.4% 30.2% (1.2%) 10,228 12,209 64 7.3x 6.9x 6.6x 17.6x 16.1x 14.9x 5.9% 57.9% 42.6%
Jack Henry & Associates US 5,972 117.30 25.1% 16.7% (7.3%) 9,063 9,105 58 6.2x 5.8x 5.5x 17.6x 17.1x 16.0x 6.6% NA 34.1%
Temenos CH 4,356 117.49 51.7% 22.0% (14.8%) 8,258 8,540 168 11.7x 10.1x 9.1x 33.3x 26.9x 23.6x 16.0% 82.0% 37.5%
Black Knight US 4,430 47.65 NA NA (7.6%) 7,154 8,577 16 8.1x 7.7x 7.1x 16.9x 15.9x 14.5x 5.7% NA 48.2%
Oracle Financial IN 9,064 60.38 7.6% 11.0% (9.0%) 5,157 4,705 462 6.7x 6.1x 5.6x 16.5x 15.0x 14.0x 9.8% NA 40.3%
Fair Isaac US 3,358 169.94 30.7% 22.2% (0.1%) 5,111 5,680 94 6.0x 5.6x 5.2x 24.9x 20.6x 19.1x 7.1% NA 27.1%
Ellie Mae US 1,280 88.67 (7.2%) 8.8% (8.9%) 3,035 2,794 241 6.8x 5.6x 4.8x 23.4x 21.4x 16.0x 20.7% 59.4% 26.2%
Ebix US 4,515 83.95 34.3% 47.3% (0.2%) 2,641 2,923 89 8.2x 7.0x 6.2x 23.8x 19.0x 17.2x 17.6% 65.4% 36.7%
SimCorp DK 1,547 62.87 12.7% 5.3% (0.9%) 2,477 2,475 38 6.1x 5.4x 5.0x 23.4x 19.5x 17.7x 13.1% 61.4% 27.6%
Envestnet US 3,197 55.10 42.6% 29.3% 1.3% 2,441 2,622 60 3.9x 3.2x 2.9x 21.6x 17.1x 14.2x 20.4% 64.0% 18.7%
Fidessa UK 1,705 51.74 65.7% 91.3% 50.4% 1,994 1,866 125 3.9x 3.9x 3.8x 17.2x 17.3x 16.0x 0.9% NA 22.5%
Q2 Holdings US 844 45.55 26.7% 10.7% 11.2% 1,914 1,815 100 9.4x 7.7x 6.3x NM NM 53.9x 21.3% 52.4% 8.6%
Bottomline Technologies US 1,600 37.98 52.2% 28.9% 2.2% 1,545 1,621 74 4.5x 4.0x 3.7x 19.5x 17.8x 15.0x 10.7% NA 22.7%
MYOB AU 1,500 2.46 (10.7%) (13.1%) (11.4%) 1,489 1,784 43 5.4x 4.9x 4.5x 12.0x 11.6x 10.6x 11.3% 90.1% 41.9%
IRESS AU 1,881 8.09 (11.2%) (14.9%) (17.2%) 1,372 1,500 22 4.5x 4.1x 3.9x 16.9x 15.1x 13.7x 8.8% 26.7% 27.5%
Apptio US 753 28.90 122.5% 65.3% 11.1% 1,232 1,083 149 5.8x 4.9x 4.1x NM NM 67.4x 19.8% 71.7% 2.6%
Asseco PL 22,364 13.81 0.2% 8.6% (4.3%) 1,147 1,248 134 0.6x 0.5x 0.5x 4.7x 3.9x 4.0x 17.2% 22.8% 12.4%
Average 6.4x 5.7x 5.2x 19.1x 16.9x 19.5x 11.1% 58.5% 30.5%
Median 6.1x 5.6x 5.2x 17.6x 17.1x 15.9x 10.7% 60.4% 34.1%
Share
Price
Market
Cap EV Cash EV/Revenue EV/EBITDA
CY
Revenue
Growth
Company Name HQ Employee 02-28-18 LTM L6M L1M (m) (m) (m) CY17A CY18E CY19E CY17A CY18E CY19E 18/17 Gross EBITDA
Share Price Performance
CY18E
Margins
37
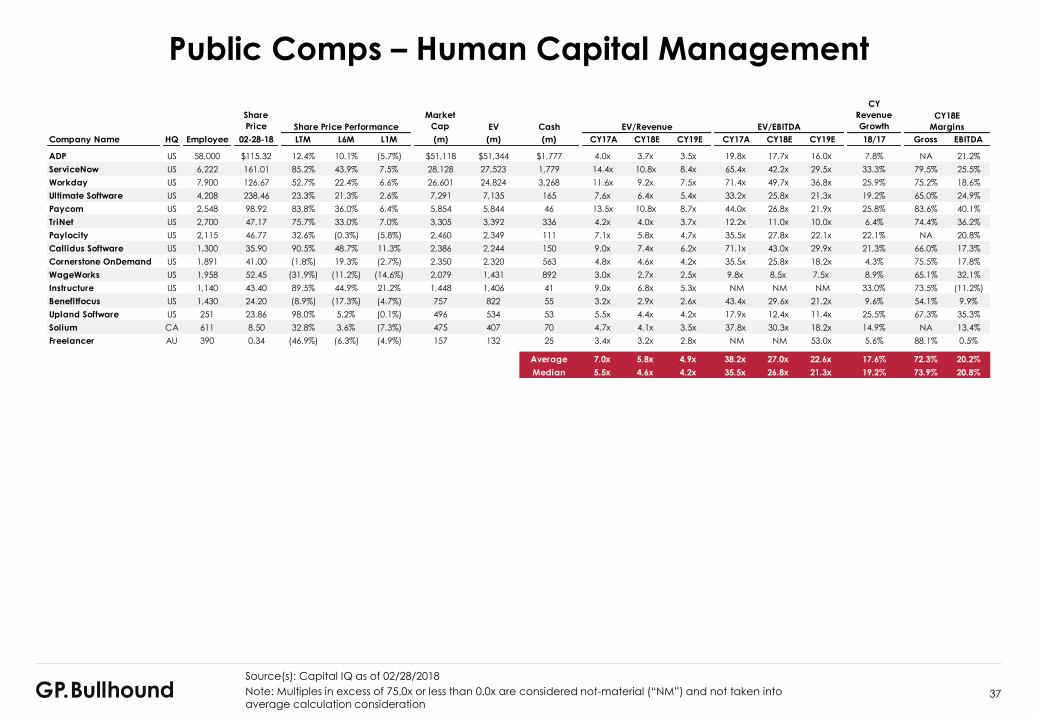
Public Comps – Human Capital Management
Source(s): Capital IQ as of 02/28/2018
Note: Multiples in excess of 75.0x or less than 0.0x are considered not-material (“NM”) and not taken into average calculation consideration
ADP US 58,000 $115.32 12.4% 10.1% (5.7%) $51,118 $51,344 $1,777 4.0x 3.7x 3.5x 19.8x 17.7x 16.0x 7.8% NA 21.2%
ServiceNow US 6,222 161.01 85.2% 43.9% 7.5% 28,128 27,523 1,779 14.4x 10.8x 8.4x 65.4x 42.2x 29.5x 33.3% 79.5% 25.5%
Workday US 7,900 126.67 52.7% 22.4% 6.6% 26,601 24,824 3,268 11.6x 9.2x 7.5x 71.4x 49.7x 36.8x 25.9% 75.2% 18.6%
Ultimate Software US 4,208 238.46 23.3% 21.3% 2.6% 7,291 7,135 165 7.6x 6.4x 5.4x 33.2x 25.8x 21.3x 19.2% 65.0% 24.9%
Paycom US 2,548 98.92 83.8% 36.0% 6.4% 5,854 5,844 46 13.5x 10.8x 8.7x 44.0x 26.8x 21.9x 25.8% 83.6% 40.1%
TriNet US 2,700 47.17 75.7% 33.0% 7.0% 3,305 3,392 336 4.2x 4.0x 3.7x 12.2x 11.0x 10.0x 6.4% 74.4% 36.2%
Paylocity US 2,115 46.77 32.6% (0.3%) (5.8%) 2,460 2,349 111 7.1x 5.8x 4.7x 35.5x 27.8x 22.1x 22.1% NA 20.8%
Callidus Software US 1,300 35.90 90.5% 48.7% 11.3% 2,386 2,244 150 9.0x 7.4x 6.2x 71.1x 43.0x 29.9x 21.3% 66.0% 17.3%
Cornerstone OnDemand US 1,891 41.00 (1.8%) 19.3% (2.7%) 2,350 2,320 563 4.8x 4.6x 4.2x 35.5x 25.8x 18.2x 4.3% 75.5% 17.8%
WageWorks US 1,958 52.45 (31.9%) (11.2%) (14.6%) 2,079 1,431 892 3.0x 2.7x 2.5x 9.8x 8.5x 7.5x 8.9% 65.1% 32.1%
Instructure US 1,140 43.40 89.5% 44.9% 21.2% 1,448 1,406 41 9.0x 6.8x 5.3x NM NM NM 33.0% 73.5% (11.2%)
Benefitfocus US 1,430 24.20 (8.9%) (17.3%) (4.7%) 757 822 55 3.2x 2.9x 2.6x 43.4x 29.6x 21.2x 9.6% 54.1% 9.9%
Upland Software US 251 23.86 98.0% 5.2% (0.1%) 496 534 53 5.5x 4.4x 4.2x 17.9x 12.4x 11.4x 25.5% 67.3% 35.3%
Solium CA 611 8.50 32.8% 3.6% (7.3%) 475 407 70 4.7x 4.1x 3.5x 37.8x 30.3x 18.2x 14.9% NA 13.4%
Freelancer AU 390 0.34 (46.9%) (6.3%) (4.9%) 157 132 25 3.4x 3.2x 2.8x NM NM 53.0x 5.6% 88.1% 0.5%
Average 7.0x 5.8x 4.9x 38.2x 27.0x 22.6x 17.6% 72.3% 20.2%
Median 5.5x 4.6x 4.2x 35.5x 26.8x 21.3x 19.2% 73.9% 20.8%
Share
Price
Market
Cap EV Cash EV/Revenue EV/EBITDA
CY
Revenue
Growth
Company Name HQ Employee 02-28-18 LTM L6M L1M (m) (m) (m) CY17A CY18E CY19E CY17A CY18E CY19E 18/17 Gross EBITDA
Share Price Performance
CY18E
Margins
38
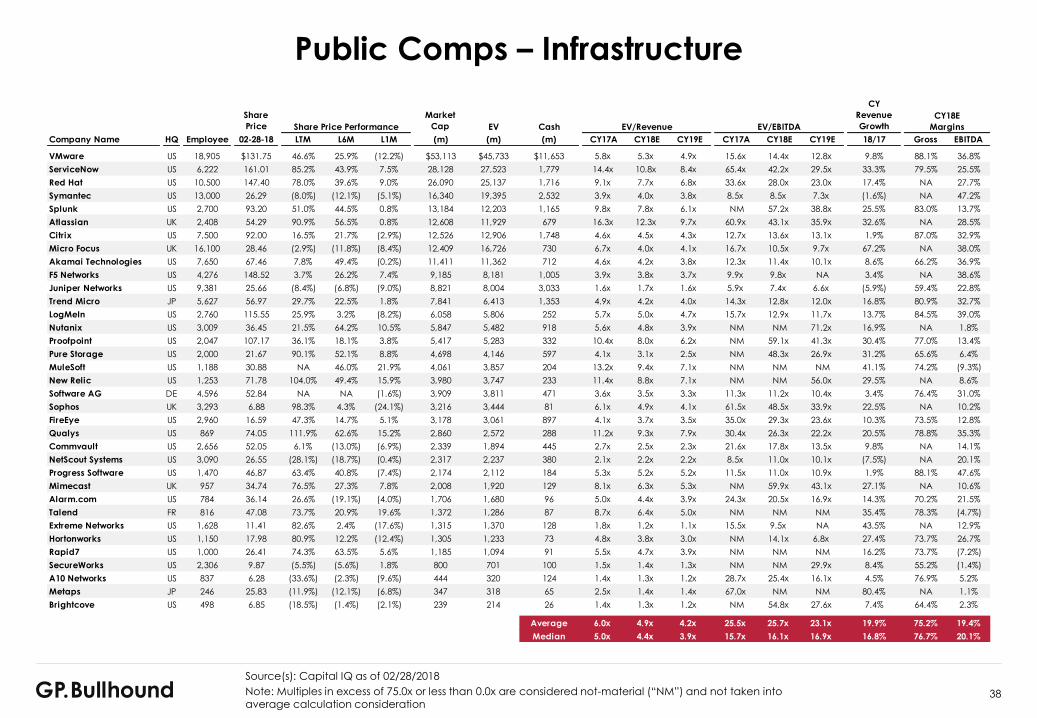
Public Comps – Infrastructure
Source(s): Capital IQ as of 02/28/2018
Note: Multiples in excess of 75.0x or less than 0.0x are considered not-material (“NM”) and not taken into average calculation consideration
VMware US 18,905 $131.75 46.6% 25.9% (12.2%) $53,113 $45,733 $11,653 5.8x 5.3x 4.9x 15.6x 14.4x 12.8x 9.8% 88.1% 36.8%
ServiceNow US 6,222 161.01 85.2% 43.9% 7.5% 28,128 27,523 1,779 14.4x 10.8x 8.4x 65.4x 42.2x 29.5x 33.3% 79.5% 25.5%
Red Hat US 10,500 147.40 78.0% 39.6% 9.0% 26,090 25,137 1,716 9.1x 7.7x 6.8x 33.6x 28.0x 23.0x 17.4% NA 27.7%
Symantec US 13,000 26.29 (8.0%) (12.1%) (5.1%) 16,340 19,395 2,532 3.9x 4.0x 3.8x 8.5x 8.5x 7.3x (1.6%) NA 47.2%
Splunk US 2,700 93.20 51.0% 44.5% 0.8% 13,184 12,203 1,165 9.8x 7.8x 6.1x NM 57.2x 38.8x 25.5% 83.0% 13.7%
Atlassian UK 2,408 54.29 90.9% 56.5% 0.8% 12,608 11,929 679 16.3x 12.3x 9.7x 60.9x 43.1x 35.9x 32.6% NA 28.5%
Citrix US 7,500 92.00 16.5% 21.7% (2.9%) 12,526 12,906 1,748 4.6x 4.5x 4.3x 12.7x 13.6x 13.1x 1.9% 87.0% 32.9%
Micro Focus UK 16,100 28.46 (2.9%) (11.8%) (8.4%) 12,409 16,726 730 6.7x 4.0x 4.1x 16.7x 10.5x 9.7x 67.2% NA 38.0%
Akamai Technologies US 7,650 67.46 7.8% 49.4% (0.2%) 11,411 11,362 712 4.6x 4.2x 3.8x 12.3x 11.4x 10.1x 8.6% 66.2% 36.9%
F5 Networks US 4,276 148.52 3.7% 26.2% 7.4% 9,185 8,181 1,005 3.9x 3.8x 3.7x 9.9x 9.8x NA 3.4% NA 38.6%
Juniper Networks US 9,381 25.66 (8.4%) (6.8%) (9.0%) 8,821 8,004 3,033 1.6x 1.7x 1.6x 5.9x 7.4x 6.6x (5.9%) 59.4% 22.8%
Trend Micro JP 5,627 56.97 29.7% 22.5% 1.8% 7,841 6,413 1,353 4.9x 4.2x 4.0x 14.3x 12.8x 12.0x 16.8% 80.9% 32.7%
LogMeIn US 2,760 115.55 25.9% 3.2% (8.2%) 6,058 5,806 252 5.7x 5.0x 4.7x 15.7x 12.9x 11.7x 13.7% 84.5% 39.0%
Nutanix US 3,009 36.45 21.5% 64.2% 10.5% 5,847 5,482 918 5.6x 4.8x 3.9x NM NM 71.2x 16.9% NA 1.8%
Proofpoint US 2,047 107.17 36.1% 18.1% 3.8% 5,417 5,283 332 10.4x 8.0x 6.2x NM 59.1x 41.3x 30.4% 77.0% 13.4%
Pure Storage US 2,000 21.67 90.1% 52.1% 8.8% 4,698 4,146 597 4.1x 3.1x 2.5x NM 48.3x 26.9x 31.2% 65.6% 6.4%
MuleSoft US 1,188 30.88 NA 46.0% 21.9% 4,061 3,857 204 13.2x 9.4x 7.1x NM NM NM 41.1% 74.2% (9.3%)
New Relic US 1,253 71.78 104.0% 49.4% 15.9% 3,980 3,747 233 11.4x 8.8x 7.1x NM NM 56.0x 29.5% NA 8.6%
Software AG DE 4,596 52.84 NA NA (1.6%) 3,909 3,811 471 3.6x 3.5x 3.3x 11.3x 11.2x 10.4x 3.4% 76.4% 31.0%
Sophos UK 3,293 6.88 98.3% 4.3% (24.1%) 3,216 3,444 81 6.1x 4.9x 4.1x 61.5x 48.5x 33.9x 22.5% NA 10.2%
FireEye US 2,960 16.59 47.3% 14.7% 5.1% 3,178 3,061 897 4.1x 3.7x 3.5x 35.0x 29.3x 23.6x 10.3% 73.5% 12.8%
Qualys US 869 74.05 111.9% 62.6% 15.2% 2,860 2,572 288 11.2x 9.3x 7.9x 30.4x 26.3x 22.2x 20.5% 78.8% 35.3%
Commvault US 2,656 52.05 6.1% (13.0%) (6.9%) 2,339 1,894 445 2.7x 2.5x 2.3x 21.6x 17.8x 13.5x 9.8% NA 14.1%
NetScout Systems US 3,090 26.55 (28.1%) (18.7%) (0.4%) 2,317 2,237 380 2.1x 2.2x 2.2x 8.5x 11.0x 10.1x (7.5%) NA 20.1%
Progress Software US 1,470 46.87 63.4% 40.8% (7.4%) 2,174 2,112 184 5.3x 5.2x 5.2x 11.5x 11.0x 10.9x 1.9% 88.1% 47.6%
Mimecast UK 957 34.74 76.5% 27.3% 7.8% 2,008 1,920 129 8.1x 6.3x 5.3x NM 59.9x 43.1x 27.1% NA 10.6%
Alarm.com US 784 36.14 26.6% (19.1%) (4.0%) 1,706 1,680 96 5.0x 4.4x 3.9x 24.3x 20.5x 16.9x 14.3% 70.2% 21.5%
Talend FR 816 47.08 73.7% 20.9% 19.6% 1,372 1,286 87 8.7x 6.4x 5.0x NM NM NM 35.4% 78.3% (4.7%)
Extreme Networks US 1,628 11.41 82.6% 2.4% (17.6%) 1,315 1,370 128 1.8x 1.2x 1.1x 15.5x 9.5x NA 43.5% NA 12.9%
Hortonworks US 1,150 17.98 80.9% 12.2% (12.4%) 1,305 1,233 73 4.8x 3.8x 3.0x NM 14.1x 6.8x 27.4% 73.7% 26.7%
Rapid7 US 1,000 26.41 74.3% 63.5% 5.6% 1,185 1,094 91 5.5x 4.7x 3.9x NM NM NM 16.2% 73.7% (7.2%)
SecureWorks US 2,306 9.87 (5.5%) (5.6%) 1.8% 800 701 100 1.5x 1.4x 1.3x NM NM 29.9x 8.4% 55.2% (1.4%)
A10 Networks US 837 6.28 (33.6%) (2.3%) (9.6%) 444 320 124 1.4x 1.3x 1.2x 28.7x 25.4x 16.1x 4.5% 76.9% 5.2%
Metaps JP 246 25.83 (11.9%) (12.1%) (6.8%) 347 318 65 2.5x 1.4x 1.4x 67.0x NM NM 80.4% NA 1.1%
Brightcove US 498 6.85 (18.5%) (1.4%) (2.1%) 239 214 26 1.4x 1.3x 1.2x NM 54.8x 27.6x 7.4% 64.4% 2.3%
Average 6.0x 4.9x 4.2x 25.5x 25.7x 23.1x 19.9% 75.2% 19.4%
Median 5.0x 4.4x 3.9x 15.7x 16.1x 16.9x 16.8% 76.7% 20.1%
Share
Price
Market
Cap EV Cash EV/Revenue EV/EBITDA
CY
Revenue
Growth
Company Name HQ Employee 02-28-18 LTM L6M L1M (m) (m) (m) CY17A CY18E CY19E CY17A CY18E CY19E 18/17 Gross EBITDA
Share Price Performance
CY18E
Margins
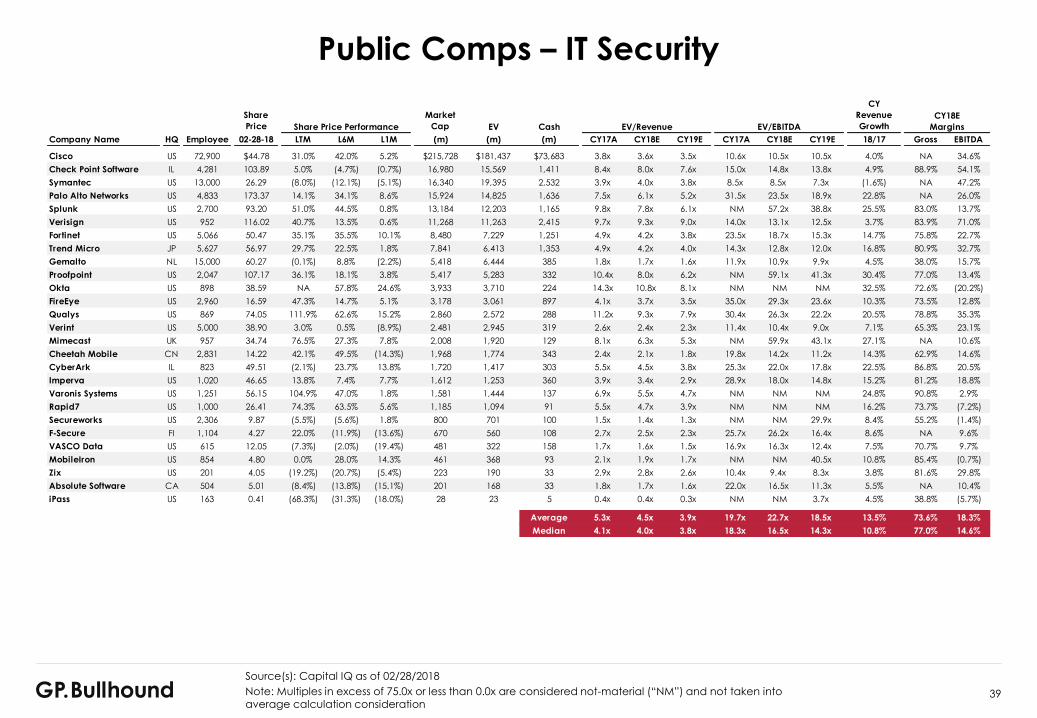
39
Public Comps – IT Security
Source(s): Capital IQ as of 02/28/2018
Note: Multiples in excess of 75.0x or less than 0.0x are considered not-material (“NM”) and not taken into average calculation consideration
Cisco US 72,900 $44.78 31.0% 42.0% 5.2% $215,728 $181,437 $73,683 3.8x 3.6x 3.5x 10.6x 10.5x 10.5x 4.0% NA 34.6%
Check Point Software IL 4,281 103.89 5.0% (4.7%) (0.7%) 16,980 15,569 1,411 8.4x 8.0x 7.6x 15.0x 14.8x 13.8x 4.9% 88.9% 54.1%
Symantec US 13,000 26.29 (8.0%) (12.1%) (5.1%) 16,340 19,395 2,532 3.9x 4.0x 3.8x 8.5x 8.5x 7.3x (1.6%) NA 47.2%
Palo Alto Networks US 4,833 173.37 14.1% 34.1% 8.6% 15,924 14,825 1,636 7.5x 6.1x 5.2x 31.5x 23.5x 18.9x 22.8% NA 26.0%
Splunk US 2,700 93.20 51.0% 44.5% 0.8% 13,184 12,203 1,165 9.8x 7.8x 6.1x NM 57.2x 38.8x 25.5% 83.0% 13.7%
Verisign US 952 116.02 40.7% 13.5% 0.6% 11,268 11,263 2,415 9.7x 9.3x 9.0x 14.0x 13.1x 12.5x 3.7% 83.9% 71.0%
Fortinet US 5,066 50.47 35.1% 35.5% 10.1% 8,480 7,229 1,251 4.9x 4.2x 3.8x 23.5x 18.7x 15.3x 14.7% 75.8% 22.7%
Trend Micro JP 5,627 56.97 29.7% 22.5% 1.8% 7,841 6,413 1,353 4.9x 4.2x 4.0x 14.3x 12.8x 12.0x 16.8% 80.9% 32.7%
Gemalto NL 15,000 60.27 (0.1%) 8.8% (2.2%) 5,418 6,444 385 1.8x 1.7x 1.6x 11.9x 10.9x 9.9x 4.5% 38.0% 15.7%
Proofpoint US 2,047 107.17 36.1% 18.1% 3.8% 5,417 5,283 332 10.4x 8.0x 6.2x NM 59.1x 41.3x 30.4% 77.0% 13.4%
Okta US 898 38.59 NA 57.8% 24.6% 3,933 3,710 224 14.3x 10.8x 8.1x NM NM NM 32.5% 72.6% (20.2%)
FireEye US 2,960 16.59 47.3% 14.7% 5.1% 3,178 3,061 897 4.1x 3.7x 3.5x 35.0x 29.3x 23.6x 10.3% 73.5% 12.8%
Qualys US 869 74.05 111.9% 62.6% 15.2% 2,860 2,572 288 11.2x 9.3x 7.9x 30.4x 26.3x 22.2x 20.5% 78.8% 35.3%
Verint US 5,000 38.90 3.0% 0.5% (8.9%) 2,481 2,945 319 2.6x 2.4x 2.3x 11.4x 10.4x 9.0x 7.1% 65.3% 23.1%
Mimecast UK 957 34.74 76.5% 27.3% 7.8% 2,008 1,920 129 8.1x 6.3x 5.3x NM 59.9x 43.1x 27.1% NA 10.6%
Cheetah Mobile CN 2,831 14.22 42.1% 49.5% (14.3%) 1,968 1,774 343 2.4x 2.1x 1.8x 19.8x 14.2x 11.2x 14.3% 62.9% 14.6%
CyberArk IL 823 49.51 (2.1%) 23.7% 13.8% 1,720 1,417 303 5.5x 4.5x 3.8x 25.3x 22.0x 17.8x 22.5% 86.8% 20.5%
Imperva US 1,020 46.65 13.8% 7.4% 7.7% 1,612 1,253 360 3.9x 3.4x 2.9x 28.9x 18.0x 14.8x 15.2% 81.2% 18.8%
Varonis Systems US 1,251 56.15 104.9% 47.0% 1.8% 1,581 1,444 137 6.9x 5.5x 4.7x NM NM NM 24.8% 90.8% 2.9%
Rapid7 US 1,000 26.41 74.3% 63.5% 5.6% 1,185 1,094 91 5.5x 4.7x 3.9x NM NM NM 16.2% 73.7% (7.2%)
Secureworks US 2,306 9.87 (5.5%) (5.6%) 1.8% 800 701 100 1.5x 1.4x 1.3x NM NM 29.9x 8.4% 55.2% (1.4%)
F-Secure FI 1,104 4.27 22.0% (11.9%) (13.6%) 670 560 108 2.7x 2.5x 2.3x 25.7x 26.2x 16.4x 8.6% NA 9.6%
VASCO Data US 615 12.05 (7.3%) (2.0%) (19.4%) 481 322 158 1.7x 1.6x 1.5x 16.9x 16.3x 12.4x 7.5% 70.7% 9.7%
MobileIron US 854 4.80 0.0% 28.0% 14.3% 461 368 93 2.1x 1.9x 1.7x NM NM 40.5x 10.8% 85.4% (0.7%)
Zix US 201 4.05 (19.2%) (20.7%) (5.4%) 223 190 33 2.9x 2.8x 2.6x 10.4x 9.4x 8.3x 3.8% 81.6% 29.8%
Absolute Software CA 504 5.01 (8.4%) (13.8%) (15.1%) 201 168 33 1.8x 1.7x 1.6x 22.0x 16.5x 11.3x 5.5% NA 10.4%
iPass US 163 0.41 (68.3%) (31.3%) (18.0%) 28 23 5 0.4x 0.4x 0.3x NM NM 3.7x 4.5% 38.8% (5.7%)
Average 5.3x 4.5x 3.9x 19.7x 22.7x 18.5x 13.5% 73.6% 18.3%
Median 4.1x 4.0x 3.8x 18.3x 16.5x 14.3x 10.8% 77.0% 14.6%
Share
Price
Market
Cap EV Cash EV/Revenue EV/EBITDA
CY
Revenue
Growth
Company Name HQ Employee 02-28-18 LTM L6M L1M (m) (m) (m) CY17A CY18E CY19E CY17A CY18E CY19E 18/17 Gross EBITDA
Share Price Performance
CY18E
Margins
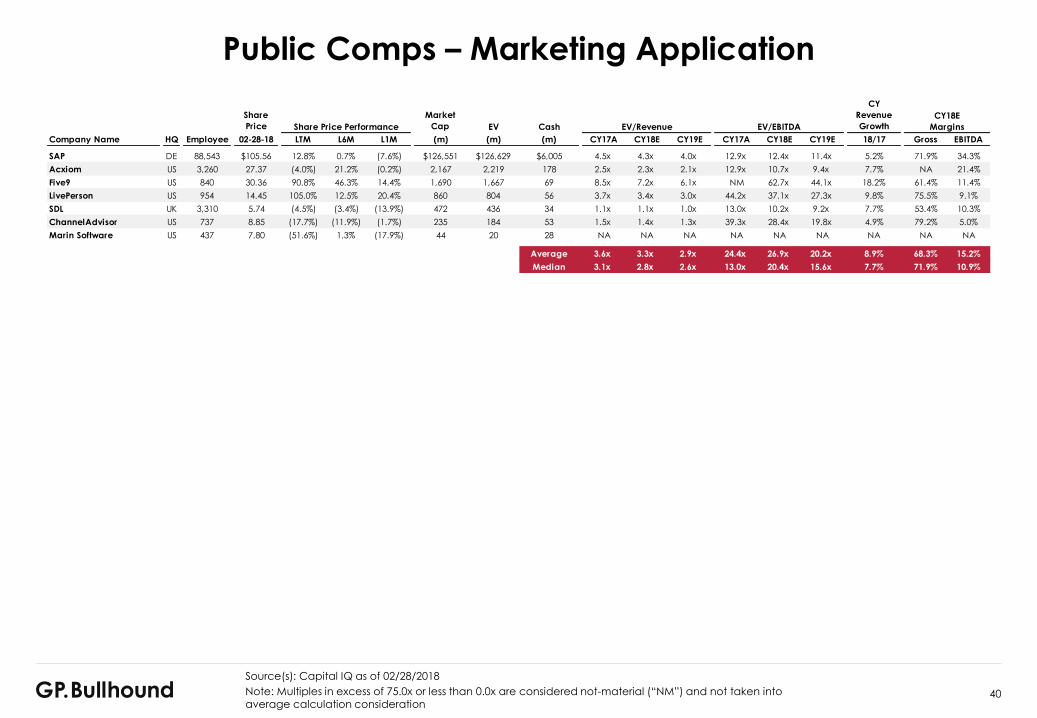
40
Public Comps – Marketing Application
Source(s): Capital IQ as of 02/28/2018
Note: Multiples in excess of 75.0x or less than 0.0x are considered not-material (“NM”) and not taken into average calculation consideration
SAP DE 88,543 $105.56 12.8% 0.7% (7.6%) $126,551 $126,629 $6,005 4.5x 4.3x 4.0x 12.9x 12.4x 11.4x 5.2% 71.9% 34.3%
Acxiom US 3,260 27.37 (4.0%) 21.2% (0.2%) 2,167 2,219 178 2.5x 2.3x 2.1x 12.9x 10.7x 9.4x 7.7% NA 21.4%
Five9 US 840 30.36 90.8% 46.3% 14.4% 1,690 1,667 69 8.5x 7.2x 6.1x NM 62.7x 44.1x 18.2% 61.4% 11.4%
LivePerson US 954 14.45 105.0% 12.5% 20.4% 860 804 56 3.7x 3.4x 3.0x 44.2x 37.1x 27.3x 9.8% 75.5% 9.1%
SDL UK 3,310 5.74 (4.5%) (3.4%) (13.9%) 472 436 34 1.1x 1.1x 1.0x 13.0x 10.2x 9.2x 7.7% 53.4% 10.3%
ChannelAdvisor US 737 8.85 (17.7%) (11.9%) (1.7%) 235 184 53 1.5x 1.4x 1.3x 39.3x 28.4x 19.8x 4.9% 79.2% 5.0%
Marin Software US 437 7.80 (51.6%) 1.3% (17.9%) 44 20 28 NA NA NA NA NA NA NA NA NA
Average 3.6x 3.3x 2.9x 24.4x 26.9x 20.2x 8.9% 68.3% 15.2%
Median 3.1x 2.8x 2.6x 13.0x 20.4x 15.6x 7.7% 71.9% 10.9%
Share
Price
Market
Cap EV Cash EV/Revenue EV/EBITDA
CY
Revenue
Growth
Company Name HQ Employee 02-28-18 LTM L6M L1M (m) (m) (m) CY17A CY18E CY19E CY17A CY18E CY19E 18/17 Gross EBITDA
Share Price Performance
CY18E
Margins
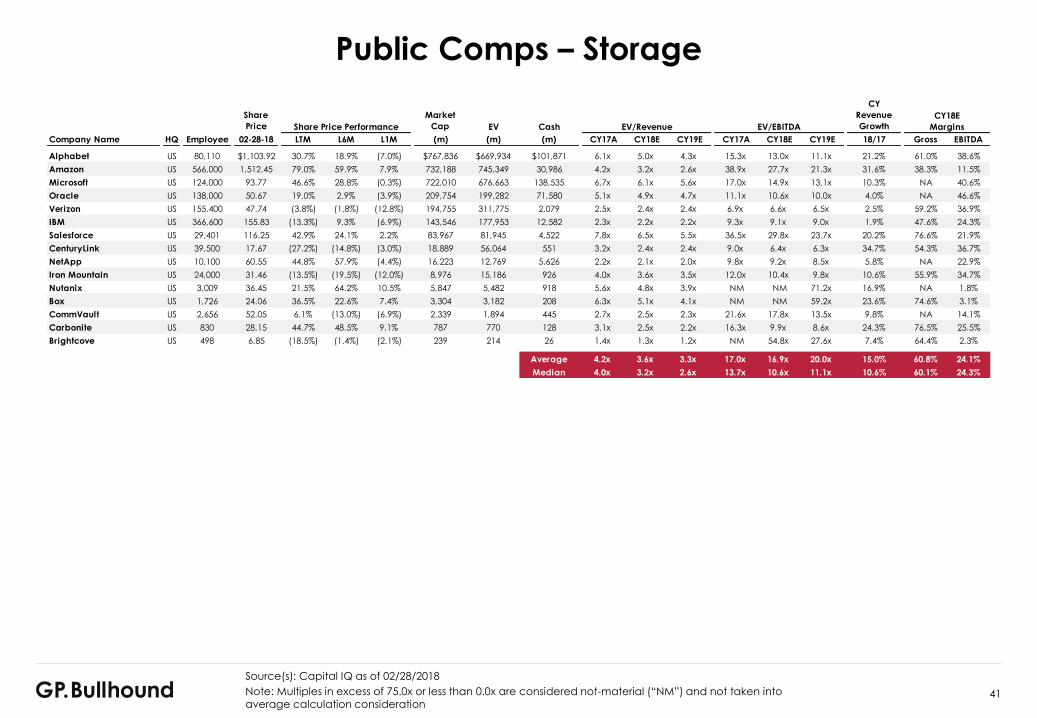
41
Public Comps – Storage
Source(s): Capital IQ as of 02/28/2018
Note: Multiples in excess of 75.0x or less than 0.0x are considered not-material (“NM”) and not taken into average calculation consideration
Alphabet US 80,110 $1,103.92 30.7% 18.9% (7.0%) $767,836 $669,934 $101,871 6.1x 5.0x 4.3x 15.3x 13.0x 11.1x 21.2% 61.0% 38.6%
Amazon US 566,000 1,512.45 79.0% 59.9% 7.9% 732,188 745,349 30,986 4.2x 3.2x 2.6x 38.9x 27.7x 21.3x 31.6% 38.3% 11.5%
Microsoft US 124,000 93.77 46.6% 28.8% (0.3%) 722,010 676,663 138,535 6.7x 6.1x 5.6x 17.0x 14.9x 13.1x 10.3% NA 40.6%
Oracle US 138,000 50.67 19.0% 2.9% (3.9%) 209,754 199,282 71,580 5.1x 4.9x 4.7x 11.1x 10.6x 10.0x 4.0% NA 46.6%
Verizon US 155,400 47.74 (3.8%) (1.8%) (12.8%) 194,755 311,775 2,079 2.5x 2.4x 2.4x 6.9x 6.6x 6.5x 2.5% 59.2% 36.9%
IBM US 366,600 155.83 (13.3%) 9.3% (6.9%) 143,546 177,953 12,582 2.3x 2.2x 2.2x 9.3x 9.1x 9.0x 1.9% 47.6% 24.3%
Salesforce US 29,401 116.25 42.9% 24.1% 2.2% 83,967 81,945 4,522 7.8x 6.5x 5.5x 36.5x 29.8x 23.7x 20.2% 76.6% 21.9%
CenturyLink US 39,500 17.67 (27.2%) (14.8%) (3.0%) 18,889 56,064 551 3.2x 2.4x 2.4x 9.0x 6.4x 6.3x 34.7% 54.3% 36.7%
NetApp US 10,100 60.55 44.8% 57.9% (4.4%) 16,223 12,769 5,626 2.2x 2.1x 2.0x 9.8x 9.2x 8.5x 5.8% NA 22.9%
Iron Mountain US 24,000 31.46 (13.5%) (19.5%) (12.0%) 8,976 15,186 926 4.0x 3.6x 3.5x 12.0x 10.4x 9.8x 10.6% 55.9% 34.7%
Nutanix US 3,009 36.45 21.5% 64.2% 10.5% 5,847 5,482 918 5.6x 4.8x 3.9x NM NM 71.2x 16.9% NA 1.8%
Box US 1,726 24.06 36.5% 22.6% 7.4% 3,304 3,182 208 6.3x 5.1x 4.1x NM NM 59.2x 23.6% 74.6% 3.1%
CommVault US 2,656 52.05 6.1% (13.0%) (6.9%) 2,339 1,894 445 2.7x 2.5x 2.3x 21.6x 17.8x 13.5x 9.8% NA 14.1%
Carbonite US 830 28.15 44.7% 48.5% 9.1% 787 770 128 3.1x 2.5x 2.2x 16.3x 9.9x 8.6x 24.3% 76.5% 25.5%
Brightcove US 498 6.85 (18.5%) (1.4%) (2.1%) 239 214 26 1.4x 1.3x 1.2x NM 54.8x 27.6x 7.4% 64.4% 2.3%
Average 4.2x 3.6x 3.3x 17.0x 16.9x 20.0x 15.0% 60.8% 24.1%
Median 4.0x 3.2x 2.6x 13.7x 10.6x 11.1x 10.6% 60.1% 24.3%
Share
Price
Market
Cap EV Cash EV/Revenue EV/EBITDA
CY
Revenue
Growth
Company Name HQ Employee 02-28-18 LTM L6M L1M (m) (m) (m) CY17A CY18E CY19E CY17A CY18E CY19E 18/17 Gross EBITDA
Share Price Performance
CY18E
Margins
42
Key Sector Takeaways
Recent Software Transaction Trends
Public Market SaaS Analyses
Key SaaS Metrics
Appendix A: GP Bullhound SaaS Index
Appendix B: Software Public Comps by Category
1
2
3
4
6
7
8Appendix C: GP Bullhound Software Report
Overview, Software Credentials & Team
5 SaaS CEO Commentary
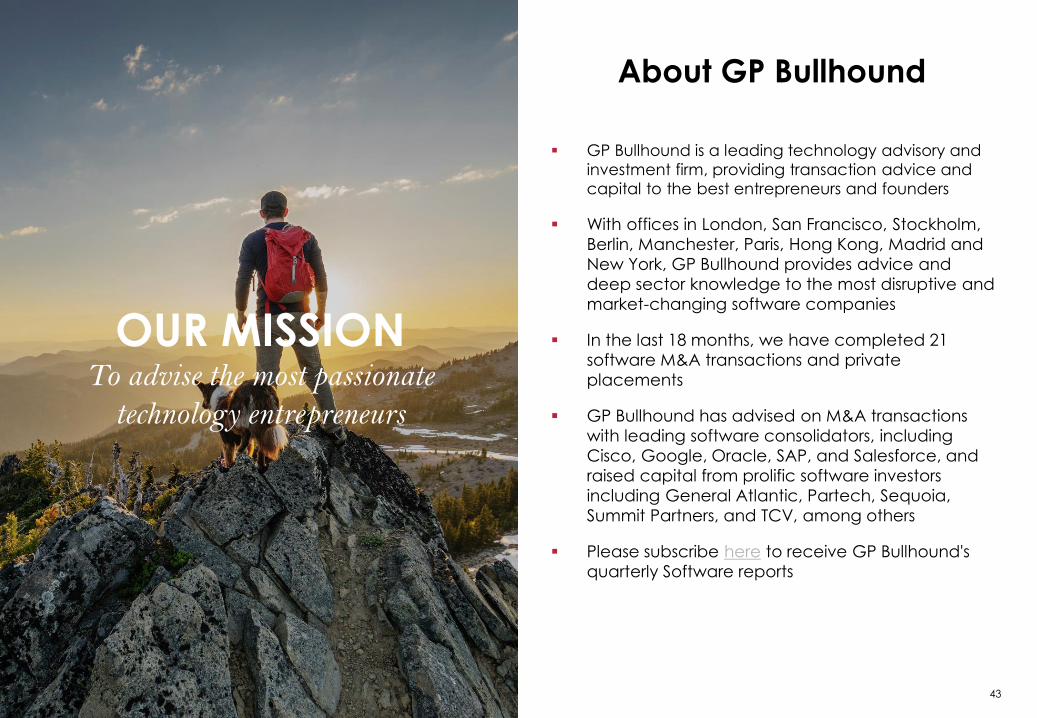
43
OUR MISSIONTo advise the most passionate
technology entrepreneurs
▪ GP Bullhound is a leading technology advisory and
investment firm, providing transaction advice and
capital to the best entrepreneurs and founders
▪ With offices in London, San Francisco, Stockholm,
Berlin, Manchester, Paris, Hong Kong, Madrid and
New York, GP Bullhound provides advice and
deep sector knowledge to the most disruptive and
market-changing software companies
▪ In the last 18 months, we have completed 21
software M&A transactions and private
placements
▪ GP Bullhound has advised on M&A transactions
with leading software consolidators, including
Cisco, Google, Oracle, SAP, and Salesforce, and
raised capital from prolific software investors
including General Atlantic, Partech, Sequoia,
Summit Partners, and TCV, among others
▪ Please subscribe here to receive GP Bullhound's
quarterly Software reports
About GP Bullhound
44
Software Market Report Overview
▪ GP Bullhound has established a quarterly market
report on the Software as a Service (“SaaS”) space
to provide quantitative insights into public and
private market valuations across the transaction
spectrum and qualitative insights into company
business models, technology and customer trends
▪ The report examines the SaaS public company
landscape, M&A, private placement and IPO
trends
▪ The software sector has disrupted technology and
many other industries over the last several
decades; first providing a global wave of on-
premise software to all industries in the 1980s and
1990s; then modernizing traditional businesses
through cloud-based platforms and enabling
growth in business-to-consumer technologies, from
mobile, to banking, to real estate, to consumer
products
▪ The shift of business applications to the cloud, de-
centralized IT operations and infrastructure
software have percolated through organizations
large and small creating a Software Eating the
World paradigm
JONATHAN CANTWELL
Director
45
GP Bullhound’s Selected Software Transactions
Sold to Sold to Private placement Sold to
Sold to
Sold toSold to
Private placement Private placement Sold toSold to
Sold toSold to Sold to
Sold to
Private placementPrivate placement
ECI Partners
Sold toSold toPrivate placement

46
Authors
PIERCE LEWIS-OAKES
ALEC DAFFERNER
OKAN INALTAY
PER ROMAN
Managing [email protected]
MATT FINEGOLD
JONATHAN CANTWELL

47
No information set out or referred to in this research report shall form the basis of any contract. The issue of this
research report shall not be deemed to be any form of binding offer or commitment on the part of GP Bullhound
LLP. This research report is provided for use by the intended recipient for information purposes only. It is prepared
on the basis that the recipients are sophisticated investors with a high degree of financial sophistication and
knowledge. This research report and any of its information is not intended for use by private or retail investors in the
UK or any other jurisdiction.
You, as the recipient of this research report, ac- knowledge and agree that no person has nor is held out as having any
authority to give any statement, warranty, representation, or undertaking on behalf of GP Bullhound LLP in
connection with the contents of this research report. Although the information contained in this research report has
been prepared in good faith, no representation or warranty, express or implied, is or will be made and no
responsibility or liability is or will be accepted by GP Bullhound LLP. In particular, but without prejudice to the
generality of the foregoing, no representation or warranty is given as to the accuracy, completeness or reasonableness
of any projections, targets, estimates or forecasts contained in this research report or in such other written or oral
information that may be provided by GP Bullhound LLP. The information in this research report may be subject to
change at any time without notice. GP Bullhound LLP is under no obligation to provide you with any such updated
information. All liability is expressly excluded to the fullest extent permitted by law. Without prejudice to the
generality of the foregoing, no party shall have any claim for innocent or negligent misrepresentation based upon any
statement in this research report or any representation made in relation thereto. Liability (if it would otherwise but
for this paragraph have arisen) for death or personal injury caused by the negligence (as defined in Section 1 of the
Unfair Contracts Terms Act 1977) of GP Bullhound LLP, or any of its respective affiliates, agents or employees, is
not hereby excluded nor is damage caused by their fraud or fraudulent misrepresentation.
This research report should not be construed in any circumstances as an offer to sell or solicitation of any offer to buy
any security or other financial instrument, nor shall they, or the fact of the distribution, form the basis of, or be relied
upon in connection with, any contract relating to such action. The information contained in this research report has
no regard for the specific investment objectives, financial situation or needs of any specific entity and is not a personal
recommendation to anyone. Persons reading this research report should make their own investment decisions based
upon their own financial objectives and financial resources and, if in any doubt, should seek advice from an
investment advisor. Past performance of securities is not necessarily a guide to future performance and the value of
securities may fall as well as rise. In particular, investments in the technology The information contained in this
research report is based on materials and sources that are believed to be reliable; however, they have not been
independently verified and are not guaranteed as being accurate.
The information contained in this research report is not intended to be a complete statement or summary of any
securities, markets, reports or developments referred to herein. No representation or warranty, either express or
implied, is made or accepted by GP Bullhound LLP, its members, directors, officers, employees, agents or associated
undertakings in relation to the accuracy, completeness or reliability of the information in this research report nor
should it be relied upon as such. This research report may contain forward-looking statements, which involve risks
and uncertainties. Forward-looking information is provided for illustrative purposes only and is not intended to
serve as, and must not be relied upon as a guarantee, an assurance, a prediction or a definitive statement of fact or
probability. Actual events and circumstances are difficult or impossible to predict and may differ from assumptions.
Any and all opinions expressed are current opinions as of the date appearing on the documents included in this
research report.
Any and all opinions expressed are subject to change without notice and GP Bullhound LLP is under no obligation
to update the information contained in this research report.
DisclaimerThe information contained in this research report should not be relied upon as being an independent or impartial
view of the subject matter and for the purposes of the rules and guidance of the Financial Conduct Authority (“the
FCA”) this re- search report is a marketing communication and a financial promotion. Accordingly, its contents have
not been prepared in accordance with legal requirements designed to promote the independence of investment research
and it is not subject to any prohibition on dealing ahead of the dissemination of investment research. The individuals
who prepared the information contained in this research report may be involved in providing other financial services
to the company or companies referenced in this research report or to other companies who might be said to be
competitors of the company or companies referenced in this research report. As a result, both GP Bullhound LLP and
the individual members, directors, officers and/ or employees who prepared the in- formation contained in this
research report may have responsibilities that conflict with the interests of the persons who access this research report.
GP Bullhound LLP and/or connected persons may, from time to time, have positions in, make a market in and/or
effect transactions in any investment or related investment mentioned in this research report and may provide
financial services to the issuers of such investments.
The information contained in this research report or any copy of part thereof should not be accessed by a person in any
jurisdictions where its access may be restricted by law and persons into whose possession the information in this
research report comes should inform themselves about, and observe, any such restrictions. Access of the information
contained in this research report in any such jurisdictions may constitute a violation of UK or US securities law, or
the law of any such other jurisdictions. Neither the whole nor any part of the information contained in this research
report may be duplicated in any form or by any means. Neither should the information contained in this research
report, or any part thereof, be redistributed or disclosed to anyone without the prior consent of GP Bullhound LLP.
GP Bullhound LLP and/or its associated undertakings may from time-to-time provide investment advice or other
services to, or solicit such business from, any of the companies referred to in the information contained in this research
report. Accordingly, information may be available to GP Bullhound LLP that is not reflected in this material and
GP Bullhound LLP may have acted upon or used the information prior to or immediately following its publication.
In addition, GP Bullhound LLP, the members, directors, officers and/or employees thereof and/or any connected
persons may have an interest in the securities, warrants, futures, options, derivatives or other financial instrument of
any of the companies referred to in this research report and may from time-to-time add or dispose of such interests.
GP Bullhound LLP is a limited liability partner- ship registered in England and Wales, registered number
OC352636, and is authorised and regulated by the Financial Conduct Authority. Any reference to a partner in
relation to GP Bullhound LLP is to a member of GP Bullhound LLP or an employee with equivalent standing and
qualifications. A list of the members of GP Bullhound LLP is available for inspection at its registered office, 52
Jermyn Street, London SW1Y 6LX.
For US Persons: This research report is distributed to U.S. persons by GP Bullhound Inc. a broker- dealer registered
with the SEC and a member of the FINRA. GP Bullhound Inc. is an affiliate of GP Bullhound LLP. This research
report does not provide personalized advice or recommendations of any kind. All investments bear certain material
risks that should be considered in consultation with an investors financial, legal and tax advisors. GP Bullhound Inc.
engages in private placement and mergers and acquisitions advisory activities with clients and counterparties in the
Technology and CleanTech sectors.
In the last twelve months, GP Bullhound LLP has not been engaged as an advisor to and received compensation
from the companies mentioned in this report, except for Uberall, TIS, TextRecruit, Luma Home, Bizagi, Sequence,
Rightware, and Media IQ

The contents of this presentation document ("Presentation") shall not be deemed to be any form of offer or binding commitment on the part of GP Bullhound
LLP. This Presentation is provided for use by the intended recipient for information purposes only. It is prepared on the basis that the recipients are
sophisticated investors with a high degree of financial sophistication and knowledge. No representation or warranty, express or implied, is or will be made in
respect of the information contained in this Presentation and no responsibility or liability is or will be accepted by GP Bullhound LLP in this regard. In
particular, but without prejudice to the generality of the foregoing, no representation or warranty is given as to the accuracy, completeness or reasonableness
of any projections, targets, estimates or forecasts contained in this Presentation or in such other written or oral information that may be provided by GP
Bullhound LLP. All liability is expressly excluded to the fullest extent permitted by law. This Presentation may contain forward-looking statements, which
involve risks and uncertainties. Actual results may differ significantly from the results described in such forward-looking statements. Any past performance
information contained in this Presentation is provided for illustrative purposes only and is not necessarily a guide to future performance and the value of
securities may fall as well as rise. In particular, investments in the technology sector can involve a high degree of risk and investors may not get back the full
amount invested. This Presentation should not be construed in any circumstances as a solicitation or offer, or recommendation, to acquire or dispose of any
investment or to engage in any other transaction, or to provide any investment advice or service and you should not act or refrain from acting upon any
information contained on it without seeking appropriate professional advice. In the event that you should wish to engage GP Bullhound LLP, separate
documentation, including an engagement letter, will be provided to you. For the purposes of the rules and guidance issued by the Financial Conduct
Authority ("the FCA"), this Presentation has been communicated by GP Bullhound LLP, which is authorised and regulated by the FCA in the United
Kingdom under number 527314.
This Presentation is only directed at persons who fall within the category of “Professional Clients” as defined in the rules and guidance issued by the FCA
from time to time and any investment or investment activity to which this Presentation relates is available only to such persons and will be engaged in only
with such persons. The information contained in this Presentation must not be relied upon by persons who are not Professional Clients and any person who is
not a Professional Client should return it immediately to GP Bullhound LLP at the address below. This Presentation and any other information or opinions
supplied or given to you by GP Bullhound LLP constitute confidential information. Neither the whole nor any part of the information contained in this
Presentation may be duplicated in any form or by any means. Neither should the information contained in this Presentation, or any part thereof, be
redistributed or disclosed to anyone without the prior written consent of GP Bullhound LLP. GP Bullhound LLP is a limited liability partnership registered
in England and Wales, registered number OC352636, and is authorised and regulated by the FCA. Any reference to a partner in relation to GP Bullhound
LLP is to a member of GP Bullhound LLP or an employee with equivalent standing and qualifications. A list of the members of GP Bullhound LLP is
available for inspection at its registered office: 52 Jermyn Street, London SW1Y 6LX.
LONDONtel. +44 207 101 7560
52 Jermyn Street
London, SW1Y 6LX
United Kingdom
SAN FRANCISCOtel. +1 415 986 0191
One Maritime Plaza Suite 1620
San Francisco, CA 94111
USA
STOCKHOLMtel. +46 8 545 074 14
Grev Turegatan 30
Stockholm, 114 38
Sweden
BERLINtel. +49 30 610 80 600
Kleine Jaegerstr. 8
Berlin, 101 17
Germany
PARIStel. +33 1 82 88 43 40
45 rue de Lisbonne
75 008 Paris
France
MANCHESTERtel. +44 161 413 5030
1 New York Street
Manchester, M1 4HD
United Kingdom
HONG KONGtel. +852 5806 1310
Level 6, Champion Tower
3 Garden Road, Central
Hong Kong
MADRIDtel. +34 951 12 72 32
Paseo de Recoletos 6
28001 Madrid
Spain
NEW YORKtel. +1 212 759 1870
Three Park Ave, 31st Floor
New York, NY 10016
USA