POWERING OUR FUTURE WITH TRASH
16
POWERING OUR FUTURE WITH TRASH March 2019 Richard Ling
Transcript of POWERING OUR FUTURE WITH TRASH

POWERING OUR FUTURE WITH TRASH
March 2019
Richard Ling

1
POWERING OUR FUTURE WITH TRASHRichard Ling March 2019 kleinmanenergy.upenn.edu
INTRODUCTION
Every year, our world produces around 2.1 billion tons of waste, which ultimately emits over 7.7 billion tons of greenhouse gases (GHGs) over a breakdown period of 20 years (Roberts 2018). Current tactics to combat GHG emissions from waste include recycling, composting, source reduction, and—the topic of this policy digest—waste-to-energy (WTE) technology. WTE technology can potentially address two of the world’s largest problems: waste destruction and energy demand (both of which will compound with population growth). To date, roughly 2,430 WTE plants are active worldwide, which constitute roughly 360 million tons of disposal capacity (Ecoprog 2018). The U.S., by comparison, currently holds around 86 WTE facilities, which account for just 0.25% of the nation’s total generation capacity (Research and Markets 2018; EIA 2017).
Given WTE’s potential benefits and the U.S.’s scarce utilization of this seemingly-utopian technology, this policy digest will discuss the social, political, and economic environments that foster and inhibit WTE deployment, the potential consequences of mass WTE deployment for the U.S., and an innovative WTE plant from Sierra Energy.
In the face of rapid industrialization and resource consumption, waste-to-energy technology is a crucial step towards a circular economy.
EVERYONE SHOULD CARE ABOUT WTE TECHNOLOGY
By current trajectory, rapid industrialization and increasing demands for goods and services will inevitably lead to a scarcity of energy and a surplus of waste in developing and developed countries (Haneef and Memon 2014; World Bank 2018). Thus, WTE is evermore pertinent as not only a waste management tactic, but also an energy procurement strategy.
Europe currently holds the largest market for WTE technologies, which accounted for 47.6% of WTE’s total market revenue in 2013.7 The Asia–Pacific WTE market is dominated by Japan, which sends more than 60% of its solid waste to incineration, and China, which doubled its WTE generating capacity from 2011 to 2015 (World Energy Council 2016).

2 kleinmanenergy.upenn.edu
The U.S., on the other hand, has only had one large-scale WTE facility built since 1995 (Solid Waste Authority of Palm Beach 2015). This lack of development can largely be attributed to the following factors: (1) public dissent based on unfavorable historical events, (2) adverse taxes, boundaries, and regulations on WTE technology, and (3) the U.S. geo-economic landscape.
A BRIEF PRIMER ON WTE
WTE technologies are characterized by feedstock type, end product, usage of biological decomposition (or lack thereof), and several socio–economic considerations, including tipping fee, land footprint, and emissions. Such delineations and decades of research have spawned a plethora of WTE technologies, which span three subtypes: biochemical, thermochemical, and chemical.
Biochemical WTE—which comprises fermentation, anaerobic digestion, landfill gas capture, and microbial fuel cells—involves organisms that ferment, decompose, or digest waste to produce various end products, including methane, ethanol, and biodiesel fuel. Chemical WTE involves the reaction of an acid and an alcohol to create an ester, which can be refined into ethanol and biodiesel. Finally, thermochemical WTE comprises thermal gasification, pyrolysis, and incineration.
Conventional thermal gasification breaks down waste at temperatures greater than 750°C, while plasma arc gasification vitrifies waste at temperatures within 4000°C to 7000°C. Pyrolysis operates at similar temperatures as conventional thermal gasification, but it involves higher operating pressures within an anaerobic environment.
Despite such modern advancements in WTE technology, the poster-child of WTE is incineration technology, in which the heat generated from burning organic waste is recovered as energy (EPA 2017). Incineration, as the earliest and most prevalent form of WTE, faced public scrutiny in the late 20th century due to its emissions of dioxins, mercury, CO2, N2O, NOX, and SO2.
In response to egregious emissions, the EPA introduced the Maximum Achievable Control Technology (MACT) Standards under the 1990 Clean Air Act Amendments. The MACT Standards used the hazardous air pollutants (HAP) levels of the best-performing industry sources to set the MACT floor (hence, “maximum achievable”).
All new and existing power plants had to meet or exceed the MACT floor by installing air pollution controls (APC). Failure to install APCs to meet the MACT Floor was grounds for immediate closure. Due to the high operational and maintenance costs of APCs (e.g. spray dryers, baghouses, electrostatic precipitators), incineration technology stagnated considerably after the passage of the MACT Standards, relative to its pre-1990 growth rates (Sankey and Liceta 2010) (see Figure 1).
Consequently, newer WTE technologies, such as gasification, pyrolysis, and anaerobic digestion, have to grandfather the reputation of incinerators, which endowed stringent policy regulations at the federal, state, and local levels.
FIGURE 1: MUNICIPAL SOLID WASTE (MSW) INCINERATION PREVALENCE FROM 1960–2009 (EPA 2010)
MSW
SEN
T TI
INCI
NERA
TION
(MIL
LION
S OF
TON
S)
40
35
30
25
20
15
10
5
0
1958
1968
1978
1988
1998
2008
2018
0.42.7
29.7
33.7
31.6
3231.6
29
0

Powering Our Future with Trash 3
CURRENT POLICY ENVIRONMENT SURROUNDING WTE
The U.S. is one of the few major countries that delegates renewable energy targets to the states, which engenders inconsistencies in widespread adoption and implementation.
The main culprit behind the U.S.’s lack of a national energy policy is our coordinate model of authority, which gives power to the states to regulate electric utilities, while the federal government regulates the wholesale transportation of electricity (Elliott 2013; Tomain and Cudahy 2004; Pierce 1994). State authorities have thereby adopted the Renewable Portfolio Standards (RPS), which mandate local utilities to achieve a certain proportion of renewable power generation.
However, only 29 states and Washington D.C. have adopted RPS, and the amount of capital allocated to each renewable practice (e.g. solar, wind, biomass, hydro, WTE) is, in large part, determined by the “Tiers” of the RPS. Tier 1 renewable sources—solar, wind, biomass, anaerobic digestion, geothermal, tidal power, renewable fuel cells, small hydro, poultry-
litter incineration facilities—are given more favorable renewable energy credit (REC) rates than Tier 2 sources, which include waste coal, distributed generation systems, municipal solid waste (MSW), and large-scale hydro (Simmons et al. 2015).
RECs are certificates granted to renewable energy procurers to provide proof of renewable energy purchases. RECs are crucial to ensure revenue streams for renewable energy producers and to demonstrate adherence to renewable energy quotas, which are outlined within RPS.
Under the RPS, MSW is not considered to be a fully renewable resource, as the non-biogenic components (e.g. glass, plastics, metals, etc.) are technically non-renewable. However, the EPA defines renewable energy as, “Fuel sources that restore themselves over a short period of time and do not diminish.” Not only does MSW replenish periodically, but it also experiences exponential growth: the World Energy Council projects that global waste generation will double to over 6 million tons per day by 2025 and may reach over 11 million tons per day by 2100. Thus, by the EPA’s own definition, MSW should be a fully renewable resource.
TABLE 1: RENEWABLE ENERGY TARGETS OF SELECT COUNTRIES (IEA 2018)
Country Target Main Support Scheme
China Non-fossil fuel cumulative capacity to exceed 770 GW by 2020 Feed-in tariff
Japan 22–24% of total electricity generation to be met by renewable sources by 2030
Feed-in tariff and auctions for large solar PV
France 32% of gross final energy consumption to be comprised of renewable sources
Feed-in tariffs and auction system
Russia 4.5% of total electricity generation from renewable sources Capacity auctions
India Solar PV: 100 GW; Wind: 60 GW; Biomass: 10 GW; Small hydropower: 5 GW. All by 2022
Capacity auctions, feed-in tariffs, and accelerated depreciation tax benefits
Sweden 49% of renewable sources in gross final energy consumption Norway–Sweden Green Certificate Scheme
United States No national renewable energy target; delegated to states in Renewable Portfolio Standards (RPS)

4 kleinmanenergy.upenn.edu
ZOOM OUT, AMERICA
Consequent to the aforementioned EPA regulations, biogenic WTE is considered renewable, but the non-biogenic components, such as packaging and durable goods, are sent to landfills. Not only does this limit the capabilities of modern WTE technology, as modern technologies can process virtually all types of waste (MSW, hazardous waste, construction and demolition waste, medical waste), but it also results in greater emissions from landfills.
A dangerous contradiction is thereby observed: the EPA’s strict classification of “renewable” MSW (i.e. the biogenic components) leads to greater landfill emissions. This should never occur in the realm of energy policy, as the main goal of renewable technologies is to foster a sustainable future for humanity. In fact, Columbia’s Earth Engineering Center reports that, if all of the plastic contained in landfills were sent to WTE plants, we would recover the equivalent energy content of 48 million tons of coal, 180 million barrels of oil, or one trillion cubic feet of natural gas (EPA 2016). This is enough energy to power over 28 million U.S. residential homes for 1 year (Themelis et al. 2011). The conclusion is unequivocal: sending waste to landfills is a waste of energy and a major source of emissions.
THE REALITY OF LANDFILLS
The U.S. currently holds over 28 times more landfills than WTE facilities, and the growth rate of landfills from 2014 to 2018 has been over ten times that of WTE facilities (see Figure 3).
Despite landfills’ inherent environmental consequences (e.g. leaching, biodiversity loss due to soil infertility, air pollution), methane capture from landfill is on an equal footing as WTE for many renewable energy policies, which can be categorized into financial incentives and regulatory policies. Such financial incentives include Qualified Energy Conservation Bonds (QECB) and Clean Renewable Energy Bonds (CREB). QECBs and CREBs are similar in that they are both qualified tax credit bonds, in which the borrower only pays back the principal of the bond and the bondholder receives direct subsidies to cover the interest (DSIRE 2018b, 2018e).
Alongside WTE and methane capture from landfills are also on an equal playing field for many regulatory policies, including the Federal Green Power Purchasing Goal (GPPG), the Public Benefits Program (PBP), and the Alternative Energy Portfolio Standards (AEPS). The GPPG simply specifies electric energy purchasing goals for fiscal years up until 2025, the PBP denotes eligibility
FIGURE 2: COMPONENTS OF MSW BY PRODUCT TYPE IN WEIGHT (U.S.) (EPA 2016)
THOU
SAND
S OF
TON
S
300K
200K
100K
0
1960 1970 1980 1990 2000 2010
◼ Durable Goods ◼ Nondurable Goods ◼ Containers & Packaging ◼ Food ◼ Yard Trimmings ◼ Other Wastes

Powering Our Future with Trash 5
for a $99 million revolving loan and investment fund, and the AEPS is a Pennsylvania-specific power production quota for utilities (DSIRE 2014, 2018c, 2018d).
The AEPS splits renewable technologies into two Tiers, and WTE is considered a Tier 2 technology while biologically-derived methane gas and coal-mine methane is considered Tier 1 (all other landfill methane is considered Tier 2) (DSIRE 2018a). While methane capture from landfills is preferable over the lack thereof, policy regulations placing WTE on an equal footing as landfill gas overlook the reality of methane capture.
The EPA’s Waste Reduction Model concludes that only an average of 34% of methane is actually captured to produce electricity, 38% is flared, and the remaining 28% is not recovered at all (Kasper 2013). Conversely, state-of-the-art WTE technology is able to reduce waste volume by 99% to 100%, generate 10 times as much renewable energy as landfill gas, and, on top of it all, result in few if any source emissions (Kasper 2013).
THE NEXT GENERATION OF WTE TECHNOLOGY
Tucked away on the coast of central California lies Fort Hunter Liggett (FHL), the largest active U.S. Army Reserve command post.
Out of FHL’s 167,000 acres of land, a quarter of an acre is dedicated to a WTE gasification plant built by Sierra Energy. The “FastOx Gasifier,” as it is called, is designed to handle multiple feedstocks, such as MSW, hazardous waste, construction and demolition waste, biomass, and medical waste. The end products are syngas—which is primarily composed of carbon monoxide, hydrogen, and carbon dioxide—and molten slag, which can be used for construction clinker or building material. The syngas is further processed and refined into valuable energy end products, such as electricity, diesel, ethanol, hydrogen fuel, and renewable natural gas.
Like other WTE systems, the FastOx Gasifier can complement existing recycling centers, as contaminated recyclables which are usually sent to landfills can instead be fed into the FastOx Gasifier to produce energy. Unlike most WTE systems, the FastOx Gasifier has no emissions at the gasifier level and can produce electricity with minimal footprint. In fact, a 0.25 acre FastOx system can produce the same amount of
Entrance to Fort Hunter Liggett
FIGURE 3: COMPARISON OF NUMBER OF WTE FACILITIES AND LANDFILLS IN SELECT YEARS (EIA 2018; EPA 2018; MICHAELS AND SHIANG 2017)
3,000
2,500
2,000
1,500
1,000
500
0
NUM
BER
OF W
TE F
ACIL
ITIE
S
98
NUM
BER
OF L
ANDF
ILLS
96
94
92
90
88
86
84
82
2000
2002
2004
2006
2008
2010
2012
2014
2016
2018
2020
WTE Facilities Landfills
97
1,967
1,7541,908
1,956
2,455
89
86 86
84

6 kleinmanenergy.upenn.edu
electricity as six acres of wind turbines or eight acres of solar panels (Roberts 2018). As global population compounds to over 10 billion by 2100 and cities experience overcrowding, land area for electricity generation will become a premium. The FastOx Gasifier can thereby serve a crucial purpose for cities: diverting landfill waste while providing renewable energy with minimal footprint.
As with any large-scale capital project, economics drives adoption. The cost of a FastOx plant varies depending on the following project features: size of plant, feedstock blends and availability, desired end product, local tipping fees, local electricity and natural gas prices, and retail price that the end product(s) can be sold at (Sierra Energy 2015). Following economies of scale, larger plants yield greater efficiencies and larger profits than smaller plants.
The FastOx system can also handle most feedstocks, including municipal solid waste, auto shredder residue, biomass, medical waste, railroad ties, tires, construction and demolition waste, and industrial waste (Sierra Energy 2016). Each feedstock yields a different tipping fee depending on the region.
For Philadelphia, biomass yields the lowest tipping fee at $20/MT while medical waste has the highest tipping fee at $400/MT (Sierra Energy 2019). That said, a feedstock’s tipping fee must be considered in the context of its availability to gauge economic feasibility.
For example, a biomass FastOx plant can potentially be more cost-effective than a medical waste plant if a region has an ample supply of biomass and a scarce supply of medical waste. Moreover, the FastOx technology depends on natural gas to heat up its internal vessel, similar to blast furnace technology on which it is based, so the local cost of natural gas also affects its economic feasibility. For example, the local natural gas price in Philadelphia ranges from $2.30 to $2.50/MMBTU while the local natural gas price in San Francisco ranges from $3.04 to $3.89/MMBTU (AAA 2018).
The end product is also a crucial determinant of economic feasibility, as FastOx gasification can produce electricity, diesel, hydrogen, and/or ammonia—each with unique sale prices. Lastly, carbon credits and renewable energy credits can greatly benefit the economic feasibility of a FastOx project. Currently, only ten states have active carbon pricing mechanisms: California, Connecticut, Delaware, Maine, Maryland, Massachusetts, New Hampshire, New Jersey, New York, Rhode Island, and Vermont (Center for Climate and Energy Solutions 2018).
To view all of these variables in action, the following figure shows the economic breakdown of a Philadelphia-based FastOx system at a size of 50 MT/day, a feedstock of municipal solid waste, and an end product of electricity. Further economic comparisons of size, feedstock, end product, and carbon/renewable energy credits are included in the appendix.
Unlike most WTE systems, the FastOx Gasifier has no emissions at the gasifier level and can produce electricity with minimal footprint. In fact, a 0.25 acre FastOx system can produce the same amount of electricity as six acres of wind turbines or eight acres of solar panels.

Powering Our Future with Trash 7
FIGURE 4: ECONOMIC PROJECTIONS FOR FASTOX
Economic Projections for FastOx with Following Specifications: Philadelphia-based, 50 MT/day, municipal solid waste feedstock, electricity end product, and no carbon or RIN credits. Disclaimer: this is an economic projection, and not a final feasibility report.

8 kleinmanenergy.upenn.edu
THE FUTURE OF WASTE
By 2100, landfills will be a thing of the past, and all waste management will lie in three categories: recycling, composting, or WTE. European model nations, such as Germany, Netherlands, and Austria, have already modernized their waste management sector (see Figure 5).
The only way for the U.S. to become a global leader in waste management, besides source reduction, is to pursue a complete overhaul of our current model: we must enable WTE technologies to replace landfills and
increase recycling and composting efforts throughout our nation. In the wake of China’s ban on plastic imports, which will directly displace up to 111 million metric tons of plastic waste by 2030, there has never been a more appropriate time to deploy WTE technologies that can not only handle contaminated and uncontaminated plastics, but also generate valuable energy end products to power our burgeoning economy (Watson 2018).
To do so, the U.S. must enact favorable policies that designate WTE as a Tier 1 renewable resource, define MSW as a completely renewable feedstock, demote landfill gas to a Tier 2 generation method, and provide favorable subsidies to existing WTE facilities.
FIGURE 5: U.S. WASTE MANAGEMENT COMPARED TO EUROPEAN NATIONS (KASPER 2013)
100%
80%
60%
40%
20%
0%UNITED STATES GERMANY NETHERLANDS AUSTRIA BELGIUM SWEDEN EUROPEAN UNION 27
◼ Recycling/Composting ◼ Energy from Waste ◼ Landfilled
24%
7%
38% 39%
30%
37%
49%
1%1%
38%
22%
62% 61%
70%
62%
50%
40%
69%

Powering Our Future with Trash 9
BIBLIOGRAPHY
AAA. 2018. “Gas Prices.” State Gas Price Average. Last updated March 13, 2019. https://gasprices.aaa.com/state-gas-price-averages/
Center for Climate and Energy Solutions. 2018. “State Carbon Pricing Policies.” https://www.c2es.org/document/state-carbon-pricing-policies/
Database of State Incentives for Renewables & Efficiency (DSIRE). 2014. “Public Benefits Program.” Public Benefits Program. Last updated December 2, 2014. http://programs.dsireusa.org/system/program/detail/164
———. 2018a. “Alternative Energy Portfolio Standard.” Alternative Energy Portfolio Standard. Last updated July 10, 2018. http://programs.dsireusa.org/system/program/detail/262
———. 2018b. “Clean Renewable Energy Bonds.” Clean Renewable Energy Bonds. Last updated August 15, 2018. http://programs.dsireusa.org/system/program/detail/2510
———. 2018c. “Green Power Purchasing Goal.” Green Power Purchasing for the Federal Government. August 21, 2018. http://programs.dsireusa.org/system/program/detail/1060
———. 2018d. “Modified Accelerated Cost Recovery Systems.” Modified Accelerated Cost Recovery Systems. Last updated August 21, 2018. http://programs.dsireusa.org/system/program/detail/676
———. 2018e. “Qualified Energy Conservation Bonds.” Qualified Energy Conservation Bonds. Last updated August 22, 2018. http://programs.dsireusa.org/system/program/detail/3098
Ecoprog. 2018. “Waste to Energy 2018/2019.” Ecoprog, 11th edition. https://www.ecoprog.com/fileadmin/user_upload/leseproben/extract_market_report_WtE_2018-2019_ecoprog.pdf
Elliott, E Donald. 2013. “Why the U.S. Does Not Have a Renewable Energy Policy.” Faculty Scholarship Series. Paper 5007. http://digitalcommons.law.yale.edu/fss_papers/5007
Haneef, Inamullah, and Faisal Hussain Memon. 2014. “Energy Crisis and its Statistics.” Search and Discovery. Department of Petroleum & Natural Gas Engineering, Mehran University of Engineering & Technology. http://www.searchanddiscovery.com/pdfz/abstracts/pdf/2015/90209papg/abstracts/haneef.pdf.html
International Energy Agency (IEA). 2018. “IEA/IRENA Joint Policies and Measures Database.” https://www.iea.org/policiesandmeasures/renewableenergy/
Joseph P. Tomain & Richard D. Cudahy. 2004. Energy Law in a Nutshell. West Academic Publishing, 2nd Edition.
Kasper, Matt. 2013. “Energy from Waste can help curb Greenhouse gas emissions.” Center for American Progress. Last modified April 17, 2013. https://www.americanprogress.org/issues/green/reports/2013/04/17/60712/energy-from-waste-can-help-curb-greenhouse-gas-emissions/
Michaels, Ted, Ida Shiang. 2017. “2016 Directory of Waste-to-Energy Facilities.” Energy Recovery Council. http://energyrecoverycouncil.org/wp-content/uploads/2016/05/ERC-2016-directory.pdf
Research and Markets. 2018. “New Analysis on US Waste-to-energy Market.” RECYCLING Magazine, February 14, 2018. https://www.recycling-magazine.com/2018/02/14/new-analysis-us-waste-energy-market/
Richard J. Pierce. 1994. “The State of the Transition to Competitive Markets in Natural Gas and Electricity.” 15 Energy L.J. 323. https://www.eba-net.org/assets/1/6/27_15EnergyLJ323(1994).pdf
Roberts, Meredith. 2018. “Sierra Energy—FastOx Gasification Overview.” Presentation, Fort Hunter Liggett.
Sankey, Mark R., Nj and Anthony Licata. 2010. “Air Pollution for Waste to Energy Plants—What Do We Do Now?” http://www.seas.columbia.edu/earth/wtert/sofos/nawtec/nawtec05/nawtec05-11.pdf
Sierra Energy. 2015. “Economic Overview.” https://www.sierraenergy.com/technology/knowledge-base/economics/economics-overview/
———. 2016. “FastOx Gasifier Feedstock Overview.” https://www.sierraenergy.com/technology/knowledge-base/feedstock/fastox-gasifier-feedstock-overview/
———. 2019. “Calculate your project economics.” https://www.sierraenergy.com/economics/calculate-your-project-economics/
Simmons, Randy, et al. 2015. “Renewable Portfolio Standards: Pennsylvania.” Institute of Political Economy, Utah State University. April 5, 2015. www.strata.org/wp-content/uploads/2016/04/IPE-RPSPenn-Full-Report.compress.pdf
Solid Waste Authority of Palm Beach County. 2015. “Palm Beach Renewable Energy Facility No. 2.” https://swa.org/DocumentCenter/View/1607/REF2-Info-and-Specs?bidId=
Themelis, Nickolas, M.J. Castaldi, J. Bhatti, and L. Arsova. 2011. “Energy and Economic Value of Non-Recycled Plastics and Municipal Solid Wastes that are Current Landfilled in the Fifty States.” Columbia University. August 16, 2011. Accessed August 11, 2018. http://www.seas.columbia.edu/earth/wtert/sofos/ACC_Final_Report_August23_2011.pdf
U.S. Energy Information Agency (EIA). 2017. “Existing Capacity by Energy Source, 2017 (Megawatts).” https://www.eia.gov/electricity/annual/html/epa_04_03.html
———. 2018. “How much electricity does an American home use?” Last updated October 26, 2018. https://www.eia.gov/tools/faqs/faq.php?id=97&t=3.
U.S. Environmental Protection Agency (EPA). 2010. “Municipal Solid Waste in the United States.” EPA5306P. Washington, D.C. https://archive.epa.gov/epawaste/nonhaz/municipal/web/pdf/msw2009rpt.pdf
———. 2016. “Advancing Sustainable Materials Management: 2014 Fact Sheet.” EPA530-R-17-01. Washington, D.C. https://www.epa.gov/sites/production/files/2016-11/documents/2014_smmfactsheet_508.pdf
———. 2017. “Energy Recovery from the Combustion of Municipal Solid Waste (MSW).” https://www.epa.gov/smm/energy-recovery-combustion-municipal-solid-waste-msw
———. 2018. “Project and Landfill Data by State.” https://www.epa.gov/lmop/project-and-landfill-data-state
Watson, Sara. 2018. “China has refused to recycle the West’s plastics. What now?” National Public Radio. June 28, 2018. https://www.npr.org/sections/goatsandsoda/2018/06/28/623972937/china-has-refused-to-recycle-the-wests-plastics-what-now
World Bank. 2018. “Solid Waste Management.” World Bank. September 20, 2018. http://www.worldbank.org/en/topic/urbandevelopment/brief/solid-waste-management
World Energy Council. 2016. “World Energy Resources Waste to Energy 2016.” https://www.worldenergy.org/wp-content/uploads/2016/10/World-Energy-Resources-Full-report-2016.10.03.pdf
ABOUT THE AUTHOR
Richard Ling is pursuing a B.S.E. in systems engineering and environmental science with a minor in mathematics in the Vagelos Integrated Program for Energy Research (VIPER) at the University of Pennsylvania.
https://www.sierraenergy.com/technology/knowledge-base/feedstock/fastox-gasifier-feedstock-overview/

10 kleinmanenergy.upenn.edu
APPENDIX: ECONOMIC COMPARISONS FOR FASTOX VARIABLES
FIGURE 1: END PRODUCT ECONOMIC COMPARISONS FOR THE FASTOX
Note: all other variables are the same as that of Figure 5 in the main article.

Powering Our Future with Trash 11
FIGURE 2: ECONOMIC PROJECTIONS FOR FASTOX WITH MEDICAL WASTE AS FEEDSTOCK (HIGHEST TIPPING FEE)
Note: all other specifications are the same as that of Figure 5 in main article.

12 kleinmanenergy.upenn.edu
FIGURE 3: ECONOMIC PROJECTIONS FOR FASTOX WITH BIOMASS FEEDSTOCK (LOWEST TIPPING FEE)
Note: all other specifications are the same as that of Figure 5 in main article.

Powering Our Future with Trash 13
FIGURE 4: ECONOMIC PROJECTIONS FOR 1000 MT/DAY FASTOX (LARGEST THEORETICAL SIZE)
Note: all other specifications are the same as that of Figure 5 in main article.
14 kleinmanenergy.upenn.edu
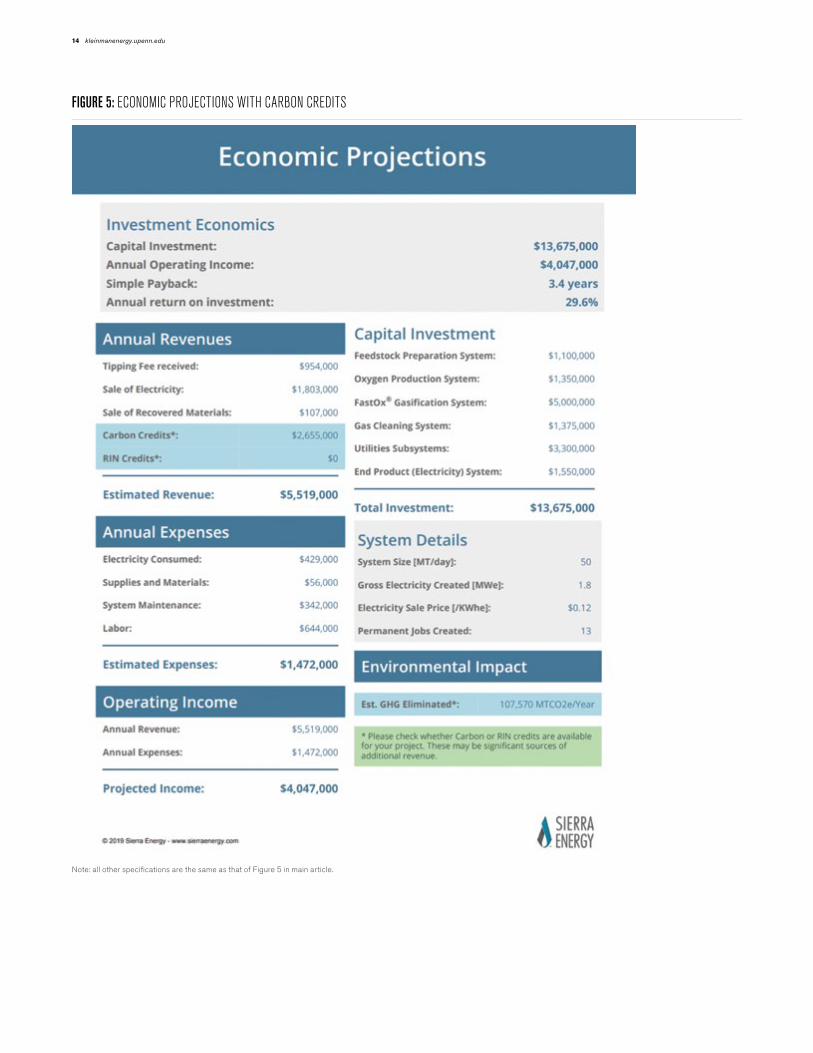
FIGURE 5: ECONOMIC PROJECTIONS WITH CARBON CREDITS
Note: all other specifications are the same as that of Figure 5 in main article.

University of Pennsylvania
Stuart Weitzman School of Design
Fisher Fine Arts Building, Suite 401
220 S. 34th St.
Philadelphia, PA 19104
P 215.898.8502
F 215.573.1650
STAY UP TO DATE WITHALL OF OUR RESEARCH:kleinmanenergy.upenn.edu