Power Posing 1 Running Head: P-CURVING POWER...
16
P-curving Power Posing 1 Running Head: P-CURVING POWER POSING Power Posing: P-Curving the Evidence Joseph P. Simmons & Uri Simonsohn University of Pennsylvania Word Count: 3,202 Forthcoming in Psychological Science
Transcript of Power Posing 1 Running Head: P-CURVING POWER...

P-curving Power Posing
1
Running Head: P-CURVING POWER POSING
Power Posing: P-Curving the Evidence
Joseph P. Simmons & Uri Simonsohn
University of Pennsylvania
Word Count: 3,202
Forthcoming in Psychological Science

P-curving Power Posing
2
In a well-known article, Carney, Cuddy, and Yap (2010) documented the benefits of “power posing.”
In their study, participants (N=42) who were randomly assigned to briefly adopt expansive, powerful
postures sought more risk, had higher testosterone levels, and had lower cortisol levels than those
assigned to adopt contractive, powerless postures. This result has led some to recommend power posing
as a way to improve performance and life outcomes (e.g., Blodget, 2013; Cuddy, 2012).
Despite the attention this study has received, there had until recently been no known attempts to
closely replicate its methods. Ranehill et al. (2015), using similar but not identical procedures, found that
although adopting powerful postures led to self-reported increases in feelings of power (thus verifying the
effectiveness of their manipulation), it did not affect participants’ (N=200) behavior or hormonal levels.1
In their response to the failed replication, Carney, Cuddy, and Yap (2015) reviewed 33 successful
studies investigating the effects of expansive vs. contractive posing, focusing on differences between
these studies and the failed replication, to identify possible moderators that future studies could explore.
But before spending valuable resources on that, it is useful to establish whether the literature that Carney
et al. (2015) cited actually suggests that power posing is effective.
It may seem that the existence of 33 supportive published studies is enough to conclude that there is
an effect of expansive/contractive posture on psychological outcomes. However, we need to account for
selective reporting. If results only get published when they show an effect, the fact that all the published
evidence shows an effect is not diagnostic (see, e.g., Pashler & Harris, 2012).
In this paper we rely on p-curve analysis to answer the following question: Does the literature
reviewed by Carney et al. (2015) suggest the existence of an effect once we account for selective
reporting? We conclude not. The distribution of p-values from those 33 studies is indistinguishable from
1 The original authors consider self-reported feelings of power to be a manipulation check rather than an outcome, writing in a recent article, “as a manipulation check, participants reported how dominant, in control, in charge, powerful, and like a leader they felt on a 5-point scale” (Cuddy, Wilmuth, Yap, & Carney, 2015). Moreover, the effects of postural manipulations on self-reported feelings of power are susceptible to demand effects. For example, if an experimenter asks a participant to slouch for two minutes and then to rate how powerful she feels, the participant may assume that the experimenter expects her to feel relatively powerless or may instead answer the question “How powerful is the pose you just assumed?”

P-curving Power Posing
3
what is expected if (1) the average effect size were zero, and (2) selective reporting (of studies and/or
analyses) were solely responsible for the significant effects that are published.
Our results do not imply, nor could they imply, that the effect size examined in these studies is
exactly zero. It is possible that it is undetectably small in the predicted direction, say r = .03, or in the
unpredicted direction, say r = -.03. But p-curve’s estimates are precise enough to reject effects detectable
in the studies cited by Carney et al. (2015) as evidence for power posing. Thus, what the results do imply
is that direct replications of these studies are not expected to succeed.
The next three sections give an overview of selective reporting and p-curve analyses. Readers familiar
with these topics may safely skip ahead to the “Results” section.
Selective Reporting
Results that obtain statistical significance are more likely to be published (Greenwald, 1975;
Rosenthal, 1979; Sterling, 1959; Sterling, Rosenbaum, & Weinkam, 1995). Selective reporting comes in
at least two forms. One form, “file-drawering” (Rosenthal, 1979), involves the selective reporting of
individual studies that are statistically significant. For example, a researcher may run five studies
investigating the same effect, but then only report the one study that achieved statistical significance,
keeping the remaining four in the file-drawer. (Or equivalently, five researchers may each run one study,
but only the researcher obtaining p<.05 publishes it).
The other form of selective reporting is known as “p-hacking” (Simonsohn, Nelson, & Simmons,
2014a), which consists of conducting alternative analyses on the same dataset, and then selectively
reporting those that statistically significantly support a publishable claim. For example, a researcher may
attempt to control for different variables, to exclude participants they had previously included, to log-
transform the dependent variable, to analyze a few more (or fewer) participants than planned, etc., until
reaching p<.05 (Simmons, Nelson, & Simonsohn, 2011).

P-curving Power Posing
4
Both forms of selective reporting threaten the validity of the published literature by hiding from view
unsupportive (nonsignificant) results, leading one to mistakenly conclude that an effect is larger than it
actually is, or even that an effect is real when it actually is not.
A variety of statistical techniques exist to determine if selective reporting is present in a literature
(Egger, Smith, Schneider, & Minder, 1997; Ioannidis & Trikalinos, 2007; Rothstein, Sutton, &
Borenstein, 2005). These tools can answer the question, “Are there some studies or results we are not
observing in this literature?” (Francis, 2014; Ioannidis, 2011; Schimmack, 2012). However, they do not
answer what is, in our view, the more important question: “Once we account for selective reporting, do
the results we observe suggest the effect is real?” Answering this question requires correcting for
selective reporting, rather than just diagnosing its existence.
The most common approach to correcting for selective reporting is the ‘Trim-and-Fill’ procedure
(Duval & Tweedie, 2000). Unfortunately, it performs very poorly, often leaving estimates nearly as
biased as the uncorrected estimates were. For example, Simonsohn, Nelson, and Simmons (2014b)’s
Figure 2 shows that when a nonexistent effect (Cohen’s d = 0) is studied with predetermined samples
between N=10 and N=70 (and there is no p-hacking), the average statistically significant estimate is
𝑑=.72. Trim-and-fill lowers that estimate only to 𝑑=.70. A less well known method is PET-PEESE
(Stanley & Doucouliagos, 2014). It too performs poorly. For example, Gervais (2015) simulated a
literature in which half the studies investigated a true effect of d=.4 and half investigated a true effect of
d=.8. PET-PEESE estimated the true effect to be zero.2 In our view, the use of these methods should be
discontinued.
P-curve Analysis
In Simonsohn et al. (2014a), we introduced p-curve analysis, a statistical tool that tests whether a set
of findings contains “evidential value.” A set of findings contains evidential value if we can statistically
2 Our own simulations show that PET-PEESE estimates are virtually non-diagnostic of true effect size.

P-curving Power Posing
5
rule out that selective reporting was solely responsible for the set of statistically significant results that
have been observed. P-curve can also be used to obtain a selective-reporting-corrected estimate of the
average statistical power of a set of studies (Simonsohn et al., 2014b).
P-curve is the observed distribution of statistically significant p-values testing the hypothesis of
interest from a set of studies (i.e., p≤.05s). Its shape is diagnostic of evidential value.
In the absence of p-hacking, we expect studies investigating a nonexistent (i.e., zero) effect to result
in a flat (uniform) p-curve. To understand why, consider that when the null is true, there is a 5% chance
of p<.05, a 4% chance of p<.04, a 3% chance of observing p<.03, and so on. This means there is a 1%
chance of observing p<.01, a 1% chance of observing .01<p<.02, a 1% chance of observing .02<p<.03,
and so on.
This is what is expected if the effect is zero in all studies and if p-hacking is absent from all studies.
When p-curve includes some effects that exist (i.e., some non-zero effects), it is expected to be right-
skewed, with more low significant p-values (e.g., .01s) than high significant p-values (e.g., .04s). Thus, if
at least some of the studies in a literature are actually studying a true effect, then more of the critical p-
values will be very significant (.01s) rather than barely significant (.04s). For example, if half the
statistically significant results in a literature examine a real effect (studied with 80% power), and the other
half examine nonexistent effects, the resulting p-curve is expected to have about four times as many p<.01
as .04<p<.05 (also see Cumming, 2008; Hung, O'Neill, Bauer, & Kohne, 1997; Wallis, 1942).3
Some kinds of p-hacking, the selective reporting of analyses conducted on the same dataset, are
analogous to file-drawering, to selectively reporting studies (e.g., reporting results only for men or only
for women). Thus, when a studied effect does not exist, these kinds are equally likely to result in low
significant p-values (.01s) vs. high significant p-values (.04s). In contrast, other kinds of p-hacking are
3 When studies are powered to 80%, about 72% of significant results are expected to be p<.01 and only 4% p>.04 (see Figure 1 in Simonsohn et al., 2014a). Averaging each of these with 20%, which is what is expected under the null, we see that 47% of p<.05 are expected to be p<.01 and 12% are expected to be .04<p<.05.
P-curving Power Posing
6
disproportionately more likely to result in high significant p-values (.04s) than in low significant p-values
(.01). Thus, p-hacking generally makes p-curve flatter (i.e., less right-skewed) and possibly left-skewed.4
When it comes to concluding a literature lacks evidential value, p-curve analysis is conservative; it
occasionally results in right-skewed p-curves even in the absence of an effect. As discussed in
Simonsohn, Simmons, and Nelson (2015), this can occur if the findings are misreported, fraudulent, or if
researchers choose the smallest possible p-value from a large set of analyses (Ulrich & Miller, 2015).
Simonsohn et al. (2015) recently revised p-curve to be more robust to these circumstances.
Inferences from Observed P-curves
P-curve analysis involves two tests, one examining whether p-curve’s shape is significantly right-
skewed and one examining whether p-curve is significantly flat. The second test requires some
explanation. In the same way that statistical inference cannot establish that two population means are
exactly the same, one cannot establish that a distribution is exactly flat (i.e., that the ‘population’
frequency of p=.01s is exactly the same as the frequency of p=.04s). To circumvent this problem, we rely
on the fact that how right-skewed a p-curve is expected to be depends on the statistical power of the
underlying studies. Studies with greater power yield steeper right-skewed p-curves (see Simonsohn et al.,
2014a, 2014b). To test whether p-curve is flat, p-curve analysis tests whether p-curve is significantly less
right-skewed than we would expect if the studies were so underpowered as to be able to detect a true
effect only 1/3 of the time.5 Thus, although we cannot establish whether p-curve is flat, we can establish
whether it is significantly flatter than expected if studies had 33% power.
4 P-hacking’s effect on p-curve’s shape hinges on whether the p-hacked analyses are correlated with each other. When the analyses are uncorrelated with each other, then p-hacking will do the same thing to p-curve as file-drawering does (i.e., it will make p-curve flat under the null). When the analyses are correlated with each other, then p-hacking is more likely to result in significant p-values that are closer to .05 than to .01 (Simonsohn et al., 2014a, 2014b). Simonsohn et al.’s (2014a) Supplement 3, “Modeling p-hacking,” provides a formal analysis of this distinction. 5 Like all cutoffs, the 33%-power cutoff is necessarily arbitrary. Simonsohn et al. (2014a) chose it because it is a very low level of power, as a study with 33% power would be twice as likely to fail as to succeed. Because cutoffs are arbitrary, they should be used as reference points rather than as meaningful categorical divides. In the case of p-curve, the more strongly we reject the null of 33% power, the more inconsistent the evidence is with the existence of the hypothesized effect.

P-curving Power Posing
7
This test provides protection against underpowered p-curves. When too few studies are used for p-
curve analysis, the results will be inconclusive, neither significantly right-skewed nor significantly flat.
Results
Using the online p-curve app (http://www.p-curve.com/app4), we analyzed the 33 studies that Carney
et al. (2015) cited as evidence for the effectiveness of power posing (visit https://osf.io/ujpyn for our P-
curve Disclosure Table and archived copy of R Code used by the app). We had to exclude two studies
because they only investigated feelings of power (the manipulation check) rather than downstream effects
of the postural manipulations, and two studies because the critical test statistics were unreported. In
addition, p-curve necessarily (and automatically) excluded seven p-values because they were non-
significant. Studies hypothesizing 2 x 2 reversing interactions require p-curvers to enter p-values from
each simple effect, and thus to include two p-values rather than one. For two studies in this sample, p-
curve automatically excluded one simple effect (because it was nonsignificant) but retained the other.
Thus, we ultimately excluded 11 p-values from 9 studies from the analysis, giving us a final sample size
of 33 – 9 = 24 p-values from 24 studies. The results are shown in Figure 1.
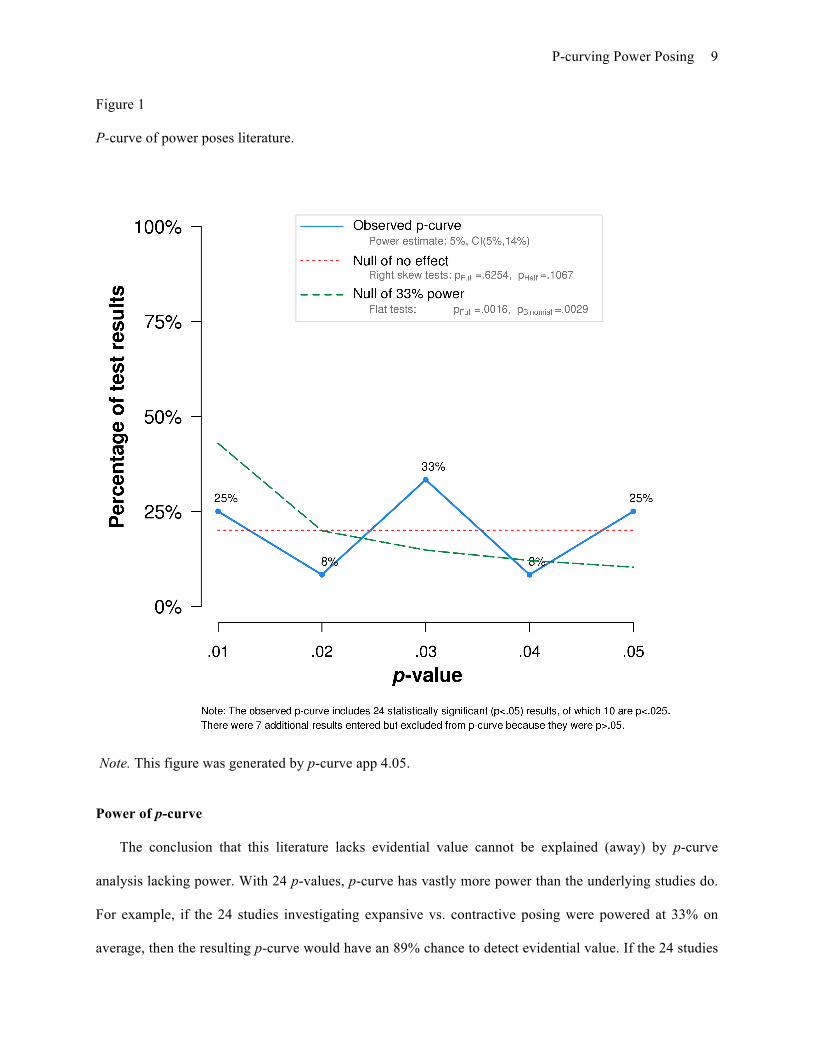
We first evaluated if evidential value was present. As explained in Simonsohn et al. (2015), we
conclude that a literature contains evidential value if either the half p-curve (which only analyzes critical
p-values below .025) is significantly right-skewed at the 5% level, or if both the half and full p-curve are
significantly right skewed at the 10% level. Neither condition is met here (phalf=.11 and pfull=.63,
respectively).
We then compared the observed p-curve to what is expected when studies have an average power of
only 33%. One can conclude there is absence of evidential value if the full p-curve is significantly flatter
than the 33% power p-curve at p<.05.6 This condition is met, pfull=.0016, allowing us to conclusively
reject the null that the sample of existing studies examines a detectable effect.
6 This test is also significant if both the binomial and the full p-curve are flatter at p<.10.

P-curving Power Posing
8
Finally, we can use p-curve to estimate the average power of these studies. It is only 5%, which is the
“power” we expect when the true effect size is zero and the significance threshold is .05 (since 5% of null
effects will be significant at a significance threshold of .05). The confidence interval around this estimate
is narrow, excluding levels of average power greater than 14%. If the same studies were run again, it is
unlikely that more than 14% of them will replicate, and our best guess is that 5% of them will be
significant (in any direction).
Additional Analyses
In Simonsohn et al. (2014a) we provide detailed guidelines for selecting test results from studies. We
followed those guidelines here, leaving minimal ambiguity as to which test to select from each study.
Moreover, we conducted a “robustness” p-curve that included 12 valid alternative p-value selections. The
results from this analysis were very similar to the results reported in the text: The test for evidential value
was non-significant (pfull = .60, phalf = .53) and p-curve was significantly flatter than if the studies were
powered at 33% on average (pfull = .0031); the estimate of average power was still 5%, with a confidence
interval excluding values greater than 17% (rather than 14%). Because Ranehill et al.’s replication
obtained a significant effect of power posing on the manipulation check, self-reported power, we
constructed a separate p-curve including only the 7 manipulation check results. The resulting p-curve was
directionally right-skewed (pfull = .075, phalf = .19). Our p-curve disclosure table (http://osf.io/3jkfr)
includes all p-value selections (and justifications), as well as everything the reader needs to easily
evaluate and reproduce our analyses.
P-curving Power Posing
9
Figure 1 P-curve of power poses literature.
Note. This figure was generated by p-curve app 4.05.
Power of p-curve
The conclusion that this literature lacks evidential value cannot be explained (away) by p-curve
analysis lacking power. With 24 p-values, p-curve has vastly more power than the underlying studies do.
For example, if the 24 studies investigating expansive vs. contractive posing were powered at 33% on
average, then the resulting p-curve would have an 89% chance to detect evidential value. If the 24 studies
P-curving Power Posing
10
had 50% power on average, then the resulting p-curve would have 99% power to detect evidential value.
If 14 studies examined null effects, and 10 examined real effects, a p-curve based on all 24 has more
power than 10 studies do on average (R Code for these calibrations: https://osf.io/sdgkq/). Moreover,
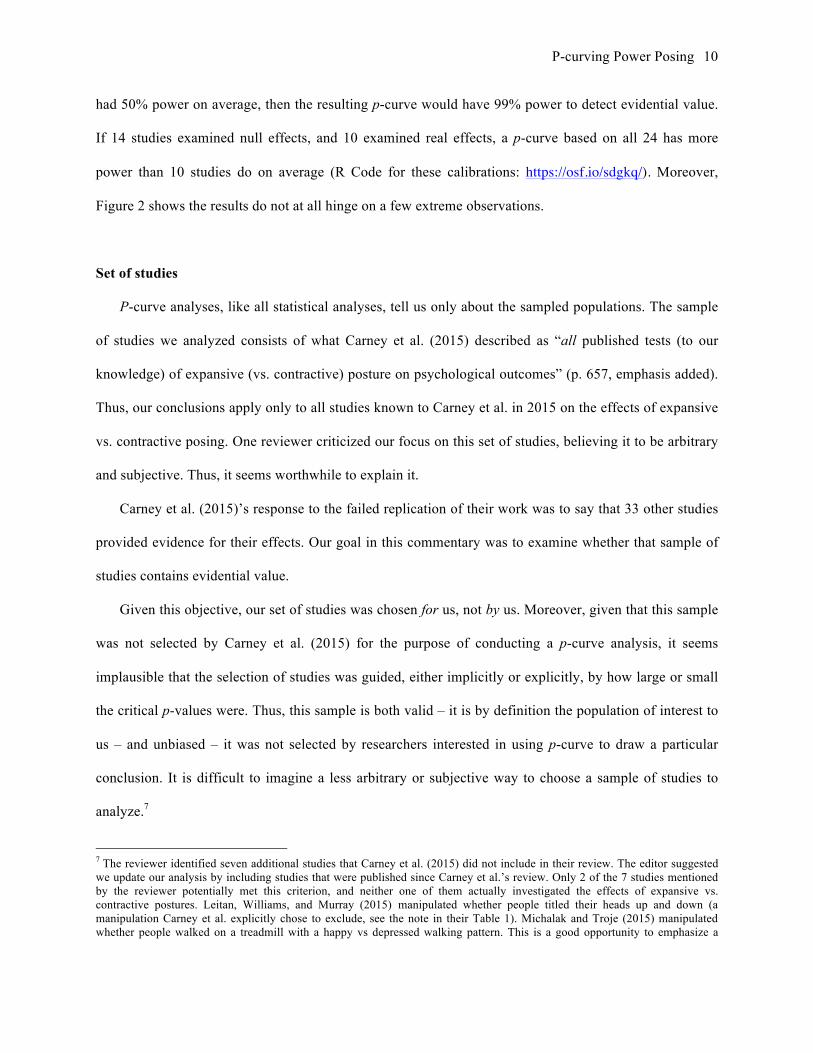
Figure 2 shows the results do not at all hinge on a few extreme observations.
Set of studies
P-curve analyses, like all statistical analyses, tell us only about the sampled populations. The sample
of studies we analyzed consists of what Carney et al. (2015) described as “all published tests (to our
knowledge) of expansive (vs. contractive) posture on psychological outcomes” (p. 657, emphasis added).
Thus, our conclusions apply only to all studies known to Carney et al. in 2015 on the effects of expansive
vs. contractive posing. One reviewer criticized our focus on this set of studies, believing it to be arbitrary
and subjective. Thus, it seems worthwhile to explain it.
Carney et al. (2015)’s response to the failed replication of their work was to say that 33 other studies
provided evidence for their effects. Our goal in this commentary was to examine whether that sample of
studies contains evidential value.
Given this objective, our set of studies was chosen for us, not by us. Moreover, given that this sample
was not selected by Carney et al. (2015) for the purpose of conducting a p-curve analysis, it seems
implausible that the selection of studies was guided, either implicitly or explicitly, by how large or small
the critical p-values were. Thus, this sample is both valid – it is by definition the population of interest to
us – and unbiased – it was not selected by researchers interested in using p-curve to draw a particular
conclusion. It is difficult to imagine a less arbitrary or subjective way to choose a sample of studies to
analyze.7
7 The reviewer identified seven additional studies that Carney et al. (2015) did not include in their review. The editor suggested we update our analysis by including studies that were published since Carney et al.’s review. Only 2 of the 7 studies mentioned by the reviewer potentially met this criterion, and neither one of them actually investigated the effects of expansive vs. contractive postures. Leitan, Williams, and Murray (2015) manipulated whether people titled their heads up and down (a manipulation Carney et al. explicitly chose to exclude, see the note in their Table 1). Michalak and Troje (2015) manipulated whether people walked on a treadmill with a happy vs depressed walking pattern. This is a good opportunity to emphasize a
P-curving Power Posing
11
Conclusion
Taken together, the results from the Ranehill et al.’s (2015) replication and from our p-curve analysis
suggest the behavioral and physiological effects of expansive vs. contractive postures ought to be treated
as hypotheses currently lacking in empirical support. Although more highly powered future research may
find replicable evidence for those benefits (or unexpected detriments), the existing evidence is too weak
to justify a search for moderators or to advocate for people to engage in power posing to better their lives.
critical point about the use of p-curve: the rule guiding the selection of studies must be set in advance and be disclosed to protect against the cherry-picking of studies. The reviewer not only suggested studies that do not belong in the analysis, but s/he also did not disclose an a priori study selection rule.

P-curving Power Posing
12
Figure 2
Robustness of power poses p-curve to excluding extreme p-values.
Note. The y-axis of each chart reports the overall p-value from each test (i.e., the right-skewed test and the 33%-power test) as we exclude more extreme results. The filled marker is the result reported in Figure 1, without any exclusions. For example, the top right chart shows that without any exclusions the overall right-skew test obtains p=.63. As we exclude the highest p-values, the right-skew test remains nonsignificant. Our overall conclusions, therefore, do not hinge on a few extreme results. This figure was generated by p-curve app 4.05.

P-curving Power Posing
13
References
Blodget, H. (2013). This simple ‘power pose’ can change your life and career. Business Insider. Retrieved
from http://web.archive.org/web/20151220171940/http://www.businessinsider.com/power-pose-
2013-5.
Carney, D. R., Cuddy, A. J. C., & Yap, A. J. (2010). Power posing: Brief nonverbal displays affect
neuroendocrine levels and risk tolerance. Psychological Science, 21, 1363-1368.
Carney, D. R., Cuddy, A. J. C., & Yap, A. J. (2015). Review and summary of research on the embodied
effects of expansive (vs. contractive) nonverbal displays. Psychological Science, 26, 657-663.
Cuddy, A. J. C. (Producer). (2012). Your body language shapes who you are. TED talks. Retrieved from
http://web.archive.org/web/20160204004017/https://www.ted.com/talks/amy_cuddy_your_body_lang
uage_shapes_who_you_are?language=en#
Cuddy, A. J. C., Wilmuth, C. A., Yap, A. J., & Carney, D. R. (2015). Preparatory power posing affects
nonverbal presence and job interview performance. Journal of Applied Psychology, 100, 1286-1295.
Cumming, G. (2008). Replication and p intervals: P values predict the future only vaguely, but
confidence intervals do much better. Perspectives on Psychological Science, 3, 286-300.
Duval, S., & Tweedie, R. (2000). Trim and fill: A simple funnel-‐‑plot–based method of testing and
adjusting for publication bias in meta-‐‑analysis. Biometrics, 56(2), 455-463.
Egger, M., Smith, G. D., Schneider, M., & Minder, C. (1997). Bias in meta-analysis detected by a simple,
graphical test. The BMJ, 315, 629-634.
Francis, G. (2014). The frequency of excess success for articles in Psychological Science. Psychonomic
Bulletin & Review, 21, 1180-1187.
Gervais, W. (2015). Putting PET-PEESE to the test. Retrieved from
http://web.archive.org/web/20160120140336/http://willgervais.com/blog/2015/6/25/putting-pet-
peese-to-the-test-1
Greenwald, A. G. (1975). Consequences of prejudice against the null hypothesis. Psychological Bulletin,
82, 1-20.
Hung, H. M. J., O'Neill, R. T., Bauer, P., & Kohne, K. (1997). The behavior of the p-value when the
alternative hypothesis is true. Biometrics, 53, 11-22.
Ioannidis, J. P. A. (2011). Excess significance bias in the literature on brain volume abnormalities.
Archives of General Psychiatry, 68, 773-780.
Ioannidis, J. P. A., & Trikalinos, T. A. (2007). An exploratory test for an excess of significant findings.
Clinical Trials, 4, 245-253.

P-curving Power Posing
14
Leitan, N. D., Williams, B., & Murray, G. (2016). Look up for healing: Embodiment of the heal concept
in looking upward. PLoS ONE, 10, 1-13.
Michalak, J., Rohde, K., & Troje, N. F. (2015). How we walk affects what we remember: Gait
modifications through biofeedback change negative affective memory bias. Journal of Behavior
Therapy and Experimental Psychiatry, 46, 121-125.
Pashler, H., & Harris, C. R. (2012). Is the replicability crisis overblown? Three arguments examined.
Perspectives on Psychological Science, 7, 531-536.
Ranehill, E., Dreber, A., Johannesson, M., Leiberg, S., Sul, S., & Weber, R. A. (2015). Assessing the
robustness of power posing: No effect on hormones and risk tolerance in a large sample of men and
women. Psychological science, 26, 653-656.
Rosenthal, R. (1979). The "File Drawer Problem" and tolerance for null results. Psychological Bulletin,
86, 638-641.
Rothstein, H. R., Sutton, A. J., & Borenstein, M. (Eds.) (2005). Publication bias in meta-‐‑analysis:
Prevention, assessment and adjustments. West Sussex, England: John Wiley & Sons.
Schimmack, U. (2012). The ironic effect of significant results on the credibility of multiple-study articles.
Psychological Methods, 17, 551-566.
Simmons, J. P., Nelson, L. D., & Simonsohn, U. (2011). False-positive psychology: Undisclosed
flexibility in data collection and analysis allows presenting anything as significant. Psychological
Science, 22, 1359-1366.
Simonsohn, U., Nelson, L. D., & Simmons, J. P. (2014a). P-curve: A key to the file drawer. Journal of
Experimental Psychology: General, 143, 534-547.
Simonsohn, U., Nelson, L. D., & Simmons, J. P. (2014b). P-curve and effect size: Correcting for
publication bias using only significant results. Perspectives on Psychological Science, 9, 666-681.
Simonsohn, U., Simmons, J. P., & Nelson, L. D. (2015). Better p-curves: Making p-curve more robust to
errors, fraud, and ambitious p-hacking, a reply to Ulrich and Miller (2015). Journal of Experimental
Psychology: General, 144, 1146-1152.
Stanley, T., & Doucouliagos, H. (2014). Meta-‐‑regression approximations to reduce publication selection
bias. Research Synthesis Methods, 5, 60-78.
Sterling, T. D. (1959). Publication decisions and their possible effects on inferences drawn from tests of
significance—or vice versa. Journal of the American Statistical Association, 54, 30-34.
Sterling, T. D., Rosenbaum, W. L., & Weinkam, J. J. (1995). Publication decisions revisited: The effect
of the outcome of statistical tests on the decision to publish and vice versa. The American Statistician,
49, 108-112.

P-curving Power Posing
15
Ulrich, R., & Miller, J. (2015). P-hacking by post hoc selection with multiple opportunities: Detectability
by skewness test?: Comment on Simonsohn, Nelson, and Simmons (2014). Journal of Experimental
Psychology: General, 144, 1137-1145.
Wallis, W. A. (1942). Compounding probabilities from independent significance tests. Econometrica, 10,
229-248.

P-curving Power Posing
16
Author Note
J. P. Simmons and U. Simonsohn constructed the p-curve disclosure table, conducted the p-curve
analysis, and wrote the manuscript. We thank two editors and four reviewers for extensive feedback on
previous versions of this manuscript. Author order is arbitrary. Corresponding author: