Power Market Expansion in the West June 15, 2021
48
Technical Session Power Market Expansion in the West June 15, 2021 155 North 400 West | Suite 200 | Salt Lake City, Utah 84103 www.wecc.org Background Power markets are expanding in the Western Interconnection. Entities continue to join the CAISO Energy Imbalance Market (EIM) and the Southwest Power Pool (SPP) Western Imbalance Energy Service (WEIS), which began operation in February of 2021. In addition, SPP is considering creation of a full Regional Transmission Organization (RTO) in the West that would include entities that are members of the WEIS. As these power markets expand and challenges to the system evolve, there is a growing interest in understanding how markets affect reliability. The August 2020 Heatwave Event and the February 2021 Cold-Weather Event in Texas make this topic more urgent. This technical session will give participants an understanding of the current state of power markets in the West, the challenges and opportunities they face, and potential changes. The discussion will focus on grid reliability and operations efficiency. Questions the session will touch on include: ∑ How are the markets adapting to events like the August 2020 Heatwave and 2021 Texas Cold- Weather events? ∑ What kinds of risks to reliability exist at the seams between markets? ∑ How will markets help industry to address some of the challenges associated with the changing resource mix? WECC’s white paper on markets, the Power Market Primer, gives a high-level explanation of how power markets work and how they operate to dispatch the lowest-cost power to market members. This white paper may be useful for those wishing to better understand power markets before attending the technical session. Speakers for the Technical Session Andy Meyers, Public Utility Specialist, Bonneville Power Administration Andy Meyers is a senior Public Utility Specialist for the Bonneville Power Administration located in Portland, Oregon. He supports the day-ahead trading organization with a focus on external representation and internal policy development affecting the day-to-day operations of trading and scheduling of power. Mr. Meyers has been involved with WECC representation for more than 10 years. He has served in a leadership role chairing both the Interchange Scheduling and Accounting Subcommittee (ISAS) and the Market Interface Committee (MIC) during his involvement with WECC. Since joining Bonneville 21 years ago, Andy has been a day-ahead scheduler, day-ahead lead subject Technical Session Meeting Book - Technical Session - Power Markets in the West 1
Transcript of Power Market Expansion in the West June 15, 2021

Technical Session
Power Market Expansion in the West
June 15, 2021
155 North 400 West | Suite 200 | Salt Lake City, Utah 84103www.wecc.org
Background
Power markets are expanding in the Western Interconnection. Entities continue to join the CAISO Energy Imbalance Market (EIM) and the Southwest Power Pool (SPP) Western Imbalance Energy Service (WEIS), which began operation in February of 2021. In addition, SPP is considering creation of a full Regional Transmission Organization (RTO) in the West that would include entities that are members of the WEIS. As these power markets expand and challenges to the system evolve, there is a growing interest in understanding how markets affect reliability. The August 2020 Heatwave Event and the February 2021 Cold-Weather Event in Texas make this topic more urgent.
This technical session will give participants an understanding of the current state of power markets in the West, the challenges and opportunities they face, and potential changes. The discussion will focus on grid reliability and operations efficiency. Questions the session will touch on include:
∑ How are the markets adapting to events like the August 2020 Heatwave and 2021 Texas Cold-Weather events?
∑ What kinds of risks to reliability exist at the seams between markets?∑ How will markets help industry to address some of the challenges associated with the changing
resource mix?
WECC’s white paper on markets, the Power Market Primer, gives a high-level explanation of how power markets work and how they operate to dispatch the lowest-cost power to market members. This white paper may be useful for those wishing to better understand power markets before attending the technical session.
Speakers for the Technical Session
Andy Meyers, Public Utility Specialist, Bonneville Power Administration
Andy Meyers is a senior Public Utility Specialist for the Bonneville Power Administration located in Portland, Oregon. He supports the day-ahead trading organization with a focus on external representation and internal policy development affecting the day-to-day operations of trading and scheduling of power. Mr. Meyers has been involved with WECC representation for more than 10 years.He has served in a leadership role chairing both the Interchange Scheduling and Accounting Subcommittee (ISAS) and the Market Interface Committee (MIC) during his involvement with WECC.Since joining Bonneville 21 years ago, Andy has been a day-ahead scheduler, day-ahead lead subject
Technical Session Meeting Book - Technical Session - Power Markets in the West
1

Technical Session—Power Market Expansion in the West
2
matter expert, and day-ahead scheduling supervisor before moving to his current role. Mr. Meyers holds a Bachelor of Arts in history from the University of Portland and an Master of Business Administration from Willamette University.
Bruce Rew, Senior Vice President of Operations, SPP
Bruce Rew is Senior Vice President of Operations for Southwest Power Pool, Inc., located in Little Rock, Arkansas. He is responsible for SPP’s real-time reliability and market operations. These responsibilities include the Balancing Authority, day-ahead, and real-time markets, market design, and analysis support of all reliability functions. Recently Mr. Rew has been working on SPP’s expansion in the Western Interconnection. He started his 30-year career with SPP in the planning area and has served in various engineering and management positions. Before SPP, Mr. Rew served in the United States Air Force on a nuclear missile launch crew.
Mr. Rew received a Bachelor of Science in electrical engineering from Louisiana Tech University in 1990 and a Master of Science in operations management from the University of Arkansas in 1992. He is also a graduate of Harvard Business School’s Advanced Management Program. He serves on the engineering advisory boards with the University of Arkansas at Little Rock and the University of Oklahoma. He is a registered Professional Engineer in Arkansas.
Mark Rothleder, Senior Vice President and COO, CAISO
Mark Rothleder is the Senior Vice President and Chief Operating Officer at the California Independent System Operator, leading a cross-functional team including policy, planning, operations, and technology. Before his current position, he served as the Vice President of Market Policy and Performance. Mr. Rothleder’s previous positions included Executive Director of Market Analysis and Development, and Principal Market Developer and Director of Market Operations. As a member of the original ISO start-up team in 1997, he is now the longest serving ISO employee.
In spring 2009, Mr. Rothleder led a multifunctional team in designing and implementing market rules and software modifications related to the ISO’s Market Redesign and Technology Upgrade (MRTU). Since joining the ISO 23 years ago, Mark has worked extensively on implementing and integrating the approved market rules for California’s competitive wholesale energy and reserves markets.
Mr. Rothleder is a registered Professional Electrical Engineer in the state of California and holds a Bachelor of Science in electrical engineering from the California State University, Sacramento. He has taken post-graduate coursework in Power System Engineering from Santa Clara University and earned an Master of Science in information systems from the University of Phoenix. Before joining the ISO, Mr. Rothleder worked for eight years in the electric transmission department of Pacific Gas and Electric Company, where his responsibilities included operations engineering, and transmission planning and substation design.
Technical Session Meeting Book - Technical Session - Power Markets in the West
2

Power Market Primer
May 2021
Technical Session Meeting Book - Technical Session - Power Markets in the West
3

Power Market Primer
2
Introduction
Power markets are expanding in the Western Interconnection. This paper addresses how power markets function and the current state of power markets in the U.S. portion of the Western Interconnection.1 The paper focuses on the California Independent System Operator (CAISO) and the Southwest Power Pool (SPP), two markets that are offering balancing services to entities in the West. This paper also discusses bilateral trading, an informal trading process used throughout the interconnection by both market and non-market participants.
1. Energy Market Fundamentals
Electric energy is the generation or use of electric power over a specified time, usually expressed in gigawatt-hours (GWh), megawatt-hours (MWh), or kilowatt-hours (kWh). An electric energy market is a system for purchasing and selling electric energy using supply and demand to set the price. It is part of an electricity market and is coordinated by an Independent System Operator (ISO) or a Regional Transmission Organization (RTO). The energy market is used in a restructured electric industry in which the vertically integrated utility is replaced by independent power producers, which provide electric power generating facilities and services, and transmission owners and operators, which provide power transmission and distribution lines and services to create more efficient energy production.
An energy market is different than any other economic market in a few ways. First, it is difficult and expensive to store electrical energy in large quantities.2 Because supply must always match demand, energy must be produced in real time to meet changing demand. Second, electric energy cannot be labeled or traced from sources (generation) or sinks (load). Once energy is produced, it cannot be distinguished by the way it was produced, for example by a coal power plant or a renewable power plant. Third, power flows cannot be controlled by contracts because, using the laws of physics, power flows follow the path of least resistance. These differences make an energy market challenging to operate.
An energy market can have one of three architectures:
∑ Poolco model—A spot market in which generating companies compete for the right to supply energy and consumers compete for the right to consume energy. In the poolco model, supply
1 The Alberta Electric System Operator (AESO) runs a power market in Alberta, Canada. However, the AESO market is not addressed in this paper.
2 Energy storage continues to become more economical and is expected to become a large energy resource in the future.
Technical Session Meeting Book - Technical Session - Power Markets in the West
4

Power Market Primer
3
and consumption go directly to and from the grid, instead of to a specific consumer and from a specific generating company.
∑ Bilateral contract model—Trading contracts between a specific generating company (a seller) and a consumer (a buyer) without going through a spot market.
∑ Hybrid model—A combination of the poolco model and the bilateral contracts.
Today’s markets are mostly hybrid models in which an ISO/RTO coordinates the spot market and actsas a clearinghouse for the bilateral contracts.
1.1. Market Clearing
The energy market is a two-sided auction model. Generating companies submit offers to supply certain amounts of electrical energy at certain prices while the consumers submit bids to consume certain amounts of electrical energy at certain prices. The ISO/RTO aggregates the offers in a supply curve and the bids in a demand curve. The intersection of the aggregated supply and demand curves represents the Market Clearing Price (MCP) and the Market Clearing Quantity (MCQ). If the generating company’s offer is lower than the MCP, it will “clear the market” and be committed in the market. Similarly, if a consumer’s bid is lower than the MCP, it will “clear the market” and will be accepted. The ISO/RTO tells the generating companies how much energy they sold and how much they should generate. The ISO/RTO also tells consumers how much energy they purchased and how much they may draw from the grid. The market clearing mechanism can be shown using an example with two generating companies and two consumers. Transmission can complicate the calculation, so it is excluded from this simplified example.
Example 1—Market Clearing: An ISO/RTO receives the offers and bids for a particular hour from two producers (Figure 1) and two consumers (Figure 2). Gen Company 1 offers 200 MWh at $10/MWh, an additional 50 MWh at $25/MWh, an additional 50 MWh at $40/MWh, and an additional 50 MWh at $60/MWh. Gen Company 2 offers 150 MWh at $15/MWh, an additional 100 MWh at $20/MWh, and an additional 50 MWh at $50/MWh.
Figure 1: Generating company bids
Gen Company 1 Gen Company 2
Price [$/MWh] Quantity [MWh] Price [$/MWh] Quantity [MWh]
10 200 15 15025 50 20 10040 50 50 5060 50
Similarly, Consumer 1 bids 50 MWh at $60/MWh, an additional 50 MWh at $50/MWh, and an additional 100 MWh at $30/MWh. Consumer 2 bids 50 MWh at $80/MWh, an additional 75 MWh at $70/MWh, an additional 150 MWh at $40/MWh, and an additional 200 MWh at $20/MWh.
Technical Session Meeting Book - Technical Session - Power Markets in the West
5

Power Market Primer
4
Figure 2: Consumer offers
Gen Company 1 Gen Company 2
Price [$/MWh] Quantity [MWh] Price [$/MWh] Quantity [MWh]
60 50 80 5050 50 70 7530 100 40 150
20 200
To clear the market, the ISO/RTO determines the aggregated supply and demand curves by stacking the offers and bids into one supply curve and one demand curve (Figure 3).
Figure 3: Aggregated supply and demand curves
Aggregated Supply Aggregated Demand
Price [$/MWh] Quantity [MWh] Gen Company Price [$/MWh] Quantity [MWh] Consumer
10 0-200 1 80 0-50 215 200-350 2 70 50-125 220 350-450 2 60 125-175 125 450-500 1 50 175-225 140 500-550 1 40 225-375 250 550-600 2 30 375-475 160 600-650 1 20 475-675 2
The supply and demand curves are shown in Figure 4. The intersection of these two curves represents the MCP and the MCQ. Offers and bids shown to the left of the MCQ clear the market and will be accepted.
Figure 4: Market clearing price and quantity
Technical Session Meeting Book - Technical Session - Power Markets in the West
6

Power Market Primer
5
In this example, the MCP is $25/MWh and the total energy traded is 475 MWh. Gen Company 1 sells 225 MWh to the grid and receives $5,625 for the transaction. Gen Company 2 sells 250 MWh and collects $6,250. Consumer 1 draws 200 MWh from the grid and pays $5,000, while Consumer 2 draws275 MWh and pays $6,875. The total revenue is equal to the total expenses.
The ISO/RTO dispatches generators in merit order, from the least expensive to the most expensive offers, until supply equals demand. However, sometimes generation and demand are in areas that are dependent on transmission to supply the least cost generation. In this scenario, it may not be possible to dispatch generation in merit order due to limitations or constraints on the transmission system. In this case, more expensive generators that have no transmission system limits may be dispatched in place of the less expensive units resulting in out-of-merit dispatch.
1.2. Locational Marginal Price
Locational Marginal Price (LMP) is a pricing mechanism used by an ISO/RTO to price energy purchases and sales. The LMP comprises three elements: energy, transmission congestion, and transmission line losses. It is defined as the cost to serve the next MWh of load at a specific location. The market clearing process, in which supply equals demand, is used to determine the energy part of the LMP and is the same price for all locations in the market. Transmission congestion is the price difference between pricing locations and is based on actual (physical) energy flows in the ISO/RTO. If the transmission lines are unconstrained, and energy can flow between locations, there is no transmission congestion and the congestion component is priced at $0. If congestion exists, the transmission congestion component of the LMP is the difference between the local resource dispatched to meet demand and the energy component of the LMP.
Example 2 shows the congestion component of LMP pricing.
Example 2—Locational Marginal Price without Congestion: An ISO/RTO receives the offers and bids from two generators and two consumers, shown in Figure 5. Generator 1 and Consumer 1 are located in Area 1, and Generator 2 and Consumer 2 are located in Area 2. Areas 1 and 2 are connected through a transmission line with a flow limit of 500 MW. Generator 1 offers 500 MWh at $25/MWh and Generator 2 offers 250 MWh at $35/MWh. Both Consumer 1 and Consumer 2 are “price takers” and are willing to buy power at any price. Consumer 1 wants to buy 200 MWh and Consumer 2 wants 275 MWh. Using the same approach as Example 1, the ISO/RTO determines the MCP to be $25/MWh ($25 for energy and $0 for congestion) for 475 MWh.
Technical Session Meeting Book - Technical Session - Power Markets in the West
7

Power Market Primer
6
Figure 5: Simple electric energy system without congestion
Generator 1 meets all demand through the generation of 475 MWh and is paid $25/MWh. Energy from Generator 2 was not needed and was not required to run. Consumer 1 draws 200 MWh from the grid and pays $25/MWh and Consumer 2 pays the same price and draws the 275 MWh it bought. The flow limit on the transmission line is 500 MW and 275 MW was able to flow to meet demand in Area 2. As there was no congestion on the system, the LMP is the same for both areas, and the payments to the generator ($11,875) are equal to the consumers’ payments ($11,875).
Example 3—Locational Marginal Price with Congestion: Using the same supply and demand assumptions presented in the case above but reducing the transmission limit from 500 MW to 250 MW,Figure 6 shows the effects of congestion on the LMP. The transmission line is now fully loaded at 250 MW and more resources that are not using the transmission system must be dispatched to supply all demand. To calculate the LMP in each Area, the price of the next MWh of supply is determined. Area 1 has 500 MWh of energy of which 450 MWh are committed to serve load (200 MWh in Area 1 and 250 MWh transferred to Area 2). So, the LMP for Area 1 is $25/MWh ($25 energy and $0 congestion) as local generation can serve the next MWh of demand. However, the transmission limit between Area 1 and Area 2 has been reached and the next MWh of demand in Area 2 cannot be served by Area 1 generation, even though more generation is available in Area 1. The LMP in Area 2 is set at $35/MWh ($25 energy and $10 congestion) as generation in Area 2 is needed to serve the next MWh of demand. The marginal production cost is different in each area with the LMP for Area 1 set at $25/MWh and LMP for Area 2 set at $35/MWh.
Technical Session Meeting Book - Technical Session - Power Markets in the West
8

Power Market Primer
7
Figure 6: Simple electric energy system with congestion
Generator 1 produces 450 MWh and is paid $25/MWh. Generator 2 produces 25 MWh and is paid $35/MWh. Consumer 1 buys 200 MWh at $25/MWh and Consumer 2 buys 275 MWh at $35/MWh. In a bilateral market, Consumer 2 would buy 250 MWh at $25/MWh and 25 MWh at $35/MWh; however, in an organized market, Consumer 2 buys all 275 MWh at $35/MWh, the LMP for Area 2. The generators’ total revenue ($12,125) is not equal to the consumers’ total payment ($14,625) because congestionlimited the use of cheaper generating resources. In this case, the consumers pay more than the generating units receive. The excess is the congestion cost. The congestion costs are collected by the market operator and are paid to holders of Financial Transmission Rights (FTR) or Congestion Revenue Rights (CRR) as a compensation for transmission congestion charges that arise when the transmission grid is congested.
1.3. Congestion Cost
The congestion costs are roughly equal to a difference in LMP prices across the transmission line multiplied by the transferred amount. In Example 2, the LMP in Area 1 is $25 ($25 energy, $0 congestion), while the LMP for Area 2 is $35 ($25 energy, $10 congestion [$35/MWh, Area 2 energy price, less $25/MWh, Area 1 energy price]). The energy component is set at $25 because there was enough generation offered from Generator 1 to cover all demand, but transmission congestion limited the ability to deliver to Area 2.
1.4. Time Frames of Energy Markets
Different ISOs/RTOs in the United States coordinate energy markets over different time frames. Energy markets can be day-ahead or real-time, depending on when the operating hours occur. The illustrated procedure for the market clearing and locational price is applicable to each market. However, some markets have other decisions that should be made and can influence the generation dispatch. Forexample, in a day-ahead market, generating units are committed and dispatched based on several factors including marginal fuel cost and technical constraints—like start-up and shut-down costs, and
Technical Session Meeting Book - Technical Session - Power Markets in the West
9

Power Market Primer
8
physical constraints—like ramping rates and capability, minimum runs or down times, or available water for hydro units.
2. Bilateral Trading in the Western Interconnection
Bilateral trading in the Western Interconnection happens across various time horizons and at several trading hubs. Bilateral activity also encompasses a variety of different energy and capacity products. To understand bilateral trading in the West, it is best to examine the different time horizons in which traders transact.
2.1. Forward and Physical Transactions
Forward transactions are those for the next month or beyond. They can include monthly, quarterly, yearly, or a combination of these durations. Forward transactions can often be separated into two categories: Physicals and Financials.
Physicals are a bilateral transaction for the physical delivery of power at an agreed upon point of delivery for a specific duration at an agreed upon price. These points of delivery can consist of an adjacent and neighboring Balancing Authority Area (BAA) or a specific trading hub in the interconnection. Physical bilateral transactions involve generating and transmitting power, and the buyer and seller typically negotiate where the power will be delivered by the seller and picked up by the buyer as a term of the transactions. With the transmission of power, it is necessary to own or acquire the rights to flow power across high-voltage transmission lines. In many bilateral transactions the seller is responsible for delivering the power to the buyer at the agreed upon point of delivery, but different arrangements can be made by mutual agreement between the parties. With physical transactions, traders typically include their opportunity/fuel cost along with the cost of transmission to deliver the power.
Physical trades can be done for several different products, the most common being an energy transaction. However, capacity transactions are also common and help provide reserves or demonstrate resource adequacy on a forward basis as well.
Financials are a bilateral transaction for financial settlement between a buyer and seller at an agreed upon trading hub and price. Financial transactions are typically done through an exchange like the Inter-Continental Exchange (ICE). The settlement of these financial transactions is tied to a market index such as ICE or Powerdex. These contracts are settled on a daily basis as the index moves up or down. These financial transactions give traders and utilities a way to hedge the risk and uncertainty inherent in their trading books.
As we transition from forward transactions, the next trading time horizon consists of balance-of-month (BOM) and day-ahead (DA) transactions. BOM transactions are executed for the rest of the current
Technical Session Meeting Book - Technical Session - Power Markets in the West
10

Power Market Primer
9
month or a subset of the remaining part of the month. BOM transactions can be done directly as bilateral transactions or through a broker or exchange.
DA operations are aimed at setting up each BAA and the grid for reliable operations as we approach real time. Planners’ and traders’ day-ahead activities are affected by weather, fuel supply, and anticipated load/demand. DA transactions are not simply traded for the next calendar day, but are traded according to the WECC Preschedule Calendar3 for the next preschedule day.
WECC Preschedule Calendar—This document identifies a normal scheduling week, all scheduling and trading holidays, and scheduling around new months.
The trading exchanges incorporate this calendar upon its release each year
Figure 7: WECC Preschedule Calendar example
Normal Week—No Holiday Sample Holiday Week—Thanksgiving Week
Business Day Scheduling Day Business Day Scheduling Day
Monday Tuesday Monday Tues. and Wed.
Tuesday Wednesday Tuesday Thur. and Fri.
Wednesday Thursday Wednesday Sat. and Sun.
Thursday Fri. and Sat. Thursday -
Friday Sun. and Mon. Friday -
DA transactions can be traded bilaterally (i.e., counterparties directly contact each other) or through an exchange. The ICE serves as the primary DA exchange. DA transactions can consist of energy or capacity.
Exiting the BOM and DA time horizons, we transition to real time. The most trading transactions have been completed leading up to real time. Real-time trading is driven by; 1) any remaining Preschedule trading position that was not achieved or uncovered, or 2) fluctuations in load/demand caused by changing weather forecasts or other operational conditions (e.g., generation or transmission outage). While many people may identify real time as the actual hour or minute being experienced, real-time trading and scheduling is actually for the next hour. Scheduling and trading in real time begins at the close of Preschedule (which happens at 3:00 p.m. each business day for the next calendar day). Some entities will allow new transactions immediately following preschedule, while some require entities to wait until 6:00 p.m. of the Preschedule day. Real-time transactions can be for an hour or for a quarter of an hour. All real-time transactions must be completed no later than 20 minutes before the start of flow
3 The WECC Preschedule Calendar is created and maintained by the Interchange Scheduling and Accounting Subcommittee (ISAS).
Technical Session Meeting Book - Technical Session - Power Markets in the West
11

Power Market Primer
10
of the transaction. While most DA transactions may be done at trading hubs across the interconnection, real-time transactions tend to be done at an adjacent Balancing Authority (BA) interchange.
2.2. Trading Hubs in the Western Interconnection
The following are commonly used organized trading locations or trading hubs located throughout the Western Interconnection.
1. Mid-Columbia (Mid-C)—Located near Wenatchee, Washington, and often calledthe “100 Mile Bus.” Three local utilities are in the Mid-C region:
1. Grant County PUD,2. Douglas County PUD, and3. Chelan County PUD.
Many more utilities have a presence at Mid-C by owning portions of the generation projects or through ownership of transmission lines or substations.
2. California-Oregon Border (COB)—Located near the California-Oregon border. Comprises the AC Intertie line, specifically Malin and Captain Jack substations.
1. Line Rating = N-S 4,800 MW and S-N 3,675 MW.
Facilitates the delivery of power between the Pacific Northwest and California.
3. Nevada-Oregon Border (NOB)—Located near the Nevada-Oregon border. Comprises the Pacific DC Intertie line that runs from the Dalles, Oregon, to Los Angeles.
1. Line Rating = N-S 3,220 MW and S-N 3,100 MW.
Facilitates the delivery of power between the Pacific Northwest and California.
4. 4 Corners—Located near the intersection of state boundaries of Arizona, New Mexico, Utah, and Colorado. Desert Southwest Trading Hub.
5. Mona Located south of Salt Lake City, Utah.
6. Mead—Located near Hoover Dam. Also serves as an injection point into the CAISO system.
7. Palo Verde—Nuclear facility located west of Phoenix, Arizona.
8. John Day—Located in John Day, Oregon, this is the head of the Southern AC Intertie.
Figure 8: Western Interconnection trading hubs
Technical Session Meeting Book - Technical Session - Power Markets in the West
12
Power Market Primer
11
9. Big Eddy—Located in The Dalles, Oregon, this is the head of the Southern DC Intertie.
3. History and Geography of California ISO
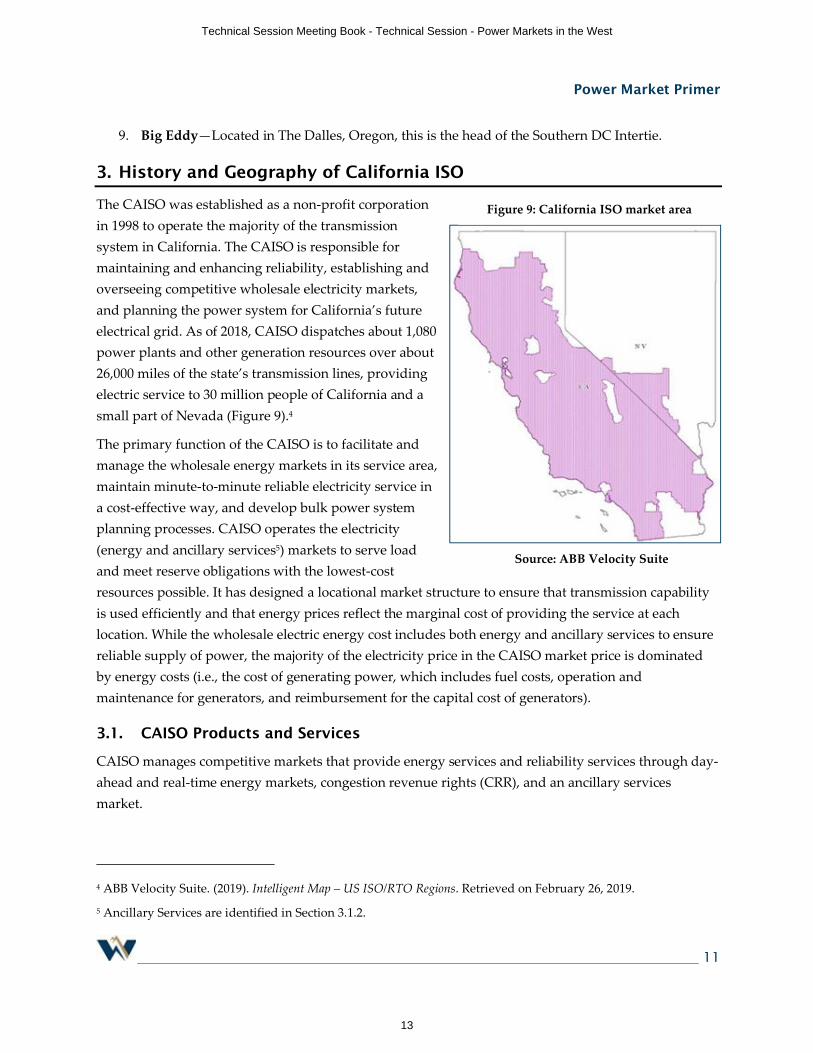
The CAISO was established as a non-profit corporation in 1998 to operate the majority of the transmission system in California. The CAISO is responsible for maintaining and enhancing reliability, establishing and overseeing competitive wholesale electricity markets, and planning the power system for California’s future electrical grid. As of 2018, CAISO dispatches about 1,080 power plants and other generation resources over about 26,000 miles of the state’s transmission lines, providing electric service to 30 million people of California and a small part of Nevada (Figure 9).4
The primary function of the CAISO is to facilitate and manage the wholesale energy markets in its service area, maintain minute-to-minute reliable electricity service in a cost-effective way, and develop bulk power system planning processes. CAISO operates the electricity (energy and ancillary services5) markets to serve load and meet reserve obligations with the lowest-cost resources possible. It has designed a locational market structure to ensure that transmission capability is used efficiently and that energy prices reflect the marginal cost of providing the service at each location. While the wholesale electric energy cost includes both energy and ancillary services to ensure reliable supply of power, the majority of the electricity price in the CAISO market price is dominated by energy costs (i.e., the cost of generating power, which includes fuel costs, operation and maintenance for generators, and reimbursement for the capital cost of generators).
3.1. CAISO Products and Services
CAISO manages competitive markets that provide energy services and reliability services through day-ahead and real-time energy markets, congestion revenue rights (CRR), and an ancillary services market.
4 ABB Velocity Suite. (2019). Intelligent Map – US ISO/RTO Regions. Retrieved on February 26, 2019.
5 Ancillary Services are identified in Section 3.1.2.
Figure 9: California ISO market area
Source: ABB Velocity Suite
Technical Session Meeting Book - Technical Session - Power Markets in the West
13

Power Market Primer
12
3.1.1. CAISO Energy Markets
The CAISO’s main role as an ISO is to coordinate an energy market throughout the BAA. These services consist of facilitating the continuous buying, selling, and delivering of wholesale electricity, providing dispatch instructions to generators, and acting as a data clearinghouse for market participants. The CAISO manages two markets, a day-ahead market and a real-time market for power delivery. In each market the CAISO “clears the market,” i.e., identifying which generators will operate, at what time and quantity, and at what price to meet electricity demand. The price of electricity is based on serving the next MW of demand at a specific location throughout the California BAA. This method of calculating electricity price is called Locational Marginal Pricing (LMP).
The Day-Ahead Market is made up of three market processes that run sequentially: the Market Power Mitigation test, the Integrated Forward Market (IFM), and the Residual Unit Commitment (RUC). Results of the day-ahead market are published at 1:00 p.m.
∑ The ISO runs a local Market Power Mitigation test to determine whether generating units have market power. Market power is the ability of a supplier to artificially raise market clearing prices above marginal cost by physically or economically withholding supply from the market. If the resource is determined to have market power and could affect the market results, the resource bid is mitigated and replaced by a predetermined bid.
∑ Next the Integrated Forward Market runs to establish which generating unit will be dispatched and at what level the units will run to meet forecasted demand.
∑ Finally, the RUC process is run to co-optimize energy and ancillary services and to designate additional power plants that may be needed for the next day and must be ready to generate electricity.
A major part of the market is the Full Network Model (FNM), which represents all generation and transmission in the BAA. The FNM is used to analyze the active transmission and generation resources to find the least cost energy to serve demand. The model generates prices that reflect the cost of producing and delivering energy from individual nodes, or locations on the grid, where transmission lines and generation interconnect.
The Real-Time Market is a spot market in which utilities can buy power to balance the last few increments of demand not covered in their day-ahead schedules. It is also the market that secures energy reserves, held ready and available for ISO use if needed, and the energy needed to regulate transmission line stability.
The Real-Time Market opens at 1:00 p.m., before the trading day, and closes 75 minutes before the start of the trading hour. The results of the Real-Time Market are published about 45 minutes prior to the start of the trading hour. The Real-Time Market system dispatches power plants every 15 and 5 minutes, although under certain grid conditions the ISO can dispatch for a single, 1-minute interval.
Technical Session Meeting Book - Technical Session - Power Markets in the West
14

Power Market Primer
13
3.1.2. Ancillary Services Market
Ancillary services are energy products used to help maintain grid stability and reliability. There are four types of ancillary services products: regulation up, regulation down, spinning reserve, and non-spinning reserve.
Regulation energy—regulation up and regulation down—is used to control system frequency, which must be maintained very narrowly around 60 hertz, and varies as generators change their energy output. Resources providing regulation are certified by the ISO and must respond to automatic control signals to increase or decrease their operating levels depending on the need.
Spinning reserve is standby capacity from generation units already connected to or synchronized withthe grid and that can deliver their energy in 10 minutes when dispatched.
Non-spinning reserve is capacity that can be started up, synchronized with the grid, and ramped to a specified load within 10 minutes.
3.1.3. Congestion Revenue Right
These are financial instruments used to offset congestion costs that occur in the day-ahead market process. CRRs are made available through allocation, auction, and bilateral trades. They are settled based on the marginal cost of congestion. A revenue rights obligation pays its holder when congestion is in the same direction as the obligation. It charges the holder if congestion is in the opposite direction. The reverse is true for CRR options.
3.1.4. Transmission Planning
The CAISO is responsible for maintaining the operations and reliability of the grid in its service area and, as such, conducts periodic reviews of grid adequacy. It conducts an annual transmission planning process to identify necessary grid expansions. In addition, it provides support to generation interconnection.
3.1.5. Capacity Market
The CAISO does not have a centralized capacity market. It relies on a resource adequacy program established by the California Public Utilities Commission to provide sufficient generation capacity. Load-serving entities are responsible for contracting for capacity services above the anticipated demand in their service area for each month. This process is conducted annually for the upcoming year.
3.1.6. Outage Management
Outages happen on the power grid for transmission lines or generation resources due to maintenance, repair, testing, or construction. The CAISO ensures accurate and complete outage scheduling and coordinates these outages to maintain reliable operation.
Technical Session Meeting Book - Technical Session - Power Markets in the West
15

Power Market Primer
14
The CAISO requires schedule coordinators of generation resources to submit outage information to the outage management system as early as possible so the ISO can better plan for meeting loads with available resources. If a generation resource outage card is submitted more than seven days before the schedule outages, it will be categorized as a Planned Outage, otherwise it is considered a ForcedOutage.
Transmission Outage is an outage on transmission or equipment like lines, breakers, relays, or protection schemes that affects the energy from the generation resource to be delivered to meet load. The transmission outage can cause generation resources to be limited or unavailable to serve load. When Transmission Outages happen, transmission-induced outage cards are submitted to the outage management system and any affected generation is considered unavailable to serve load.
3.2. Western Energy Imbalance Market
In 2014, CAISO launched the Western Energy Imbalance Market (EIM), a voluntarily real-time market, to enable entities that were not in CAISO’s area to take advantage of centralized market services. The CAISO uses the same tools and procedures to run the EIM market that it uses in the CAISO markets. Participation in the EIM appears to have contributed to enhanced grid reliability, decreased energy costs, and improved integration of renewable energy, while producing a cleaner, greener grid.
EIM participants include the CAISO, PacifiCorp (entered 2014), NV Energy (2015), Arizona Public Service (2016), Puget Sound (2016), Portland General Electric (2017), Powerex (2018), Idaho Power Company (2018), BANC Phase I (2019), Salt River Project (2020), Seattle City Light (2020), Los Angeles Department of Water and Power (2021), Turlock Irrigation District (2021), Public Service Company of New Mexico (2021), BANC Phase II (2021), and Western Area Power Administration—Sierra Nevada Region (2021). Future participants include Northwestern Energy (2021), Tucson Electric Power, Avista, Tacoma Power, Bonneville Power Administration, and Excel Energy (Colorado) (2022), with Avangrid and El Paso Electric planning to join in 2023. Existing and pending participants are shown in Figure 10.
Figure 10: Western EIM active and pending participants
Technical Session Meeting Book - Technical Session - Power Markets in the West
16
Power Market Primer
15
3.3. CAISO Generation Profile
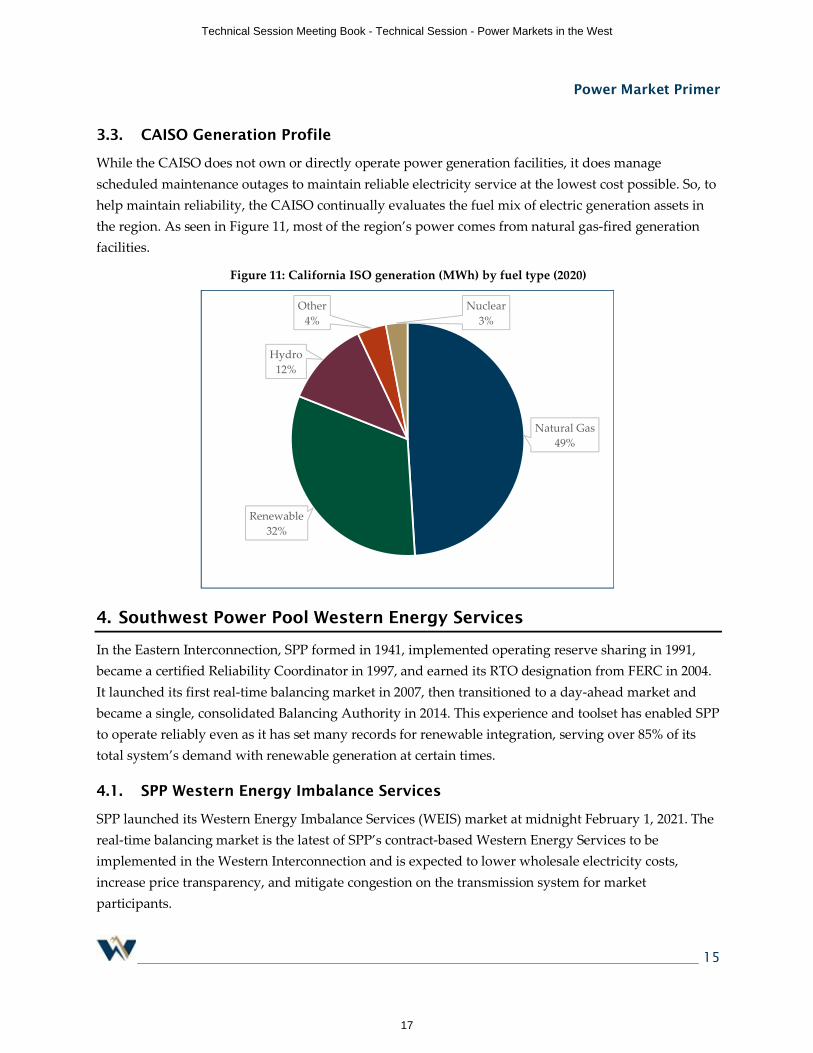
While the CAISO does not own or directly operate power generation facilities, it does manage scheduled maintenance outages to maintain reliable electricity service at the lowest cost possible. So, to help maintain reliability, the CAISO continually evaluates the fuel mix of electric generation assets in the region. As seen in Figure 11, most of the region’s power comes from natural gas-fired generation facilities.
Figure 11: California ISO generation (MWh) by fuel type (2020)
4. Southwest Power Pool Western Energy Services
In the Eastern Interconnection, SPP formed in 1941, implemented operating reserve sharing in 1991, became a certified Reliability Coordinator in 1997, and earned its RTO designation from FERC in 2004. It launched its first real-time balancing market in 2007, then transitioned to a day-ahead market and became a single, consolidated Balancing Authority in 2014. This experience and toolset has enabled SPP to operate reliably even as it has set many records for renewable integration, serving over 85% of its total system’s demand with renewable generation at certain times.
4.1. SPP Western Energy Imbalance Services
SPP launched its Western Energy Imbalance Services (WEIS) market at midnight February 1, 2021. The real-time balancing market is the latest of SPP’s contract-based Western Energy Services to be implemented in the Western Interconnection and is expected to lower wholesale electricity costs, increase price transparency, and mitigate congestion on the transmission system for market participants.
Natural Gas49%
Renewable32%
Hydro12%
Other4%
Nuclear3%
Technical Session Meeting Book - Technical Session - Power Markets in the West
17

Power Market Primer
16
Several regional utilities are taking part in the market, including Basin Electric Power Cooperative, Deseret Power Electric Cooperative, the Municipal Energy Agency of Nebraska (MEAN), Tri-State Generation and Transmission Association, the Western Area Power Administration (WAPA), and the Wyoming Municipal Power Agency. WAPA’s agreement includes the firm electric service loads and resources of Pick-Sloan Missouri Basin Program—Eastern Division in the Upper Great Plains Western Area Balancing Authority (WAUW) footprint, and the Loveland Area Projects and Salt Lake City Area Integrated Projects in the Western Area Colorado Missouri Balancing Authority (WACM) footprint.
As the WEIS market’s administrator, SPP supports the reliability of the region’s transmission system and meets demand with the most cost-effective generation available, reducing wholesale electricity costs for participants. Like SPP’s previous imbalance market, the WEIS provides price transparency of wholesale energy, allows parties to trade bilaterally, and hedges against costly transmission congestion.
Figure 12: WEIS Market LMP averaged $19.48 for March 2021
4.2. SPP Regional Transmission Organization
SPP RTO holds the record for the highest one-hour and point-in-time wind penetration (84.0% on May 8, 2021) ever recorded by the Energy Information Administration. It recently set an SPP wind peak record of 21,133 MW on March 29 and was the first RTO to see wind as its main fuel source in 2020. SPP’s existing markets and other services, like transmission planning and Balancing Authority administration, have been credited with helping the SPP RTO achieve such a high degree of reliable wind integration.
Looking ahead, all of the WEIS participants have signed letters for evaluating full RTO membership. The companies’ letters indicate their desire to work with SPP to evaluate the terms, costs, and benefits
Technical Session Meeting Book - Technical Session - Power Markets in the West
18

Power Market Primer
17
of putting western facilities under the RTO’s tariff. A 2020 SPP Brattle study6 found RTO membership could produce an annual savings of $49 million for SPP and western entities. If Basin Electric Power Cooperative, MEAN, Tri-State Generation and Transmission Association, and WAPA commit to membership in SPP, SPP will extend the reach and value of its services and the benefits they provide when bundled under the RTO structure.
4.3. Additional Western Market Services
The real-time imbalance market is one of many services SPP offers to western utilities under its Western Energy Services. In 2018, SPP became the administrator of the Western Interconnection Unscheduled Flow Mitigation Plan. In 2019, SPP launched its Western Reliability Coordination service, through which it ensures the reliability of the bulk electric system in the West on behalf of 12 entities across seven states. In 2020, SPP was hired by entities in the Northwest Power Pool to be the program developer for its regional Resource Adequacy Program.
Basin Electric, MEAN, Tri-State, and WAPA’s UGP-East Region are already members of SPP, having joined the RTO in 2015 when they placed their respective facilities in the Eastern Interconnection under SPP’s tariff. Along with Deseret, each is also a customer of at least one of SPP’s contract-based Western Energy Services.
Figure 13: WEIS Generation Profile
6 Western Energy Imbalance Service and SPP Western RTO Participation Benefits
Technical Session Meeting Book - Technical Session - Power Markets in the West
19

Power Market Primer
18
Contributors
Recognizing that access to stakeholder subject matter expertise is critical to WECC’s ability to fulfill its reliability and security responsibilities, WECC wants to thank the following people and organizations for the hard work and time they invested in this project:
Andy Meyers, BPA; Philip Bruich, SPP; and the National Energy Technology Laboratory (NETL).
Technical Session Meeting Book - Technical Session - Power Markets in the West
20

Bilateral Trading in WECCAndy Meyers
Bonneville Power Administration15th June 2021
WECC Board of Director’s Technical Session
Technical Session Meeting Book - Technical Session - Power Markets in the West
21

Bilateral Trading in WECC• ICE Bilateral Trading Hubs
• Mid-C – (Mid-Columbia)• COB – (California Oregon Border)• NOB – (Nevada Oregon Border)• NP15 – North Path 15 (CAISO Market)• SP15 – South Path 15 (CAISO Market)• 4 Corners – (AZ, NM, UT, CO)• Mona – (South of SLC)• Mead – (near Hoover Dam, CAISO Injection Point)• Palo Verde – (west of Phoenix)• Borah – (Interconnects Idaho & Pac East)• John Day – (John Day OR, head of AC Intertie)• BigEddy – (The Dalles OR, head of the DC intertie)
Reference - Power Asset Mapping - Google My Maps
Technical Session Meeting Book - Technical Session - Power Markets in the West
22
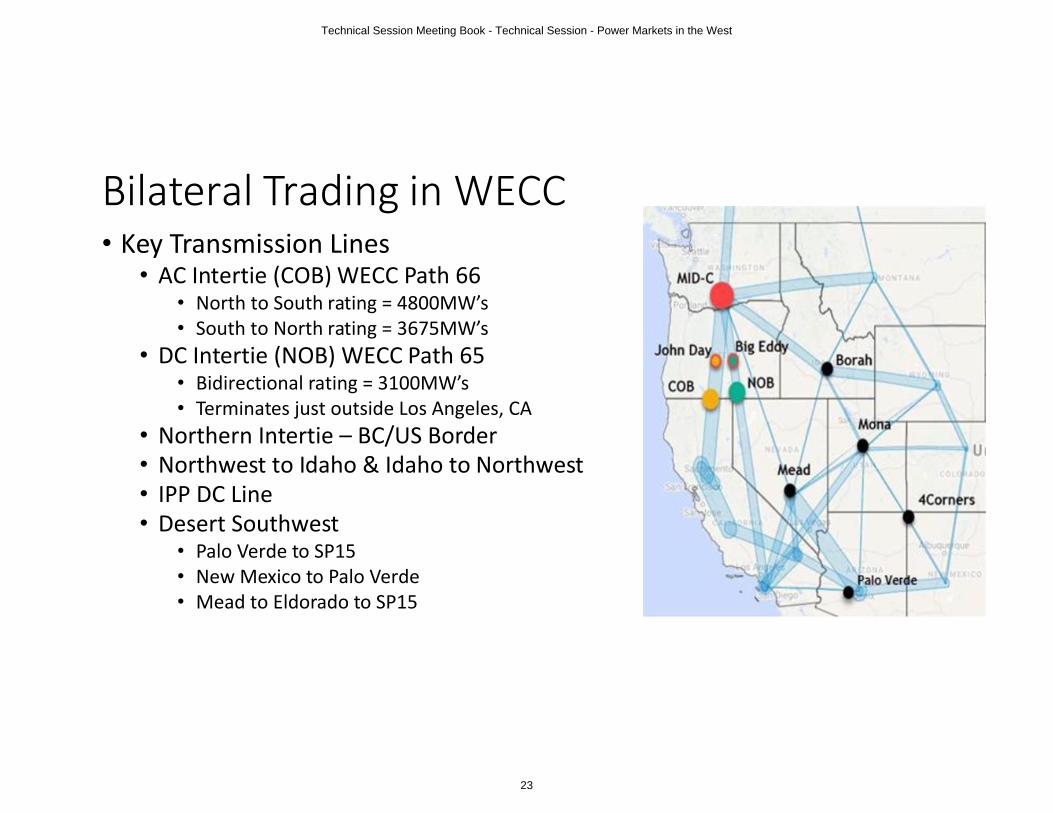
Bilateral Trading in WECC• Key Transmission Lines • AC Intertie (COB) WECC Path 66
• North to South rating = 4800MW’s • South to North rating = 3675MW’s
• DC Intertie (NOB) WECC Path 65• Bidirectional rating = 3100MW’s• Terminates just outside Los Angeles, CA
• Northern Intertie – BC/US Border• Northwest to Idaho & Idaho to Northwest• IPP DC Line • Desert Southwest
• Palo Verde to SP15• New Mexico to Palo Verde • Mead to Eldorado to SP15
Technical Session Meeting Book - Technical Session - Power Markets in the West
23

Bilateral Trading in WECC• Mid-C is the most transacted hub in WECC on ICE
• Annual Day Ahead ICE data is available in the appendix
• Many other entities have rights at Mid-C either from the purchase of generation or the from transmission access to the area• Other entities who don’t have a direct presence at Mid-C trade at this
hub with the intent of wheeling power in or out of the area• Transactions at Mid-C often sink somewhere else • Price spreads between Mid-C and other trading hubs can incentivize
merchants to move power between trading hubs• Counterparties can acquire OATT transmission on BAA‘s OASIS sites to wheel power
throughout the Interconnection
Technical Session Meeting Book - Technical Session - Power Markets in the West
24

Bilateral Trading in WECCForwards BOM/Daily Real Time
• DA activity follows WECC Preschedule Calendar• DA trading typically 5:30 AM to 9:00 AM• Companies trade physical transactions at a hub/adjacent BAA/or mutually agreed Point of Delivery
• Transmission portfolio holdings vary across companies but open access gives companies the ability to acquire transmission rights to support their marketing activity• Physical transactions are moved around the grid on a variety of transmission products and
product types (Firm & Non-Firm)• CAISO MRTU DA bids due at 10 AM & DA Market awards are issued around 1 pm
• MRTU market run is only for next day • Preschedule closes for one day at a time at 3 pm PPT each afternoon
• Some BAA’s allow RT transactions immediately after 3 pm while some don’t open until 6 pm of the Preschedule day
• Drivers• Weather• Load/Demand• Fuel Supply (Nat. Gas/Hydro/Coal/Renewable Forecasts) • Transmission Outages
Technical Session Meeting Book - Technical Session - Power Markets in the West
25

Bilateral Trading in WECCForwards BOM/Daily Real Time
• Real Time• Large amount of transactions are done in advance of Real Time• RT offer a chance for counterparties to update CAISO bidding• Scheduling Timelines & transactional volume (EIM vs Non EIM)
• Historical RT transactions up to T-20 each hour• EIM participants INC/DEC bids due T-75 and base schedules lock T-55
• EIM participants can still transact up to T-20 but there may be imbalance charges incurred as a result of transaction after T-55
• EIM & Non-EIM participants are on different bilateral trading timelines• Drivers
• Changes in Weather• Updates to Inventory• Changes in Load/Demand• Unplanned Transmission or Generation outages
Technical Session Meeting Book - Technical Session - Power Markets in the West
26

Bilateral Trading in WECC• Where have we been
• Mid-C continues to be the most liquid trading hub across the interconnection• Exchange bilateral activity appears to have declined over the last 10 years*• Mid-C has seen supply and price volatility over the last few years
• 2019 March 1st Cold Weather event saw a large short lived price spike• Fueled by natural gas supply limitations• Energy prices reached $1000 interconnection cap
• Spawned concern around Resource Adequacy…evolved into the NWPP RA effort• DSW has also seen price volatility trading in 2021 forward market and 2020 summer
time • Witnessed emergence of new trading products
• Addition of granular daily products (HE 17-22) instead of standard HLH/LLH blocks likely attributed to changing resource mix
• Sub Hourly transactions • Specified & Unspecified Transactions
• Specified – buyer and seller agree on specific source where resource carbon attributes are known• Unspecified – no stipulation on a resource and no known carbon attributes (could come from coal)
*Only includes exchange activity, no counterparty to counterparty data was available
Technical Session Meeting Book - Technical Session - Power Markets in the West
27

Bilateral Trading in WECC• Where are we going
• Summer 2021• Will extreme events impact grid reliability in portions or all of the interconnection?
• Numerous and different state RPS mandates are continuing to drive fossil fuel generation retirements• Further growth of Community Choice Aggregators (CCAs) as counterparties?
• WA has passed CETA and most recently a Cap and Trade program• Clean Energy Transformation Act (CETA) • Cap & Trade
• Evolution of trading products• Divergence of trading products (e.g. MID-C transactions priced with or without Carbon? )
• Could be necessitated by varying state laws & statutes• Will new types of block products begin to emerge?
• Shaped products have been added to ICE for segments of Hour to aid in renewable integration• Transition further away from trading traditional HLH or LLH blocks to shorter blocks of hours?
• Resource Adequacy • Will new products emerge to help support Resource Adequacy mandates? • What will demonstrating Resource Adequacy entail and on what time frame?
• Will a Regional Transmission Organization (RTO) emerge? What will this mean for bilateral trading?
Technical Session Meeting Book - Technical Session - Power Markets in the West
28

AppendixICE Day Ahead MWh/Day
Technical Session Meeting Book - Technical Session - Power Markets in the West
29

AppendixICE Day Ahead MWh/Day (w/o Mid-C)
Technical Session Meeting Book - Technical Session - Power Markets in the West
30

AppendixDay Ahead MWh/Month
Technical Session Meeting Book - Technical Session - Power Markets in the West
31

Day Ahead MWh/Month (w/o Mid-C)
Technical Session Meeting Book - Technical Session - Power Markets in the West
32

AppendixICE Day Ahead MWh/Day
Technical Session Meeting Book - Technical Session - Power Markets in the West
33

ICE Day Ahead MWh/Day (w/o Mid-C)
Technical Session Meeting Book - Technical Session - Power Markets in the West
34

1SouthwestPowerPool SPPorg southwest-power-pool
SOUTHWEST POWER POOL
BRUCE REW, PE
SENIOR VICE PRESIDENT, OPERATIONSJUNE 15, 2021
Technical Session Meeting Book - Technical Session - Power Markets in the West
35

2
WESTERN RELIABILITY COORDINATION SERVICESPP-provided RC service launched December 2019
CUSTOMERS• Arizona Electric Power Cooperative, Inc.• Black Hills Energy’s three electric utilities: Black
Hills Power, Inc., Cheyenne Light, Fuel and Power Company, and Black Hills Colorado Electric, Inc.
• City of Farmington, NM• Colorado Springs Utilities• El Paso Electric Company• Intermountain Rural Electric Association• Platte River Power Authority• Public Service Company of Colorado (Xcel
Energy)• Tri-State Generation and Transmission
Association• Tucson Electric Power• Western Area Power Administration (WAPA)
Desert Southwest Region, WAPA Rocky Mountain Region, and WAPA Upper Great Plains – West
• GridForce Energy Management
Technical Session Meeting Book - Technical Session - Power Markets in the West
36

• Basin Electric Cooperative• Tri-State G&T• Deseret• MEAN• WAPA - Upper Great Plains• WAPA - Rocky Mountain
Region• WAPA – Colorado River
Storage Project• Colorado Springs Utilities
WEIS Launched February 1, 2021
SPP West prospective members:
SPP Markets
Technical Session Meeting Book - Technical Session - Power Markets in the West
37

4
CURRENT: WESTERN ENERGY IMBALANCE SERVICE MARKET (WEIS)
• Energy Imbalance only market started on February 1, 2021
• Market provides for a 5-minute optimized dispatch
• WEIS market services performed under a contract with a four year commitment
• WEIS market operates separately from the SPP RTO Market
• Market maintains existing bilateral agreements and transmission service transactions
Technical Session Meeting Book - Technical Session - Power Markets in the West
38

5
FUTURE MARKETS: SPP RTO EXPANSION IN THE WESTERN INTERCONNECTION
• WEIS Participants investigating transitioning from WEIS to full RTO services
• Day-Ahead and Real-Time Markets• Single market with Western BAA and Eastern BAA• Regional Transmission Planning
• New member process evaluation nearing completion
• Prospective new Members will have until April 2022 to commit
• Transition to RTO projected to occur on March 1, 2024
Technical Session Meeting Book - Technical Session - Power Markets in the West
39

SPP REGION IN COLDEST PART OF U.S.
ERCOT
MISOPJM
NYISO
ISO-NE
CAISO
SPP
* Locations of ISOs/RTOs are approximate
Technical Session Meeting Book - Technical Session - Power Markets in the West
40

7
THE BIG PICTURE
Early prep helped
2/4: Issued cold weather alert
2/8: Issued resource alert
2/11: Committed long-lead
generation
Public appeals reduced demand
Demand dropped below forecast,
helping minimize interruptions
We used every MW we
could get
We ran every available
generator and imported energy from neighbors
Service interruptions
required
2/15~1.5% of system
demand for 57 min.
2/16Up to ~6.5% of
system demand for 3 hr. 23 min.
Collaboration reduced impact
Controlled, temporary
interruptions prevented
uncontrolled blackouts
U · è GRID
Ä^ÅÄ Ä
Technical Session Meeting Book - Technical Session - Power Markets in the West
41

MARKETS AND RELIABILITY
• Changing resource mix:• 2011: wind 6% of energy 2020: wind 31% and #1 fuel and growing• Wind forecasted to serve over 100% of energy in real-time
• Reliability and Markets• Market consolidated 17 BAA’s to one for improved operations• Wide-Area generation fleet enhances diversity• Markets identify value that resources bring, more than just energy• Transmission is the great enabler to enhance reliability and economics
Technical Session Meeting Book - Technical Session - Power Markets in the West
42

9*Real-time balancing market five-minute average
Jan. to Dec. 31, 2020
MINIMUM & MAXIMUM PERCENT OF GENERATION BY FUEL TYPE*
67.4
56.751.5
10.4 9.8
1.1
9.2 6.92.6
0.9
32.2 30.426.1
6.5 4.40
10
20
30
40
50
60
70
80
Wind Coal Gas Nuclear Hydro
Percent Average
Technical Session Meeting Book - Technical Session - Power Markets in the West
43

10SouthwestPowerPool SPPorg southwest-power-pool
QUESTIONS
BRUCE [email protected]
Technical Session Meeting Book - Technical Session - Power Markets in the West
44

ISO Public
Reliability Considerations of EvolvingMarket Structures
WECC Board Technical SessionJune 15, 2021
Technical Session Meeting Book - Technical Session - Power Markets in the West
45

ISO Public
Summer Reliability: Market Policy Enhancements
Page 2
• Incentives for hourly import offers during tight supply conditions and stronger price signals in emergency conditions
• Management of emergency DR through the market for more accurate pricing
Pricing and supply incentives
• Interim measure to hold RA storage resources to their day-ahead market schedules to meet reliability needs across critical evening peak hours on tightest supply days
Battery state of charge
• Include uncertainty amount in EIM resource sufficiency test to sufficient bids to meet its net load, including net load uncertainty
• Modeling of energy interchange schedules to ensure balanced resources and interchange schedules
EIM sufficiency tests
• Enhanced outage substitution procedures to ensure RA planned outages are substituted upfront
Outage substitution
• Equilibrate market scheduling priorities for exports backed by designated non-RA capacity and higher priority wheels to ISO native load
• New rules for designating non-resource adequacy
Exports and wheeling priorities
Technical Session Meeting Book - Technical Session - Power Markets in the West
46

ISO Public
Changing fundamentals
• Increased resource retirement is causing demand to seek supply from wider regional footprint
• Competition for generating and transmission capacity increasing
• Seasonal diversity decreasing as previously winter peaking areas are becoming summer peaking or areas are becoming both winter and summer peaking
• Extreme weather conditions increasing in intensity and frequency
• Increased reliance on variable resources versus firm or dispatchable resources
Page 3
Technical Session Meeting Book - Technical Session - Power Markets in the West
47

ISO Public
OATT vs Market Framework
• OATT provides for forward procurement of transmission service of different firmness and duration.
• CAISO market efficiently allocates transmission based on DA and RT market awards taking into account system conditions.
• Seams between OATT and organized market allocation of transmission is challenging fundamentals of open access:– Native load priority
– Forward procurement of transmission to support transactions
– Fair and open access reservation system
– System expansion studies for individual requests for transmission that cannot be accommodated
Page 4
Technical Session Meeting Book - Technical Session - Power Markets in the West
48