Pertti Nurmi & Laurie Wilson General Guide to Forecast Verification => Exercises
Upload
martina-richardCategory
view
218download
2
Potential of European forest belt in energy production and carbon
management
Veli Pohjonen & Pertti Hari
University of Helsinki
Brussels 14.3.2006

European forest belt is a vast resource
source: European Forest Institute
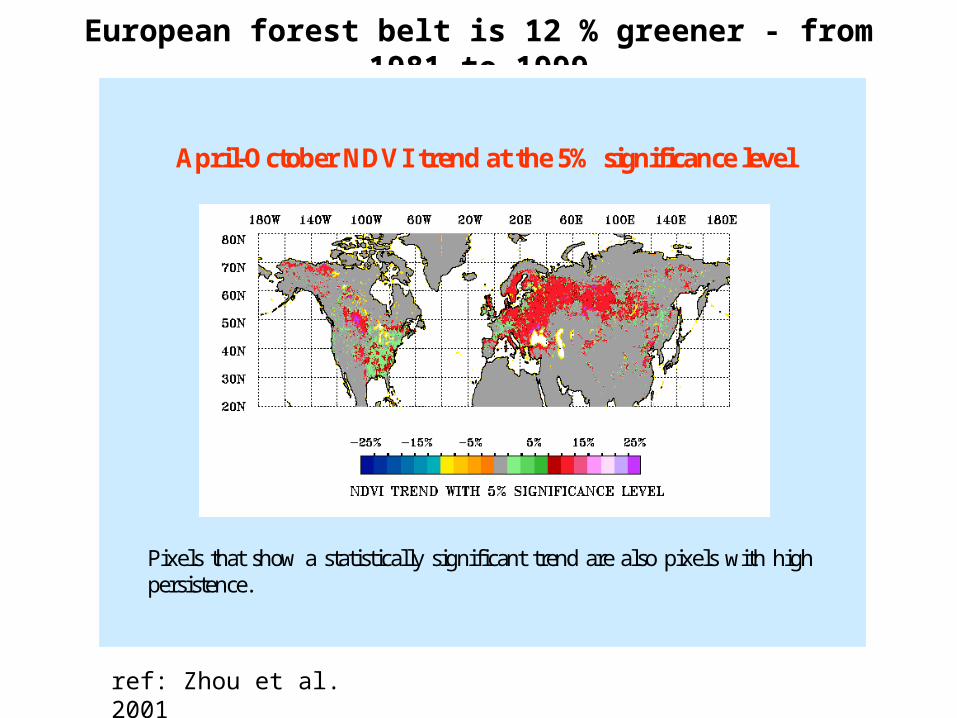
European forest belt is 12 % greener - from 1981 to 1999
April-October NDVI trend at the 5% significance level
Pixels that show a statistically significant trend are also pixels with high persistence.
ref: Zhou et al. 2001

European forests grow more: surplus 260 mill. m3 a-1
excluding Former Soviet Union; source: European Forest Institute
0
100
200
300
400
500
600
700
800
900
1950 1960 1970 1980 1990 2000
Mil
lio
n m
3 /ye
ar
Gross Annual Increment Net Annual Increment
Annual Fellings

Finland: forests grow more, surplus 25 mill. m3 a-1

Trees grow better also in northern latitudes in Lapland, Finland
• Scientists were surprised of the growth vigor of young Lapland forests (2004)
• During the last decade (1990s) the annual growth increased by 49 %
source: Helsingin Sanomat

Measurements of gas exchange of Scots pine have been done since 1992 at northern tree line
in Värriö Research Station, 200 km behind Arctic Circle

Explanations behind increased growth
• Successfull conservation
• Improved silviculture
• Sustained management
• Young, vigorous trees dominate
• Nitrogen deposition
• Climate change: temperature and CO2 rise

EU25: top 10 countries in forest growth available for wood supply
Net annual forest growth in EU, mill. m3 a-1 (top 10)
15
19
20
27
29
39
73
85
89
92
0 20 40 60 80 100
UK
Italy
Czech
Austria
Spain
Poland
Finland
Sweden
Germany
France
source: Finnish Forest Research Insitute

Forests available for wood supply:they are outside conservation areas;
they are typically at thinning age

Sustained forestry
• takes care of continuity, diversification of landscapes and conservation of biodiversity
• After thinning the forests grow timber for mechanical wood industries

Research gaps
1. Woody biomass growth of young forests in changing climate
2. Woody biomass growth of young forests in various parts of European forest belt
3. Woody biomass growth of young stands by various tree species (currently known best for Scots pine)

Comparison of energy use and forest growth
• Energy use in EU 72 EJ (exajoules)
• Forest growth in EU 3.8 EJ• Ratio 5.3 per cent
• Energy use in Finland 1488 PJ (petajoules)• Forest growth in Finland 509 PJ• Ratio 34 per cent
• Energy use in Lapland 53 PJ• Forest growth in Lapland 67 PJ• Ratio 126 per cent

Forest energy is local
• it is important regionally, in well-forested, remote areas
• it can contribute to energy mix at national level
• it cannot solve all energy needs at European level
• also other forms of energy (solid, liquid and gaseous) are needed

Carbon dioxide management
• Drop CO2 emissions by 10 per cent
• EU25 emissions now 4 064 mill. tn a-1 CO2
• EU: drop 406 mill. tn a-1 • Finland: drop 7.3 mill. tn a-1 • Lapland: drop 0.26 mill. tn a-1
• Is the forest growth sufficient?

Comparison of CO2 drop by one tenth and forest growth
• Reduction in EU 406 mill. tn CO2
• From forest growth in EU 384 mill. tn CO2
• Ratio 95 per cent
• Reduction in Finland 7.3 mill. tn CO2
• Forest growth in Finland 49 mill. tn CO2
• Ratio 660 per cent
• Reduction in Lapland 0.26 mill. tn CO2
• Forest growth in Lapland 6.7 mill. tn CO2
• Ratio 2600 per cent

Forest energy can contribute to reduction of CO2 emissions
• Forest energy can solve the CO2 emission reductions only in less populated remote areas
• Forest energy can contribute to CO2 emission reductions at national and European level
• But again: also other forms of renewable energy (solid, liquid and gaseous) are needed to reduce CO2 emissions at European level

Big potential to drop CO2 emissions is in coal and steel, see case Finland
CO2 emission (mill. tn a-1) rights in Finland 2005-2007, top 15
0.9
0.9
0.9
1.0
1.0
1.1
1.2
1.3
1.3
1.3
1.4
1.5
1.5
2.7
5.0
0 2 4 6
COAL Tahkoluoto
COAL Inkoo
STEEL Tornio
STEEL Koverhaar
COAL Salmisaari
COAL Kristiina
PEAT Pietarsaari
PEAT Oulu
COAL Vaskiluoto
NATURAL GAS Vuosaari
COAL Naantali
COAL Meri-Pori
COAL Hanasaari
OIL REFINERY Porvoo
STEEL Raahe
source: Finnish Ministry of Trade and Industry

Forest energy development
• Forest chips for local applications: successful development since 1956 (Pöttinger chipper from Austria)
• Wood pellets: development for local applications since 1976, for large-scale applications since 1992
• Research into forest biomass energy as reduction agent in metallurgical industries in 2000s (in Finland: universities, Rautaruukki Oyj)

Transport of forest energy into CO2 emission centres
Transport volume of Scots pine (dry kg in loose m3)
1 530
123
123
156
200
234
575
0 250 500 750 1 000 1 250 1 500 1 750
Tracheid cell wall
Shavings
Saw dust
Forest chips
Wood powder
Round wood
Wood pellets
Rule of thumb for maximum transport:
• Forest chips, saw dust or shavings:
100 km (by truck)
• Round wood 1000 km (by train)
• Wood pellets 5000 km (by ship)

Unprocessed wood: why to transport air (and water)?
Densify - press the wood into plain cell walls !

Wood pellets from Scots pine shavings

Pellets have been developed for 30 years
• near to 200 factories in Europe
• Small scale (house) use is well advanced
• Large scale use started in Hässelby, Sweden in 1992; Denmark also active
• Raw materials: shavings from carpenter industries, have become limited
source: The Bioenergy International

Research gaps and needs for wood energy transport (e.g. as pellets)
1. Densify more
2. Diversify raw material (use of saw dust and chips, by tree species)
3. Raw material drying (thermal and other means)
4. Optimize production (reduce costs)
5. Co-firing with coal
6. Carbon dioxide Capture and Storage (CCS)

Target of pellet development: to get it recognized in Commodity price lists
see e.g. ”pink sheet” in http://www.worldbank.org/
Jan-Dec Jan-Dec Jan-Feb Dec Jan Feb
Commodity Unit 2004 2005 2006 2005 2006 2006
Energy
Coal, Australia $/mt 52.95 47.62 45.44 38.23 43.19 47.70
Crude oil, avg, spot $/bbl 37.73 53.39 61.08 56.43 62.46 59.70
Crude oil, Brent $/bbl 38.30 54.43 61.75 56.75 63.57 59.92
Crude oil, Dubai $/bbl 33.46 49.29 57.94 53.13 58.31 57.58
Natural gas, Europe $/mmbtu 4.28 6.33 7.96 7.49 7.96 7.95
Natural gas, US $/mmbtu 5.89 8.92 8.07 12.83 8.66 7.49
Wood pellet, Europe €/tn ???
??? ??? ??? ??? ???

Reintroduce woody biomass in steel industries
• Wood, as charcoal was the original reduction agent until 1800s
• Wood still in use in Brazilian steel industries
• Most promising route: injection to the blast furnace from below
• Possibility for 10 per cent reduction power and CO2 emissions drop

How to process the biomass for injection? By Airgrinder?

Research gaps and needs
• How woody biomass should be injected into blast furnace: as wood powder (by airgrinder)? as pellets? or as charcoal?
• How do different tree species behave in woody biomass injection
• Co-firing of processed woody biomass with coal
• Carbon dioxide Capture and Storage (CCS)

A glimpse into economics: CO2 emissions trading caused structural change in raw energy price relationships; prices in Finland, March 2006

A glimpse into sustainability
• CCS (Carbon dioxide Capture and Storage) is under research for coal-fired energy production; CCS will neutralize CO2 emissions from coal
• CCS will be used with woody biomass energy as well; CCS will render CO2 emissions negative, from woody biomass plants.
• CCS with woody biomass may give sustained way to reduce carbon dioxide from the atmosphere
• CCS needs long-term research

In conclusion
• Woody biomass growth in the European forest belt has increased
• More woody biomass becomes available for bioenergy production
• In EU forest energy can theoretically cover max 5 per cent
• Impact of forest energy on CO2 emissions reduction is bigger
• Forest energy can contribute to the renewable energy mix
• Other energy forms (solid, liquid and gaseous) are needed
• In long run woody biomass energy may have a sustained role in CCS
• There is a need for wide, integrated R & D project at EU framework

Into research project in FP7 • Whole chain from tree seedling into processed biomass and
energy use needs to be included
• Research and development in three parts, based by existing gaps
1. Woody biomass growth and management of young forests in various parts of Europe and by various tree species
2. Harvesting and processing the woody biomass for transport and storage for use in populated and industrialized areas
3. Use of processed woody biomass, including applications for Carbon dioxide Capture and Storage (CCS)

References and sources
• The Bioenergy International; www.bioenergyinternational.com
• European Forest Institute (EFI); www.efi.fi • Finnish Forest Research Institute. Metsätilastollinen
vuosikirja 2005. Statistical yearbook 2005; www.metla.fi • Finnish Ministry of Trade and Industry; www.ktm.fi• World Bank Commodity prices (”Pink Sheet): http://
www.worldbank.org/ ; search ”pink sheet”• Helsingin Sanomat 6.9.2004; www.helsinginsanomat.fi • Zhou, L. et al. 2001. Variations in northern vegatation
activity inferred from satellite data of vegetation index during 1981 to 1999. J. Geophys. Res. 106 (D17): 20,069-20,083.