Potential Impacts of Climate Change on U.S. … · geographically uniform. ... “Increased...
29
Potential Impacts of Climate Change on U.S. Transportation Briefing on the Results of a Study by the Committee on Climate Change and U.S. Transportation, Transportation Research Board, Division on Earth and Life Studies, National Research Council Presented to the Northern Transportation and Air Quality Summit Baltimore, Maryland August 14, 2008 Presented by Dr. George C. Eads Senior Consultant, CRA International Member, Committee on Climate Change and U.S. Transportation
Transcript of Potential Impacts of Climate Change on U.S. … · geographically uniform. ... “Increased...
Potential Impacts of Climate Change on U.S. Transportation
Briefing on the Results of a Study by the Committee on Climate Change and U.S. Transportation, Transportation Research Board, Division on
Earth and Life Studies, National Research Council
Presented to the Northern Transportationand Air Quality Summit
Baltimore, Maryland
August 14, 2008
Presented by Dr. George C. EadsSenior Consultant, CRA International
Member, Committee on Climate Change and U.S. Transportation

2
Study Sponsors
• Transportation Research Board • U.S. Department of Transportation• U.S. Army Corps of Engineers• U.S. Environmental Protection Agency• American Association of State Highway and Transportation Officials
(AASHTO) (through the National Cooperative Highway Research Program)
• Transit Cooperative Research Program (TCRP)
3
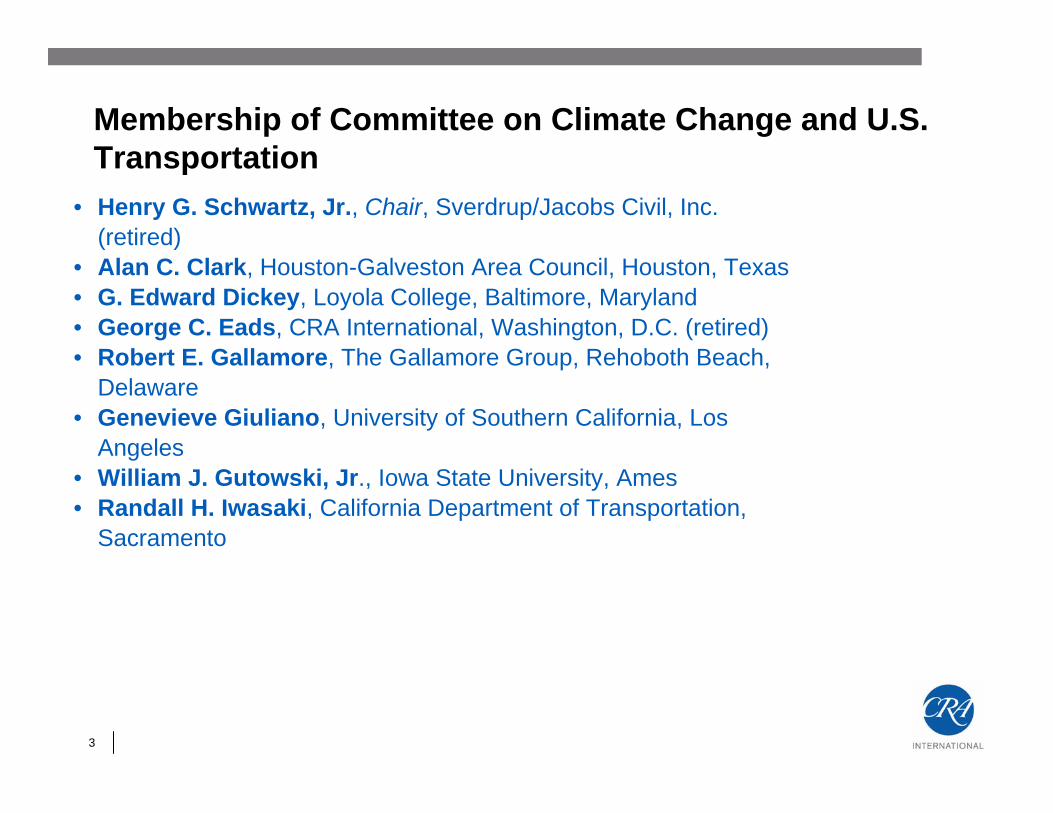
Membership of Committee on Climate Change and U.S. Transportation
• Henry G. Schwartz, Jr., Chair, Sverdrup/Jacobs Civil, Inc.(retired)
• Alan C. Clark, Houston-Galveston Area Council, Houston, Texas• G. Edward Dickey, Loyola College, Baltimore, Maryland• George C. Eads, CRA International, Washington, D.C. (retired)• Robert E. Gallamore, The Gallamore Group, Rehoboth Beach,
Delaware• Genevieve Giuliano, University of Southern California, Los
Angeles• William J. Gutowski, Jr., Iowa State University, Ames• Randall H. Iwasaki, California Department of Transportation,
Sacramento

4
Membership of Committee on Climate Change and U.S. Transportation (cont’d)
• Klaus H. Jacob, Columbia University, Palisades, New York• Thomas R. Karl, National Oceanic and Atmospheric
Administration, Asheville, North Carolina• Robert J. Lempert, The Rand Corporation, Santa Monica,
California• Luisa Paiewonsky, Massachusetts Highway Department, Boston• S. George H. Philander, Princeton University, Princeton, New
Jersey (through 12/06)• Christopher R. Zeppie, The Port Authority of New York and
New Jersey, New York City
5
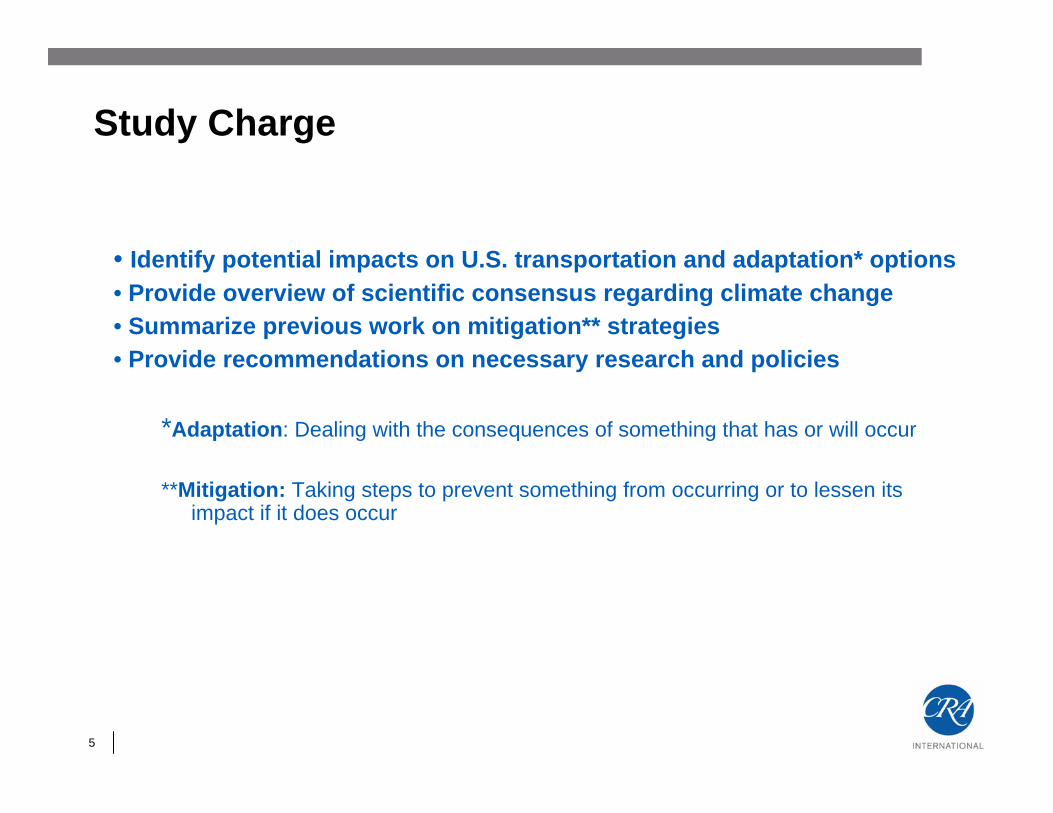
Study Charge
• Identify potential impacts on U.S. transportation and adaptation* options• Provide overview of scientific consensus regarding climate change • Summarize previous work on mitigation** strategies• Provide recommendations on necessary research and policies
*Adaptation: Dealing with the consequences of something that has or will occur
**Mitigation: Taking steps to prevent something from occurring or to lessen its impact if it does occur
6
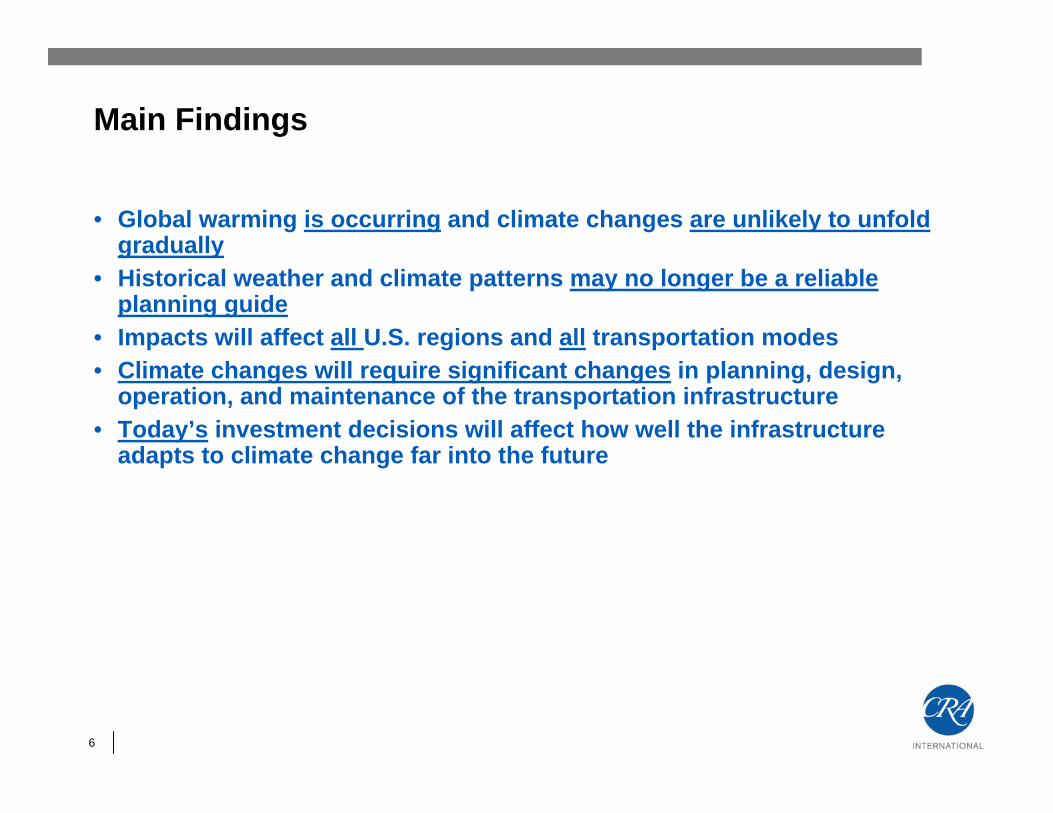
Main Findings
• Global warming is occurring and climate changes are unlikely to unfold gradually
• Historical weather and climate patterns may no longer be a reliable planning guide
• Impacts will affect all U.S. regions and all transportation modes• Climate changes will require significant changes in planning, design,
operation, and maintenance of the transportation infrastructure• Today’s investment decisions will affect how well the infrastructure
adapts to climate change far into the future

7
Climate Changes of Relevance to Transportation Over the Next 50-100 Years
• Rising sea levels (virtually certain – greater than 99% probability of occurrence)
• Increases in very hot days and heat waves (very likely – greater than 90% probability of occurrence)
• Increases in Arctic temperatures (virtually certain – greater than 99% probability of occurrence)
• Increases in intense precipitation events (very likely – greater than 90% probability of occurrence)
• Increases in hurricane intensity (likely – greater than 66% probability of occurrence)

8
Sea Level Rise Accompanied by Storm Surges
“It is virtually certain that sea levels will continue to rise in the 21st century as a result of thermal expansion and loss of mass from ice sheets. The projected global range in sea level rise is from 0.18 m to 0.59 m by 2099, but the rise will not be geographically uniform. The Atlantic and Gulf Coasts should experience a rise near the global mean, the West Coast a slightly lower rise, and the Arctic Coast a rise of only 0.1 m. These estimates do not include subsidence in the Gulf and uplift along the New England Coast. Nor do the global projections include the full effects of the Greenland and Antarctic ice masses because current understanding of these effects is too limited to permit projection of an upper bound on sea level rise.”
• Potential Impacts– Flooding of tunnels and low lying infrastructure – Erosion of bridge supports– Changes needed in harbors and ports– More severe storm surges requiring evacuation– Closure of several top 50 airports– Inundation of roads, rail lines, and runways in coastal areas
9
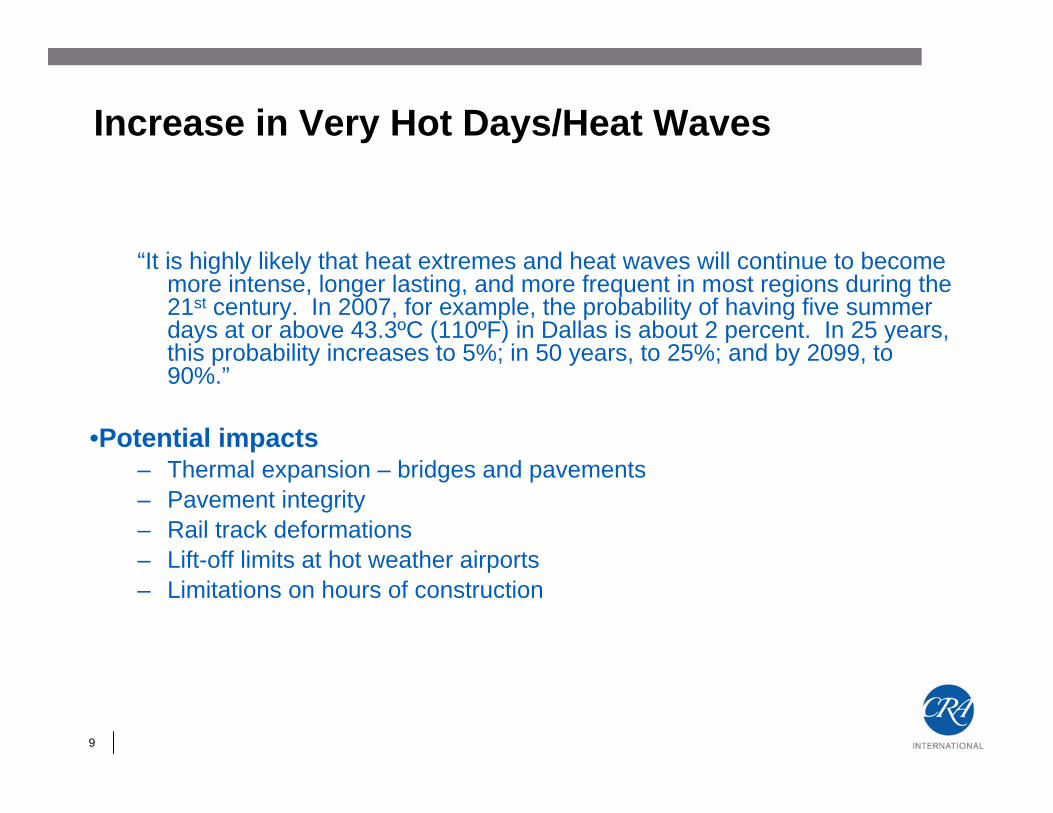
Increase in Very Hot Days/Heat Waves
“It is highly likely that heat extremes and heat waves will continue to become more intense, longer lasting, and more frequent in most regions during the 21st century. In 2007, for example, the probability of having five summer days at or above 43.3ºC (110ºF) in Dallas is about 2 percent. In 25 years, this probability increases to 5%; in 50 years, to 25%; and by 2099, to 90%.”
•Potential impacts– Thermal expansion – bridges and pavements– Pavement integrity– Rail track deformations– Lift-off limits at hot weather airports– Limitations on hours of construction
10
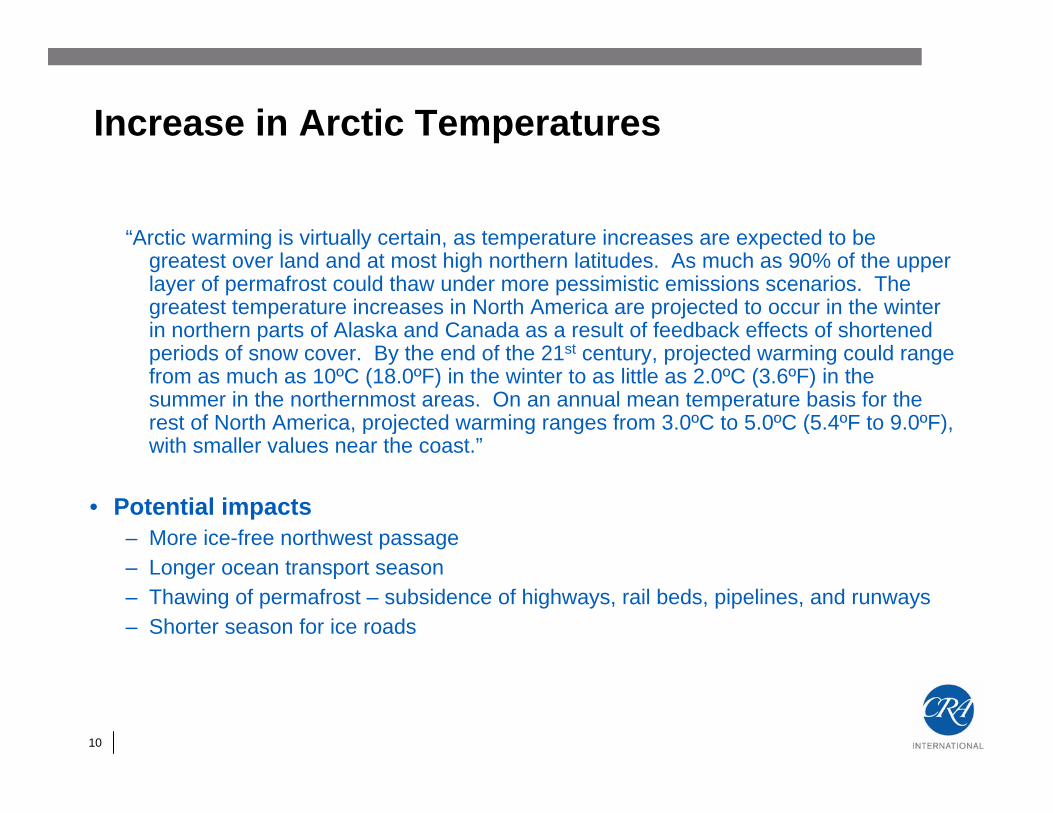
Increase in Arctic Temperatures
“Arctic warming is virtually certain, as temperature increases are expected to be greatest over land and at most high northern latitudes. As much as 90% of the upper layer of permafrost could thaw under more pessimistic emissions scenarios. The greatest temperature increases in North America are projected to occur in the winter in northern parts of Alaska and Canada as a result of feedback effects of shortened periods of snow cover. By the end of the 21st century, projected warming could range from as much as 10ºC (18.0ºF) in the winter to as little as 2.0ºC (3.6ºF) in the summer in the northernmost areas. On an annual mean temperature basis for the rest of North America, projected warming ranges from 3.0ºC to 5.0ºC (5.4ºF to 9.0ºF), with smaller values near the coast.”
• Potential impacts– More ice-free northwest passage – Longer ocean transport season– Thawing of permafrost – subsidence of highways, rail beds, pipelines, and runways– Shorter season for ice roads

11
Increase in Intense Precipitation Events
“It is highly likely that intense precipitation events will continue to be come more frequent in widespread areas of the United States.”
• Potential impacts– Traffic disruptions– Increase in airline delays due to convective weather– Flooding of roadways, rail lines, runways– Scouring of pipeline supports and bridge foundations

12
More Frequent Strong Hurricanes
“Increased tropical storm intensities, with larger peak wind speeds and more intense precipitation are projected as likely. No robust projections concerning the annual global number of tropical storms has yet emerged from modeling studies, but more detailed analyses focused on the Atlantic Ocean suggest no significant increases in the annual number of Atlantic tropical storms.”
• Potential impacts– More frequent and costly evacuations– Greater probability of infrastructure failures– Failure of bridge decks– Interruptions to air service – Damage to ports and harbors
13
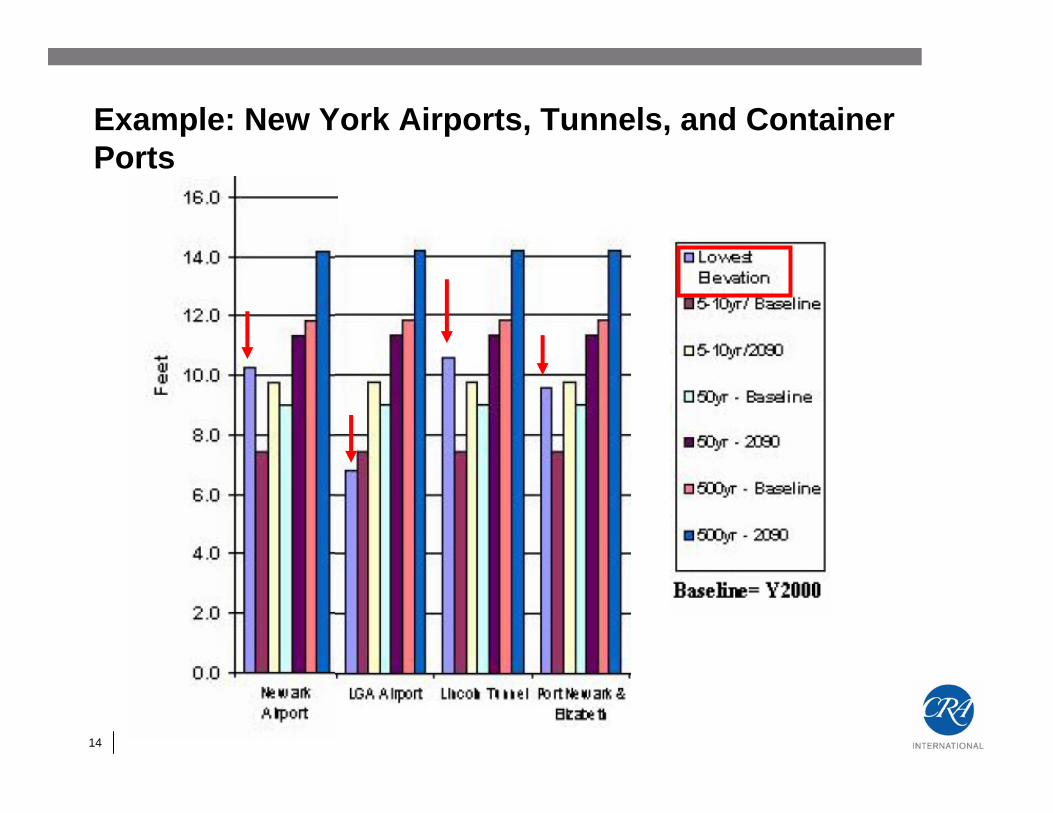
“Potentially, the greatest impact of climate change for North America’s transportation systems will be flooding of coastal roads, railways, transit systems, and runways because of global rising sea levels, coupled with storm surges and exacerbated in some locations by land subsidence”
14
Example: New York Airports, Tunnels, and Container Ports

15
Example: Vulnerable railroad infrastructure

16
RecommendationsDecision Framework and Data
• Inventory critical infrastructure, particularly in vulnerable locations• Incorporate climate change in investment plans and decisions• Adopt strategic, risk-based approaches to decision making• Improve communication and establish information clearinghouse• Research on climate science needs to address needs of
transportation decision makers

17
RecommendationsAdaptation Strategies
• Integrate emergency response into transportation operations (and vice versa) to handle weather and climate extremes
• Reevaluate design standards – develop a research plan and cost proposal for Congressional actionRebuild infrastructure in vulnerable locations to higher standards
• Develop new technologies to track conditions and warn of pendingfailure
18
RecommendationsAdaptation Strategies (cont’d)
• Develop a mechanism for sharing best practices (AASHTO, FHWA, other professional organizations)
• Incorporate climate change into transportation and land use planning investment and development decisions
• Reevaluate National Flood Insurance Program and update flood zone maps to account for sea level rise
• Develop regional and multistate structures to address climate change impacts and create a federal interagency working group on adaptation

19
Where to Begin?
• Which climate changes most relevant for a region?• How are climate changes likely to be manifest?• What transportation assets will be affected?• What performance levels are required?• What level of investment is needed?• What are the risks if no action is taken?• Who will make these judgments and decisions?• How will investment priorities be determined?• How will they be funded?

20
Appendix B – Contribution of the U.S. Transportation Sector to Greenhouse Gas Emissions and Assessment of Mitigation Strategies
Total US GHG emissions in 2003 = 6763.2 Tg CO2 Eq., of which Fossil Fuel Combustion = 5551.5 Tg CO2 Eq.(Includes CO2 , CH4 and N2O converted to CO2 Eq. based on warming potential)
Mode/Vehicle Type Gasoline Diesel Jet Fuel Residual Other* Total ShareRoad Vehicles 1465.5 77.3%
Automobiles 630.2 3.4 633.6 33.4%Light-Duty Trucks 460.9 17.6 0.3 479.1 25.3%Other Trucks 39.6 301.1 0.5 341.7 18.0%Buses 0.3 8.0 0.6 9.5 0.5%Motorcycles 1.6 1.6 0.1%
Rail 39.6 3.2 46.0 2.4%Waterborne 82.1 4.3%
Ships & Boats 17.0 29.5 46.5 2.5%Ships (Bunkers) 6.0 18.6 24.6 1.3%Boats (Recreational) 11.0 11.0 0.6%
Aircraft 233.0 12.3%Commercial Aircraft 122.8 122.8 6.5%Military Aircraft 20.5 20.5 1.1%General Aviation and Other 25.7 2.2 # 30.1 1.6%Aircraft (Bunkers) 59.6 59.6 3.1%
Pipeline 34.8 69.6 3.7%Total 1166.6 369.7 228.6 48.1 41.6 1896.2Share 61.5% 19.5% 12.1% 2.5% 2.2%
Source: USEPA, US Greenhouse Gas Emissions Inventory 2005 , Table 3.7
2003 CO2 Emissions from Fossil Fuel Combustion in Transportation End-Use Sector (Tg CO2 Eq.)
*Aviation gasoline, LPG, CNG, and Electric ity
21
“Levers” for reducing transport-related GHG emissions: the “ASIF” identity
Emissions = A*S*I*FActivity (volume of passenger and freight travel) Structure (shares by mode, utilization factors, and vehicle type)Intensity (fuel use per unit of vehicle activity)Fuel type (GHG emissions characteristics of fuel)

22
“Levers” for reducing transport-related GHG emissions: the “ASIF” identity
Emissions = A*S*I*FActivity (volume of passenger and freight travel) Structure (shares by mode, utilization factors, and vehicle type)Intensity (fuel use per unit of vehicle activity)Fuel type (GHG emissions characteristics of fuel)
23
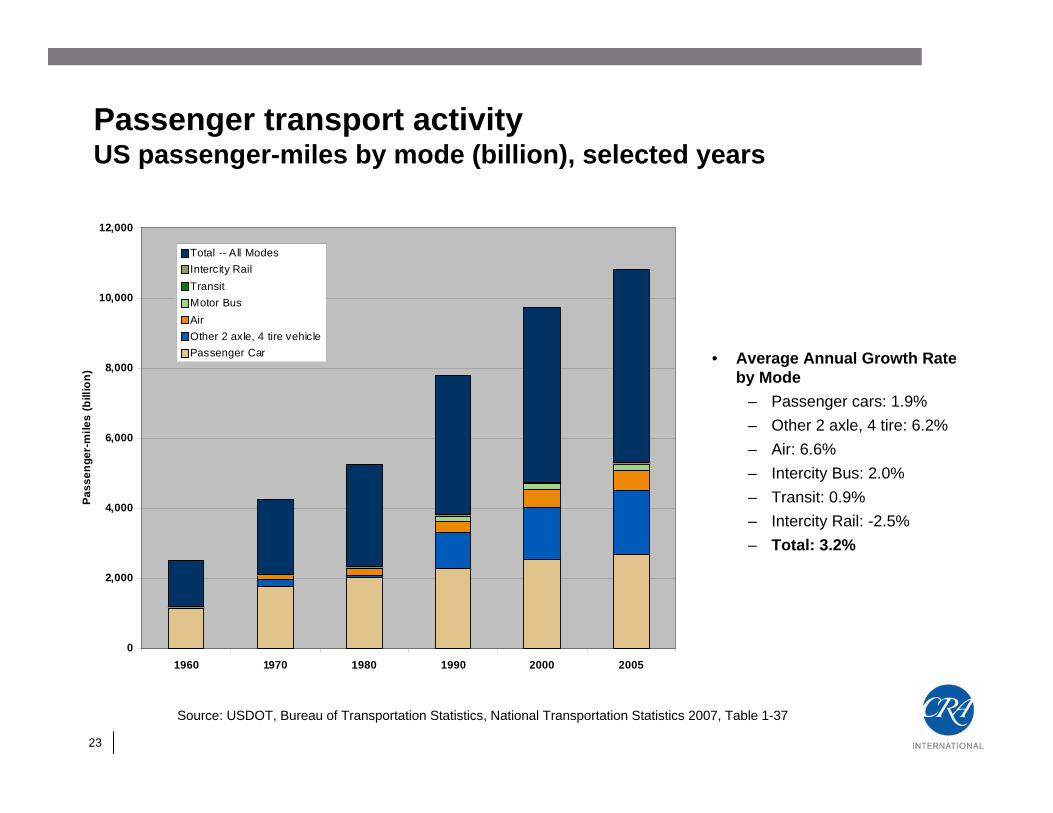
Passenger transport activityUS passenger-miles by mode (billion), selected years
• Average Annual Growth Rate by Mode
– Passenger cars: 1.9% – Other 2 axle, 4 tire: 6.2%– Air: 6.6%– Intercity Bus: 2.0%– Transit: 0.9%– Intercity Rail: -2.5%– Total: 3.2%
Source: USDOT, Bureau of Transportation Statistics, National Transportation Statistics 2007, Table 1-37
0
2,000
4,000
6,000
8,000
10,000
12,000
1960 1970 1980 1990 2000 2005
Pass
enge
r-m
iles
(bill
ion)
Total -- All ModesIntercity Rail TransitMotor BusAir Other 2 axle, 4 tire vehiclePassenger Car
24
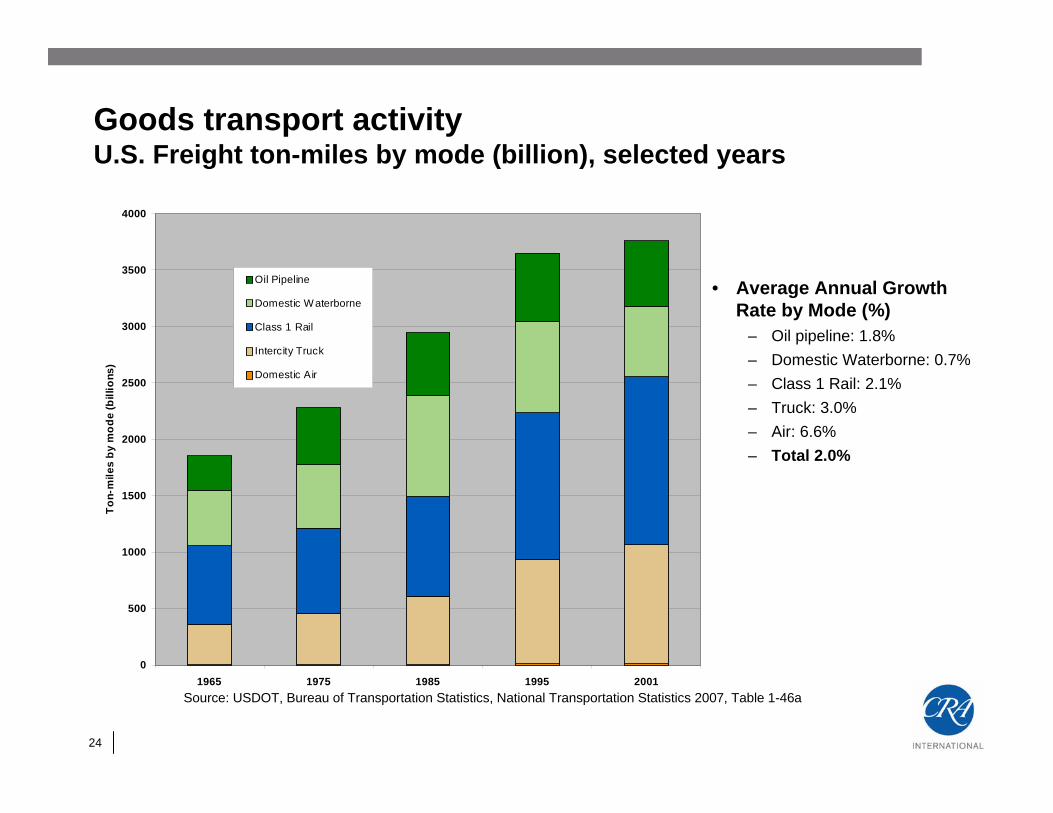
Goods transport activityU.S. Freight ton-miles by mode (billion), selected years
• Average Annual Growth Rate by Mode (%)
– Oil pipeline: 1.8%– Domestic Waterborne: 0.7%– Class 1 Rail: 2.1%– Truck: 3.0%– Air: 6.6%– Total 2.0%
0
500
1000
1500
2000
2500
3000
3500
4000
1965 1975 1985 1995 2001
Ton-
mile
s by
mod
e (b
illio
ns)
Oil Pipeline
Domestic Waterborne
Class 1 Rail
Intercity Truck
Domestic Air
Source: USDOT, Bureau of Transportation Statistics, National Transportation Statistics 2007, Table 1-46a

25
Modal energy use differencesEnergy use by passenger mode (BTU/passenger-mile)
1960 1970 1980 1990 2000 2005 AAGR (%)
Air, certificated carrierDomestic operations 8,633 10,185 5,742 4,932 3,883 3,182 -2.19%
International operations 9,199 10,986 4,339 4,546 3,833 3,523 -2.11%Highwaya
Passenger car 4,495 4,841 4,348 3,811 3,589 3,458 -0.58%
Other 2-axle 4-tire vehicle N 6,810 5,709 4,539 4,509 4,452 -1.21%
Motorcycle b 2,500 2,125 2,227 2,273 1,969 -0.68%
Transit motor bus N N 2,742 3,723 4,147 3,393 0.86%
Amtrak N N 2,148 2,066 2,134 U -0.44%
KEY: Btu = British thermal unit; N = data do not exist; P = revised; R = revised; U = data are not available.
a For 1995 and subsequent years, highway passenger-miles were taken directly from Highway Statistics rather than derived from vehicle-miles and average occupancy, as is the case for 1960-1994.b Included in passenger car.
26
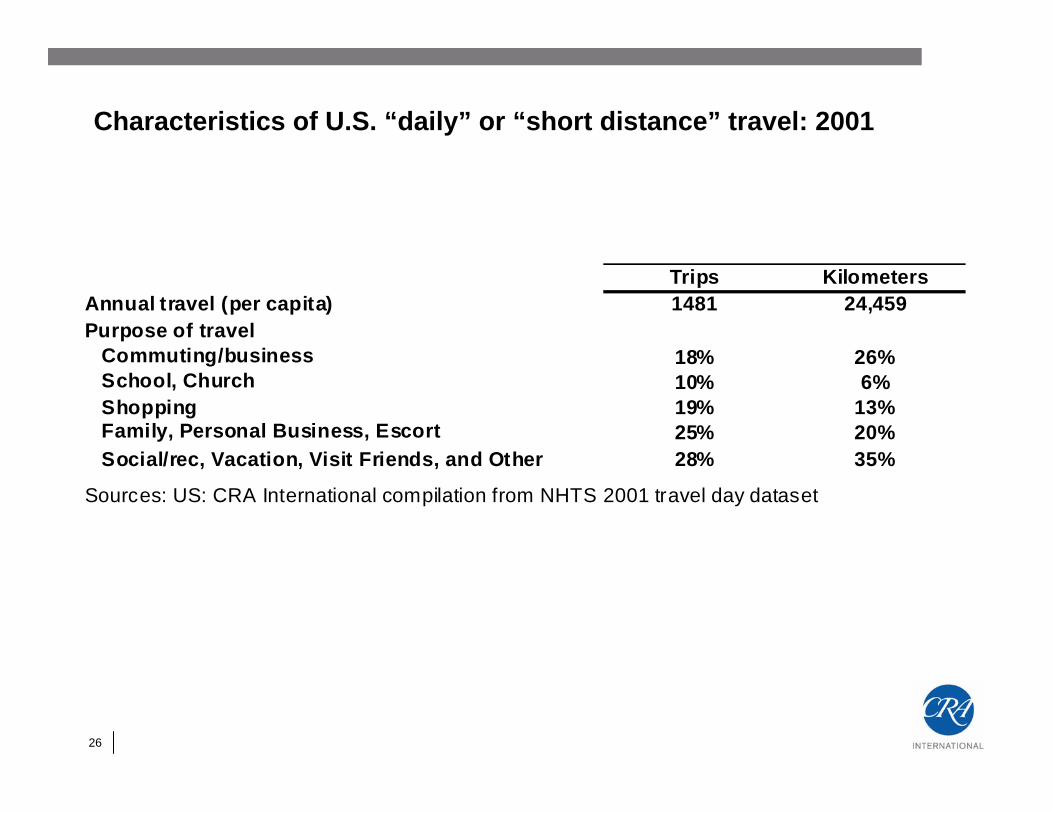
Characteristics of U.S. “daily” or “short distance” travel: 2001
Trips KilometersAnnual travel (per capita) 1481 24,459Purpose of travel
Commuting/business 18% 26%School, Church 10% 6%Shopping 19% 13%Family, Personal Business, Escort 25% 20%Social/rec, Vacation, Visit Friends, and Other 28% 35%
Sources: US: CRA International compilation from NHTS 2001 travel day dataset
27
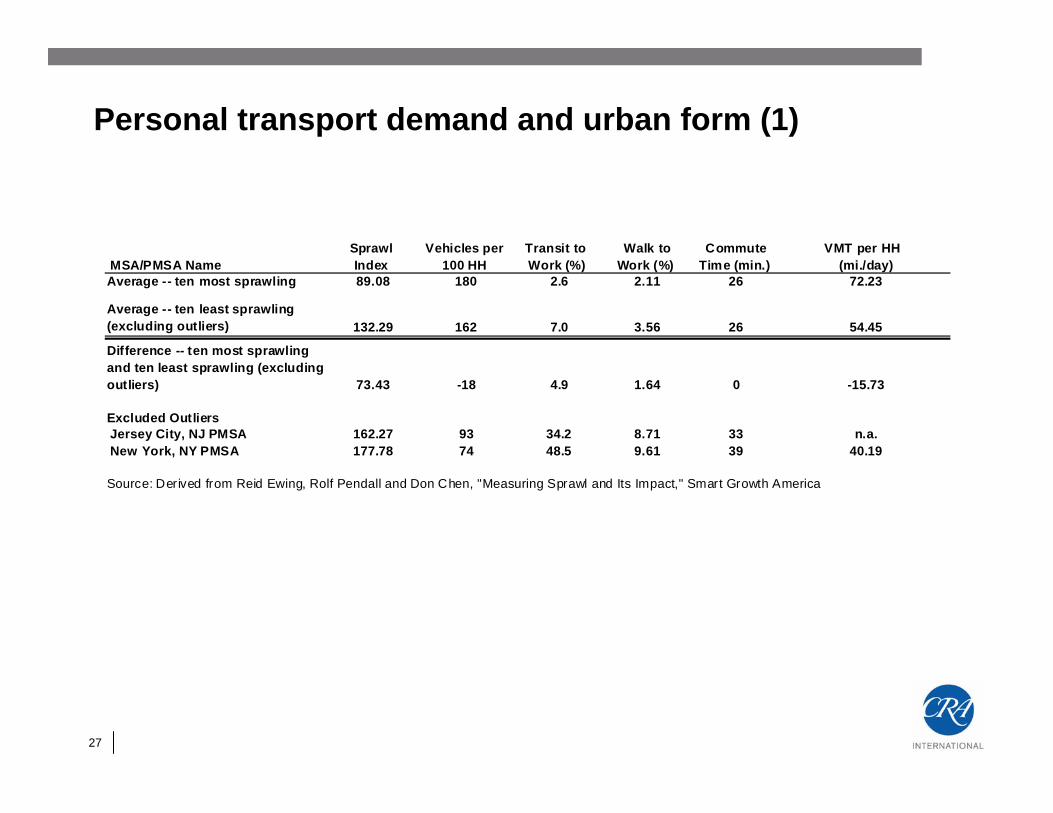
Personal transport demand and urban form (1)
Sprawl Vehicles per Transit to Walk to Commute MSA/PMSA Name Index 100 HH Work (%) Work (%) Time (min.) (mi./day)Average -- ten most sprawling 89.08 180 2.6 2.11 26 72.23
Average -- ten least sprawling (excluding outliers) 132.29 162 7.0 3.56 26 54.45
Difference -- ten most sprawling and ten least sprawling (excluding outliers) 73.43 -18 4.9 1.64 0 -15.73
Excluded Outliers Jersey City, NJ PMSA 162.27 93 34.2 8.71 33 n.a. New York, NY PMSA 177.78 74 48.5 9.61 39 40.19
Source: Derived from Reid Ewing, Rolf Pendall and Don Chen, "Measuring Sprawl and Its Impact," Smart Growth America
VMT per HH
28
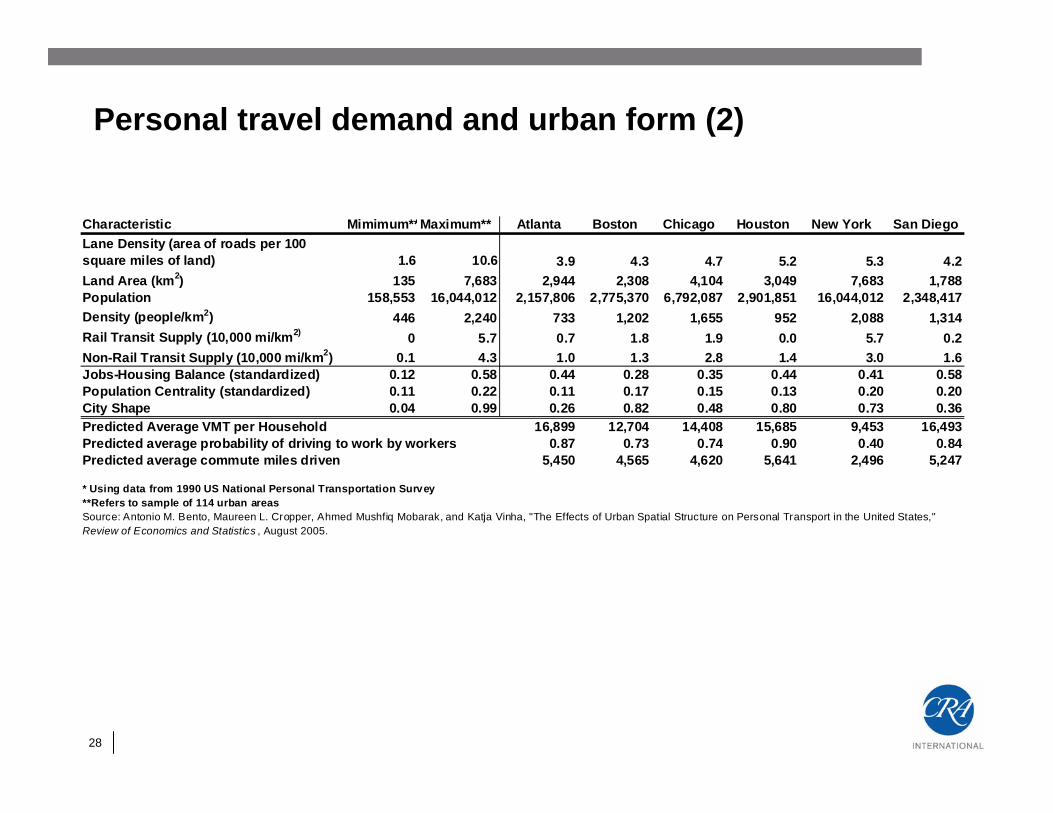
Personal travel demand and urban form (2)
Characteristic Mimimum**Maximum** Atlanta Boston Chicago Houston New York San DiegoLane Density (area of roads per 100 square miles of land) 1.6 10.6 3.9 4.3 4.7 5.2 5.3 4.2Land Area (km2) 135 7,683 2,944 2,308 4,104 3,049 7,683 1,788Population 158,553 16,044,012 2,157,806 2,775,370 6,792,087 2,901,851 16,044,012 2,348,417Density (people/km2) 446 2,240 733 1,202 1,655 952 2,088 1,314Rail Transit Supply (10,000 mi/km2) 0 5.7 0.7 1.8 1.9 0.0 5.7 0.2Non-Rail Transit Supply (10,000 mi/km2) 0.1 4.3 1.0 1.3 2.8 1.4 3.0 1.6Jobs-Housing Balance (standardized) 0.12 0.58 0.44 0.28 0.35 0.44 0.41 0.58Population Centrality (standardized) 0.11 0.22 0.11 0.17 0.15 0.13 0.20 0.20City Shape 0.04 0.99 0.26 0.82 0.48 0.80 0.73 0.36Predicted Average VMT per Household 16,899 12,704 14,408 15,685 9,453 16,493Predicted average probability of driving to work by workers 0.87 0.73 0.74 0.90 0.40 0.84Predicted average commute miles driven 5,450 4,565 4,620 5,641 2,496 5,247
* Using data from 1990 US National Personal Transportation Survey**Refers to sample of 114 urban areasSource: Antonio M. Bento, Maureen L. Cropper, Ahmed Mushfiq Mobarak, and Katja Vinha, "The Effects of Urban Spatial Structure on Personal Transport in the United States," Review of Economics and Statistics , August 2005.
29
How to Access the Report
Report is availablefrom TRB at
http://trb.org/news/blurb_detail.asp?id=8775
Questions?