
Potential Growth Markets for LNG LNG for Transportation · Wartsila North America ... Americas...
38
<Title of Presentation> By: <Author Name>, <Organization> <Date> <Title of Presentation> By: <Author Name>, <Organization> <Date> 17 th INTERNATIONAL CONFERENCE & EXHIBITION ON LIQUEFIED NATURAL GAS (LNG 17) Potential Growth Markets for LNG – LNG for Transportation John Hatley PE Americas VP Ship Power Wartsila North America 19 April 2013 17 th INTERNATIONAL CONFERENCE & EXHIBITION ON LIQUEFIED NATURAL GAS (LNG 17)
Transcript of Potential Growth Markets for LNG LNG for Transportation · Wartsila North America ... Americas...
<Title of Presentation>
By: <Author Name>, <Organization>
<Date>
<Title of Presentation>
By: <Author Name>, <Organization>
<Date>
17th INTERNATIONAL CONFERENCE & EXHIBITION
ON LIQUEFIED NATURAL GAS (LNG 17)
Potential Growth Markets for LNG –
LNG for Transportation
John Hatley PE
Americas VP Ship Power
Wartsila North America
19 April 2013
17th INTERNATIONAL CONFERENCE & EXHIBITION ON LIQUEFIED NATURAL GAS (LNG 17)

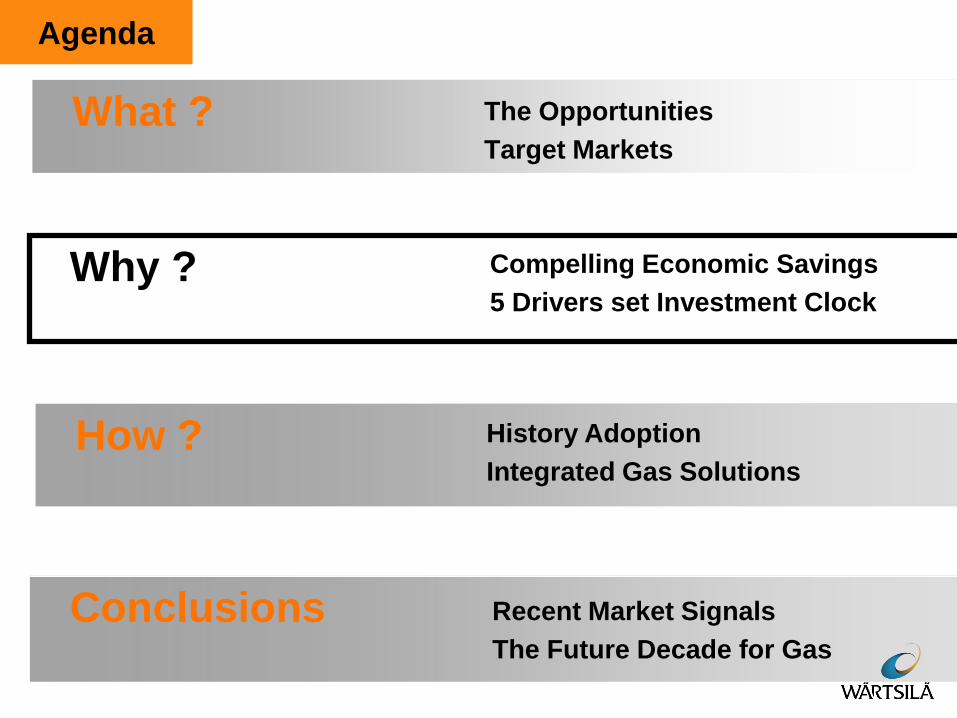
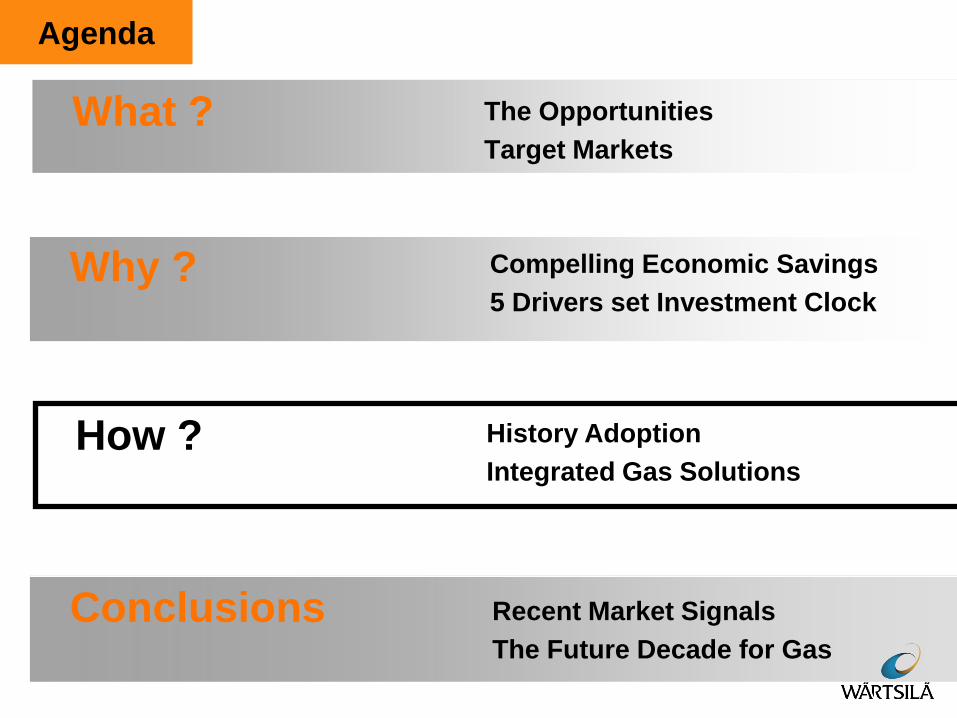
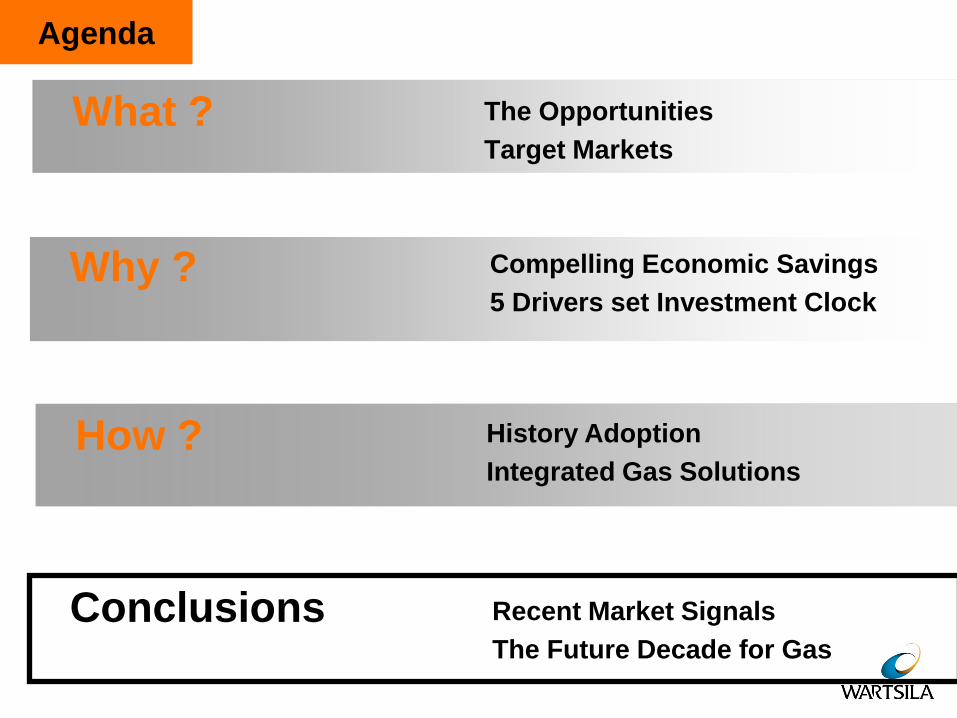
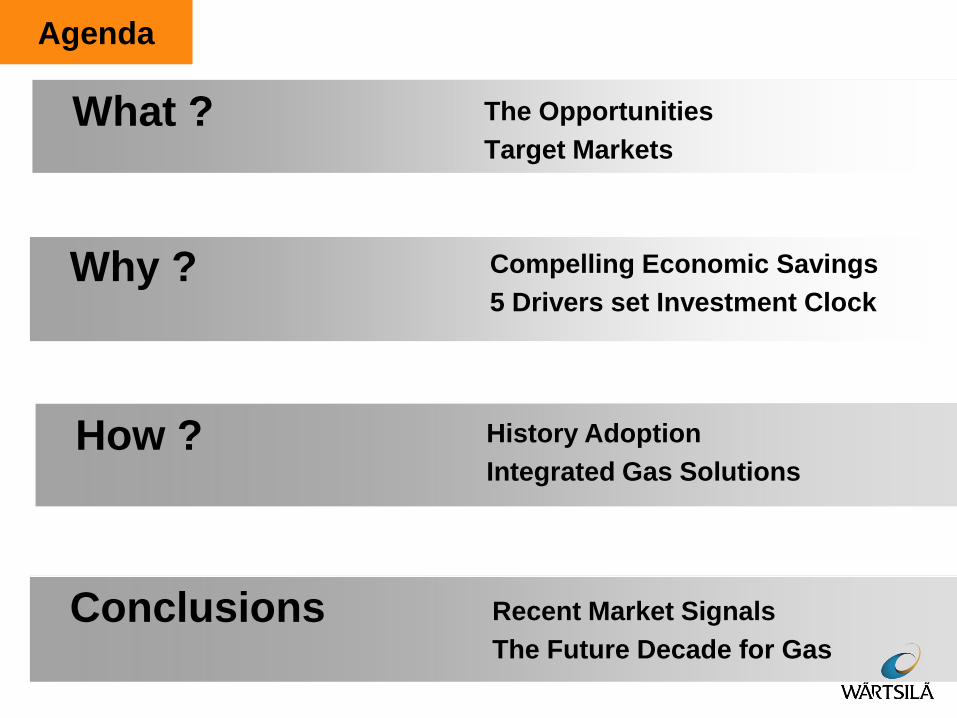
Agenda
What ?
Why ?
Compelling Economic Savings
5 Drivers set Investment Clock
How ?
History Adoption
Integrated Gas Solutions
Conclusions
Recent Market Signals
The Future Decade for Gas
The Opportunities
Target Markets

Agenda
What ?
Why ?
Compelling Economic Savings
5 Drivers set Investment Clock
How ?
History Adoption
Integrated Gas Solutions
Conclusions
Recent Market Signals
The Future Decade for Gas
The Opportunities
Target Markets
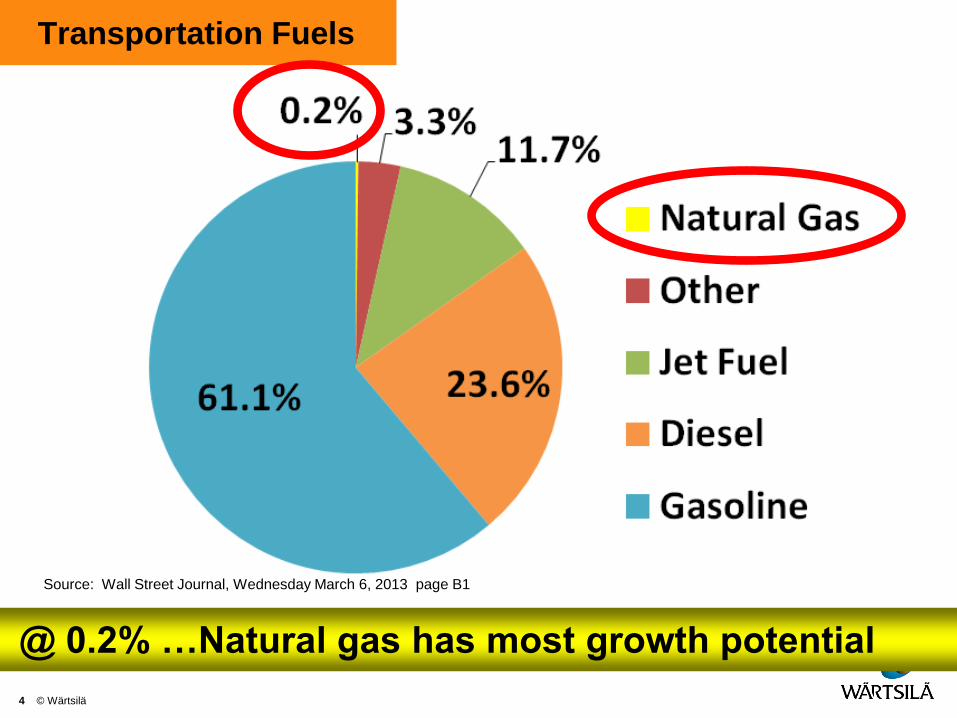
Transportation Fuels
4 © Wärtsilä
Source: Wall Street Journal, Wednesday March 6, 2013 page B1
@ 0.2% …Natural gas has most growth potential
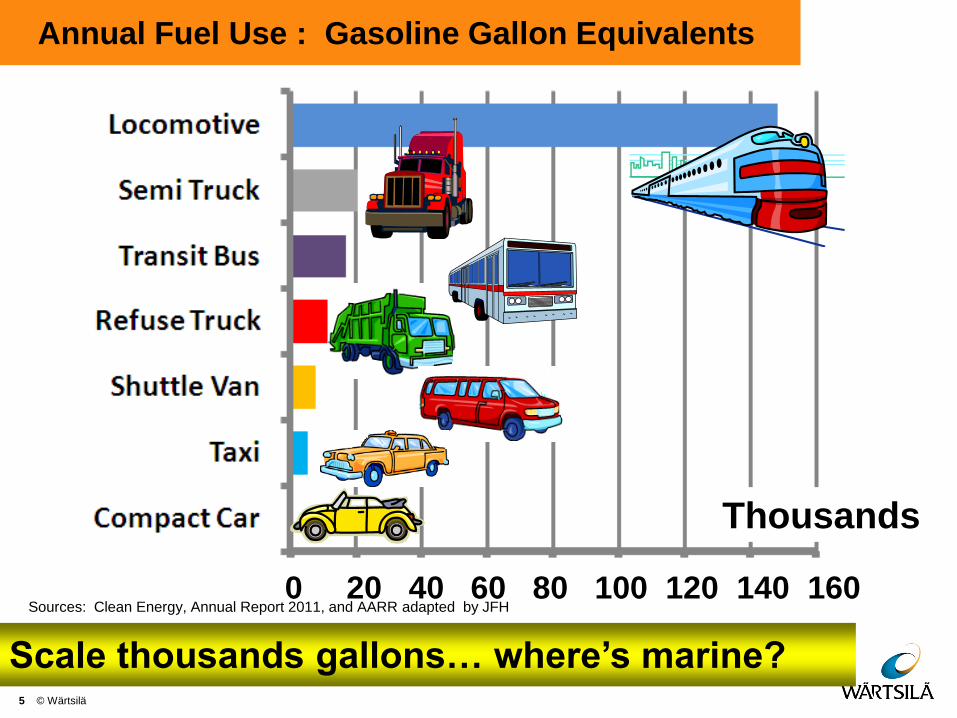
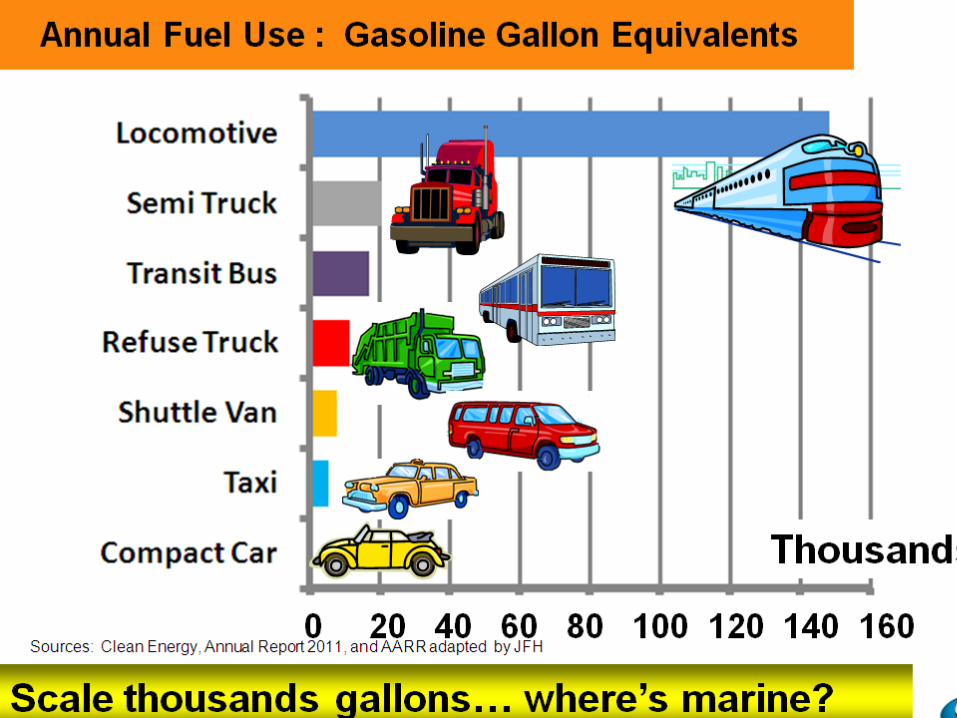
Annual Fuel Use : Gasoline Gallon Equivalents
5 © Wärtsilä
0 20 40 60 80 100 120 140 160
Thousands
Scale thousands gallons… where’s marine?
Sources: Clean Energy, Annual Report 2011, and AARR adapted by JFH
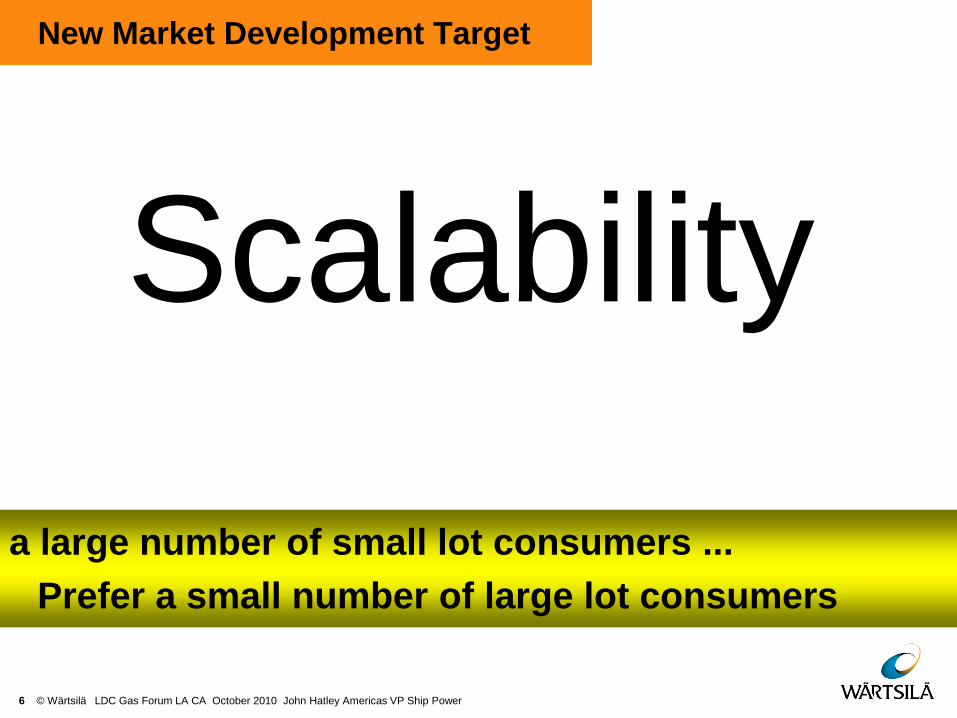
New Market Development Target
Scalability
6 © Wärtsilä LDC Gas Forum LA CA October 2010 John Hatley Americas VP Ship Power
a large number of small lot consumers ...
Prefer a small number of large lot consumers
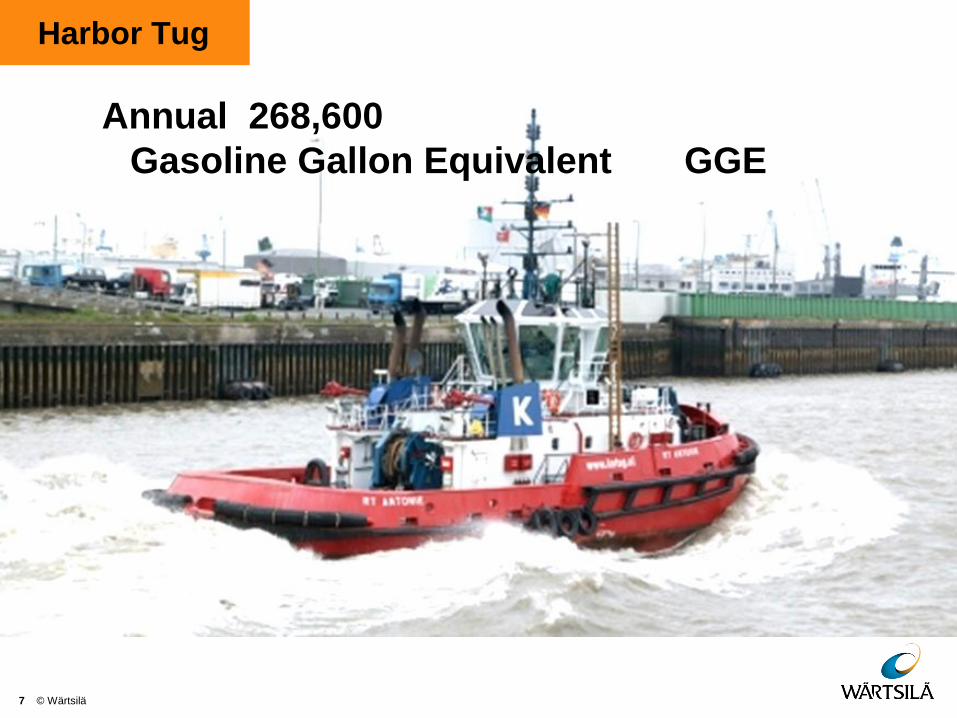
Harbor Tug
7 © Wärtsilä
Annual 268,600
Gasoline Gallon Equivalent GGE
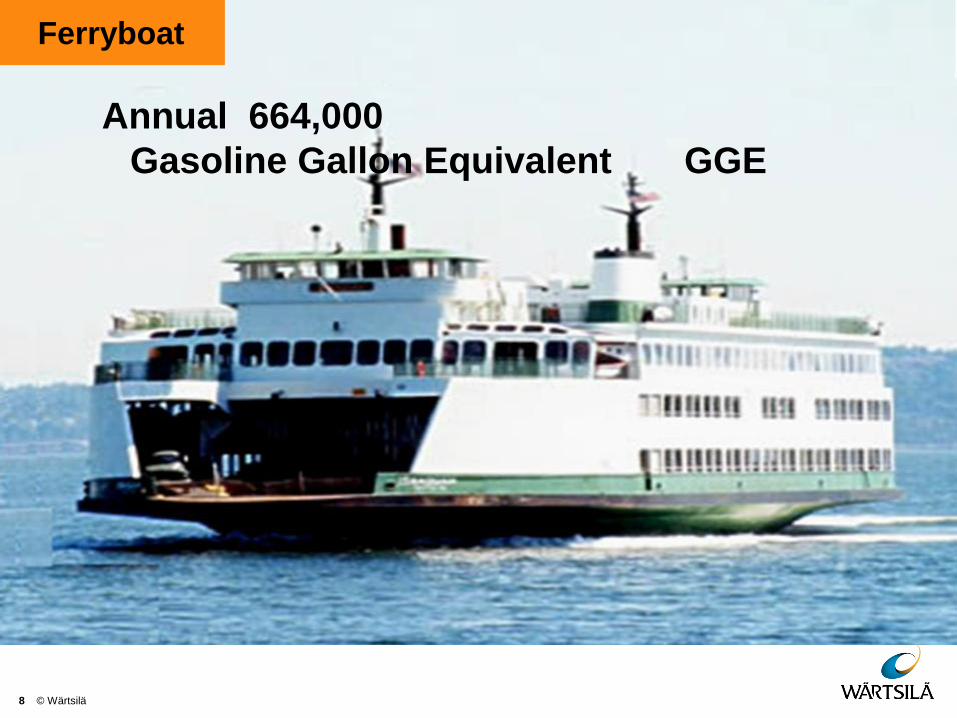
Ferryboat
8 © Wärtsilä
Annual 664,000
Gasoline Gallon Equivalent GGE
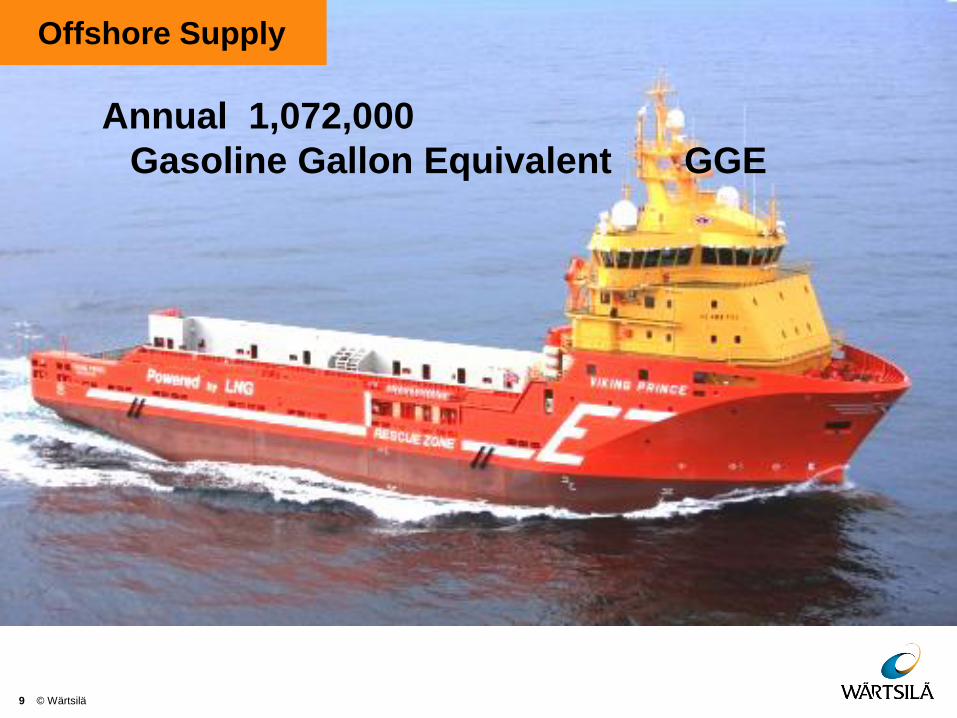
Offshore Supply
9 © Wärtsilä
Annual 1,072,000
Gasoline Gallon Equivalent GGE
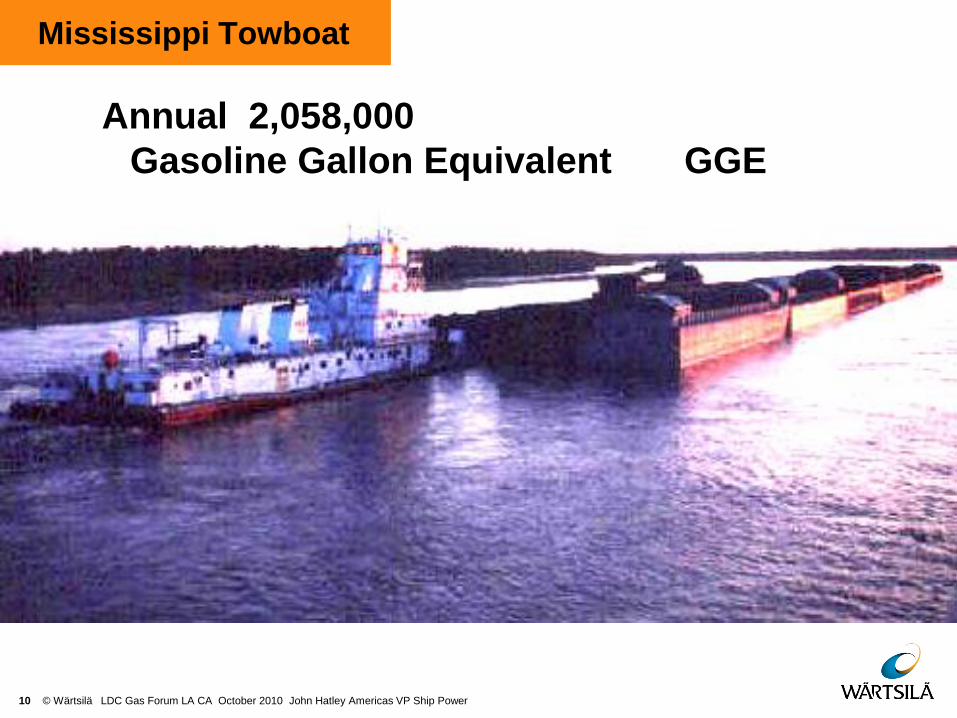
Mississippi Towboat
10 © Wärtsilä LDC Gas Forum LA CA October 2010 John Hatley Americas VP Ship Power
Annual 2,058,000
Gasoline Gallon Equivalent GGE
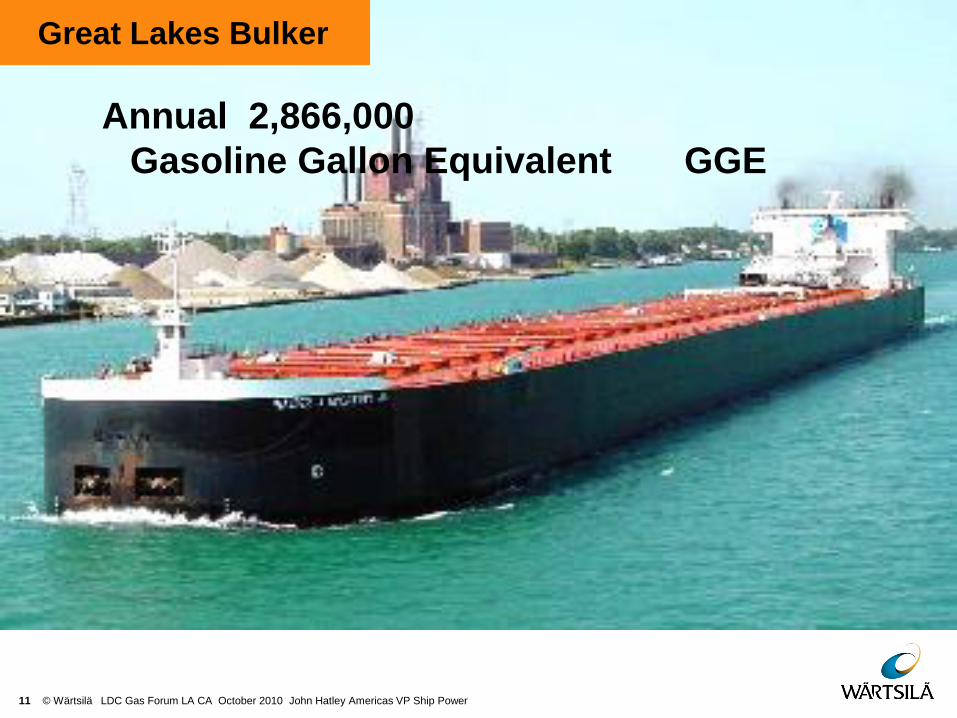
Great Lakes Bulker
11 © Wärtsilä LDC Gas Forum LA CA October 2010 John Hatley Americas VP Ship Power
Annual 2,866,000
Gasoline Gallon Equivalent GGE
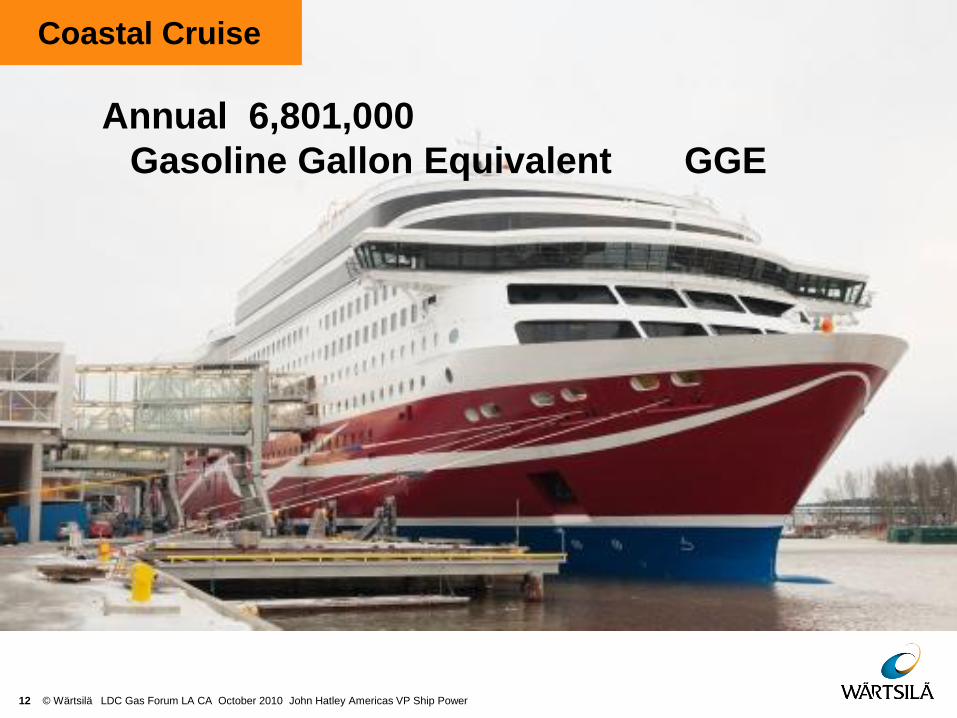
Coastal Cruise
12 © Wärtsilä LDC Gas Forum LA CA October 2010 John Hatley Americas VP Ship Power
Annual 6,801,000
Gasoline Gallon Equivalent GGE
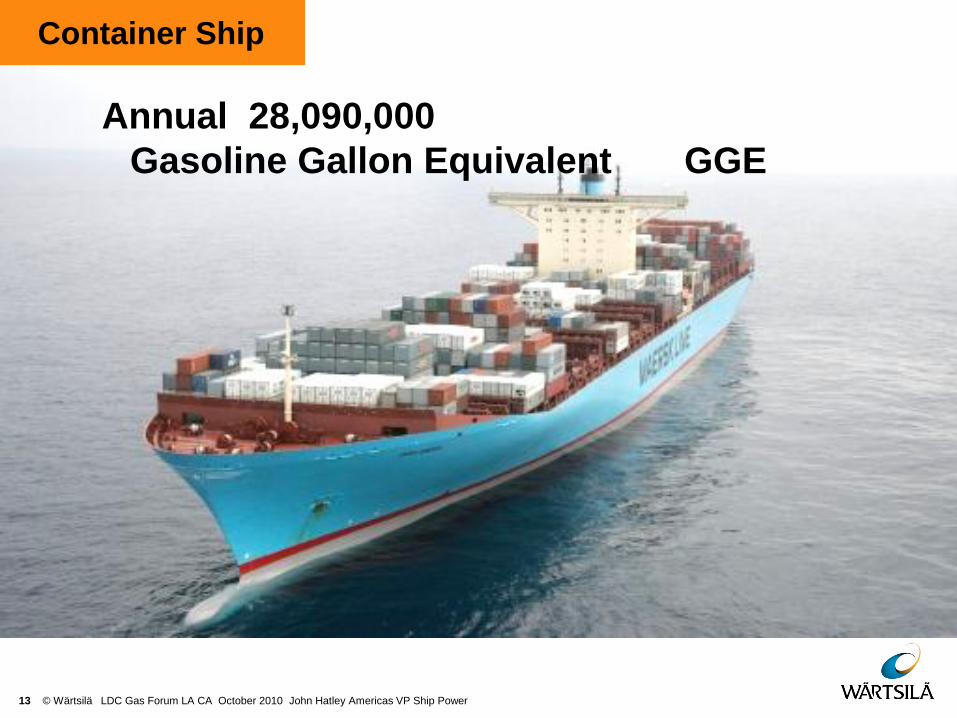
Container Ship
13 © Wärtsilä LDC Gas Forum LA CA October 2010 John Hatley Americas VP Ship Power
Annual 28,090,000
Gasoline Gallon Equivalent GGE
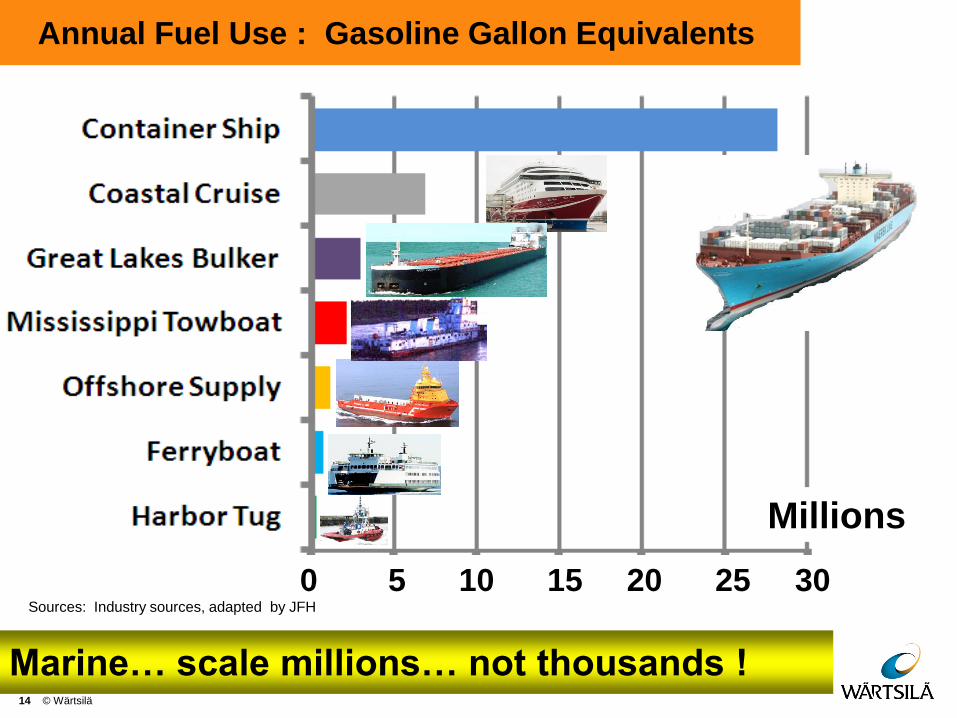
Annual Fuel Use : Gasoline Gallon Equivalents
14 © Wärtsilä
Marine… scale millions… not thousands !
0 5 10 15 20 25 30
Millions
Sources: Industry sources, adapted by JFH
Annual Fuel Use : Gasoline Gallon Equivalents
15 © Wärtsilä
Marine… scale millions… not thousands !
0 5 10 15 20 25 30
Millions
Sources: Industry sources, adapted by JFH
Agenda
What ?
Why ?
Compelling Economic Savings
5 Drivers set Investment Clock
How ?
History Adoption
Integrated Gas Solutions
Conclusions
Recent Market Signals
The Future Decade for Gas
The Opportunities
Target Markets
Logic… Economics !
03/05/2013
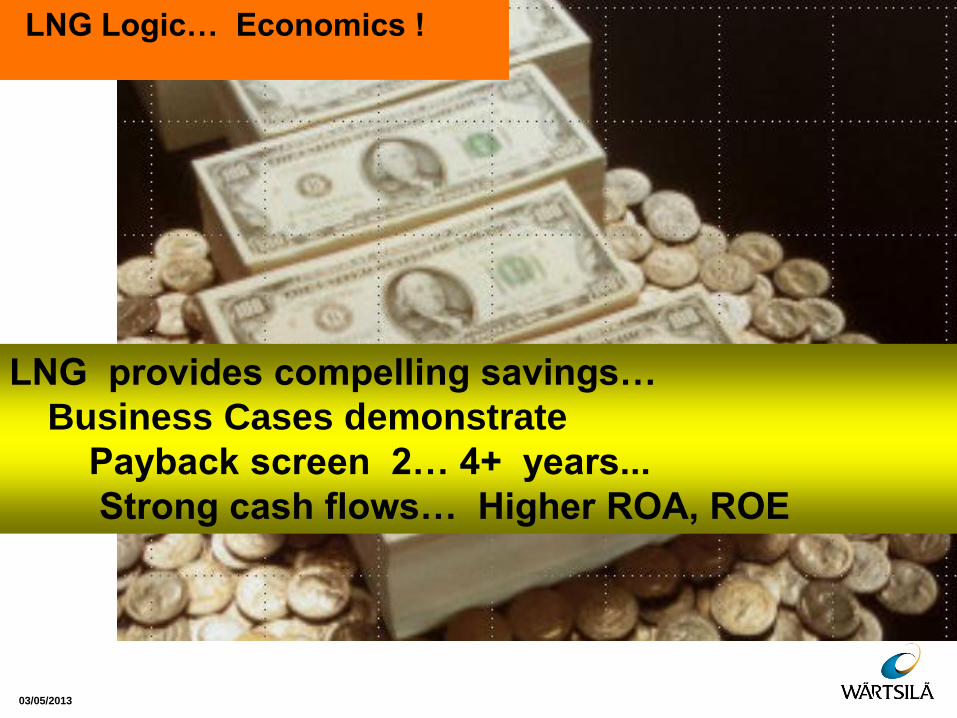
LNG Logic… Economics !
LNG provides compelling savings…
Business Cases demonstrate
Payback screen 2… 4+ years...
Strong cash flows… Higher ROA, ROE
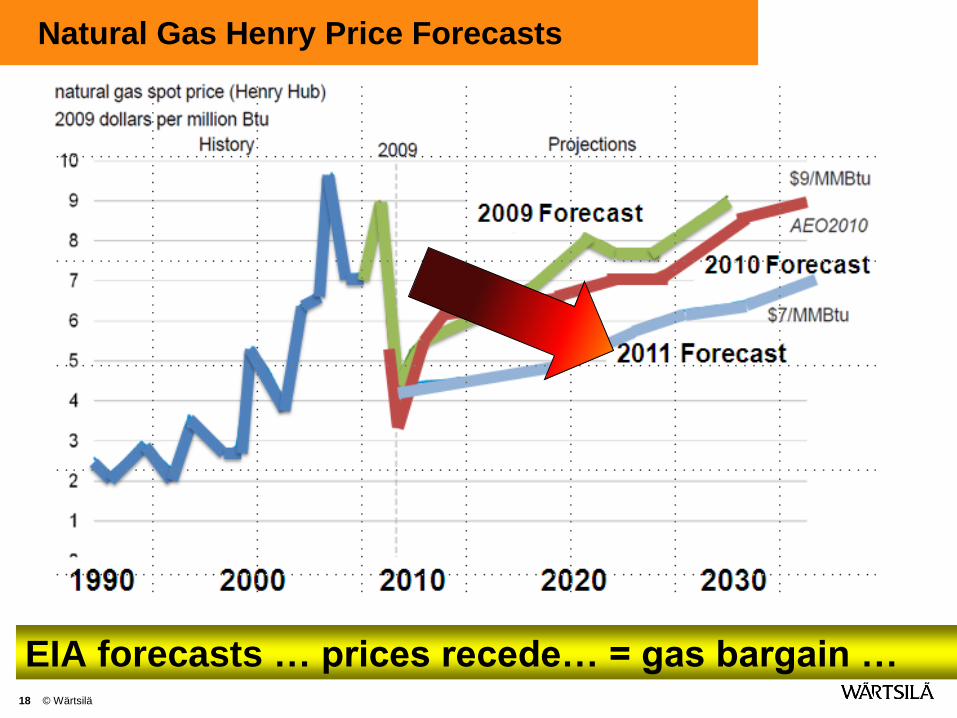
Natural Gas Henry Price Forecasts
18 © Wärtsilä
EIA forecasts … prices recede… = gas bargain …
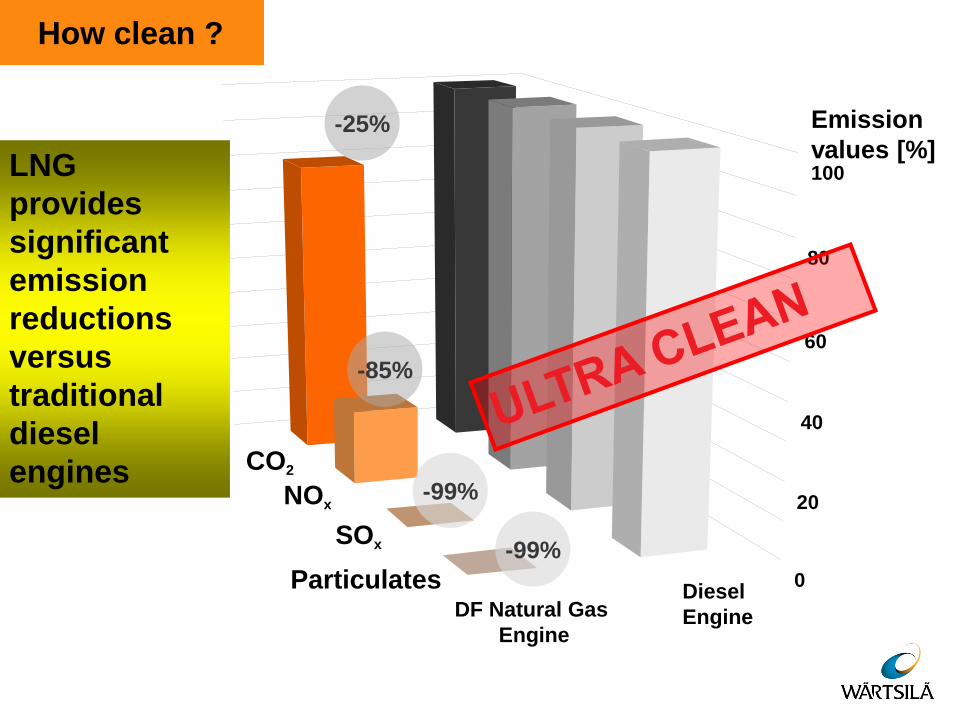
How clean ?
CO2
NOx
SOx
Particulates DF Natural Gas
Engine
Diesel
Engine
0
20
40
60
80
100
Emission
values [%] -25%
-85%
-99%
-99%
LNG
provides
significant
emission
reductions
versus
traditional
diesel
engines
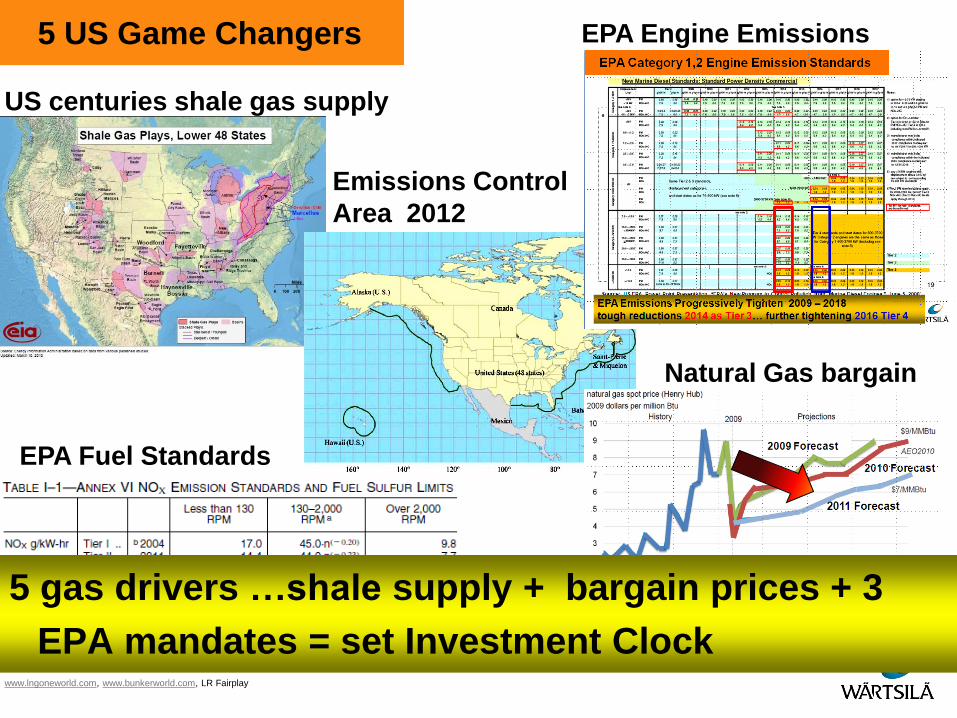
5 US Game Changers
Source:http://www.google.com/imgres?imgurl=http://www.canadiansailings.ca/canadiansailings/portals/0/April_13/emissions_area_map.jpg&imgrefurl=http://
EIA March 2010 Shale Gas Plays Lower 48 States
www.lngoneworld.com, www.bunkerworld.com, LR Fairplay
US centuries shale gas supply
Natural Gas bargain
Emissions Control
Area 2012
EPA Engine Emissions
EPA Fuel Standards
5 gas drivers …shale supply + bargain prices + 3
EPA mandates = set Investment Clock
Agenda
What ?
Why ?
Compelling Economic Savings
5 Drivers set Investment Clock
How ?
History Adoption
Integrated Gas Solutions
Conclusions
Recent Market Signals
The Future Decade for Gas
The Opportunities
Target Markets

Mark Twain
History does not
repeat itself, but it
does rhyme
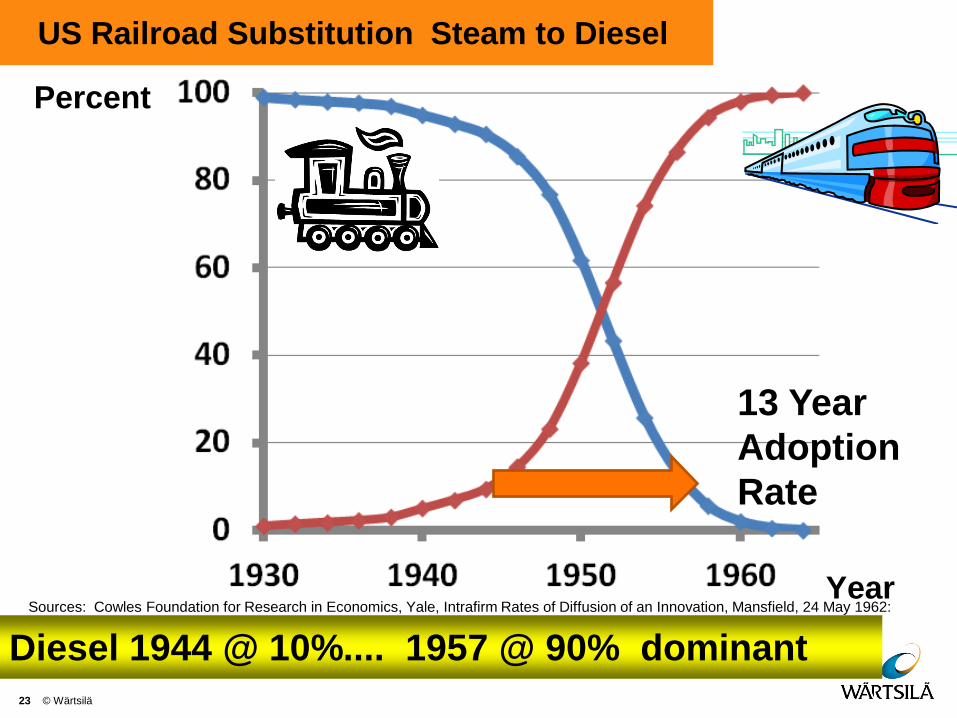
US Railroad Substitution Steam to Diesel
Percent
23 © Wärtsilä
Year
13 Year
Adoption
Rate
Sources: Cowles Foundation for Research in Economics, Yale, Intrafirm Rates of Diffusion of an Innovation, Mansfield, 24 May 1962:
adapted by JFH
Diesel 1944 @ 10%.... 1957 @ 90% dominant
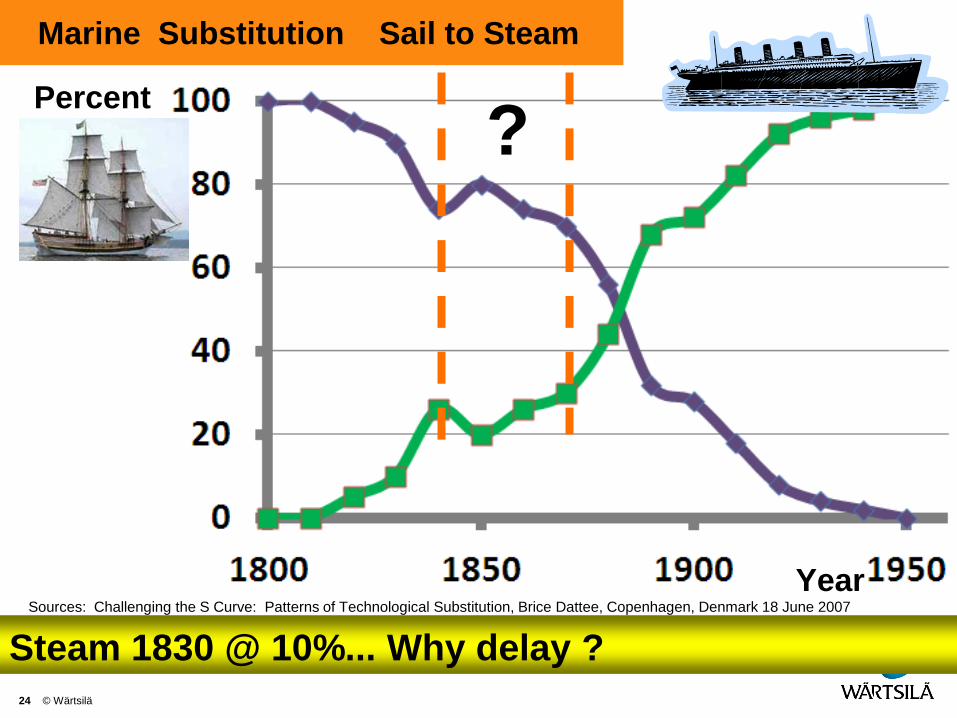
Marine Substitution Sail to Steam
Percent
24 © Wärtsilä
Year
?
Sources: Challenging the S Curve: Patterns of Technological Substitution, Brice Dattee, Copenhagen, Denmark 18 June 2007
adapted by JFH
Steam 1830 @ 10%... Why delay ?
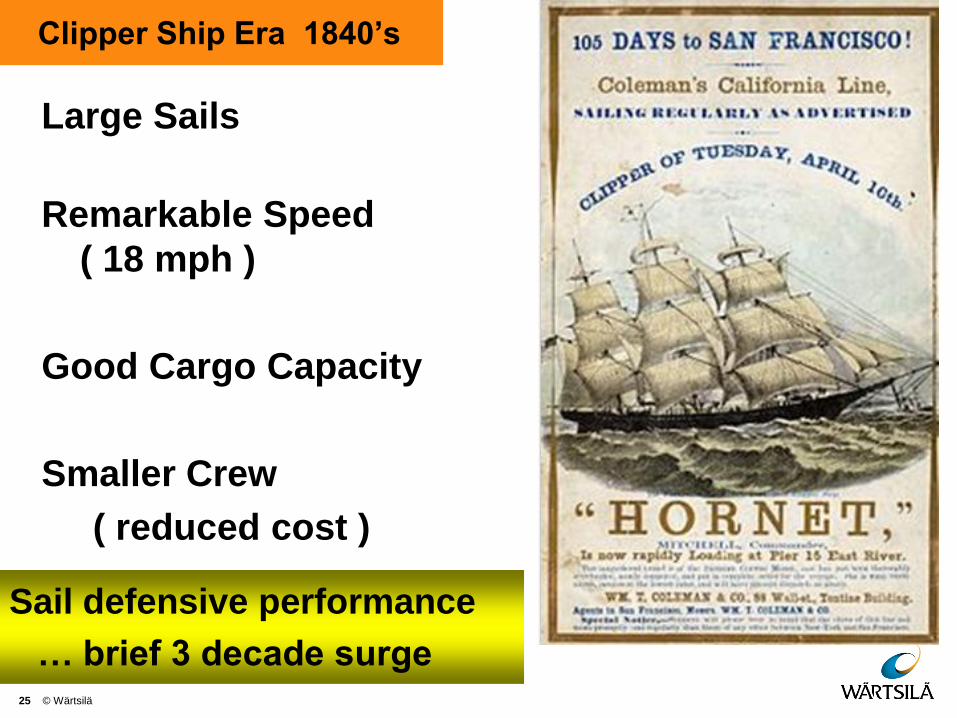
Clipper Ship Era 1840’s
Large Sails
Remarkable Speed
( 18 mph )
Good Cargo Capacity
Smaller Crew
( reduced cost )
25 © Wärtsilä
Sail defensive performance
… brief 3 decade surge
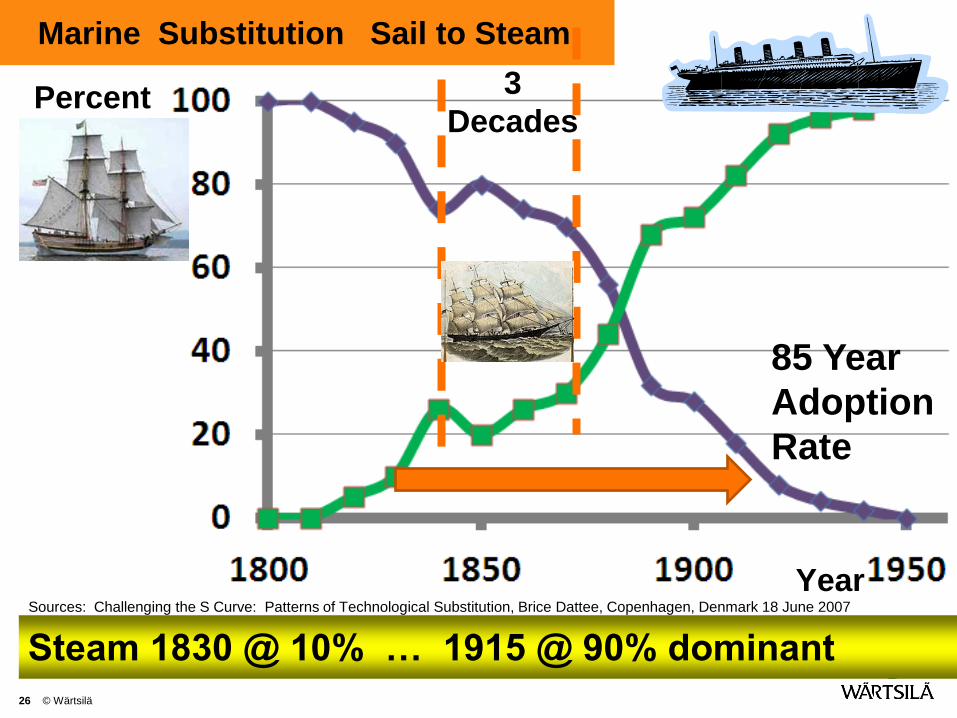
Marine Substitution Sail to Steam
Percent
26 © Wärtsilä
Year
3
Decades
85 Year
Adoption
Rate
Sources: Challenging the S Curve: Patterns of Technological Substitution, Brice Dattee, Copenhagen, Denmark 18 June 2007
adapted by JFH
Steam 1830 @ 10% … 1915 @ 90% dominant
Agenda
What ?
Why ?
Compelling Economic Savings
5 Drivers set Investment Clock
How ?
History Adoption
Integrated Gas Solutions
Conclusions
Recent Market Signals
The Future Decade for Gas
The Opportunities
Target Markets
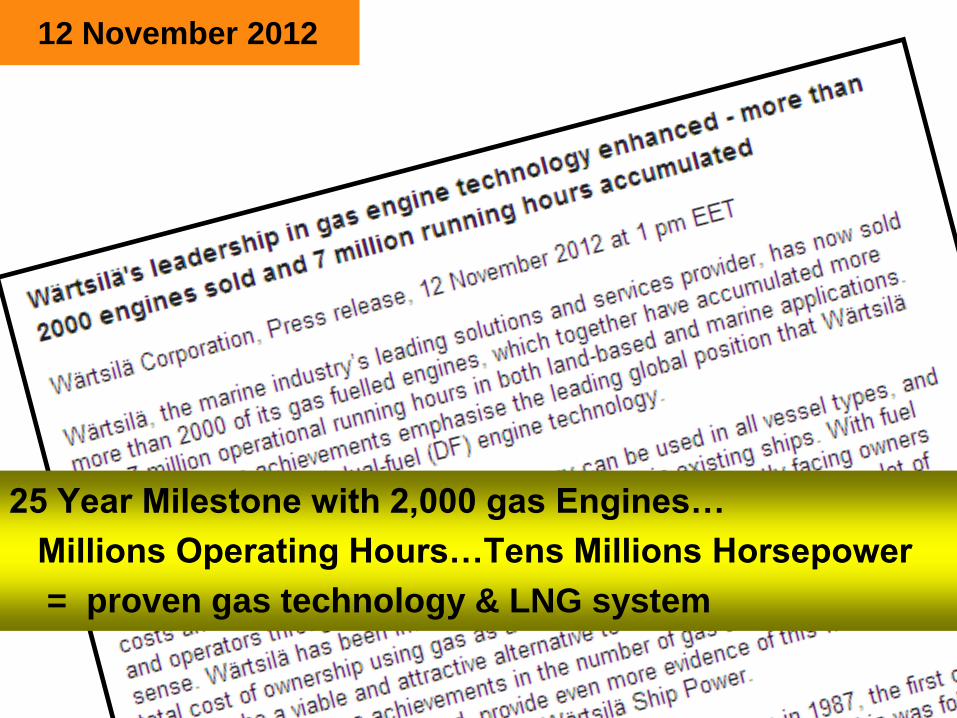
12 November 2012
25 Year Milestone with 2,000 gas Engines…
Millions Operating Hours…Tens Millions Horsepower
= proven gas technology & LNG system
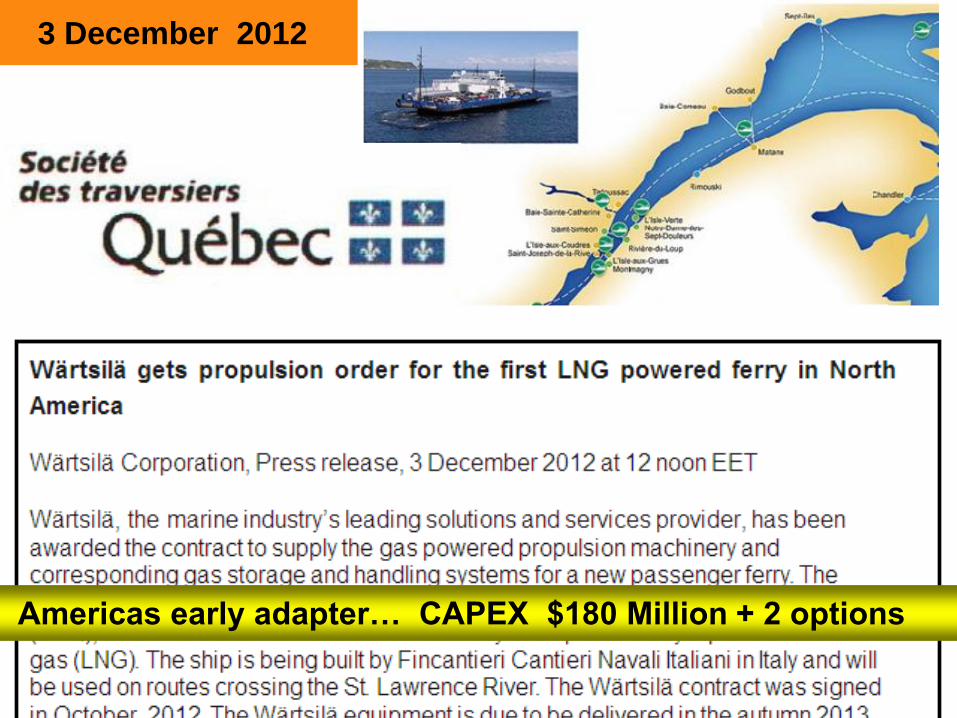
3 December 2012
03/05/2013
29
Americas early adapter… CAPEX $180 Million + 2 options
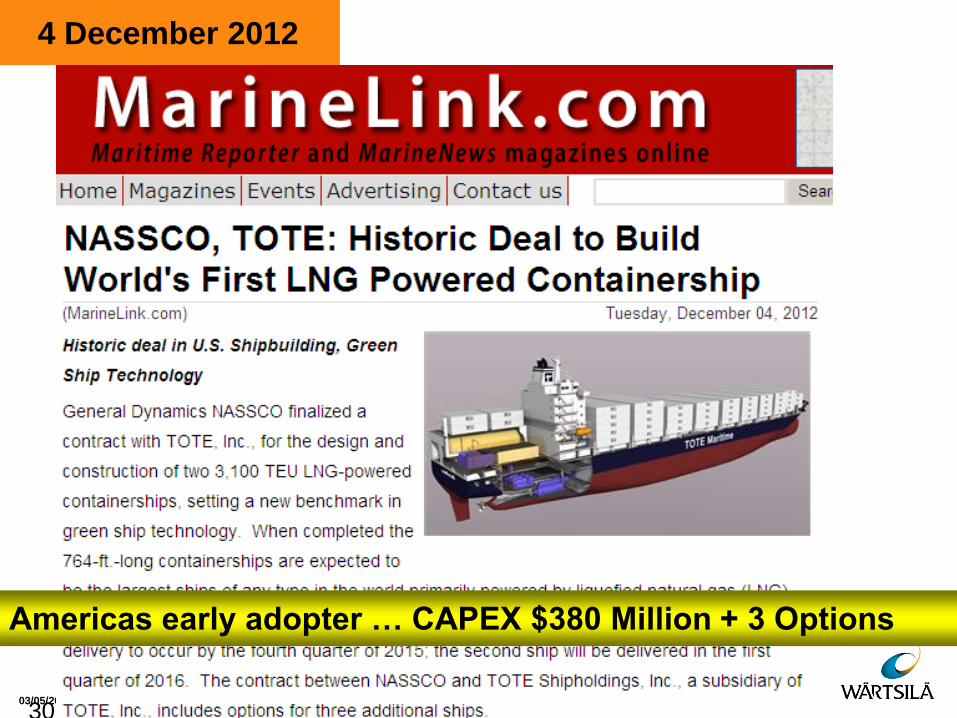
4 December 2012
03/05/2013
30
Americas early adopter … CAPEX $380 Million + 3 Options
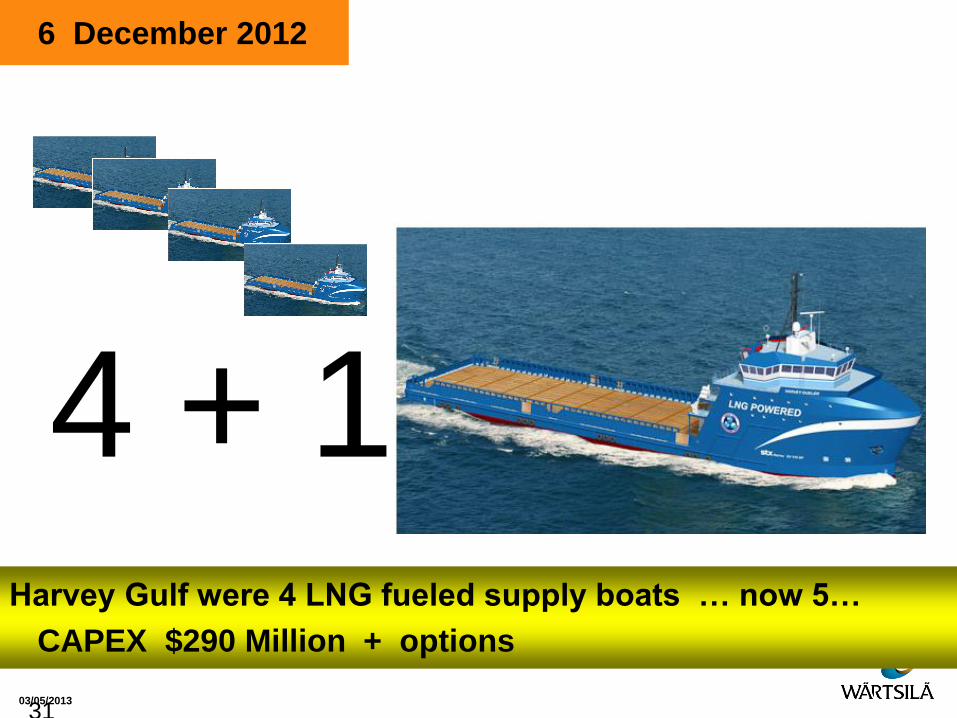
6 December 2012
03/05/2013
31
Harvey Gulf were 4 LNG fueled supply boats … now 5…
CAPEX $290 Million + options
4 + 1
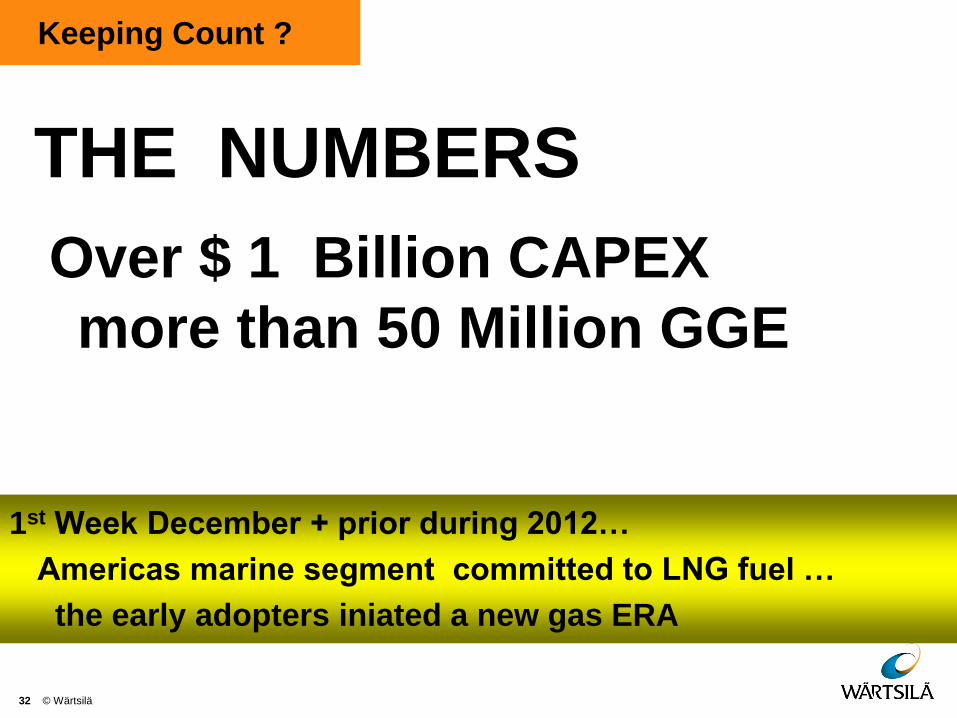
Keeping Count ?
THE NUMBERS
32 © Wärtsilä
1st Week December + prior during 2012…
Americas marine segment committed to LNG fuel …
the early adopters iniated a new gas ERA
Over $ 1 Billion CAPEX
more than 50 Million GGE
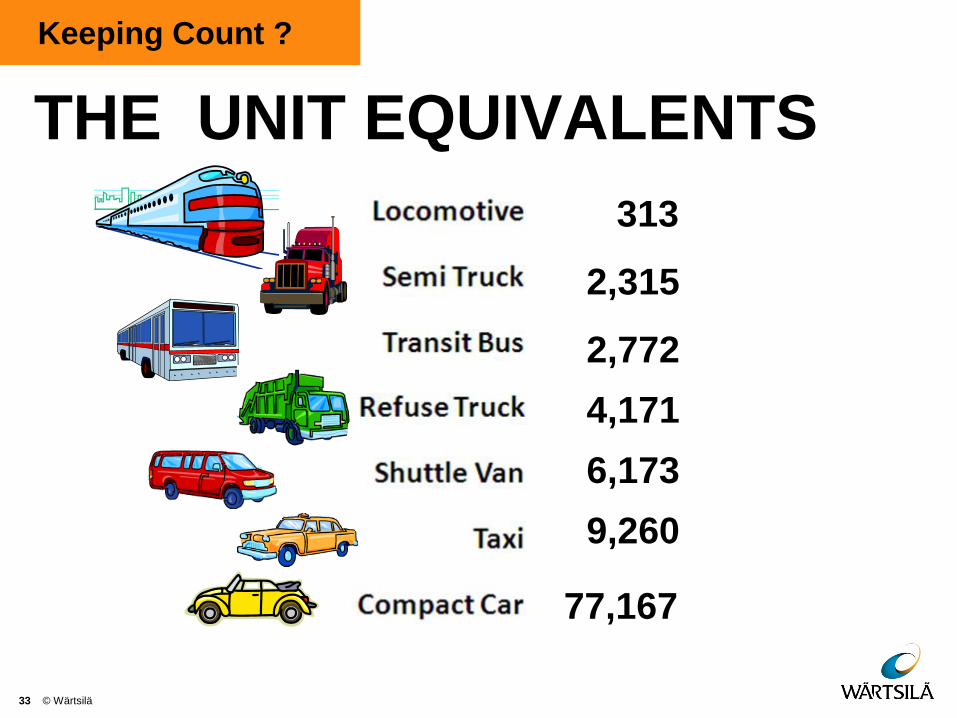
Keeping Count ?
THE UNIT EQUIVALENTS
33 © Wärtsilä
313
2,315
2,772
4,171
6,173
9,260
77,167
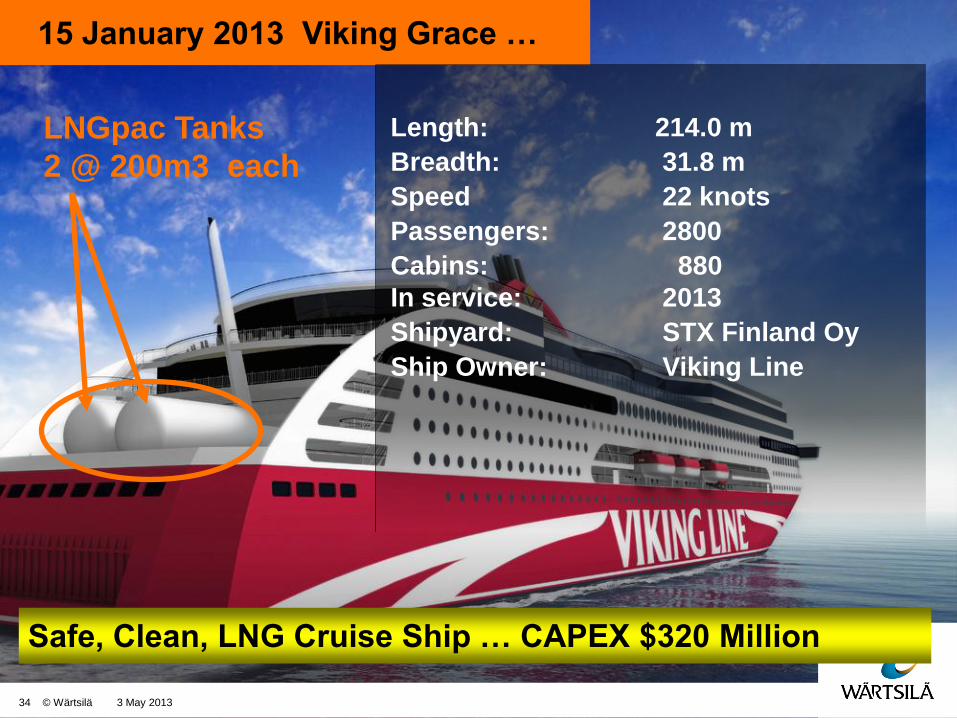
15 January 2013 Viking Grace …
3 May 2013 34 © Wärtsilä
Length: 214.0 m
Breadth: 31.8 m
Speed 22 knots
Passengers: 2800
Cabins: 880
In service: 2013
Shipyard: STX Finland Oy
Ship Owner: Viking Line
LNGpac Tanks
2 @ 200m3 each
Safe, Clean, LNG Cruise Ship … CAPEX $320 Million
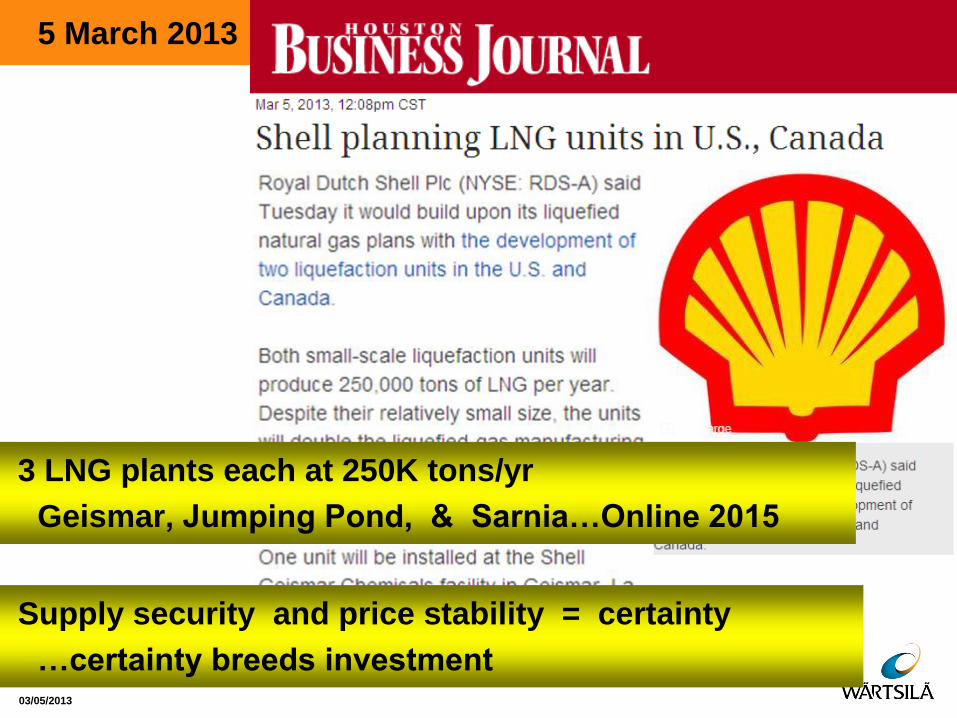
5 March 2013
03/05/2013
3 LNG plants each at 250K tons/yr
Geismar, Jumping Pond, & Sarnia…Online 2015
Source: http://www.bizjournals.com/houston/news/2013/03/05/shell-planning-lng-units-in-us-canada.html
Supply security and price stability = certainty
…certainty breeds investment
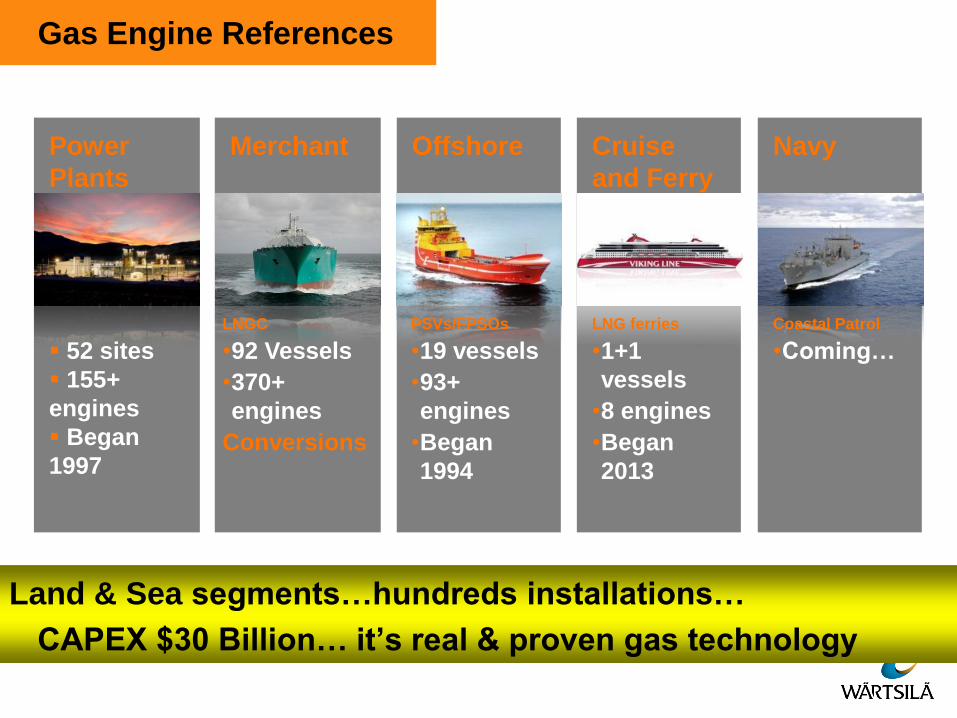
Gas Engine References
Land & Sea segments…hundreds installations…
CAPEX $30 Billion… it’s real & proven gas technology
Power
Plants
52 sites
155+
engines
Began
1997
Merchant
LNGC
•92 Vessels
•370+
engines
Conversions
Offshore
PSVs/FPSOs
•19 vessels
•93+
engines
•Began
1994
Cruise
and Ferry
LNG ferries
•1+1
vessels
•8 engines
•Began
2013
Navy
Coastal Patrol
•Coming…
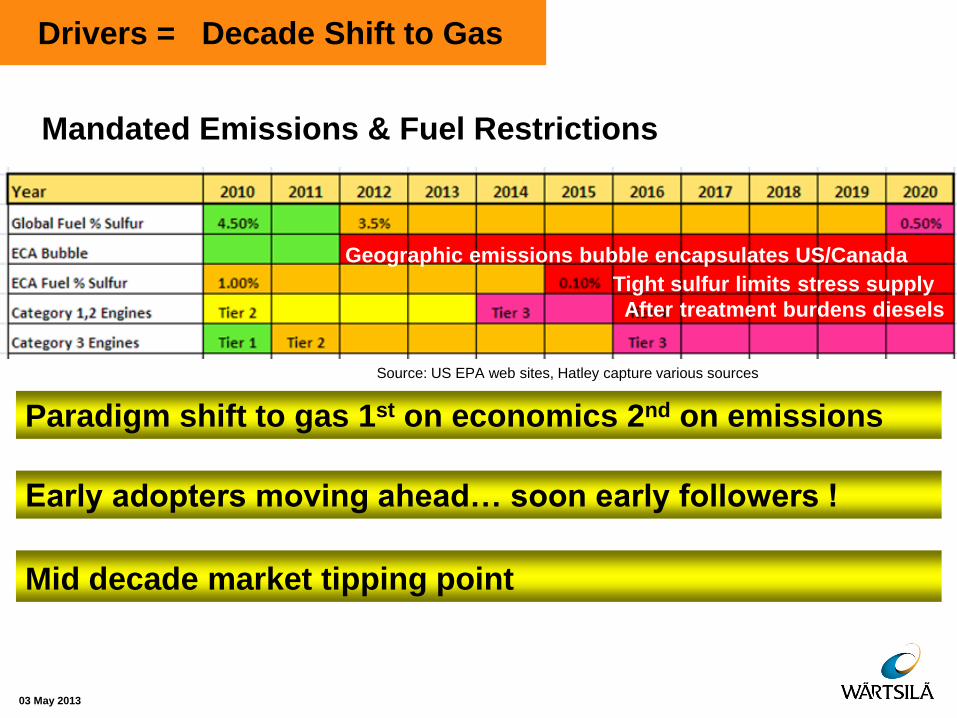
Drivers = Decade Shift to Gas
03 May 2013
Mid decade market tipping point
Source: US EPA web sites, Hatley capture various sources
Geographic emissions bubble encapsulates US/Canada
Tight sulfur limits stress supply
After treatment burdens diesels
Paradigm shift to gas 1st on economics 2nd on emissions
Early adopters moving ahead… soon early followers !
Mandated Emissions & Fuel Restrictions
Agenda
What ?
Why ?
Compelling Economic Savings
5 Drivers set Investment Clock
How ?
History Adoption
Integrated Gas Solutions
Conclusions
Recent Market Signals
The Future Decade for Gas
The Opportunities
Target Markets


![WARTSILA AUTONOMOUS VESSEL ADVANCES - NAMEPAWARTSILA AUTONOMOUS VESSEL ADVANCES 1 15.3.2018 [Presentation name / Author] Kevin Humphreys Business Development Manager - Americas Wartsila](https://static.fdocuments.us/doc/165x107/5e6a9f937b476068ef466113/wartsila-autonomous-vessel-advances-namepa-wartsila-autonomous-vessel-advances.jpg)

