Potential FCDRs from CGMS Baseline Missions Contributing ...
34
Potential FCDRs from CGMS Baseline Missions Contributing to the “Architecture for Climate Monitoring from Space” Joint CEOS-CGMS Working Group on Climate Darmstadt, 5-7 March 2014 Jérôme LAFEUILLE WMO Space Programme Rapporteur of CGMS WG III WMO/OBS/SAT www.wmo.int/sat
Transcript of Potential FCDRs from CGMS Baseline Missions Contributing ...
Potential FCDRs
from CGMS Baseline Missions Contributing to the
“Architecture for Climate Monitoring from Space”
Joint CEOS-CGMS Working Group on Climate
Darmstadt, 5-7 March 2014
Jérôme
LAFEUILLE
WMO Space Programme
Rapporteur
of CGMS WG III
WMO/OBS/SAT www.wmo.int/sat
Joint CEOS-CGMS Working Group on Climate 5-7/03/2014
Acknowledgements
Members
of the Expert Team on Satellite Systems (ET-SAT) who
provided
guidance: Jack A. Kaye
(Chair, NASA), G. Kroupnik
(CSA), A. Von Bargen
(DLR), I. Petiteville
(ESA), K. Holmlund
(EUMETSAT), R. Oki
(JAXA), Y. Izumikawa
(JMA), S. Boukabara
(NOAA), P. Veyre
(CNES), Z. Chen (CNSA)
B. Bizzarri
completed
the whole
analysis
of FCDRs
and missions
Sources
CGMS Baseline (2011)
GOSIC (Global Observing
System Information Center)
GCOS IP Satellite Supplement
2011 update (GCOS-154)
ECV inventory
OSCAR Space
module (www.wmo.int/oscar/space)
test footer 2

Joint CEOS-CGMS Working Group on Climate 5-7/03/2014
Outline
Background
CGMS Baseline, Climate Architecture and the ECV inventory
1st outcome: Specification of FCDRs
2nd outcome: Evaluation of satellite missions
- A step towards a Gap Analysis
Discussion
test footer 3

Joint CEOS-CGMS Working Group on Climate 5-7/03/2014
BACKGROUND
Joint CEOS-CGMS Working Group on Climate 5-7/03/2014 4

Joint CEOS‐CGMS Working Group on Climate 5‐7/03/2014
CGMS Baseline for long‐term
mission continuity (operational
or «sustained»)
The baseline
adopted
by CGMS‐39 (Oct
2011) includes:•GEO imagery
& IR sounding
•GEO lightning•LEO SSO imagery
VIS, IR & MW
•LEO IR, MW sounding•Scatterometer
missions for ocean
surface winds
•Radar altimetry
for ocean
surface topography
(constellation)•Radio‐occultation sounding
(T, Q, TEC) (constellation)
•Radiation Budget (Broadband upward
radiation and TSI)•Atmospheric
composition (contribution to…)
•High Res
and Narrow‐band VIS/IR (Vegetation, ocean
colour)•Multi‐angle IR radiometry

Joint CEOS‐CGMS Working Group on Climate 5‐7/03/2014
In the CGMS High‐level
Priority
Plan 2013‐2017:
«
Advancing
the Architecture for Climate
Monitoring»•
Take
an active role
in building up the architecture as a
contribution to GFCS•
Evaluate
the CGMS baseline
against
the logical
view
of the Climate
Architecture•
Extend
GSICS and SCOPE‐CM
•
Analyze
long‐term
datasets
, impact on climate
applications•
Establish
priorities
for multi‐decadal
ECV products
•
Contribute
to creation
of key
FCDRs
supporting
many
ECVs•
Ensure
systematic
contribution to the ECV inventory
•
Integrated
access
to climate
data records of CGMS members•
Common approach
to long‐term
data preservation
•
Work
with
CEOS

Joint CEOS-CGMS Working Group on Climate 5-7/03/2014
CGMS Baseline addresses
only
the sensing
level
(sensor, orbit, calibration)
End to end Architecture for Climate Monitoring from Space
I1
Earth Environment
O1
DecisionsDecision-Making (including
adaptation & mitigation policy
and planning)A5
ReportsSense Earth Environment
A1
Observations
Create and Maintain
Short/Medium Term Climate Data
RecordsA2
Create and Maintain Long-
term Climate Data Records
A3
Interim Climate Data Records
Operational Climate Monitoring
A4
Long-term Climate Variability &
Climate Change Analysis
A7
Climate DataRecords
Create and Maintain Higher-Level Climate Information (e.g. CDR
analysis or model-based reanalysis)
A8
Climate InformationRecords
Sensing Climate Record Creation Applications Decision-Making
Joint CEOS-CGMS Working Group on Climate 5-7/03/2014
Can the CGMS Baseline be a building block of the Architecture ?
Discuss
relevance/suitability
of the «Baseline missions»
to support generation
of climate
products
Investigate
the use of the Baseline to project
long-term
availability
of key
climate
capabilities
Derive
a preliminary
gap analysis
at
sensor
level
Evaluating the CGMS Baseline against the logical view of the Architecture

Joint CEOS-CGMS Working Group on Climate 5-7/03/2014
CGMS Baseline, Climate Architecture and ECV Product Inventory
9

Joint CEOS-CGMS Working Group on Climate 5-7/03/2014

Joint CEOS-CGMS Working Group on Climate 5-7/03/2014
Relevance of CGMS baseline missions for climate
0
5
10
15
20
25
30
35
40
GEO VIS
/I...
GEO IR S
...GEO IR
HS
GEO Light.
..GEO D
CSGEO S
EMGEO E
RBGEO H
R UV
GEO Sola
r VIS
/IR IM
IR S
ounde
rMW
SMW
ISca
ttALT
(SSO) ROS
ERB VIS
/IR
TSIAC
OC-Veg
HR VIS
/IR
IR dua
l-ang
le SEMMAGSola
rDCS
OSTM (ref)
ROS (cons
t)SARoth
er
Baseline missions
Mapping of the ECV inventory with the CGMS Baseline
ECV counRecords
Core baseline missions
GEO imagery
LEO IR/MW imagery
& sounding
Ocean
colour
and vegetation
CGMS baseline
missions SAR
Joint CEOS-CGMS Working Group on Climate 5-7/03/2014
CGMS Baseline, FCDRs and ECV Product Inventory
ECV inventory
shows large contribution of CGMS Baseline missions: missions highly
relevant for climate
(record length)
However
the way
the CGMS baseline
is
defined
is
too
generic
to inform
the inventory
on future capability
for ECV production
Outcome
of CGMS-41:
To review
the categorisation
of missions in the CGMS Baseline (…)
(…) to support the high level mapping of future missions with FCDRs (CGMS Action 41.42)
To define
a list
of FCDRs
that
CGMS Members
can
commit to provide
on a sustained
basis building on the CGMS Baseline (…)
to communicate
to the CEOS-CGMS working
group on climate
(CGMS Action 41.43)

Joint CEOS-CGMS Working Group on Climate 5-7/03/2014
CGMS Baseline, FCDRs and ECV Product Inventory (Cont.)
Architecture should give guidance on space segment evolution
Long-lead
programme decisions
should
be
informed
by long-term
gap analysis
Product generation
plans are not always
defined
20 years
ahead, potentially
involve
many
players
Long-term
satellite plans better
known
at
sensor
level
than
at
product
level
FCDRS (e.g. radiances) often
support many
different
ECV products
FCDRs
have their
own
value when
assimilated
in climate
models
(CGMS 41.12) …proposes
to establish
an inventory
of FCDRs
in addition to, and in consistency
with, the ECV product
inventory

Joint CEOS-CGMS Working Group on Climate 5-7/03/2014
Specification of FCDRs
14
The objective of this part of the study is to specify Fundamental Climate Data Records (FCDR) that the CGMS baseline missions can provide in support of the ECVs.

Joint CEOS-CGMS Working Group on Climate 5-7/03/2014 15

Joint CEOS-CGMS Working Group on Climate 5-7/03/2014test footer 16
ECV
Global Products requiring Satellite
Observations
Fundamental Climate Data Records required for Product
Generation (from past, current and future
missions)
Product Numbers (IP-
ReferenceActions)
Surface Wind Speed and Direction
Surface wind retrievals Passive microwave radiances and radar
backscatter A.1 (A11)
Precipitation
Estimates of liquid and solid precipitation, derived from specific instruments and provided by composite products
Passive microwave radiances Geostationary VIS/NIR/IR radiances
A.2 (A6, A8, A9, A10
Upper-air Temperature
Upper-air temperature retrievals Temperature of deep atmospheric layers
Passive microwave and IR radiances GNSS radio occultation bending angles
A.3.1 A.3.2 (A20, A21)
Upper-air Wind Speed and Direction
Upper-air wind retrievals VIS/IR imager radiances
Doppler wind lidar A.4 (A11)
Water Vapour
Total column water vapour Tropospheric and lower-stratospheric profiles of water vapour Upper tropospheric humidity
Passive microwave radiances UV/VIS imager radiances IR and microwave radiances Limb soundings
A.5.1 A.5.2 A.5.3 (A7, A21, A22, A26)
Cloud Properties
Cloud amount, top pressure and temperature, optical depth, water path and effective particle radius
VIS/IR imager radiances IR and microwave radiances Lidar
A.6.1 A.6.2 A.6.3 A.6.4 A.6.5 A.6.6 (A23, A24)
Earth Radiation
Budget
Earth radiation budget (top-of-atmosphere and surface) Total and spectrally-resolved solar irradiance
Broadband radiances Spectrally-resolved solar irradiances Geostationary multispectral imager radiances
A.7.1 A.7.2 (A14, A25)
Carbon Dioxide, Retrievals of greenhouse gases, such as A 8 1
Table 6: Overview of Products – Atmosphere (From GCOS-154)

Joint CEOS-CGMS Working Group on Climate 5-7/03/2014
Approach followed for each ECV observable from space
17
Candidate
missions
in the CGMS
baseline
Candidate
missions
in the CGMS
baseline
« FCDR »
and specific
sensor
features
« FCDR »
and specific
sensor
features
ECVECV Performance criteria
Performance criteria
ECV
ECV
products
Mission 1
Mission 2
Mission 3
Feature
x
Feature
y
Baseline
Enhanced/
Alternative
Fallback

Joint CEOS-CGMS Working Group on Climate 5-7/03/2014
Upper air temperature
test footer 18
ID GCOS ECV and FCDR CGMS baseline ID FCDR specific features ID Performance criteria 1. Upper-air temperature
FCDR as defined in GCOS-154: - Passive microwave and IR
radiances - GNSS radio occultation
bending angles
LEO / IR hyper-spectral sounders
1.1 IR spectra to cover the CO2 bands 4-5 m and 13-15 m - Resolving power / > 1000 - Radiometric accuracy NET < 0.2 K @ 280 K
1.1.1 Baseline: IR spectra to cover the CO2 bands in MWIR and TIR - The high spectral resolution provides high vertical
resolution of the retrieved variable - The TIR band is more sensitive to mid- and high layers - The MWIR band is more sensitive to the lower
troposphere 1.1.2 Fallback: IR spectra to cover the CO2 band in TIR
- Missing sensitivity to the lower troposphere 1.1.3 Extreme fallback: radiometer instead of spectrometer
- Coarse vertical resolution due to poor spectral resolution GEO / IR Sounding (hyperspectral on some locations)
1.2 Frequent IR spectra to cover the CO2 bands 4-5 m and 13-15 m - Resolving power / > 1000 - Radiometric accuracy NET < 0.2 K @ 280 K - Image cycle < 30 min
1.2.1 Baseline: IR spectra to cover the CO2 bands in MWIR and TIR - The high spectral resolution provides high vertical
resolution of the retrieved variable - Frequent observation of the temperature (and humidity)
profile enables stability change monitoring 1.2.2 Fallback: IR radiometry in about 20 narrow channels
including the CO2 bands in MWIR and TIR - Coarse vertical resolution due to poor spectral resolution
LEO / MW sounders
1.3 MW radiances for fine coverage of the O2 band(s) 50-60 GHz and possibly 118 GHz - Well over 10 very-narrow channels in the 50-60 GHz band, less in the 118 GHz band - Radiometric accuracy NET < 0.2 K, SNR > 100 - Supporting channels around 23 GHz (water vapour), and 37 and 90 GHz (windows)
1.3.1 Basic: 10 to 15 channels in the O2 band 50-60 GHz, with supporting channels for water vapour correction (~23 GHz) and in window regions (37 and ~90 GHz) - For nearly-all-weather temperature sounding
1.3.2 Alternative: exploitation of the O2 band around 118 GHz, with supporting water vapour and window channels - More sensitive to the higher atmospheric layers - More affected by clouds, especially ice
1.3.3 Optimum: both O2 bands 50-60 GHz and ~118 GHz exploited, with supporting water vapour and window channels - Improved vertical resolution of the retrieved variable
Radio occultation 1.4 Sequence of the measurements of the bending angle of the signal received at the LEO in respect of the line-of sight LEO - GNSS satellite - Capability of tracking both rising occultations (fore-) and setting (aft-) - Capability of capturing signals from more constellations of the GNSS system - Mission possibly implemented by more satellites in a dedicated constellation - Two frequencies needed for ionospheric correction (and possible observation) - Supported by a network of fiducial ground stations
1.4.1 Basic: capability to track the satellites of one constellation of the GNSS system during occultation - Capability to capture 200 to 700 events/day, depending on
whether tracking is performed both fore- and aft- or only fore- or aft
1.4.2 Enhanced: capability of exploiting more GNSS constellations (GPS, GLONASS, Galileo, Beidou)
LEO IR hyper- spectral
GEO IR sounder some hyper- spectralLEO MW sounder
Radio occulta tion
FCDR and specific
sensor
feature Performance criteriaBaselineGCOS-154
ECV & FCDR
Upper air temperature
FCDR:Passive MW and IR radiances GNSS RO bending angles
MW radiances for fine coverage
of the O2
bands 50-60 GHz and if possible ~118 GHz
-
Radiometric
accuracy
NE∆T < 0.2 K, SNR >100 -
Supporting
channels
around
23 GHZ (water
vapour), and 37 and 90 GHz (window)
Optimum: both O2 bands 50-60 GHz and ~118 GHz with supporting water vapour and window channels - improved vertical resolution of retrieved variable

Joint CEOS-CGMS Working Group on Climate 5-7/03/2014
Sea Surface Temperaturebaseline FCDR and specific sensor features Performance criteria
LEO / Multi- spectral VIS/IR imagery
IR radiances to cover windows at 3.7, 11 and 12 mm-Bandwidths < 1.0 mm at 11 and 12 mm, < 0.2 mm at 3.7 mm-Radiometric accuracy NEDT < 0.1 K @ 300 K
Basic: split TIR window 11/12 mm-Splitting the main TIR window enables correcting for water vapour contamination
Enhanced: addition of MWIR window at 3.7 mm-The 3.7 mm window is more transparent and less sensitive to cloud contamination
Optimum: addition of split MWIR window 3.7/4.0 mm-Splitting the main MWIR window enables correcting for CO2 and air temperature contamination
GEO / Advanced VIS/IR imagery
Frequent IR radiances to cover windows at 3.7, 11 and 12 mm-Bandwidths < 1.0 mm at 11 and 12 mm, < 0.2 mm at 3.7 mm-Radiometric accuracy NEDT < 0.1 K @ 300 K-Image cycle < 30 min
IR radiances for frequent coverage of windows at 3.7, 11 and 12 mm-Spitting the main TIR window enables correcting for water vapour contamination-The 3.7 mm window is more transparent and less sensitive to cloud contamination-Frequent coverage is useful for SST diurnal variations in coastal zone, and filtering from moving clouds
Fallback: missing the MWIR window 3.7 mm-Less accurate surface temperature
LEO / IR hyper- spectral sounding
IR spectra to cover the window regions around 3.7 and 11 mm-Resolving power l/Dl > 1000-Radiometric accuracy NEDT < 0.2 K @ 300 K
Baseline: IR spectra to cover window regions around 3.7 and 11 mm-More numerous and more transparent windows available in spectrally resolved radiances-Benefit of stretching the range from 3.7 to over 4 mm for CO2 and air temperature correction
Fallback: IR spectra to cover the window region around 11 mm-Spectral resolution less effective in the TIR window where the water vapour contamination is due to continuum
GEO / IR sounding (hyper- spectral on some locations)
Frequent IR spectra to cover the window regions around 3.7 and 11 mm-Resolving power l/Dl > 1000-Radiometric accuracy NEDT < 0.2 K @ 300 K-Image cycle < 60 min
Baseline: IR spectra for frequent coverage of window regions around 3.7 and 11 mm-Same features as from the LEO baseline, but capturing SST diurnal variation and filtering from moving clouds
Fallback: IR spectra for frequent coverage of the window region around 11 mm-Missing the advantages of the 3.7 mm band
Minimum: IR radiances for frequent coverage of windows at 3.7, 11 and 12 mm-Missing the advantage of spectrometry in providing more numerous and more transparent windows
IR dual- angle view imagery
IR radiances to cover windows at 3.7, 11 and 12 mm.Viewing angles(nadir/45°)Dl < 1.0 at 11 & 12 mm, < 0.3 at 3.7 mm-Radiometric acc.NEDT < 0.1 K @ 300 K
Conical oblique scanning for dual-angle view with MWIR/TIR channels at 3.7, 11 and 12 mm-Improved corrections for water vapour and other atmospheric effects by differential optical path depth
LEO / MW imagery, some polarimetri c
MW radiances in the 6.3-7.3 GHz range at 1 to 4 dual-polarised frequencies-Bandwidths Dn < 200 MHz-Radiometyric accuracy NEDT < 0.5 K
Basic: conical scanning, one frequency substantially lower than 7 GHz, 2 polarisations-All-weather capability, maximum sensitivity to SST in C-band, 2 polarisations needed to account for roughness
Enhanced: additional frequency / 2-pol slightly above 7 GHz-The additional frequency mitigates the effect of electromagnetic interferences
O i 4 f i / 2 l i h 6 3 7 3 GH
Frequent
IR radiances covering
windows
at
3.7, 11 & 12 µm
-
Bandwidths <1.0 µm at 11-12 µm and <0.2 µm at 3.7 µm
-
Radiometric accuracy NEDT<0.1 K@300K
-
Image cycle <30min
GEO advanc ed VISIR imagery

Joint CEOS-CGMS Working Group on Climate 5-7/03/2014
First report in a nutshell
The 27-page report addresses:
39 ECVs
132 combinations
of ECV and «
Baseline missions
»
173 «
FCDR
»
with
specific
sensor
features
275 classes of sensors
to produce
these
FCDRs
Indicates
which
kind
of FCDR can
be
produced
from
CGMS Baseline missions, and the impact of sensor
features
on retrieval
performance
Prepares
the inventory
of FCDRs
supported
by CGMS baseline
missions (CGMS 41.12)
Click to open the WORD file

Joint CEOS-CGMS Working Group on Climate 5-7/03/2014
Contribution to Gap Analysis
This second part of the study
links the types of FCDR identified in the 1st part with the OSCAR database (www.wmo.int/oscar/space).It covers
past*, current and planned missions, either
operational
or sustained.
(*) Past
missions were
included
if active in the 1990s and/or there
is
some
continuity
between
these
heritage
data and newer
series.
21

Joint CEOS‐CGMS Working Group on Climate 5‐7/03/2014
OSCAR timeline
of current/planned
sensors
with
potential capability
(by design) to support a given
variable
Example: sea
level
observations

Joint CEOS-CGMS Working Group on Climate 5-7/03/2014
Approach followed for each ECV observable from space
23
Candidate
missions
in the CGMS
baseline:
Candidate
missions
in the CGMS
baseline:
« FCDR »
with
specific
sensor
features
« FCDR »
with
specific
sensor
features
ECVECV Performance criteria
Performance criteria
ECV
Mission 1
Mission 2
Mission 3
Feature
x
Feature
y
Baseline
Enhanced
Fallback
Relevant Past/Present/
Future Missions
Sat/Instr
Sat/Instr
Sat/Instr
(173 «
FCDR») (275 classes)(39 ECVs) (132 missionsxECV) > 2000 missions

Joint CEOS-CGMS Working Group on Climate 5-7/03/2014
Missions with potential to provide following FCDR type: Ku-band or Ka-band altimetric dataSpecific Instrument Satellite(s) Agency Programmatics Instrument main characteristics
features Status Nature Launch EOL Channel IFOV Swath
Basic ALT HY-2 A to D NSOAS Current Continuous 2011 ³
2022 2 16 km 16 km
Poseidon-3 JASON-2 CNES Current Continuous 2008 ³
2015 2 30 km 30 km
Poseidon-3B JASON-3 CNES Planned Continuous ³
2015 ³
2020 2 30 km 30 km
Altimeter SWOT NASA Planned R&D ³
2020 ³
2023 2 25 km 25 km
GFO-RA GFO NASA Historical Continuous 1998 2008 1 25 km 25 km
GRA GEOSat DoD Historical Continuous 1985 1990 1 25 km 25 km
NRA TOPEX-Poseidon NASA Historical Continuous 1992 2005 2 30 km 30 km
Poseidon-2 JASON-1 CNES Historical Continuous 2001 2013 2 30 km 30 km
RA ERS 1 and 2 ESA Historical Continuous 1991 2011 1 20 km 20 km
RA-2 Envisat ESA Historical Continuous 2002 2012 2 20 km 20 km
SSALT TOPEX-Poseidon CNES Historical Continuous 1992 2005 1 25 km 25 km
Enhanced SIRAL CryoSat-2 ESA Current R&D 2010 ³
2014 1 1.94 km 1.94 km
SIRAL JASON-CS A&B,
SRAL Sentinel-3 A&B ESA Planned Operational ³
2014 ³
2031 2 2.45 km 2.45 km
Alternative AltiKa SARAL CNES Current R&D 2013 ³
2018 1 10 km 10 km
Development SWIM CFOSAT CNES Planned R&D ³
2014 ³
2017 1 18 km s.s.p. 180 km
KaRIN SWOT NASA Considered R&D ³
2020 ³
2023 1 0.22 km s.s.p. 120 km
Specific features
Instrument
Satellite
Status, launch date & EOL
Channels, IFOV, Swath

Joint CEOS-CGMS Working Group on Climate 5-7/03/2014
A snapshot of this second report
Results
consolidated
in one EXCEL table per domain:
Atmosphere
(~ 1100 records)
Ocean
(~ 260 records)
Terrestrial
(~ 1200 records)
Identification of satellite missions with
programmatic
status, period
of availability, and main instrument characteristics
Sorted
by performance class based
on instrument design features
and orbit
type
Click to open the EXCEL file

Joint CEOS-CGMS Working Group on Climate 5-7/03/2014
Quality evaluation
A tentative quality
index can
be
calculated
from
sensor
design characteristics
…however
very
questionable
!
Quality
depends
on multiple criteria:
Uncertainty
(Precision, Bias)
Spatial/temporal resolution
Data record length
Data record completeness
Stability
over a decade
Actual
dataset
availability, maturity, and accessibility….
Quality
assessment
requires
dedicated
case-by-case analysis
To be
evaluated
against
user needs: some
lower
quality
can
be
acceptable depending
on how they
are used
26

Joint CEOS-CGMS Working Group on Climate 5-7/03/2014
Discussion
27

Joint CEOS‐CGMS Working Group on Climate 5‐7/03/2014
Gap analyses at
both
ends
ECV Product Inventory
Actual ECV product
generation
GAPS ?
GAPS ?Space-based Sensor Inventory
Potential for FCDRs
in support of ECV product
generation

Joint CEOS-CGMS Working Group on Climate 5-7/03/2014
Conclusion
This study
identifies types of FCDR and the potential to deliver
such
FCDRs
from
past/present/future missions
Contribution to the FCDR inventory
and Gap Analysis, however:
Sensor
availability
& adequacy
are necessary
but not sufficient
FCDR availability
and maturity
to be
stated
by agencies
Quality
evaluation
requires
careful
assessment
Long-term
continuity:
Need
to ensure
consistency
of climate
records over time
As technology
progresses, new generation
sensors
provide
different
measurements
FCDRs
should
be
evaluated
with
consideration
of their
compatibility with
relevant heritage
instrument data records

Joint CEOS-CGMS Working Group on Climate 5-7/03/2014

Joint CEOS-CGMS Working Group on Climate 5-7/03/2014
Use of the term « FCDR »
31
Fundamental Climate Data Record (FCDR) denotes a well-
characterized, long-term data record, usually involving a series of instruments, with potentially changing measurement approaches, but with overlaps and calibrations sufficient to allow the generation of products that are accurate and stable in both space and time to support climate applications
Example: consistent series of calibrated radiances
Thematic Climate Data Record (TCDR) denotes the counterpart of the FCDR in geophysical space. It covers one geophysical variable.
In this presentation we will also use “FCDR” in a generic way for “a certain type of FCDRs”
Trend: N10 = -0.39 K Dec-1, N11 = 0.58 K Dec-1
N12 = 0.43 K Dec-1, N14 = 0.31 K Dec-1
248
249
250
251
252
253
1987 1989 1991 1993 1995 1997 1999 2001 2003
NOAA10
NOAA11
NOAA12
NOAA14
Linear (NOAA10)
Linear (NOAA11)
Linear (NOAA12)
Linear (NOAA14)

Joint CEOS-CGMS Working Group on Climate 5-7/03/2014
Table 7: Overview of Products – Oceans (From GCOS-154)
32
ECV
Global Products requiring Satellite
Observations
Fundamental Climate DataRecords required for Product
Generation (from past, current and future
missions)
ProduNumbers
RefereActio
Sea-surface Temperature
Integrated sea-surface temperature analyses based on satellite and in situ data records
Single and multi-view IR and microwave imager radiances
O.1 (O4, O7, O8
Sea-surface Salinity
Datasets for research on identification ofchanges in sea-surface salinity Microwave radiances O.2
(O12)
Sea Level Sea-level global mean and regional variability Altimetry O.3
(O10)
Sea State Wave height, supported by other measures of sea state (wave direction, wavelength, time period)
Altimetry O.4 (O16)
Sea Ice
Sea-ice concentration/extent/edge, supported by sea-ice thickness and sea- ice drift
Passive and active microwave and visible imager radiances, supported by Synthetic Aperture Radar (SAR) altimetry
O.5 (O18, O19,
Ocean Colour
Ocean colour radiometry – water leaving radiance Oceanic chlorophyll-a concentration, derived from ocean colour radiometry
Multispectral VIS imager radiances O.6.1, O.6.2(O15, O23)

Joint CEOS-CGMS Working Group on Climate 5-7/03/2014
Table 8: Overview of Products – Terrestrial (From GCOS-154)
test footer 33
ECV or
supporting variable19
Global Products requiring Satellite
Observations
Fundamental Climate DataRecords required for Product
Generation (from past, current and future
missions)
Product Numbers (IP-10 Reference Actions)
Lakes
Lake levels and areas of lakes in theGlobal Terrestrial Network for Lakes (GTN-L)
VIS/NIR imager radiances, and radar imager radiances Altimetry
T.1.1 T.1.2 (T8)
Snow Cover
Snow areal extent, supplemented by snow water equivalent Moderate-resolution VIS/NIR/IR and
passive microwave imager radiances T.2 (T16)
Glaciers and Ice
Caps
2D vector outlines of glaciers and ice caps(delineating glacier area), supplemented by digital elevation models for drainage divides and topographic parameters
High-resolution VIS/NIR/SWIR optical imager radiances, supplemented by microwave InSAR and along-track optical stereo imaging
T.3.1 T.3.2 (T17)
Ice Sheets
Ice-sheet elevation changes, supplemented by fields of ice velocity and ice-mass change
Radar and laser altimetry, supplemented by:SAR, gravity
T.4 (T20)
Albedo Reflectance anisotropy (BRDF), black-skyand white-sky albedo
Multispectral and multiangular imagerradiances
T.5(T3, T24, T25)
Land Cover
Moderate-resolution maps of land-cover type High-resolution maps of land-cover type, for the detection of land-cover change
Moderate-resolutionmultispectralVIS/NIR imager radiances High-resolution multispectral VIS/NIR imager radiances, supplemented by radar
T.6.1 T.6.2 (T26, T27, T28)
FAPAR Maps of the Fraction of Absorbed
Photosynthetically Active Radiation VIS/NIR multispectral imager radiances T.7 (T3, T29, T31)
LAI Maps of Leaf Area Index VIS/NIR multispectral imager radiances T.8(T3, T30, T29,T31)
Biomass Regional and global above-ground forestbiomass Long-wavelength radar and lidar T.9
(T32)
Fire Disturbance Maps of burnt area, supplemented by active-fire maps and fire-radiative power
VIS/NIR/SWIR/TIR moderate-resolution multispectral imager radiances
T.10(T35, T36, T37, T38, T39)
Soil Moisture Research towards global near-surface soil-moisture map (up to 10cm soil depth) Active and passive microwave T.11
(T13, T14)
Land-surface Temperature
Land-surface temperature records to support generation of land ECVs
High-resolution IR radiances fromgeostationary and polar-orbiting satellites; Microwave radiances from polar-orbiting satellites
T.12 (T5, T13, T23, T27, T28)
Joint CEOS-CGMS Working Group on Climate 5-7/03/2014
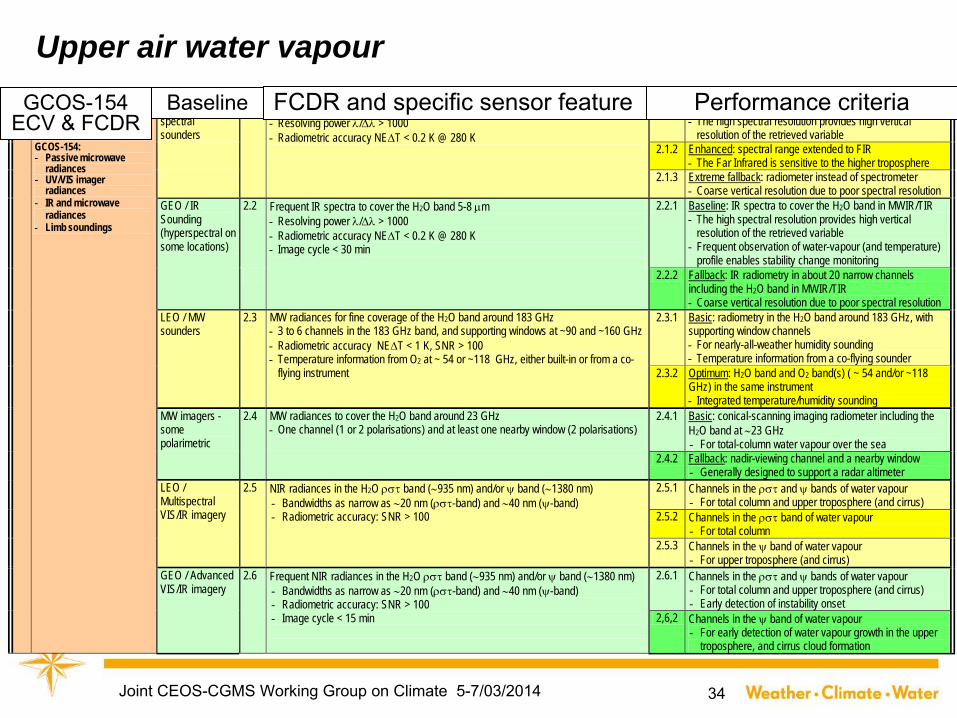
Upper air water vapour
34
2. Upper-air water vapour FCDR as defined in GCOS-154: - Passive microwave
radiances - UV/VIS imager
radiances - IR and microwave
radiances - Limb soundings
LEO / IR hyper-spectral sounders
2.1 IR spectra to cover the H2O bands 5-8 m and possibly 13-20 m - Resolving power / > 1000 - Radiometric accuracy NET < 0.2 K @ 280 K
2.1.1 Basic: IR spectra to cover the H2O band in MWIR and TIR - The high spectral resolution provides high vertical
resolution of the retrieved variable 2.1.2 Enhanced: spectral range extended to FIR
- The Far Infrared is sensitive to the higher troposphere 2.1.3 Extreme fallback: radiometer instead of spectrometer
- Coarse vertical resolution due to poor spectral resolution GEO / IR Sounding (hyperspectral on some locations)
2.2 Frequent IR spectra to cover the H2O band 5-8 m - Resolving power / > 1000 - Radiometric accuracy NET < 0.2 K @ 280 K - Image cycle < 30 min
2.2.1 Baseline: IR spectra to cover the H2O band in MWIR/TIR - The high spectral resolution provides high vertical
resolution of the retrieved variable - Frequent observation of water-vapour (and temperature)
profile enables stability change monitoring 2.2.2 Fallback: IR radiometry in about 20 narrow channels
including the H2O band in MWIR/TIR - Coarse vertical resolution due to poor spectral resolution
LEO / MW sounders
2.3 MW radiances for fine coverage of the H2O band around 183 GHz - 3 to 6 channels in the 183 GHz band, and supporting windows at ~90 and ~160 GHz - Radiometric accuracy NET < 1 K, SNR > 100 - Temperature information from O2 at ~ 54 or ~118 GHz, either built-in or from a co-
flying instrument
2.3.1 Basic: radiometry in the H2O band around 183 GHz, with supporting window channels - For nearly-all-weather humidity sounding - Temperature information from a co-flying sounder
2.3.2 Optimum: H2O band and O2 band(s) ( ~ 54 and/or ~118 GHz) in the same instrument - Integrated temperature/humidity sounding
MW imagers - some polarimetric
2.4 MW radiances to cover the H2O band around 23 GHz - One channel (1 or 2 polarisations) and at least one nearby window (2 polarisations)
2.4.1 Basic: conical-scanning imaging radiometer including the H2O band at 23 GHz - For total-column water vapour over the sea
2.4.2 Fallback: nadir-viewing channel and a nearby window - Generally designed to support a radar altimeter
LEO / Multispectral VIS/IR imagery
2.5 NIR radiances in the H2O band (935 nm) and/or band (1380 nm) - Bandwidths as narrow as 20 nm (-band) and 40 nm (-band) - Radiometric accuracy: SNR > 100
2.5.1 Channels in the and bands of water vapour - For total column and upper troposphere (and cirrus)
2.5.2 Channels in the band of water vapour - For total column
2.5.3 Channels in the band of water vapour - For upper troposphere (and cirrus)
GEO / Advanced VIS/IR imagery
2.6 Frequent NIR radiances in the H2O band (935 nm) and/or band (1380 nm) - Bandwidths as narrow as 20 nm (-band) and 40 nm (-band) - Radiometric accuracy: SNR > 100 - Image cycle < 15 min
2.6.1 Channels in the and bands of water vapour - For total column and upper troposphere (and cirrus) - Early detection of instability onset
2,6,2 Channels in the band of water vapour - For early detection of water vapour growth in the upper
troposphere, and cirrus cloud formation
FCDR and specific
sensor
feature Performance criteriaBaselineGCOS-154 ECV & FCDR


![Agency, version?, Date 2014? [update filed in the slide master] Coordination Group for Meteorological Satellites - CGMS Add CGMS agency logo here (in the.](https://static.fdocuments.us/doc/165x107/56649c935503460f9494e678/agency-version-date-2014-update-filed-in-the-slide-master-coordination.jpg)