POST HARVEST TECHNOLOGY AND MANAGEMENT - · PDF fileAlthough the farm mechanization has...
62
POST HARVEST TECHNOLOGY AND MANAGEMENT Evaluation and impact assessment of Plan scheme implemented during XI Five Year Plan (2007-2012) STUDY CONDUCTED FOR MECHANIZATION & TECHNOLOGY DIVISION DEPARTMENT OF AGRICULTURE & COOPERATION MINISTRY OF AGRICULTURE, GOVT. OF INDIA NABARD CONSULTANCY SERVICES (NABCONS)
Transcript of POST HARVEST TECHNOLOGY AND MANAGEMENT - · PDF fileAlthough the farm mechanization has...
POST HARVEST TECHNOLOGY AND MANAGEMENT
Evaluation and impact assessment of Plan scheme
implemented during XI Five Year Plan (2007-2012)
STUDY CONDUCTED FOR
MECHANIZATION & TECHNOLOGY DIVISION
DEPARTMENT OF AGRICULTURE & COOPERATION
MINISTRY OF AGRICULTURE, GOVT. OF INDIA
NABARD CONSULTANCY SERVICES (NABCONS)

ii
Evaluation and Impact Assessment of Plan Scheme “Post Harvest Technology and
Management” implemented during XI Five Year Plan (2007-2012).
A study report prepared by NABARD Consultancy Services (P) Ltd. (NABCONS) for
Mechanization & Technology Division, Department of Agriculture & Cooperation, Ministry
of Agriculture, Government of India, New Delhi.

iii
Disclaimer
This document has been prepared by NABARD Consultancy Services (NABCONS) Pvt. Ltd for the
Mechanization and Technology Division, Department of Agriculture & Cooperation, (MoA), New
Delhi based on the field study.
The views expressed in the report are advisory in nature. They do not represent or reflect the
policy or views of NABCONS/ National Bank for Agriculture & Rural Development (NABARD).
NABCONS/ NABARD accepts no financial liability or any other liability whatsoever to anyone in
using this report.

iv
Table of Content
DISCLAIMER ....................................................................................................................................................III
TABLE OF CONTENT ....................................................................................................................................... IV
ACKNOWLEDGEMENT .................................................................................................................................... VI
LIST OF ABBREVIATIONS ............................................................................................................................... VII
LIST OF TABLES ............................................................................................................................................ VIII
LIST OF FIGURES ............................................................................................................................................. IX
LIST OF ANNEXURE ........................................................................................................................................ IX
EXECUTIVE SUMMARY .................................................................................................................................... X
CHAPTER 1: INTRODUCTION .......................................................................................................................... 15
1.1 CHALLENGES OF POST HARVEST MANAGEMENT ............................................................................................. 15
1.2 SCOPE OF MECHANIZATION ........................................................................................................................ 15
1.3 COMPONENTS OF THE SCHEME & SALIENT FEATURE ....................................................................................... 16
1.4 NEED FOR THE STUDY ............................................................................................................................... 16
1.5 TERM OF REFERENCE ................................................................................................................................ 16
CHAPTER 2: RESEARCH DESIGN & METHODOLOGY ........................................................................................ 17
2.1 TYPES OF DATA USED FOR THE STUDY .......................................................................................................... 17
2.2 SAMPLING DESIGN ................................................................................................................................... 17
2.3 SELECTION OF INSTITUTIONS ....................................................................................................................... 18
2.4 LIMITATIONS OF THE STUDY ....................................................................................................................... 18
CHAPTER 3: CONTEXTUAL BACKGROUND AND IMPLEMENTATION ................................................................ 20
3.1 COMPONENT OF SCHEME .................................................................................................................................. 20
3.2 FUND ALLOCATION UNDER THE PHTM SCHEME. ................................................................................................... 21
3.2.1 Year wise Fund Allocation ................................................................................................................... 21
3.2.2 Institution wise fund allocation ........................................................................................................... 23
3.2.3 Zone wise fund allocation ................................................................................................................... 24
3.2.4 Year wise shares of fund allocation across various zones ................................................................... 25
3.2.5 Fund Utilization ................................................................................................................................... 25
3.2.6 Utilization of fund- a time frame comparison ..................................................................................... 26
3.2.7 Disbursement of Fund to CIPHET for implementation of PHTM Scheme ............................................ 28
3.2.7 Year wise and Center wise demonstration on PHTM organized by CIPHET ........................................ 29
3.2.8 Equipments/ Technology Demonstrated by CIPHET............................................................................ 31
3.2.9 Equipments/ Technology Demonstrated by State Agriculture Departments (Sample States) ............ 33
CHAPTER 4: FINDINGS FROM FIELD ................................................................................................................ 35
4.1 PARTICIPANT’S RESPONSE ON TRAININGS ORGANIZED UNDER PHTM SCHEME ............................................................ 35
4.1.1 Demographic Details of Respondents participated in training program ............................................ 35
4.1.2 Educational Status of Participants and Occupation ............................................................................ 36
4.1.3 Training Topics .................................................................................................................................... 36
4.1.3 Duration of Training and sources of information ................................................................................ 36
4.1.4 Motivation for attending the training program .................................................................................. 37
4.1.5 Effectiveness of Training Program ...................................................................................................... 38
4.1.6 Appropriateness of Training Logistics ................................................................................................. 39

v
4.1.7 Usefulness and Utilization of Training Program under PHTM ............................................................ 40
4.1.8 Impact of PHTM Training Program ..................................................................................................... 40
4.1.9 Overall Rating of Training Program .................................................................................................... 41
4.1.10 Opinion on Training Component of the Scheme ............................................................................... 41
4.2 RESPONSE ON DEMONSTRATION BY HOST FARMERS AND ENTREPRENEURS ................................................................. 42
4.2.1 Demographic Profile of Demonstration Participants .......................................................................... 42
4.2.2 Educational and Occupational Status Demonstration Participants of PHTM Scheme ........................ 42
4.2.3 State wise demonstration hour and participation rate ....................................................................... 43
4.2.4 Equipments Demonstrated and their Usefulness ................................................................................ 43
4.2.5 Post Demonstration Impact at Output Level ....................................................................................... 44
4.2.6 Adequateness of demonstration conducted under PHTM Scheme ..................................................... 45
4.2.7 Entrepreneurs Response on the Units established under the PHTM Scheme...................................... 46
4.2.8 Opinion on Demonstration Component of the Scheme ....................................................................... 47
CHAPTER 5: INSIGHTS AND RECOMMENDATIONS ......................................................................................... 48
CHAPTER 6: CONCLUSIONS ............................................................................................................................ 51
ANNEXURE ..................................................................................................................................................... 52

vi
Acknowledgement The Evaluation Study of Central Sector Scheme for Post Harvest Technology and Management was undertaken by NABARD Consultancy Services (P) Ltd. on behalf of Mechanization & Technology Division, Dept. of Agriculture & Cooperation, Ministry of Agriculture, Govt. of India covering the period of XI Five Year Plan, with a view to assessing the scheme’s adequacy, effectiveness and its performance in addition to evaluating operational roles of various stakeholders, identifying constraints and bottlenecks and suggesting areas for improvement. NABCONS would like to offer special thanks to MoA for their financial support to this study. We would also like to place on record, our special gratitude to Shri. Narendra Bhushan, Joint Secretary, and Mechanization & Technology Division for extending his supports & cooperation. We also thank Shri. H.K. Suanthang, Deputy Secretary, Shri. V. N. Kale, Additional Commissioner, Shri. A. N. Meshram, Deputy Commissioner and Shri. Himmat Singh Director, NRFMTTI for their valuable inputs and contribution during the course of the study. The cooperation, support, valuable inputs and insights received from the following Senior Officials of NABCONS/NABARD and other distinguished persons in finalizing this study report, are gracefully acknowledged: Shri. Krishan Jindal, Chief Executive Officer, NABCONS, H.O. Mumbai Shri. P V S Suryakumar, CGM NABARD and Principal Consultant, NABCONS, New Delhi Shri. Himmat Singh, Director, NRFMTTI, Hissar, Haryana Shri. Pitam Chandra, Director, CIAE, Bhopal Shri. S.K Nanda, Project Coordinator (PHT, PAU, Ludhiana) The study team would like to thank all the Directors of Agriculture of respective states, CIAE, and State Agriculture Universities and CIPHET Centers without the support of whom the study would not have been completed. The cooperation received from the Nodal Officers and Consultants of NABCONS and other Officers of various Regional Offices of NABARD in conducting the study, especially in data collection and compilation of preliminary study observations is also duly acknowledged. The study would not have been completed successfully but for the best efforts put in by the staff
attached to the Zonal Office of NABCONS, New Delhi who deserves our appreciation.

vii
List of Abbreviations AICRP All India Coordinated Research Project
ATMA Agriculture Technology Management Agency
AP Andhra Pradesh
CIAE Central Institute of Agriculture Engineering
CIPHET Central Institute of Post Harvest Engineering and Technology
CSIR Council of Scientific and Industrial Research
CCSHAU Chaudhary Charan Singh Haryana Agriculture University
DoA Directorate of Agriculture
DoAC Department of Agriculture and Cooperation
FMTTI Farm Mechanization Training and Testing Institute
FYP Five Year Plan
GKVK Gandhi Krishi Vigyan Kendra
GBPU Govind Ballabh Pant University
GoI Government of India
ICAR Indian Council for Agriculture Research
J&K Jammu & Kashmir
KVK Krishi Vigyan Kendra
MoA Ministry of Agriculture
MP Madhya Pradesh
MPUAT Maharana Pratap University of Agriculture and Technology
NABARD National Bank for Agriculture and Rural Development
NABCONS NABARD Consultancy Service Pvt. Ltd.
NABFINS NABARD Financial Services Pvt. Ltd.
NGO Non Government Organization
OBC Other Backward Classes
PHT Post Harvest Technology
PHTM Post Harvest Technology and Management
SAU State Agriculture University
SC Schedule Castes
SHGs Self Help Groups
ST Schedule Tribes
TNAU Tamil Nadu Agriculture University
UT Union Territory
UAS University of Agriculture Science
UGs User Groups
UK Uttarakhand
VPKAS Vivekanand Parvatiya Krishi Anusandhan Sansthan

viii
List of Tables Table 1 List of sample state covered in PHTM Scheme ........................................................................ 18
Table 2 Sample Coverage under PHTM Scheme ................................................................................... 19
Table 3 Zone wise segregation of states implemented PHTM Scheme during the XI FYP ................... 24
Table 4 Year wise share of fund allocation across six zones during the XI FYP .................................... 25
Table 5 Distribution of states based on extent of fund utilized under PHTM scheme during the XI FYP
.............................................................................................................................................................. 25
Table 6 Fund allocated to ICAR and disbursed by CIPHET during the XI FYP ........................................ 29
Table 7 Number of demonstrations organized by CIPHET Centers during the XI FYP .......................... 30
Table 8 Participation/ demonstration organized by CIPHET Centers during the XI FYP ....................... 31
Table 9 Equipments demonstration in PHTM schemes by CIPHET through its Center during XI FYP .. 32
Table 10 Equipment/ Technology demonstrated through State Departments on PHTM Scheme ...... 33
Table 11 Demographic profile of Training respondents under PHTM Scheme .................................... 35
Table 12 Educational status and occupation of respondents under PHTM Scheme ............................ 36
Table 13 Effectiveness of Training Program organized under PHTM Scheme ...................................... 38
Table 14 Effectiveness of Training Program organized under PHTM ................................................... 39
Table 15 Appropriateness of Training Logistics .................................................................................... 39
Table 16 Utilization of Training Skills by the participants after attending PHTM Training ................... 40
Table 17 Impact of PHTM Training Program ......................................................................................... 41
Table 18 Average rating score given by the participants of PHTM training ......................................... 41
Table 19 Demographic profile of demonstration participants under PHTM Scheme .......................... 42
Table 20 Educational and Occupational Status of Demonstration Participants ................................... 42
Table 21 Hours of demonstration and participation rate under PHTM Scheme .................................. 43
Table 22 Equipments demonstrated and their usefulness ................................................................... 44
Table 23 Technology demonstrated, used and future prospect of adoption ....................................... 45
Table 24 Adequateness of demonstration time and rating of demonstration ..................................... 46

ix
List of Figures Figure 1 Year wise fund allocation under PHTM Scheme during XI FYP ............................................... 22
Figure 2 Year wise percentage distribution of allocated fund during the XI FYP ................................. 22
Figure 3 Institution wise fund allocation under PHTM scheme during XI FYP...................................... 23
Figure 4 State wise allocation of fund during the XI FYP ...................................................................... 23
Figure 5 Zone wise fund allocation during XI FYP ................................................................................. 24
Figure 6 State wise fund utilization pattern during XI FYP ................................................................... 26
Figure 7 Aggregate fund utilization in time frame ................................................................................ 27
Figure 8 Aggregated fund utilization by the states in first three year of XI FYP ................................... 27
Figure 9 Aggregated fund utilization by the states in last two year of XI FYP ...................................... 28
Figure 10 Sources of information for training program under PHTM Scheme ..................................... 37
Figure 11 Motivation for attending the training course under PHTM Scheme .................................... 37
List of Annexure Annexure 1 Year wise and State wise fund allocation in PHTM Scheme during XI FYP ....................... 52
Annexure 2 Zone wise fund allocation under PHTM Scheme during XI FYP ........................................ 53
Annexure 3 State wise fund allocation and utilization under PHTM Scheme during XI FYP ................ 54
Annexure 4 Equipments demonstrated by CIPHET Centers during XI FYP ........................................... 55

x
Executive Summary 1. The estimated total food grain production in the country has increased from 196.8 million
tonnes in 2001-02 to 259.29 million tonnes in 2011-12 (MoA, GoI) recording a CAGR of 3%.
Agriculture mechanization has played a vital role in increasing agriculture productivity and
overall production. Although the farm mechanization has significantly contributed to the
overall productivity of food crops, post harvest losses have always denied the legitimate
benefits from accruing to the farmers. The country has been reportedly incurring post
harvest losses of Rs. 2.00 lakh crores of fruits and vegetable crops and 12-16 million tonnes
of food grain, annually. This is largely due to absence of processing units, storage facilities
and any effective strategy for tackling post harvest losses in the production catchment areas.
2. Department of Agriculture and Cooperation (DoAC) through its Mechanization and
Technology Division has adopted a multi pronged strategy for reforming agricultural markets
by Post Harvest Technology and Management through implementation of Central Sector
Scheme of “Post Harvest Technology and Management”. The scheme was implemented
during the XI Five Year Plan with the aim to create adequate infrastructure in production
catchment/ rural areas for primary processing, value addition and scientific storage to
reduce post harvest losses at the field level and better value realizations in the market.
3. Component of Scheme and its Salient Features
The main components of the Post Harvest Technology and Management Scheme are:
I. Establishment of units for transfer of primary processing technology, value addition, low
cost scientific storage, packaging units and technologies for by-product management in the
production catchments under tripartite agreement.
II. Establishment of low cost Post Harvest Technology (PHT) units/supply of PHT equipments
with Government assistance.
III. Demonstration of technologies.
IV. Training of farmers, entrepreneurs and scientists.
4. Need for the Study
The Scheme of “Post Harvest Technology and Management” was implemented during the XI Five
Year Plan (2007-12) through State Governments and Government Sponsored Institutions such as
Indian Council of Agriculture Research (ICAR) which further designated the responsibility to the
Central Institute of Post Harvest Engineering and Technology (CIPHET), an institution which was
set up under All India Coordinated Research Project (AICRP). After completion of the XIth Five
Year Plan, the M&T Division under DoAC desired to know the status of implementation of
scheme with respect to physical and financial progress, extent of adoption of technologies by
the farmers and their opinion on the availability and usefulness of the equipments being
demonstrated or adopted and accordingly suggest any improvements required for its effective
implementation. Accordingly, NABCONS was commissioned to conduct an elaborate and
comprehensive evaluation of the scheme.

xi
5. Terms of Reference
The Terms of Reference of the Evaluation Study of the scheme for Post Harvest Technology and
Management are:
i. To study the impact of establishing low cost Post Harvest Technology (PHT) units towards
adoption of new technology/ equipments in the demonstration area as well as in the state
as a whole.
ii. To assess the opinion of farmers about availability and usefulness of these equipments.
iii. To suggest any improvement that may be required in this component.
6. NABCONS adopted a comprehensive approach for evaluation by analyzing both primary as
well as secondary information provided by the Department of Agriculture and Cooperation,
CIPHET and it’s implementing Centers in different states and Directorate of Agriculture.
Primary information was gathered from the beneficiaries, who have attended the training
programs and demonstrations or acted as the host farmers/ entrepreneurs for setting up post
harvest processing or management units. The evaluation focused on assessing the
effectiveness and appropriateness of trainings and demonstrations on post harvest
technology and management practices like the skills for better post harvest handling of crops
and various types of post harvest equipments/ technologies, their usefulness and adoptability.
The opinions of farmers with respect to training and demonstrations and equipments
demonstrated/ used were also captured.
7. Study Findings
a. Fund Allocation and Utilization
i. The total fund allocated during the XIth Five Year Plan for the Implementation of Post
Harvest Technology and Management Scheme was Rs. 2608 lakh, of which, Rs. 2099 lakh
(80%) was allocated to State Directorate of Agriculture while Rs. 509 lakh (20%) was
allocated to ICAR.
ii. Of the total funds Rs. 1897 lakh (73%) was allocated during the last two years (2010-11 &
2011-12) while Rs. 711 lakh (27%%) was allocated during the first two years (2007-
08 to 2009-11) of the XII Five Year Plan.
iii. Out of total 27 states, funds were allocated to only 19 states. While North Eastern Zone
accounted for the highest share of Rs. 965 lakh (46%), West Zone accounted for the
lowest at Rs. 25 lakh (01%). Rajasthan was the only state in the West Zone to receive
funds under the PHTM Scheme.
iv. Out of 19 states which received funding under the PHTM Scheme, 7 states (37%) utilized
the funds to an extent of 30%, 4 states (21%) used the funds to an extent of 30% to 60%
and 8 states (42%) utilized more than 60% of the funds. Only five states, viz., Haryana,
Himachal Pradesh, Karnataka, Jammu & Kashmir and West Bengal recorded utilization of
the entire allocated funds. Andhra Pradesh, Assam, Kerala, Sikkim and Uttarakhand did
not utilize their allocated fund at all during the XI FYP.

xii
v. More than 70% of the funds allocated during the first three years of XI Five Year Plan was
utilized, while during the last two years, only 56% of the funds allocated could be utilized
indicating a higher probability of use of funds if allocated in time.
vi. It is also observed that 10 out of the 14 states, which were allocated funds in the first 3
years, utilized the funds completely. Out of the 12 states which received the funding
during the last two years, 10 states could not utilize the fund completely, which further
supports the view of higher probability of utilization if the funds are allocated during the
earlier years of the Five Year Plan.
vii. Out of the total Rs. 509 lakh allocated to ICAR, only Rs.120.40 lakh (23%) was utilized by
the CIPHET for conducting demonstration.
b. Conduct of Training and Demonstration
i. All the states did not organize the training and/ or demonstration. Demonstration
remained to be the primary activities of both State Directorate as well as the CIPHET
Centers. Out of the 10 sample states, the training program on PHTM Scheme was
organized by three states only, namely Madhya Pradesh, Odisha and Uttarakhand.
ii. The demonstrations of equipments of PHTM were organized by the CIPHET Centers
across 12 states. The total number of demonstrations organized during the XIth FYP by
the CIPHET Centers was 525, benefitting approximately 15000 farmers. The highest
number of demonstrations (421) was organized by the CIPHET Centers in West Zone
comprising of the states of Maharashtra, Rajasthan (200) and Gujarat.
iii. On an average the participation per demonstration was 28 with the lowest in Himachal
Pradesh at 01 and highest in Rajasthan at 51. Information on the number of participants
per demonstration was not available from the State Directorates of Agriculture.
iv. The range of equipments demonstrated through CIPHET Centers was better than the
State Directorates of Agriculture.
v. Among the sample States, only three states - Madhya Pradesh, Odisha and Uttarakhand
were found to have organized trainings. It was observed from field visits, that majority of
the training participants on PHTM components were large farmers indicative of a bias in
selection of training participants.
vi. The average duration of training was 3 days, though some beneficiaries had felt it
inadequate and expressed the need for increase to 5 days.
vii. The major motivators accounting for training need are enhancement of skill, enhanced
awareness and utilization of post harvest technology and management practices which
accounted for 32%, 29% and 22% of the total responses.
viii. Majority of respondents opined the course material to be useful and duration as
appropriate. 94% of the total training participants confirmed the training to be relevant
while 6% felt partially relevant. 96% of the training participants found the contents of
training to be appropriate while 4% found it not appropriate.
ix. 89% of the demonstration participants indicated that equipments demonstrated were
useful and adoptable, as they were in conformity with factors such as existing cropping
pattern in the region.
x. Out of the total 301 responses on different kinds of equipments demonstrated which
were obtained from 209 beneficiaries who had participated in demonstrations of Post
Harvest Management Scheme, only 28% response confirmed full adoption of

xiii
equipments/technology, while 20% response confirmed partial adoption and rest 52% of
the response confirmed no adoption at all.
The overall training program was satisfactory and has been able to achieve its objectives but at the
same time, efforts need to be intensified to increase the adoption rate through proper extension
methods. The training component of the scheme needs to continue with an objective of higher
adoption rate. The demonstration activity of the scheme received mixed feelings from the
beneficiaries in respect of Post Harvest machineries. A significant number of beneficiaries were not
happy with the way the demonstration was carried out and felt that there is scope for improvement
in the future. There were also demands for increase in the duration of demonstration on the field.
However, demonstration is an important activity and its continuation is vital to educate farmers on
the use of post harvest machines in order to reduce the losses at the farm level.
8. Recommendations
a. Recommendations on Better Fund Allocation and Utilization
i. Funding support under the scheme needs to be equitably spread across the
implementation period. Bunching of funds releases towards the end of the Financial Year
should be avoided. The Government may consider fine tuning the funding under the
Scheme for better, proper and effective utilization at the ground.
ii. Agriculturally developed states may also be considered for fund allocation while ensuring
adequate priority to less agriculturally developed states and north eastern states.
iii. A uniform pattern for fund allocation to States may be evolved so as to ensure timely
availability of funds for proper planning of organizing demonstration/ training by the
implementing agencies at the ground level.
b. Recommendations for more Effective & Efficient Implementation of Training and
Demonstration
i. A sound monitoring and feedback system may be devised and put in place to monitor the
progress of scheme with regard to its physical and financial progress.
ii. The trainings and demonstrations were mostly supply driven rather than demand driven.
There is a strong case for making this demand driven and to make way for this, it is
suggested that a preliminary survey to identify the training needs and preferences of the
farmers/ entrepreneurs be undertaken, before organizing demonstration and training
programs. This will improve adoption rates too.
iii. The training contents should be re-visited and developed in tune with the objectives of
the scheme, as many respondents, especially from Madhya Pradesh who participated
training under PHTM, revealed that training were organized on cultivation practices,
nursery management, nursery growing etc which had nothing to do with post harvest and
management practices.
iv. Instead of conducting demonstration of individual equipment as a standalone event,
demonstration of a range of equipments required for complete processing and value
addition of a commodity should be organized. (Need for a value chain perspective to
trainings and demonstrations)

xiv
v. As envisaged in the guidelines, the units for post harvest processing, value addition, low
cost scientific storage, packaging, etc., may be established under a tripartite agreement
with State Government, ICAR/CSIR and well-functioning Self Help Groups/User Groups,
Producer Groups etc. However, very few interventions of such categories were found in
the field. Most of the units/ enterprise established were individually operated, and mostly
by large farmers, who either had their existing units capable of handling the post harvest
processing or capable of running the units without any external assistance. The adoption
rate among the small and marginal farmers was not encouraging. Hence, a group based
approach may prove to be beneficial for increasing the adoption rate. Linkages with NGOs
working in the area may be explored to scale up the intervention and meet the desired
objectives of increasing the adoption rate among the less privileged farmers.
vi. The demonstration of low cost PHT can be scaled up through convergence with the
existing schemes of MoA, implemented by Small Farmers Agribusiness Consortium (SFAC)
particularly in their vegetable clusters. The SFAC has been implementing the Farmers
Producer Organization Initiative Project, by organizing farmers growing vegetables and
pulses through Resource Institutions. The CIPHET Centers can work in collaboration with
such Resource Institutions which are promoting the FPOs to demonstrate Post Harvest
Technology.
vii. Majority of the training and demonstration participants and the entrepreneurs were large
farmers indicating an unintentional bias in favour of them. Efforts need to be intensified
to improve coverage of small farmers from the project locations.
viii. The CIPHET Centers established in the State Agriculture Universities have been assigned
the responsibilities of Post Harvest Technology and Management Scheme. As the
professors are burdened with regular academic activities, it is may be difficult for them to
provide required attention to the activities under the scheme. It is therefore
recommended that the option of earmarking separate dedicated staff exclusively for the
scheme in each CIPHET Centers responsible for effective implementation of scheme may
be explored.
ix. A sound monitoring and tracking system driven by IT, needs to be devised and put in place
for monitoring the progress of the scheme. It is also suggested that a system of
maintaining information of trainees may be introduced and follow ups be made
periodically for better practice of the learning made in trainings and demonstrations.

15
Chapter 1: Introduction
Ministry of Agriculture, Government of India has estimated that the total food grain production of
the country has increased from 196.8 million tonnes in year 2001-02 to 259.29 million tonnes by
2011-12, reflecting a compounded annual growth rate of 3%. Agriculture machineries have played a
crucial role in increasing the productivity and overall production through mechanization of
production and post production agriculture. While the enhanced productivity is an essential
component of agricultural sector, improved post harvest handling and processing is essential to
reduce wastage and ensure that high quality products reach the market. Despite yields being high,
producers lose income due to poor post harvest practices. Food processing helps all the sections of
the society, from producer to the end consumer. The farmers get higher yields, better revenue thus
lowering the risk drastically. Consumers in turn have access to greater variety and better prices. The
overall economy gets benefitted with creation of new business opportunities for entrepreneurs
which generates additional employment.
1.1 Challenges of Post Harvest Management Though farm mechanization has significantly contributed to the overall productivity of food crops,
post harvest losses have always denied the legitimate benefits from accruing to the farmers. Our
country as a whole is, reportedly incurring post harvest losses of Rs. 2 lakh crores per year only in
fruits and vegetable crops, which is largely due to the absence of processing units, storage facilities
and an effective strategy for tackling post harvest losses. The post harvest losses estimated in food
grains amount to 12-16 million metric tonnes annually (Nagpal et.al. 2012), valued at more than Rs
50000 crores (Singh, 2010). The reasons for such losses are: inadequate infrastructure in the
production catchment area, long distances between the areas of production and storage facilities,
reluctance on the part of the small producers to pay rental charges as many of them depend on
more frequent sales for incomes, and also difficulty in accessing large markets that discourage
farmers from moving to growing of commercial crops.
1.2 Scope of Mechanization With this intent, the Department of Agriculture and Cooperation through its Mechanization and
Technology Division (M&T) has adopted a multi pronged strategy for reforming agricultural markets
& promoting post harvest technology by implementing the Central Sector Scheme of “Post Harvest
Technology and Management” during the XI Five Year plan. The aim of the scheme is to create
adequate infrastructure in the production catchment/ rural areas for primary processing and value
addition that can reduce post harvest losses on the farm and add value to the products being sold in
the market. The scheme focuses on the lower end of the spectrum of post harvest management and
processing that are not covered under the programmes of the Ministry of Food Processing or under
National Horticulture Mission (NHM).
Under the scheme, the technologies developed by ICAR, CSIR and those identified from within the
country and abroad for primary processing, value addition, low cost scientific storage and transport
and by-product management have been given importance.

16
1.3 Components of the Scheme & Salient Feature The main components of the Post Harvest Technology and Management Scheme are:
1. Establishment of units for transfer of primary processing technology, value addition, low
cost scientific storage, packaging units and technologies for by-product management in the
production catchments under tripartite agreement.
2. Establishment of low cost Post Harvest Technology (PHT) units/supply of PHT equipment
with Government assistance.
3. Demonstration of technologies.
4. Training of farmers, entrepreneurs and scientists.
1.4 Need for the Study The Scheme for “Post Harvest Technology and Management” has been implemented during the XI
Five Year Plan (2007-2012) through State Governments; Government Sponsored Institutions such as
Central Institute of Post Harvest Engineering and Technology (CIPHET) and State Agriculture
Universities. The scheme has been implemented in 27 states/union territories with a total financial
outlay of Rs. 40.00 crores during the XI Five Year Plan. After completion of the XI Five Year Plan, the
Mechanization and Technology Division under the Department of Agriculture and Cooperation
desired to know the status of actual implementation of the scheme with respect to physical and
financial progress, extent of adoption of technologies by the farmers and constraints and
bottlenecks encountered during the implementation of the scheme. Such critical inputs become
necessary to further refine and improve the effectiveness of the scheme by improving the overall
implementation management plan through required policy changes. Accordingly, the Mechanization
and Technology Division has assigned the responsibilities to NABCONS to conduct an elaborate and
comprehensive evaluation of the scheme with specific Terms of Reference.
1.5 Term of Reference The Terms of Reference of the Evaluation Study of the scheme for Post Harvest Technology and
Management are:
1. To study the impact of establishing low cost Post Harvest Technology (PHT) units on
adoption of new technology/ equipments in the demonstration area as well as in the state
as a whole.
2. To assess the opinion of farmers about availability and usefulness of these equipments.
3. To suggest any improvement that may be required in this component.

17
Chapter 2: Research Design & Methodology
To evaluate the performance of PHTM Scheme, a holistic approach was adopted to collect data on
selected parameters such as physical and financial progress, establishment of low cost PHT units,
adoption of new technology under PHT, demonstration of PHT, opinion of farmers on PHT
equipments and their usefulness.
The scheme has been implemented with the help of State Department of Agriculture and Central
Institute of Post Harvest Technology (CIPHET), established under All India Coordinated Research
Project (AICRP). The CIPHET has implemented the scheme through their cooperating Center in
different states. Therefore, nodal officers of the State Department of Agriculture and CIPHET/
CIPHET Centers were contacted to obtain information on physical progress Primary beneficiaries and
entrepreneurs were interviewed in person to obtain information on their demographic profile, types
of equipment demonstrated, usefulness of demonstrated equipment, availability and overall
feedback on demonstration.
2.1 Types of Data Used for the Study
Secondary Data: The data on fund allocation and utilization for each state and ICAR institute
were obtained from the M&T Division, DoAC (MoA). Further physical and financial progress in
respect of the sample states were collected from the State Department of Agriculture and
CIPHET/CIPHET Centers for analysis.
Primary Data: The primary information was collected from the beneficiaries and entrepreneurs
level from the field who had adopted the post harvest technologies and equipments provided by the
implementing agencies. The information from three different stakeholders- entrepreneurs, trainees
who attended the training program under the scheme and host farmers which had demonstrated
the PHT technology was collected through personal interviews. The variables on demographic
details, types of PHT units installed/ technology adopted, their capacity, ownership, performance of
training and demonstration, their usefulness, organization of demonstration and usefulness of
equipment/technology and their availability in the market and overall opinion of farmers were
captured.
2.2 Sampling Design The sample states were selected based on the fund allocation under PHTM Scheme during the XI
Five Year Plan. Out of total 27 states, 19 states were allocated the funds for implementation of
PHTM Scheme. In addition, the CIPHET also implemented the scheme in 8 states across the country.
I. Multistage purposive sampling technique was adopted for sampling the state under the study.
The states were first sorted in ascending order of amount of funds allocated. The states were
then categorized into six regions (North Eastern Region, Eastern Region, Central Region,
Northern Region, Western Region and Southern region) and the sample states were selected
from each region for the purpose of field study.
II. Out of 19 states, 10 states were selected which account for more than 50% of the total states
that received financial allocations during the XI FYP. The list of sample state is given in table 1
below.

18
Table 1 List of sample state covered in PHTM Scheme
Southern Region
North Eastern Region
Central Region
Eastern Region
Western Region
Northern Region
Andhra Pradesh Manipur Madhya Pradesh
Odisha Rajasthan Haryana
Karnataka West Bengal Punjab
Tamil Nadu Uttarakhand
III. Since the exact physical achievements were not available, a tentative number of participants
of trainees, entrepreneurs, scientists, host farmers, and demonstration participants were
arrived at for the purpose of personal interviews. A total of 437 PHTM participants were
targeted to be covered for personal interview. The PHTM participants who had participated
under the guidance of State Department of Agriculture and Central Institute of Post Harvest
Engineering and Technology were selected.
IV. Table 2 below gives the details of the sample targeted and actually covered in the state.
2.3 Selection of Institutions Three different types of institutions were involved for implementation of Post Harvest Technology
and Management Scheme viz., State Department of Agriculture, the CIPHET Centers and State
Agriculture Universities. The State Agriculture Universities acted as extended arms of both the State
Agriculture Departments and CIPHET. Respondents were selected from each type of institutions so
as get a comprehensive feedback on the progress of the scheme, its impact and opinion of users
about the technology demonstrated. A separate questionnaire was developed to capture the
details from implementing agencies viz., State Agriculture Department, CIPHET Centers and State
Agriculture Universities to record their insights and opinion on the scheme.
2.4 Limitations of the Study The study has the following limitations:
I. A sample of states where the scheme has been implemented only has been covered.
II. Availability of information in properly documented format both physical and financial
progress, at the implanting agency’s level, was the major constraint. The basic information
required as a prerequisite to launch of the field study had to be provided by the State
Agriculture Departments and CIPHET.
III. The basic information on the status of Scheme such as fund utilization and physical progress
was not made available to the study team. This affected the evaluation of the actual
progress and the impact of its various components.

19
Table 2 Sample Coverage under PHTM Scheme
Region State Institution Sample to be covered Total (PHTM)
Actual Coverage Trainees Demonstration
Farmers Entrepreneurs Scientist Demonstrators Demonstration Participants
Southern Tamil Nadu CIPHET-TNAU- Coimbatore Center
- - - 5 30 35 37
Karnataka CIPHET-GKVK- Bangalore Center - - - 2 30 32 21
CIPHET-UAS-Raichur Center
5 30 35
North East Manipur Directorate of Agriculture 25 2 2 2
31 35
Western Maharashtra CIPHET-Dr. Punjab Rao KV-Akola Center
- - - 3 30 33 Nil
Rajasthan CIPHET- MPUAT- Udaipur Center - - - 3 30 33 33
Northern Haryana Directorate of Agriculture 20 2 2 2
26 0
CIPHET-CCSHAU Center
2 20 22 22
Uttarakhand Directorate of Agriculture 25 5 2 2
34 6
CIPHET-VPKAS-Almora Center
2 30 32 44
CIPHET-GBPU-Pantnagar Center
2 30 32
Central Madhya Pradesh
Directorate of Agriculture 25 5 2 2
34 63
CIPHET- JNKVV Center
22
Eastern Orissa Directorate of Agriculture 25 2 2 2
31 49
West Bengal Directorate of Agriculture
2 25 27 20
Total 195 22 16 47 320 437 352

20
Chapter 3: Contextual Background and Implementation
The Scheme for Post Harvest Technology and Management has been implemented across 19 states/UTs
in the country. The scheme has been implemented with the help of State Directorates of Agriculture and
Central Institute of Post Harvest Engineering and Technology (CIPHET). The State Directorates of
Agriculture have implemented the scheme through their extension wings at the district level while Krishi
Vigyan Kendra and CIPHET have implemented the scheme through their centers established under AICRP
on PHT across different states.
3.1 Component of Scheme There are four broad components of the scheme and their features are presented below:
i. Establishment of units for transfer of primary processing technology, value addition, low cost
scientific storage, packaging units and technologies for by-product management in production
catchment under tripartite agreement.
a. Development of scientific storage, packaging technologies and technology for by-product
management for various perishable commodities shall be established under the tripartite
agreement amongst the state government, ICAR and Self Help Groups (SHGs)/ User Groups
(UGs)/ Cooperative Societies of Farmers/ Non Government Organizations (NGOs).
b. The committee constituted of the representative of AICRP Center of ICAR, official of State
Department of Agriculture, Lead Bank Officer, representative of KVK from the district will identify
the beneficiaries under the scheme.
c. The SHGs/UGs of farmers/ Cooperative Society who are ready to invest 60% of the project cost
and are ready to enter the tripartite agreement will be selected by the State Department of
Agriculture in association with other Centers.
d. The units established under scheme will be operated by the user groups (SHGs/UGs/Cooperative
Societies) with technical support of AICRP on PHT. After successful implementation and
operations for one year, the units will be transferred fully to the user groups.
e. The subsidy assistance of 40% (limited to Rs. 4.00 lakh) shall be released through the Technical
Institution of ICAR after the approval of Government of India.
f. During the implementation of the scheme, the Implementation and Monitoring Committee shall
ensure that 16% of the total available funds are allotted to the SC beneficiaries, 8% to the ST
beneficiaries and 30% of the fund to the women beneficiaries.
ii. Establishment of low cost post harvest technology units/supply of PHT equipments with
Government assistance.
a. For primary processing and value addition, the equipment not requiring high capital (up to
Rs. 2.00 lakh) investment shall be established in the farmer’s field.
b. The beneficiaries are selected by the committee constituted by the Engineers/Representative of
AICRP Center, Officer of State Agriculture Department/ATMA, District Lead Bank Officer and
representative of KVKs. The committee decides the technology to be promoted from the list of
technologies.
c. The proposal, once developed, will be forwarded to the Department of Agriculture and
Cooperation, GoI, which will study the viability of proposal and accordingly release the fund to
the state Government.

21
d. The government will provide 40% subsidy on the total cost of the proposal and 60% shall be
contributed by the beneficiaries.
iii. Demonstration of Technology.
a. The demonstration is meant for disseminating the technology at a faster rate for adoption by the
farmers. The demonstration shall be taken up through ICAR, CSIR, SAUs and the State Agriculture
Department.
b. Government of India shall provide 100% of the assistance for the procurement of technology
equipment and contingency expenditure.
c. The State Government, ICAR/CSIR Centers shall identify the technology suitable for the
catchment and shall forward the detailed proposal.
d. The remaining criteria for selection of beneficiaries and implementation of the scheme remain
the same as for the other components.
e. The supervisory role has to be carried out with the help of officers of FMTTIs and officers from
MoA through random visits to measure the actual implementation and assess the performance of
the equipment demonstrated and their acceptability among the farmers.
f. There should be proper documentation of cases that may be published in the popular journals/
periodicals.
iv. Training of Farmers, Entrepreneurs and Scientists.
a. The objective is to improve the technical know-how of the users of post harvest technology for its
proper and effective utilization, to incentivize manufacturers to take up commercial production of
technologies and to train scientists for propagation of technologies developed by AICRP, KVKs of
ICAR and other Centers.
b. The financial assistance shall be provided to the institution identified for training at the rate of Rs
2600.00 per person per week for farmers and Rs 3000.00 per person per week for entrepreneurs
and scientists.
c. Implementing agencies should ensure that 30% of the beneficiaries under the scheme are
women, 16% of the beneficiaries belong to the SC category and 8% to the ST category as per the
Government of India Guidelines.
The implementing agencies, which consist of State Departments of Agriculture and Central Institute of
Post Harvest Engineering and Technology, have implemented the demonstration and training
components of the scheme.
3.2 Fund Allocation under the PHTM Scheme.
3.2.1 Year wise Fund Allocation
During the XI Five Year Plan, the scheme has been implemented across 19 states/union territories. The
total financial allocation made during the XI Five Year Plan under the Centrally Sponsored Schemes (CSS)
of PHTM was Rs. 2608 lakh. The year wise fund allocation during the XI Five Year Plan is given in figure 1
below.
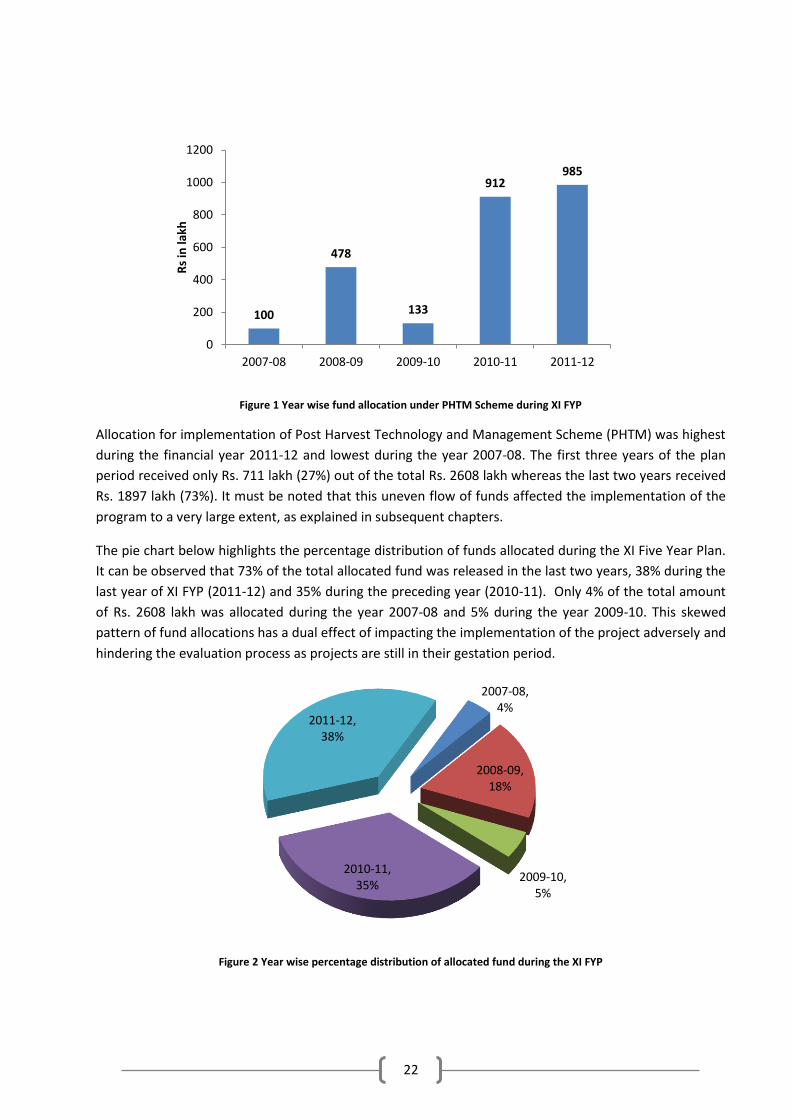
22
Figure 1 Year wise fund allocation under PHTM Scheme during XI FYP
Allocation for implementation of Post Harvest Technology and Management Scheme (PHTM) was highest
during the financial year 2011-12 and lowest during the year 2007-08. The first three years of the plan
period received only Rs. 711 lakh (27%) out of the total Rs. 2608 lakh whereas the last two years received
Rs. 1897 lakh (73%). It must be noted that this uneven flow of funds affected the implementation of the
program to a very large extent, as explained in subsequent chapters.
The pie chart below highlights the percentage distribution of funds allocated during the XI Five Year Plan.
It can be observed that 73% of the total allocated fund was released in the last two years, 38% during the
last year of XI FYP (2011-12) and 35% during the preceding year (2010-11). Only 4% of the total amount
of Rs. 2608 lakh was allocated during the year 2007-08 and 5% during the year 2009-10. This skewed
pattern of fund allocations has a dual effect of impacting the implementation of the project adversely and
hindering the evaluation process as projects are still in their gestation period.
Figure 2 Year wise percentage distribution of allocated fund during the XI FYP
100
478
133
912 985
0
200
400
600
800
1000
1200
2007-08 2008-09 2009-10 2010-11 2011-12
Rs
in la
kh
2007-08, 4%
2008-09, 18%
2009-10, 5%
2010-11, 35%
2011-12, 38%
23
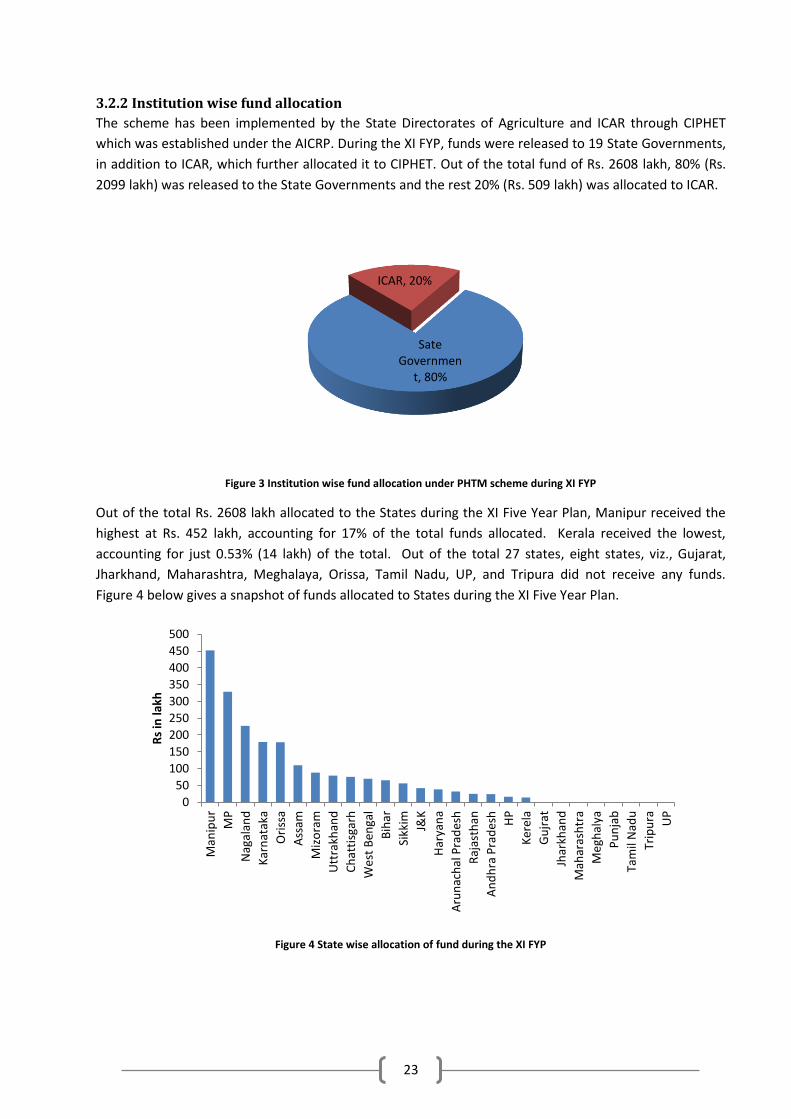
3.2.2 Institution wise fund allocation
The scheme has been implemented by the State Directorates of Agriculture and ICAR through CIPHET
which was established under the AICRP. During the XI FYP, funds were released to 19 State Governments,
in addition to ICAR, which further allocated it to CIPHET. Out of the total fund of Rs. 2608 lakh, 80% (Rs.
2099 lakh) was released to the State Governments and the rest 20% (Rs. 509 lakh) was allocated to ICAR.
Figure 3 Institution wise fund allocation under PHTM scheme during XI FYP
Out of the total Rs. 2608 lakh allocated to the States during the XI Five Year Plan, Manipur received the
highest at Rs. 452 lakh, accounting for 17% of the total funds allocated. Kerala received the lowest,
accounting for just 0.53% (14 lakh) of the total. Out of the total 27 states, eight states, viz., Gujarat,
Jharkhand, Maharashtra, Meghalaya, Orissa, Tamil Nadu, UP, and Tripura did not receive any funds.
Figure 4 below gives a snapshot of funds allocated to States during the XI Five Year Plan.
Figure 4 State wise allocation of fund during the XI FYP
Sate Governmen
t, 80%
ICAR, 20%
0
50
100
150
200
250
300
350
400
450
500
Man
ipu
r
MP
Nag
alan
d
Kar
nat
aka
Ori
ssa
Ass
am
Miz
ora
m
Utt
rakh
and
Ch
atti
sgar
h
Wes
t B
enga
l
Bih
ar
Sikk
im
J&K
Har
yan
a
Aru
nac
hal
Pra
des
h
Raj
asth
an
An
dh
ra P
rad
esh
HP
Ker
ela
Gu
jrat
Jhar
khan
d
Mah
aras
htr
a
Meg
hal
ya
Pu
nja
b
Tam
il N
adu
Trip
ura
UP
Rs
in la
kh

24
A detailed analysis of the graph tells us that agriculturally less developed states got a better share of the
fund allocation, which is a positive sign from the development point of view. The North Eastern States;
Manipur, Nagaland, Assam, Mizoram and Sikkim have also received significant funds for the
implementation of PHTM Scheme.
3.2.3 Zone wise fund allocation
The 19 states where the PHTM program was implemented were divided into six zones as under (Table 3).
Of these, 8 states did not receive any funds and therefore were not considered for the purpose of
analysis. Hence, it can be seen that 3 states each East and South Zone were allocated funds by the MoA
for the implementation of the scheme where 4 states received funding in North Zone. From the West
Zone, only Rajasthan received funding for implementation of the program. Out of 8 North Eastern states,
6 states were allocated funds, while in the Central Zone, both Chhattisgarh and Madhya Pradesh received
funding.
Table 3 Zone wise segregation of states implemented PHTM Scheme during the XI FYP
Zones States
North Zone Haryana, Himachal Pradesh, J&K, UK East Zone Bihar, West Bengal, Odisha West Zone Rajasthan Central Zone MP, Chhattisgarh North East Zone Arunachal Pradesh, Assam, Manipur, Mizoram, Nagaland, & Sikkim South Zone AP, Karnataka, Kerala I
Figure 5 Zone wise fund allocation during XI FYP
As seen in the case of state wise allocation of funds, zone wise allocation also indicates a positive bias
towards the less developed East, Central and North Eastern Zones. North Eastern states accounted for a
major share of the allocated funds (Figure 5). They received a total of Rs. 965 lakh (45%) followed by
Central and Eastern Zone at Rs. 404 lakh (25%) and Rs. 313 lakh (15%) respectively. The other two zones
i.e. North Zone and South Zone received Rs 175 lakh (7%) and Rs 217 lakh (14%) of the total allocation
during the XI Five Year Plan.
175 217
965
404 313
25 0
200
400
600
800
1000
1200
North Zone SouthZone North East Zone
Central Zone
East Zone West Zone
Rs
in la
kh

25
3.2.4 Year wise shares of fund allocation across various zones
An analysis of the funds allocated under the PHTM scheme, indicates a rightward skew with respect to
the time frame of allocation of funds. Table 4 below gives the details of percentage of allocation of funds.
Table 4 Year wise share of fund allocation across six zones during the XI FYP
Zone Total Fund allocated
(In Rs. Lakh)
Years
2007-08 2008-09 2009-10 2010-11 2011-12
South Zone 217 0% 0% 18% 23% 59% North East Zone
965 3% 21% 3% 22% 52%
Eastern Zone 313 11% 21% 22% 29% 17% Central Zone 404 0% 18% 0% 28% 55% Western Zone 25 0% 0% 0% 100% 0% Northern Zone 175 0% 46% 0% 9% 45%
The above table indicates that nearly half of the allocations for South, North-East, Central and North
zones were made in the last year of the XI Five Year Plan. Of these, the East Zone comprising of Bihar,
Jharkhand, West Bengal and Odisha was the only zone to have a proper time spread with regard to
allocation of funds. In the West Zone, Rajasthan was the only state which received the allocation under
PHTM Scheme, that too during the year 2010-11.
3.2.5 Fund Utilization
Utilization is the process of making use of the funds allocated for a specific plan. To understand the
utilization pattern, states have been categorized into 3 broad categories. Table 5 below presents a
snapshot of extent of utilization of funds w.r.t. number of states.
Table 5 Distribution of states based on extent of fund utilized under PHTM scheme during the XI FYP
Fund Utilization Range Number of States Percentage
0-30% 7 37 31-60% 4 21 61-100% 8 42
Total 19 100
Out of 19 states which have been allocated funds for the PHTM Scheme, 7 states utilized only up to 30%
of the total fund, 4 states utilized between 30% and 60% of the total allocations; only 8 states utilized
more than 60% of the total allocations. Therefore 11 out of 19 States (58%) utilized less than 60% of the
total funds allocated to them.
One of the key reasons for low utilization is the skewed pattern of fund allocation. As the funds were
generally received in the last or the second last year of the XI Five Year Plan, it was difficult for the states
to utilize them on time.

26
Figure 6 State wise fund utilization pattern during XI FYP
As evident from figure 6 above, out of 19 states where the PHTM program has been implemented, 5
states, viz., Haryana, Jammu and Kashmir, Himachal Pradesh, Karnataka and West Bengal, spent 100% of
the funds in program implementation. Six states, viz., Andhra Pradesh, Assam, Kerala, Rajasthan, Sikkim
and Uttarakhand did not spend any amount for the implementation of the scheme and hence no progress
has been reported by the State Directorates of Agriculture in these states. Even among zones, out of 4
states in Northern Zone which received the allocation, 3 states utilized the funding to an extent of 100%.
The performance of states in East Zone remains average, except West Bengal which performed well,
utilizing 100% of the assistance during the XI Five Year Plan.
3.2.6 Utilization of fund- a time frame comparison
In the beginning of this chapter, we have stated that discrepancies in the allocation of funds hampered its
utilization. Here, in this section we can clearly see the effect. To understand the effect, we have divided
the five year timeline into two groups. The first group comprises of the first three years of the plan period
i.e. 2007-08, 2008-09 and 2009-10 and the second group comprises of the last two years of the plan
period i.e. 2010-11 and 2011-12. The pie charts (Figure 7) depicts the aggregate fund utilization pattern in
these two groups-
Six of the total 19 states which received assistance under the PHTM program did not utilize the funds
provided.
0%
20%
40%
60%
80%
100%
120%
Har
yan
a
HP
J&K
Kar
nat
aka
Wes
t B
enga
l
MP
Man
ipu
r
Bih
ar
Nag
alan
d
Ori
ssa
Aru
nac
hal
Pra
des
h
Ch
atti
sgar
h
Miz
ora
m
An
dh
ra P
rad
esh
Ass
am
Ker
ela
Raj
asth
an
Sikk
im
Utt
rakh
and
27
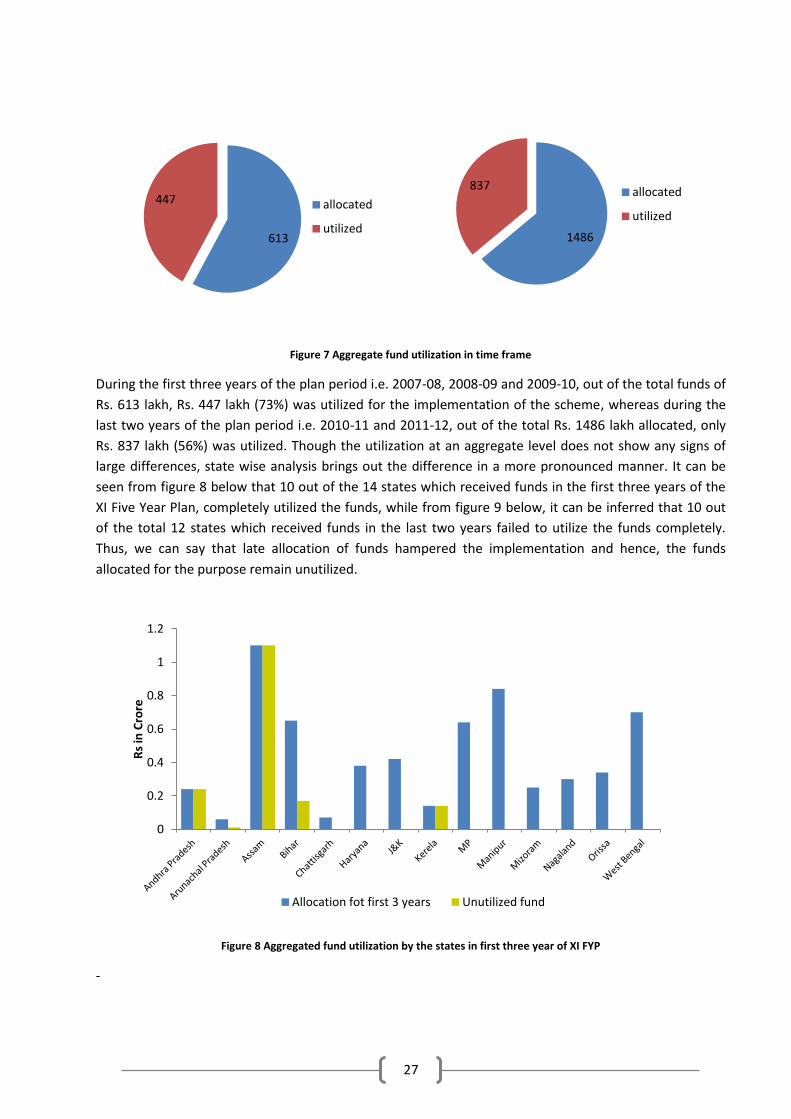
Figure 7 Aggregate fund utilization in time frame
During the first three years of the plan period i.e. 2007-08, 2008-09 and 2009-10, out of the total funds of
Rs. 613 lakh, Rs. 447 lakh (73%) was utilized for the implementation of the scheme, whereas during the
last two years of the plan period i.e. 2010-11 and 2011-12, out of the total Rs. 1486 lakh allocated, only
Rs. 837 lakh (56%) was utilized. Though the utilization at an aggregate level does not show any signs of
large differences, state wise analysis brings out the difference in a more pronounced manner. It can be
seen from figure 8 below that 10 out of the 14 states which received funds in the first three years of the
XI Five Year Plan, completely utilized the funds, while from figure 9 below, it can be inferred that 10 out
of the total 12 states which received funds in the last two years failed to utilize the funds completely.
Thus, we can say that late allocation of funds hampered the implementation and hence, the funds
allocated for the purpose remain unutilized.
Figure 8 Aggregated fund utilization by the states in first three year of XI FYP
-
613
447 allocated
utilized 1486
837 allocated
utilized
0
0.2
0.4
0.6
0.8
1
1.2
Rs
in C
rore
Allocation fot first 3 years Unutilized fund

28
Figure 9 Aggregated fund utilization by the states in last two year of XI FYP
3.2.7 Disbursement of Fund to CIPHET for implementation of PHTM Scheme
As stated earlier, the PHTM Scheme has also been implemented through the government sponsored
institution- ICAR. CIPHET is the nodal agency of ICAR which has been implementing the PHTM Scheme
under the purview of All India Coordinated Research Project on Post Harvest Technology (AICRP on PHT).
The institution has been implementing the scheme through their designated Centers across the country.
During the XI Five Year Plan, ICAR has been allocated total funds of Rs. 509 lakh, of which, as per the
report of M&T Division (DoAC), MoA, only Rs. 98 lakh has been utilized. However, as per the report
provided by CIPHET, under the Scheme Rs. 120.40 lakh has been disbursed to its different Centers. Table
6 gives the details of fund allocation to ICAR and funds reportedly used by CIPHET for demonstration of
equipment during the XI FYP. The highest disbursement of Rs. 52.15 lakh by CIPHET was made during the
last year of the XI Five Year Plan with an average allocation of Rs 7.4 lakh per Center. During the year
2008-09 and 2010-11, disbursement worth Rs 36.59 lakh and Rs 31.67 lakh respectively was made to 14
Centers, hence, on an average, each Center received Rs. 2.61 lakh and Rs. 2.26 lakh respectively, which is
almost three times less than what was allocated during the last financial year of XI Five Year Plan.
0
0.5
1
1.5
2
2.5
3
3.5
4
Rs
in C
rore
Allocation for last two years unutilized fund

29
Table 6 Fund allocated to ICAR and disbursed by CIPHET during the XI FYP
Year Fund allocated to ICAR (Rs in lakh)
Fund disbursed by CIPHET (Rs in lakh)
Remark Name of Centers
2007-08 40 nil -
2008-09 58 36.58 Fund released by CIPHET for demonstration to 14 Centers
Akola, Almora, Bangalore, Bhubaneswar, Coimbatore, Hissar, Jabalpur, Junagarh, Ludhiana, Pantnagar, Trivandrum, Udaipur, Raichur, Kasargod
2009-10 0 31.67 Fund released by CIPHET for demonstration to 14 Centers
- Do -
2010-11 411 nil -
2011-12 0 52.15 Fund released by CIPHET for demonstration to 7 Centers
Bhubneshwar, Banagalore, Coimbatore, Jabalpur, Pantnagar, Trivandrum, Udaipur
Total 509 120.4
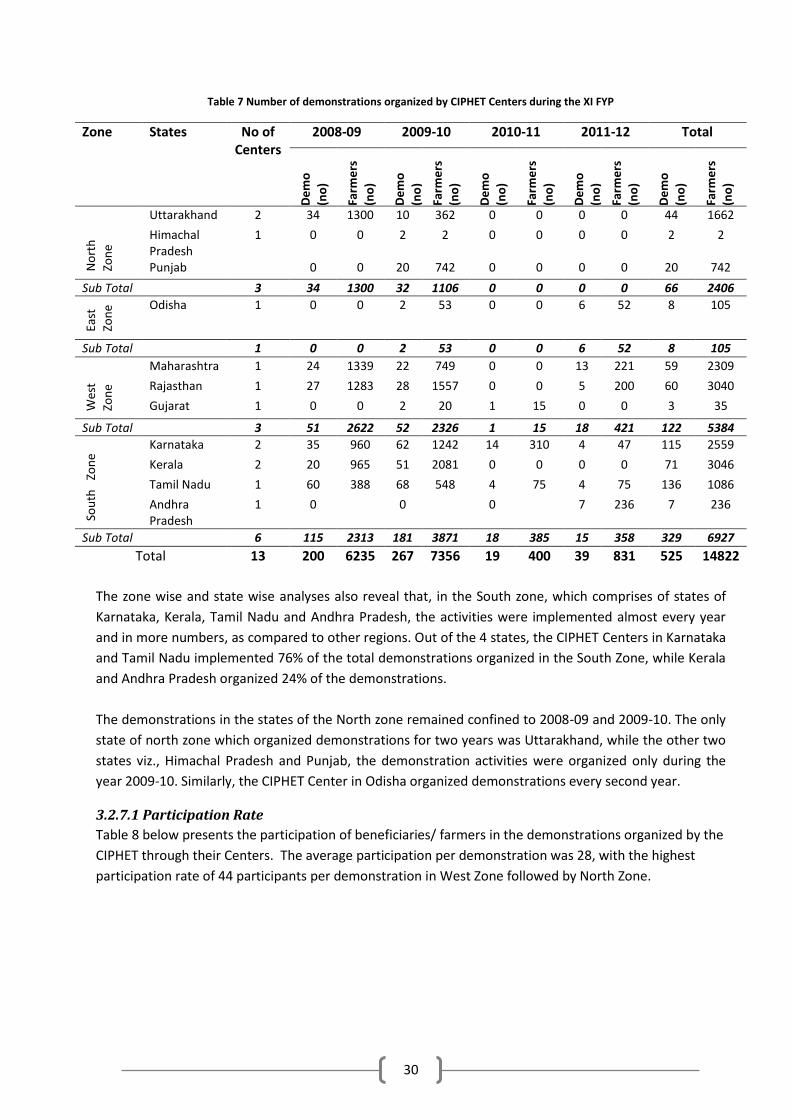
3.2.7 Year wise and Center wise demonstration on PHTM organized by CIPHET
CIPHET has organized the demonstration of equipment and units under Post Harvest Technology &
Management Scheme in 11 states through its 14 cooperating Centers during the XI FYP. Table 7 below
presents the total demonstrations organized by the CIPHET Centers each year.
During the XI Five Year Plan, 525 demonstrations were organized by CIPHET covering more than 14000
farmers/ beneficiaries. The activities organized during the first two years, 2008-09 and 2009-10, were
more as compared to the last two years (2010-11 and 2011-12) and therefore the participation recorded
during the first two years was also more than the last two years. Out of 525 demonstrations organized
during the XI Five Year Plan, 467 (89%) demonstrations were organized during the year 2008-09 and
2009-10, while only 58 demonstrations (11%) were organized during the year 2010-11 and 2011-12.
30
Table 7 Number of demonstrations organized by CIPHET Centers during the XI FYP
Zone States No of Centers
2008-09 2009-10 2010-11 2011-12 Total
De
mo
(no
)
Farm
ers
(no
)
De
mo
(no
)
Farm
ers
(no
)
De
mo
(no
)
Farm
ers
(no
)
De
mo
(no
)
Farm
ers
(no
)
De
mo
(no
)
Farm
ers
(no
)
No
rth
Zon
e
Uttarakhand 2 34 1300 10 362 0 0 0 0 44 1662
Himachal Pradesh
1 0 0 2 2 0 0 0 0 2 2
Punjab 0 0 20 742 0 0 0 0 20 742
Sub Total 3 34 1300 32 1106 0 0 0 0 66 2406
East
Zon
e Odisha 1 0 0 2 53 0 0 6 52 8 105
Sub Total 1 0 0 2 53 0 0 6 52 8 105
Wes
t
Zon
e
Maharashtra 1 24 1339 22 749 0 0 13 221 59 2309
Rajasthan 1 27 1283 28 1557 0 0 5 200 60 3040
Gujarat 1 0 0 2 20 1 15 0 0 3 35
Sub Total 3 51 2622 52 2326 1 15 18 421 122 5384
Sou
th
Zon
e
Karnataka 2 35 960 62 1242 14 310 4 47 115 2559
Kerala 2 20 965 51 2081 0 0 0 0 71 3046
Tamil Nadu 1 60 388 68 548 4 75 4 75 136 1086
Andhra Pradesh
1 0 0 0 7 236 7 236
Sub Total 6 115 2313 181 3871 18 385 15 358 329 6927
Total 13 200 6235 267 7356 19 400 39 831 525 14822
The zone wise and state wise analyses also reveal that, in the South zone, which comprises of states of
Karnataka, Kerala, Tamil Nadu and Andhra Pradesh, the activities were implemented almost every year
and in more numbers, as compared to other regions. Out of the 4 states, the CIPHET Centers in Karnataka
and Tamil Nadu implemented 76% of the total demonstrations organized in the South Zone, while Kerala
and Andhra Pradesh organized 24% of the demonstrations.
The demonstrations in the states of the North zone remained confined to 2008-09 and 2009-10. The only
state of north zone which organized demonstrations for two years was Uttarakhand, while the other two
states viz., Himachal Pradesh and Punjab, the demonstration activities were organized only during the
year 2009-10. Similarly, the CIPHET Center in Odisha organized demonstrations every second year.
3.2.7.1 Participation Rate
Table 8 below presents the participation of beneficiaries/ farmers in the demonstrations organized by the
CIPHET through their Centers. The average participation per demonstration was 28, with the highest
participation rate of 44 participants per demonstration in West Zone followed by North Zone.

31
Table 8 Participation/ demonstration organized by CIPHET Centers during the XI FYP
Zone States Total Average Participation (Participant/
demonstration) Demo (no) Farmers (no)
North Zone Uttarakhand 44 1662 38
Himachal Pradesh 2 2 1
Punjab 20 742 37
Sub Total 66 2406 36
Eastern Zone Odisha 8 105 13
Sub Total 8 105 13
Western Zone Maharashtra 59 2309 39
Rajasthan 60 3040 51
Gujarat 3 35 12
Sub Total 122 5384 44
South Zone Karnataka 115 2559 22
Kerala 71 3046 43
Tamil Nadu 136 1086 8
Andhra Pradesh 7 236 34
Sub Total 329 6927 21
Total 525 14822 28
Among the states, the highest participation rate was in Rajasthan followed by Kerala, while the lowest
with only one participant per demonstration was in Himachal Pradesh followed by Tamil Nadu (8
participant/ demonstration).
Out of 14822 participants, 4534 were women participants, accounting for 31% of the total participants.
Hence, despite the efforts, continuity of organizing demonstrations was not maintained except by two
Centers, Karnataka and Tamil Nadu, which organized demonstrations throughout the XI FYP. This defeats
the very purpose of organizing demonstrations for popularizing the equipment/ technologies and for
faster adoption of the same. Also, the participation in demonstration has not been that encouraging as
evident from the table 8 above and Centers in Himachal Pradesh, Odisha and even Tamil Nadu may take
corrective measures to improve the situation in future.
3.2.8 Equipments/ Technology Demonstrated by CIPHET
Table 9 illustrates the equipment/ technologies demonstrated by the CIPHET Centers in respective states.
The enlisted equipment/ technologies were demonstrated by the Centers during each year wherever the
demonstrations were organized for more than one year. Changes with respect to the demonstrated
technologies/ equipment were not observed during the entire plan period.
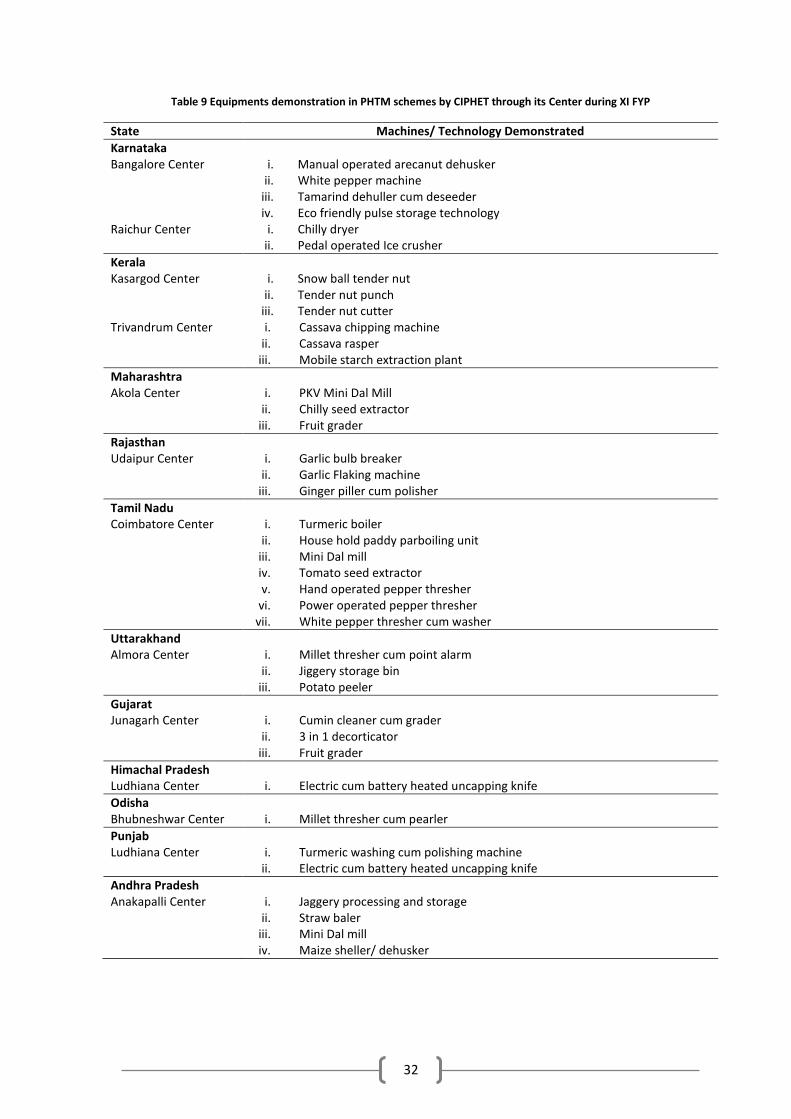
32
Table 9 Equipments demonstration in PHTM schemes by CIPHET through its Center during XI FYP
State Machines/ Technology Demonstrated
Karnataka Bangalore Center i. Manual operated arecanut dehusker
ii. White pepper machine iii. Tamarind dehuller cum deseeder iv. Eco friendly pulse storage technology
Raichur Center i. Chilly dryer ii. Pedal operated Ice crusher
Kerala Kasargod Center i. Snow ball tender nut
ii. Tender nut punch iii. Tender nut cutter
Trivandrum Center i. Cassava chipping machine ii. Cassava rasper
iii. Mobile starch extraction plant
Maharashtra Akola Center i. PKV Mini Dal Mill
ii. Chilly seed extractor iii. Fruit grader
Rajasthan Udaipur Center i. Garlic bulb breaker
ii. Garlic Flaking machine iii. Ginger piller cum polisher
Tamil Nadu Coimbatore Center i. Turmeric boiler
ii. House hold paddy parboiling unit iii. Mini Dal mill iv. Tomato seed extractor v. Hand operated pepper thresher
vi. Power operated pepper thresher vii. White pepper thresher cum washer
Uttarakhand Almora Center i. Millet thresher cum point alarm
ii. Jiggery storage bin iii. Potato peeler
Gujarat Junagarh Center i. Cumin cleaner cum grader
ii. 3 in 1 decorticator iii. Fruit grader
Himachal Pradesh Ludhiana Center i. Electric cum battery heated uncapping knife
Odisha Bhubneshwar Center i. Millet thresher cum pearler
Punjab Ludhiana Center i. Turmeric washing cum polishing machine
ii. Electric cum battery heated uncapping knife
Andhra Pradesh Anakapalli Center i. Jaggery processing and storage
ii. Straw baler iii. Mini Dal mill iv. Maize sheller/ dehusker

33
3.2.9 Equipments/ Technology Demonstrated by State Agriculture Departments (Sample
States) Table 10 Equipment/ Technology demonstrated through State Departments on PHTM Scheme
State Fund allocated Equipments Demonstrated
Remark
Andhra Pradesh Rs. 24 lakh (2009-10) NA Information not available
Tamil Nadu Nil - No Fund was allocated
Karnataka Rs 50 lakh (2010-11) and Rs. 128.68 lakh (2011-12)
Mini Dal Mill Multicrop thresher Maize sheller/ dehusker
Fund allocated during 2010-11 and Rs 2011-12. Fund released during 2011-12 was utilized for distribution of agro processing equipments under subsidy, namely mini rice mill, mini oil expeller, ragi cleaning machine, sugarcane crusher, chilly pounding machine, shaving machine, sugarcane juice making machine & multi crop thresher
Manipur Rs. 452 lakh Paddy Thresher Fund was allocated during all the years of XI FYP
Rajasthan Rs 25 lakh (2010-11) Fund was further allocated to MPUAT for demonstration of equipment
Maharashtra Nil No fund was allocated
Uttarakhand Rs 79 lakh (2011-12) Millet Thresher Dal Mill Jaggery Storage bin Potato chip cutter machine
Rs 79 lakh was sanctioned during 2011-12. However, there being no provision at the state government level due to technical reasons, the amount was revalidated to be spent during 2012-13.
Madhya Pradesh Rs 64 lakh (2008-09) Rs 44 lakh (2010-11) Rs 221 lakh (2011-12)
Training as well as demonstration were organized
Odisha Rs 34 lakh (2007-08) Rs 90 lakh (2010-11) Rs 54 lakh (2011-12)
Mini Dal Mill Power Groundnut Decorticator Power ground nut Stripper Power maize dehausker sheller R.R Rice sheller/ Polisher Tomato Seed Extractor Power Pulse Thresher Pulse cleaner cum Grader
Training and Demonstrations were organized
West Bengal Rs 70 lakh (2009-10) Seed Grader Seed Processing Machine
Training and demonstrations organized by State Ag. Department
Among the sample states, no funds were allocated to Tamil Nadu and Maharashtra and, therefore, no
demonstrations or training programs were organized. During the year 2010-11, an amount of Rs. 25 lakh
was allocated to Rajasthan State Agriculture Department which was further given to MPUAT for
organizing the demonstration activities. Manipur received the funds for demonstration activities in all the

34
five years of XI Five Year Plan amounting to Rs. 452 lakh, the major portion being received during the
years 2011-12 and 2010-11, at Rs. 253 lakh and Rs. 115 lakh respectively.

35
Chapter 4: Findings from Field
To capture the responses from participants of Post Harvest Technology and Management Scheme,
primary research were conducted in 10 states as indicated in table 2 of chapter 2. Two different
categories of beneficiaries (i) the training beneficiaries who have attended the training program and (ii)
the demonstration beneficiaries who have adopted/ used the equipment or technology, were
approached in person to understand their views and opinion on the demonstration as well as to assess
the effectiveness and usefulness of the scheme and equipment being used under demonstration. This
information was collected using structured questionnaires.
The nodal officers from the respective institutions which include the CIPHET implementing agencies and
State Agriculture Departments were also interviewed using semi structured questionnaires and open
interviews.
The sections in this chapter give a detailed analysis of primary research carried out for the PHTM Scheme.
4.1 Participant’s Response on Trainings organized under PHTM Scheme The training participants were covered from three states, viz., Madhya Pradesh, Odisha and Uttarakhand.
The beneficiaries were selected on the basis of information shared by implementing agencies and
availability of participants. A total of 118 training participants were covered, out of which 63, 49 and 6
beneficiaries belonged to Madhya Pradesh, Odisha and Uttarakhand, respectively.
4.1.1 Demographic Details of Respondents participated in training program Table 11 Demographic profile of Training respondents under PHTM Scheme
State Total Sample
Age (Years) Gender Caste
Average Min Max Female Male SC ST OBC Others
Madhya Pradesh
63 43 17 70 13 50 3 9 30 21
Odisha 49 38 22 78 13 36 6 17 2 24
Uttarakhand 6 51 37 60 - 6 5 - 1 -
Total/Overall 118 41.1 17 78 26 92 14 26 33 45
The average age of the participants in the survey was found to be 41 years with minimum age being 17
years and maximum age being 78 years. Among the states, the average age of participants of Uttarkhand
was found to be the highest compared to Madhya Pradesh and Uttarakhand. Out of 118 samples, the
participation of females in the training program from the sample states was 22% (26) while 78% (92) were
male participants.
Of the total respondents, Scheduled Castes constituted 13 per cent, Scheduled Tribes 27per cent, Other
Backward Classes 37 per cent and Others constituted 28 per cent. Among the three states, the
representation of Scheduled Castes and Scheduled Tribes in Odisha have been encouraging, with 12% and
35% respectively. In Madhya Pradesh 48% of the participants belonged to Other Backward Class and 33%
belonged to general category. The participation of scheduled tribes was 14%.
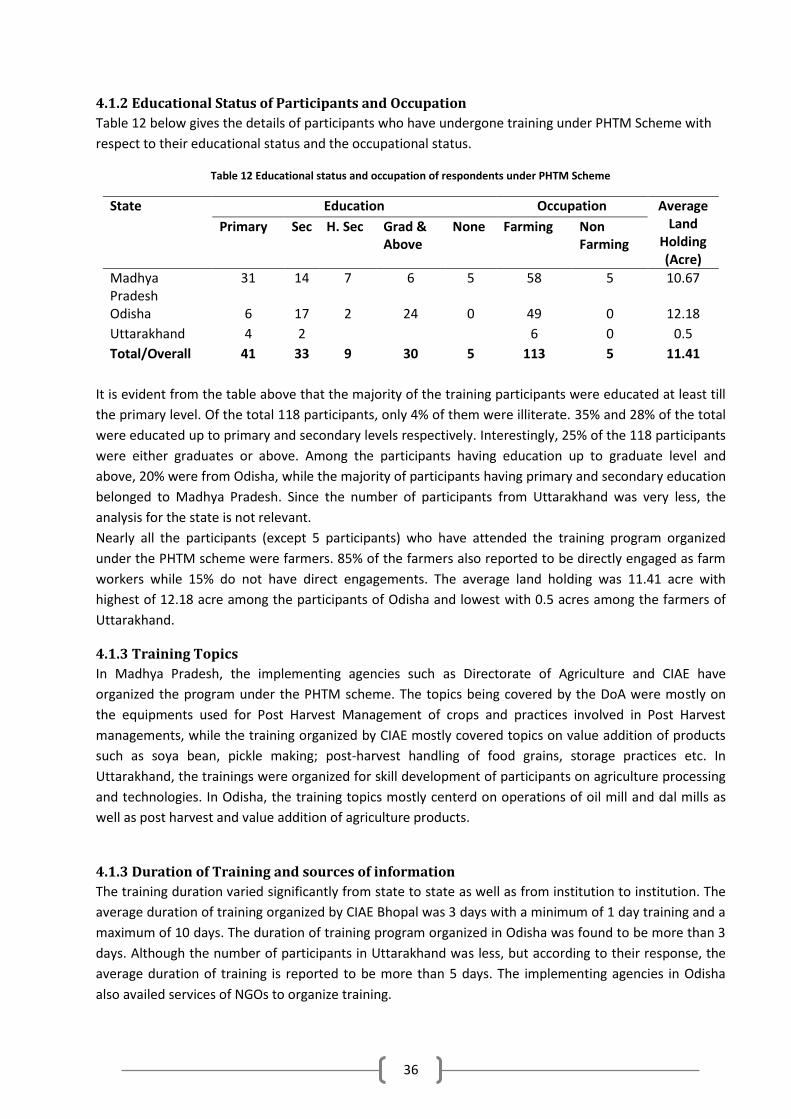
36
4.1.2 Educational Status of Participants and Occupation
Table 12 below gives the details of participants who have undergone training under PHTM Scheme with
respect to their educational status and the occupational status.
Table 12 Educational status and occupation of respondents under PHTM Scheme
State Education Occupation Average Land
Holding (Acre)
Primary Sec H. Sec Grad & Above
None Farming Non Farming
Madhya Pradesh
31 14 7 6 5 58 5 10.67
Odisha 6 17 2 24 0 49 0 12.18
Uttarakhand 4 2 6 0 0.5
Total/Overall 41 33 9 30 5 113 5 11.41
It is evident from the table above that the majority of the training participants were educated at least till
the primary level. Of the total 118 participants, only 4% of them were illiterate. 35% and 28% of the total
were educated up to primary and secondary levels respectively. Interestingly, 25% of the 118 participants
were either graduates or above. Among the participants having education up to graduate level and
above, 20% were from Odisha, while the majority of participants having primary and secondary education
belonged to Madhya Pradesh. Since the number of participants from Uttarakhand was very less, the
analysis for the state is not relevant.
Nearly all the participants (except 5 participants) who have attended the training program organized
under the PHTM scheme were farmers. 85% of the farmers also reported to be directly engaged as farm
workers while 15% do not have direct engagements. The average land holding was 11.41 acre with
highest of 12.18 acre among the participants of Odisha and lowest with 0.5 acres among the farmers of
Uttarakhand.
4.1.3 Training Topics
In Madhya Pradesh, the implementing agencies such as Directorate of Agriculture and CIAE have
organized the program under the PHTM scheme. The topics being covered by the DoA were mostly on
the equipments used for Post Harvest Management of crops and practices involved in Post Harvest
managements, while the training organized by CIAE mostly covered topics on value addition of products
such as soya bean, pickle making; post-harvest handling of food grains, storage practices etc. In
Uttarakhand, the trainings were organized for skill development of participants on agriculture processing
and technologies. In Odisha, the training topics mostly centerd on operations of oil mill and dal mills as
well as post harvest and value addition of agriculture products.
4.1.3 Duration of Training and sources of information
The training duration varied significantly from state to state as well as from institution to institution. The
average duration of training organized by CIAE Bhopal was 3 days with a minimum of 1 day training and a
maximum of 10 days. The duration of training program organized in Odisha was found to be more than 3
days. Although the number of participants in Uttarakhand was less, but according to their response, the
average duration of training is reported to be more than 5 days. The implementing agencies in Odisha
also availed services of NGOs to organize training.

37
Figure 10 Sources of information for training program under PHTM Scheme
As evident from the figure 10 above, the major source of information about the training program remains
the government officials and departments. 88% of the respondents said that they received the
information about the training program from the government officials; 6% received the information
through word-of-mouth from their relatives, friends and neighbors while 6% of the respondents
received the information from other sources, which in this case, are NGOs working in the region who
have their contacts with the line department.
4.1.4 Motivation for attending the training program
With a view to understand the motivation of beneficiaries for attending training program, the responses
have been compiled in figure 11 below. A total of five options were provided to the respondents to
indicate the reason for attending the training program. Since the responses indicated by the beneficiaries
were more than one, percentage response for each option was calculated to see the relative importance
of each option.
Figure 11 Motivation for attending the training course under PHTM Scheme
From the figure above, it becomes evident that need for Enhancement of Skill, Enhanced Awareness and
Utilization of Post Harvest Equipment/ Post Harvest Technology and Management were major
Words of Mouth, 6%
Government/ Official
Source, 88%
Others, 6%
39%
27% 25%
32% 33%
26% 25%
29%
19%
23% 25%
22%
5% 3%
25%
4% 3%
21%
25%
13%
0%
10%
20%
30%
40%
50%
Madhya Pradesh Odisha Uttarakhand Overall Enhance Skill Enhance awareness on PHTM Utilization of equipment/ technology
Free/subsidized course Use spare time

38
motivators accounting for 32%, 29% and 22% , respectively. In Madhya Pradesh, 39% of the responses
pertain to Enhancement of Skills and 33% pertains to Enhancement of Awareness on PHTM practices,
clearly indicating their priority on these two aspects; while in Odisha, the priority is also to Utilize
Equipment and Technology on Post Harvest Management of Crops. In Uttarakhand, the beneficiaries
indicated the priority equally across all the options. This is due to the lesser number of observations that
limit the variations in observations.
4.1.5 Effectiveness of Training Program
The effectiveness of training organized by implementing agencies under PHTM Scheme has been
evaluated with reference to five different factors, viz., Relevance of Training Program to beneficiary need,
Appropriateness of Training Content, Provision of Course Material, Usefulness of Training and Duration of
Training. The variables are measured based on the beneficiary’s opinion, which is presented in table 13
and 14 below. Overall 94% of the beneficiaries found the training program organized under the PHTM to
be relevant, while 6% opined the program to be partially relevant. All the beneficiaries in Odisha and
Madhya Pradesh opined the training course to be relevant while 11% beneficiaries from Madhya Pradesh
felt the training to be partially relevant.
Table 13 Effectiveness of Training Program organized under PHTM Scheme
State Training Program relevance to need of trainees
Appropriateness of Content
Re
leva
nt
%
Par
tial
ly
Re
leva
nt
%
No
t R
ele
van
t %
Ap
pro
pri
ate
%
No
t A
pp
rop
riat
e
%
Madhya Pradesh
56 89% 7 11% 0 0% 62 98% 1 2%
Odisha 49 100% 0 0% 0 0% 45 92% 4 8%
Uttarakhand 6 100% 0 0% 0 0% 6 100% 0 0%
Overall 111 94% 7 6% 0 0% 113 96% 5 4%
With respect to Appropriateness of Content in training, 96% of the training beneficiaries believed that the
Content of Training Program was appropriate while 4% believed the training content was not
appropriate; 8% of beneficiaries from Odisha also considered the content to be not appropriate.
Of the total beneficiaries 96% indicated that they received the training course material; 8% of the
participants from Madhya Pradesh reported non receipt of any course material during the training
program. On receiving the training material, 83% of the total training participants found the course
material to be useful while 17% found the materials to be partially useful. The highest percentage of
participants who said that the training material was partially useful was from Madhya Pradesh. Since the
participants from Uttarakhand were very few, it would not be appropriate to explain such variations;
however, majority believed that the materials were partially useful. The average number of training days
was found to be approximately 3 days, which 94% of the beneficiaries believed to be adequate, although
10% of the participants from MP believed that such training may be imparted for a longer time period of
approximately 5 to 7 days.

39
Table 14 Effectiveness of Training Program organized under PHTM
State Provision of Course Material
Usefulness of Course Material Duration of Training
Ye
s
%
No
%
Use
ful
%
Par
tial
ly
Use
ful
%
No
t U
sefu
l
%
Ad
equ
ate
%
No
t
Ad
equ
ate
%
Madhya Pradesh
58 92% 5 8% 48 76% 15 24% 0 0% 57 90% 6 10%
Odisha 49 100% 0 0% 49 100% 0 0% 0 0% 48 98% 1 2%
Uttarakhand 6 100% 0 0% 1 17% 5 83% 0 0% 6 100% 0 0%
Overall 113 96% 5 4% 98 83% 20 17% 0 0% 111 94% 7 6%
4.1.6 Appropriateness of Training Logistics
The training logistics made available during the training program were evaluated against four variables:-
Training Material Provided, Boarding and Lodging facilities, Equipment shown/ made available during the
training program and use of modern equipment of training such as Audio Visual Aids. The findings, as
opined by the participants, are presented in table 15 below.
Table 15 Appropriateness of Training Logistics
State Training Material Boarding/ Lodging Facilities Equipments shown/ Demonstrated
Audio Visual Aids Used
Ad
eq
uat
e
%
No
t A
de
qu
ate
%
Sati
sfac
tory
%
Par
tial
ly
Sati
sfac
tory
%
No
t Sa
tisf
acto
ry
%
Ad
eq
uat
e
% N
ot
Ad
eq
uat
e %
Ye
s
%
No
%
Madhya Pradesh
60 95% 3 5% 54 86% 9 14% 0 0% 61 97% 2 3% 61 97% 2 3%
Odisha 49 100% 0 0% 38 78% 11 22% 0 0% 49 100% 0 0% 42 86% 7 14%
Uttarakhand 6 100% 0 0% 6 100% 0 0% 0 0% 6 100% 0 0% 0 0% 6 100%
Overall 115 97% 3 3% 98 83% 20 17% 0 0% 116 98% 2 2% 103 87% 15 13%
From table 15 above it could be seen that, more than 90% of the beneficiaries gave positive feedback on
the Adequacy of Training Materials, Equipment used/ demonstrated; however, a significant 17% of the
beneficiaries showed concern on the boarding/ lodging facilities arranged. Almost 22% and 14% of the
participants from Odisha and MP respectively, rated the arrangement under this category as partially
satisfactory. This may be improved in future. 87% of the beneficiaries said that the Audio Visual Aids used
for training made the sessions more interactive. No audio visual aids were used in Uttarakhand as the
trainings were organized was on field and not in house.

40
4.1.7 Usefulness and Utilization of Training Program under PHTM
Table 16 Utilization of Training Skills by the participants after attending PHTM Training
State Total Brought/Setup PH Equipment
Better maintenance and use of Equipment
Adopted change in PH Practices
Training/Helping other farmers
Use
d %
No
t U
sed
%
Ye
s
%
No
%
Ye
s
%
No
%
Ye
s
%
No
%
Ye
s
%
No
%
Madhya Pradesh
52 83 11 17 7 11 56 89 20 32 43 68 27 43 36 57 23 37 40 63
Odisha 42 86 7 14 7 14 42 86 48 98 1 2 46 94 3 6 42 86 7 14
Uttarakhand 6 100 0 0 0 0 6 100 6 100 0 0 6 100
0 0 0 0 6 100
Overall 100 85 18 15 14 12 104 88 74 63 44 37 79 67 39 33 65 55 53 45
Out of 118 participants who attended the training program under PHTM Scheme, 100 (85%) indicated
that they used the knowledge gained in some way or the other. 14 beneficiaries adopted equipment
demonstrated under the scheme. The highest adoption rate (14%) was in Odisha followed by MP (11%).
Overall, 67% of the participants adopted better Post Harvest Management practices. In Odisha, 94% of
the beneficiaries stated that they had adopted better Post Harvest Management Practices and 43% of the
participants in Madhya Pradesh also reported adoption of better Post Harvest Management Practices.
55% of all the participants indicated that they advocated and shared the practices with other farmers on
post harvest management. Though in terms of, the feedback on adoption of technology was not
encouraging as only 14% of the respondents confirmed that they adopted the new equipment and
technology, however, in terms of improving the practices in post harvest and sharing their learning with
other farmers, the participants had played a significant role.
4.1.8 Impact of PHTM Training Program
The beneficiaries were asked on different variables to assess the post training impact on Post Harvest
Technology & Management. The beneficiaries were also asked to give their opinion on selected variables
such as reduction in post harvest Losses, reduction in wastage (asked to rate on a 5 point scale in pre and
post training periods), adoption of practices such as cleaning, drying and grading, usage of storage
devices, change in income due to reduction in losses/ surplus product due to adoption in improved
practices and change in skill level (rate in 5 point scale in pre and post training periods). The findings are
presented in table 17 below.
Out of 118 participants, 69 (58%) reported reduction in post harvest losses by adopting improved
practices. The average post harvest losses reported by participants on a 5 point scale before attending
the training was 2.68 which declined to 2.08 after training; thereby accounting for a reduction of 22
percentage points. The highest reduction was reported by the beneficiaries from Odisha (55% points)
followed by Madhya Pradesh (45%). Twenty four beneficiaries (20.3%) reported adoption of practices
such as cleaning, drying and grading practices. Eighteen participants have adopted improved storage
practices after attending the training program on Post Harvest Technology & Management. Almost 37%
of the participants reported increase in income due to reduction in crop losses. In monetary terms, the
participants from Madhya Pradesh reported savings from Rs 400 to Rs 6000, while the participants from
Odisha reported increase in income by 20% to 35% from the previous period on the same crops. The

41
participants from Uttarkhand reported increase in income due to reduction of crop losses, though it was
difficult to quantify.
Table 17 Impact of PHTM Training Program
State Reduction in Post Harvest Losses
Reduction in Wastage of
Produce (Avg Points)
Adoption of
Improved practices (Cleaning,
Drying and
Grading )
Use of Storage/
Packaging devices
Change in
Income
Change in Skill Levels
Yes % No % P
re
Trai
nin
g
Po
st
Trai
nin
g
Po
st
Trai
nin
g
Po
st
Trai
nin
g
Po
st
Trai
nin
g
Pre
Tr
ain
ing
Po
st
Trai
nin
g
Madhya Pradesh
37 59% 26 41% 2.66 1.45 11 5 27 1.25 2.69
Odisha 26 53% 23 47% 3.05 1.36 7 7 11 2.36 4.26
Uttarakhand 6 100% 0 0% 4 2 6 6 6 2 5
Overall 69 58% 49 42% 2.68 2.08 24 18 44 1.77 3.48
The participants also reported change in skill level after attending the training program from 1.77 points
to 3.48 points, which is significant.
4.1.9 Overall Rating of Training Program
The training participants were also asked to rate the training program on a scale of 10 where 0 being the
worst and 9 being excellent, based on their overall experiences.
Table 18 Average rating score given by the participants of PHTM training
State Average Score
Madhya Pradesh 7.19
Odisha 5.79
Uttarakhand 8.66
Overall 6.68
Combined average, rating for PHTM training given by the participants is 6.68. The lowest score was given
by the participants in Odisha while the highest was given by the participants from Uttarakhand. In Odisha,
the participants also suggested improvements in the training program through more elaborative sessions
and by incorporating practical sessions.
4.1.10 Opinion on Training Component of the Scheme
Overall, the training program was satisfactory and has been able to achieve its major objectives.
However, efforts need to be intensified to increase the adoption rate through proper extension
initiatives. Improving the rate of adoption of new technology should continue to be the core focus of the
training programmes.
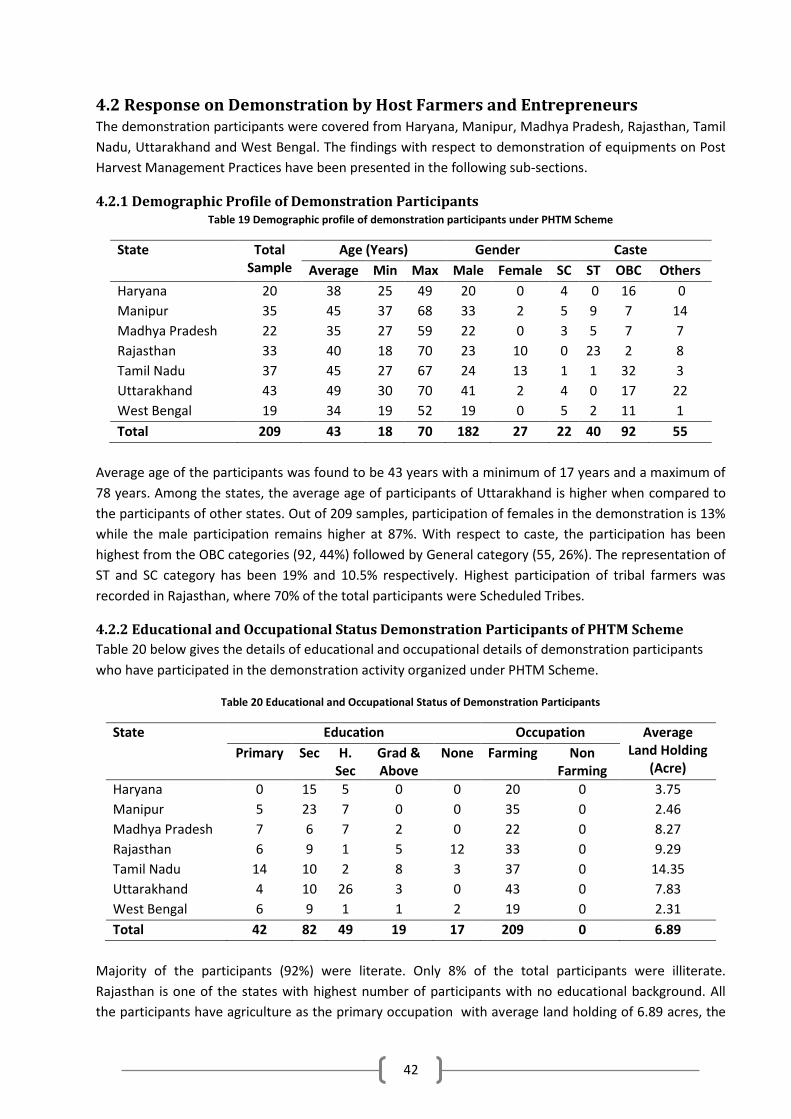
42
4.2 Response on Demonstration by Host Farmers and Entrepreneurs The demonstration participants were covered from Haryana, Manipur, Madhya Pradesh, Rajasthan, Tamil
Nadu, Uttarakhand and West Bengal. The findings with respect to demonstration of equipments on Post
Harvest Management Practices have been presented in the following sub-sections.
4.2.1 Demographic Profile of Demonstration Participants Table 19 Demographic profile of demonstration participants under PHTM Scheme
State Total Sample
Age (Years) Gender Caste
Average Min Max Male Female SC ST OBC Others
Haryana 20 38 25 49 20 0 4 0 16 0
Manipur 35 45 37 68 33 2 5 9 7 14
Madhya Pradesh 22 35 27 59 22 0 3 5 7 7
Rajasthan 33 40 18 70 23 10 0 23 2 8
Tamil Nadu 37 45 27 67 24 13 1 1 32 3
Uttarakhand 43 49 30 70 41 2 4 0 17 22
West Bengal 19 34 19 52 19 0 5 2 11 1
Total 209 43 18 70 182 27 22 40 92 55
Average age of the participants was found to be 43 years with a minimum of 17 years and a maximum of
78 years. Among the states, the average age of participants of Uttarakhand is higher when compared to
the participants of other states. Out of 209 samples, participation of females in the demonstration is 13%
while the male participation remains higher at 87%. With respect to caste, the participation has been
highest from the OBC categories (92, 44%) followed by General category (55, 26%). The representation of
ST and SC category has been 19% and 10.5% respectively. Highest participation of tribal farmers was
recorded in Rajasthan, where 70% of the total participants were Scheduled Tribes.
4.2.2 Educational and Occupational Status Demonstration Participants of PHTM Scheme
Table 20 below gives the details of educational and occupational details of demonstration participants
who have participated in the demonstration activity organized under PHTM Scheme.
Table 20 Educational and Occupational Status of Demonstration Participants
State Education Occupation Average Land Holding
(Acre) Primary Sec H.
Sec Grad & Above
None Farming Non Farming
Haryana 0 15 5 0 0 20 0 3.75
Manipur 5 23 7 0 0 35 0 2.46
Madhya Pradesh 7 6 7 2 0 22 0 8.27
Rajasthan 6 9 1 5 12 33 0 9.29
Tamil Nadu 14 10 2 8 3 37 0 14.35
Uttarakhand 4 10 26 3 0 43 0 7.83
West Bengal 6 9 1 1 2 19 0 2.31
Total 42 82 49 19 17 209 0 6.89
Majority of the participants (92%) were literate. Only 8% of the total participants were illiterate.
Rajasthan is one of the states with highest number of participants with no educational background. All
the participants have agriculture as the primary occupation with average land holding of 6.89 acres, the
43
lowest recorded 2.31 acres among the participants from West Bengal and highest among the farmers of
Tamil Nadu (14.35 acre).
4.2.3 State wise demonstration hour and participation rate
Table 21 below gives the overview of demonstration time and average participation per demonstration.
Table 21 Hours of demonstration and participation rate under PHTM Scheme
State Demonstration (Hrs)
Average Participation
Haryana 9.1 45
Manipur 1.66 26
Madhya Pradesh 1.23 35
Rajasthan 2.48 175
Tamil Nadu 3.85 40
Uttarakhand 0.92 26
West Bengal 1 28
Overall 2.8 53
The overall average time of demonstration was 2.8 hours with average participation of 53 persons. The
time taken for demonstration in Haryana is found to be highest with average 9.1 hours per demonstration
but, on an average, the participation per demonstration is only 45 participants. This clearly reveals the
fact that farmers have used the technology in the name of demonstration. Rajasthan is one of the states
which recorded the highest participation of farmers, which may be due to new innovative technology
being demonstrated in the area. The participation recorded is 175 per demonstration. The lowest
participation was found in hilly states such as Manipur and Uttarakhand where the average participation
was 26.
4.2.4 Equipments Demonstrated and their Usefulness
Regarding the various equipments demonstrated, farmer opinion and perception on their usefulness are
given in the table 22 below.
It is evident from the table 22 below, that the majority of responses (89%) have indicated the equipments
demonstrated are useful and can be adopted, however the adoption of any equipments also depends on
the existing cropping pattern of the region. The equipment which meets the local cropping pattern
appears to be more popular. From the table it can be very clearly seen that equipments such as paddy
thresher, paddy parboiling units, dal mills, millet threshers are relatively more useful than other
equipments. The local cropping pattern as well as additional equipments and technology also determines
the usefulness of any technology. For example, the farmers from Rajasthan though convinced of ginger
peeler cum polisher but because the region does not produce any ginger and marketing problems related
to ginger, the equipments may not be adopted. Moreover, the demonstration of ginger peeler cum
polisher is a standalone demonstration which will not serve the overall purpose unless and until it is
properly supplemented with washer and drier. Similarly, the alovera gel extractors and garlic bulb breaker
may not be of use for the farmers where the demonstrations have been organized. The cost of
equipments is also a determining factor in its adoption.

44
Table 22 Equipments demonstrated and their usefulness
State Equipments Used/ demonstrated
Total Responses
(No)
Farmers Perception
Useful % Not so useful
%
Haryana Carrot Washer 12 10 83% 2 17%
Power driven Chaff cutter 8 8 100% 0 0%
Manipur Paddy Thresher 35 35 100% 0 0%
Rajasthan Ginger peeler cum polisher 26 23 88% 3 12%
Aloevera gel extractor 16 8 50% 8 50%
Garlic bulb breaker 8 4 50% 4 50%
Tamil Nadu Tomato Seed Extractor 18 14 78% 4 22%
Paddy parboiling unit 32 31 97% 2 6%
Mini Dal Mill 14 14 100% 0 0%
Pepper Thresher 6 4 67% 2 33%
Pepper Peeler cum washer 5 4 80% 1 20%
Pepper grader 6 5 83% 1 17%
Uttarakhand Millet Thresher 18 18 100% 0 0%
Dal Mill 4 4 100% 0 0%
Jaggery Storage Bin 16 14 88% 2 13%
Potato chip cutter 5 4 80% 1 20%
Maize sheller 23 19 83% 4 17%
Paddy Thresher 18 18 100% 0 0%
West Bengal Seed Grader 19 19 100% 0 0%
Sun Flower thresher 12 12 100% 0 0%
Overall 301 268 89% 34 11%
The equipments such as seed grader and sun flower thresher may not suit the farmers with small land
holding or until it is set up as an enterprise covering large number of users.
4.2.5 Post Demonstration Impact at Output Level
Table 23 presents the details of technology demonstrated, extent of adoption and future prospects of
adoption of the demonstrated technology. The Table also demonstrates the priority of beneficiaries for
the types of equipment based on their future usability.
As evident from the table, 143 (48%) out of 301 respondents have used the technology either fully or
partially. Out of the 143 respondents who used the technology, 83 of them adopted the technology to its
full extent while 60 of them used it partially which is 28% and 20% of the total respondents, respectively.
Hence it can be said that out of the total sample respondents, 28% of the participants have adopted the
technology to its full extent. Additionally, 96 participants (32%) who have either partially used the
equipment/ technology or have found it beneficial have shown inclination to use and adopt the
technology in future.

45
Table 23 Technology demonstrated, used and future prospect of adoption
State Equipments Used/ demonstrated
Total Respondents
(No)
Technology Used
Extent of Technology Adoption
Plan to adopt the
equipment
Yes No Fully Partially Yes No
Haryana Carrot Washer 12 4 8 4 0 8 0
Power driven Chaff cutter 8 8 0 8 0 0 0
Manipur Paddy Thresher 35 28 7 3 25 25 0
Rajasthan Ginger peeler cum polisher 26 1 25 1 0 0 25
Aloevera gel extractor 16 0 16 0 0 0 16
Garlic bulb breaker 8 1 7 0 1 3 5
Tamil Nadu Tomato Seed Extractor 18 0 18 0 0 0 18
Paddy parboiling unit 32 12 20 12 0 20 0
Mini Dal Mill 14 14 0 14 0 0 0
Pepper Thresher 6 2 4 1 1 4 0
Pepper Peeler cum washer 5 2 3 2 0 3 0
Pepper grader 6 2 4 2 0 2 0
Uttarakhand Millet Thresher 18 18 0 3 15 13 2
Dal Mill 4 1 3 1 0 1 2
Jaggery Storage Bin 16 7 9 5 2 2 7
Potato chip cutter 5 4 1 4 0 0 1
Maize sheller 23 9 14 8 1 3 11
Paddy Thresher 18 18 0 3 15 12 3
West Bengal Seed Grader 19 0 19 0 0 0 19
Sun Flower thresher 12 12 0 12 0 0 0
Overall 301 143 158 83 60 96 109
An attempt has been made to assess the adoption potential of the above listed equipment in future. The
assessment has been made based on the willingness of more than 60% of the total respondents to
purchase the equipment. The equipment which are used for the purpose of threshing and washing such
as millet thresher, paddy thresher, carrot washer, pepper thresher, paddy parboiling units, etc. are given
priority. The least preferred equipments by the respondents were ginger peeler cum polisher, aloevera
gel extractor, tomato seed extractor, dal mills, potato chip cutter and seed grader, sunflower thresher,
etc. These machines perform very specific functions and hence, are not very useful to a common farmer.
4.2.6 Adequateness of demonstration conducted under PHTM Scheme
The participants of the PHTM demonstration were asked to give their views on adequacy of
demonstration time, i.e., hours for which the demonstration was organized, and rate the demonstration
as perceived by them on a 3 point scale. Overall 60% of the total respondents opined that the duration of
demonstration was adequate while 40% felt that the duration was not adequate. Among the participants
from seven sample states, 91% of the participants from Rajasthan and 86% from Tamil Nadu, felt that the
duration of demonstration was not sufficient and may be increased. All the participants from Haryana
and West Bengal felt that the duration of demonstration was adequate.

46
Table 24 Adequateness of demonstration time and rating of demonstration
State Total Sample
Demonstration Time Rating of Demonstration
Ad
equ
ate
%
In
adeq
uat
e
%
Ver
y W
ell
Org
aniz
ed
%
Wel
l O
rgan
ized
%
No
t so
wel
l o
rgan
ized
%
Haryana 20 20 100% 0 0% 0 0% 20 100% 0 0%
Manipur 35 23 66% 12 34% 9 26% 23 66% 2 6%
Madhya Pradesh
22 18 82% 4 18% 5 23% 12 55% 5 23%
Rajasthan 33 3 9% 30 91% 20 61% 13 39% 0 0%
Tamil Nadu 37 5 14% 32 86% 13 35% 14 38% 10 27%
Uttarakhand 43 38 88% 5 12% 35 81% 8 19% 0 0%
West Bengal 19 19 100% 0 0% 0 0% 19 100% 0 0%
Total 209 126 60% 83 40% 82 39% 109 52% 17 8%
With regard to organization of demonstration, 39% of the participants rated the demonstration to be
very well organized, 52% rated the demonstration to be well organized and the rest 8% said that the
demonstration was not so well organized and that there is scope for improvement in the future. A high
percentage of the participants (27%) from Tamil Nadu felt that the demonstration was not organized well,
while 23% from Madhya Pradesh also felt the same. Hence overall the organization of demonstration was
satisfactory.
4.2.7 Entrepreneurs Response on the Units established under the PHTM Scheme
A total of 25 entrepreneurs from four states West Bengal, Karnataka, Haryana and West Bengal were
interviewed to get their opinion on units established under the PHTM Scheme. The highest number of
entrepreneurs has been found in the Karnataka. The units installed by the entrepreneurs in Karnataka are
sugarcane crusher, chilly pounding machines, mini oil mill, noodle makers, flour mills and mini rice mills.
Out of the 25 units visited, only one unit in Uttarakhand was installed by a cooperative society while the
rest 25 are being operated by individual entrepreneurs. Subsidy, to an extent of 25 to 50 per cent has
been provided to the beneficiaries who have installed the units depending on the type of machinery set
up. Out of 25 cases, it was observed, that in about 19 of the cases, the finance have been obtained locally
and not from any formal financial institution. Only in 6 out of 25 cases, the participants had availed
finance from Banks and other formal sources like NABARD Financial Services Limited (NABFINS). It has
also been learnt from the participants that though the equipments were useful, their high cost was
coming in the way of adoption because sourcing finance from formal sources has been quite difficult.
In more than 90% of the cases, the units are operating successfully and major reason cited for this success
other than the efforts of the entrepreneurs is the availability of raw material in the area of operations.
Such successes have been observed among the chilly pounding units, oil mills and rice mills where supply
of raw material has supported the viability of the units. A lesser success rate has been observed in units
such as sugar cane crusher and flour mills. The entrepreneurs also felt the need for training towards
better operations of machineries as well as on repair and maintenance and linkages with financial
institutions for obtaining loan for setting up units.
47
4.2.8 Opinion on Demonstration Component of the Scheme
Response of the farmers who attended the demonstration of Post Harvest machineries was mixed. A
significant number of beneficiaries were not satisfied with the way the demonstration was carried out
and felt that there is scope for improvement in the future. They felt a need for increase in the duration of
demonstration on the field. Additionally, a demand driven approach on demonstration of equipment
based on the crop would be more effective towards increasing the adoption rate which will ultimately
result in reduction in Post Harvest Losses.
Demonstration is an important activity and its continuation is vital in order to educate farmers on the use
of post harvest machines to reduce the losses at the farm level.

48
Chapter 5: Insights and Recommendations
Based on the interactions with and feedback received from various stakeholders comprising mainly of the
officials of the implementing agencies, State Agriculture Universities, Directorate of Agriculture, CIPHET
Centers, participants of training & demonstration and entrepreneurs who have set up units under the
PHTM Scheme the insights and recommendations for appropriate policy changes and improvements in
the Scheme are as under.
A. Recommendations on Better Fund Allocation And Utilization
1. It has been observed that the fund allocation under the PHTM Scheme remained skewed over the
entire XIth Five Year Plan. Nearly, 73% of the total fund was allocated during the last two years
(2010-11 & 2011-12) of XI Five Year Plan with only 27% being allocated during the first three
years (2007-08 to 2009-10). Such skewed allocation (tail-end loading) affected the
implementation of the scheme in terms of its slow progress as many projects are still under the
gestation period at the time of evaluation. It was observed that implementation of a part of the
scheme spilled over the XI Five Year Plan.
2. Only 19 out of 27 states received funds under the scheme. Gujarat, Jharkhand, Maharashtra,
Meghalaya, Punjab, Tripura and Uttar Pradesh did not receive any funding support. Although,
agriculturally less developed states do deserve larger support, states with high production
potential too need to be supported for improved post harvest management practices and
technologies to improve efficiency in post harvest operations and reduce post harvest crop
losses. Therefore, in addition to giving priority to less developed agriculture states, it is also
recommended that states which are relatively better developed should also be supported under
the Scheme.
3. Region wise disparity in fund allocation was observed, with North Eastern States receiving 46%
and Western Zone receiving only 1% of the total allocated funds. Even within the region, all the
states have did not receive funding support nor were the funds allocated uniformly across the
years of XIth FYP.
4. The overall utilization of fund was only 53%, as major part of it was allocated during the last two
years of the XIth Five Year Plan that too at the end of the financial years which impeded the
utilization within the same year leading to curtailment of budget allocated for the next year. Since
the agriculture is a seasonal activity, it is recommended that funds should be allocated in a timely
manner to ensure that activities are implemented effectively.
B. Recommendations for more Effective & Efficient Implementation Of Training And
Demonstration
1. Demonstration and training activities were organized on an adhoc basis and lacked continuity as
regular activity in the scheme. This appeared to be related to the pattern of funding for
conducting the programs and meet the targets but this defeats the very purpose of
demonstration towards popularizing the equipment and technology and improving the adoption
rate among the end users.
2. In some cases the beneficiaries opined that, the training under PHTM covered topics on
agriculture and cultivation practices did not serve the objectives of Post Harvest Technology and
Management Practices. This defeated the very purpose of training. It is recommended that

49
structure of training should be appropriately designed with relevant contents supplemented by
demonstration of equipments and incorporation of practical sessions.
3. A large number of post harvest equipments demonstrated were on regular field crops with hardly
any coverage of horticulture/ plantations crops. Farmers from Tamil Nadu and Karnataka opined
that additional technology demonstrations on Horticulture Crops such as Banana, Orange, Guava,
Coffee, Aonla, Mango, Coconut, etc., need to be covered.
4. Certain equipments such as tomato seed extractors, aloevera gel extractor seed graders were not
found to be appropriate for all farmers and could not be adopted universally. Such equipments
should either be demonstrated to entrepreneurs engaged in seed production program or those
engaged in processing who can further provide them to farmers participating in the value chain.
5. Selection of participants for training and demonstration showed a bias in favour of large farmers.
It is therefore recommended that small farmers from the project locations should also be
included and given opportunity to participate in the program.
6. As envisaged in the guidelines, units for Post Harvest processing, value addition, low cost
scientific storage, packaging, etc., may be established in the project catchment under tripartite
agreement of State Government, ICAR/CSIR and SHGs/UGs, etc. However, very few such
interventions have been done under the Scheme. Most of the units/ enterprise established are
individually operated and mostly by the large farmers who either have existing production units
to handle the post harvest processing or capable of running the units on their own without much
external support. The adoption rate among the small and marginal farmers was not found to be
encouraging. Hence, group based interventions need to be focused on for increasing the adoption
rate. Linkages with NGOs working in the area of social and agriculture development would prove
to be a better to scale up the interventions and meet the desired objectives of increasing the
adoption rate among the less privileged farmers.
7. The demonstration of low cost PHT can be scaled up through convergence with the existing
schemes of MoA implemented by Small Farmers Agribusiness Consortium (SFAC) particularly in
their vegetable clusters. The SFAC is implementing the Farmers Producer Organization Initiative
Project, organizing farmers growing vegetables and pulses through Resource Institutions. The
CIPHET Centers can work in collaborations with Resource Institutions which are promoting the
FPOs to demonstrate Post Harvest Technology.
8. The CIPHET Centers established in the State Agriculture Universities have assigned responsibilities
of Post Harvest Technology and Management Scheme. As the professors are burdened with
regular day to day activities on the academic front, it is difficult for them to give the required
attention for the activities. It is therefore recommended that additional staff dedicated
exclusively for the scheme in each CIPHET Centers may be recruited to take up the responsibilities
for effective implementation of scheme.
9. It was observed that certain demonstrations required supplementary equipments/ technology as
a full package, without which the benefits could not be harnessed. For example, the
demonstration of ginger peeler cum polisher in Rajasthan would not be sufficient unless it is
packaged with additional washer and drier to make it a complete unit. Hence, the demonstration
of complete unit needs to be ensured to be more effective instead of being a standalone
demonstration.
10. The participants indicated that they were unaware of availability of subsidy on the equipments
and, sources of procurement of machineries demonstrated. They also indicated that the
demonstrated machines are not readily available in the market.

50
11. It was observed that the demonstration organized were supply driven and not demand driven.
Machineries not relevant to a particular region were demonstrated. Demonstration of ginger
peeler cum polisher and aloevera gel extractor are typical examples which the farmers found
them to be useful but could not adopt them as the area was not growing ginger and aloevera.
Therefore, a preliminary survey to assess the demand of Post Harvest Equipment/ technology has
to be conducted and accordingly the demonstration should be organized. Such need assessment
would enhance technology adoption rate.
12. Last but not the least, is the absence of a system of maintaining information relating to scheme
and its coverage. During the study it was difficult not only to identify beneficiaries to solicit their
opinion or obtain feedback but also prevented the Institutes from assessing post training and
demonstration impact and adoption. Such valuable feedback may be useful to analyze the scope
for replication of training, adoption of technology and assessing the need for incorporating
midterm course correction in the training modules. It is therefore suggested that a system of
monitoring all the components, particularly information of trainees, may be instituted forthwith.

51
Chapter 6: Conclusions
Scheme for Post Harvest Technology and Management, introduced during the XI FYP, and has been able
to showcase satisfactory performance, in terms of its physical and financial achievements. A discrepancy
in the financial utilization was observed due to lag in sanction and disbursement process. However, its
utilization was found to be satisfactory. The scheme has had a good spread covering a large number of
beneficiaries. The positive response of the beneficiaries further supports the effectiveness of the scheme.
It is thus recommended that the scheme may continue for the betterment of large number of
beneficiaries after considering appropriate policy refinements as indicated in the report.

52
Annexure Annexure 1 Year wise and State wise fund allocation in PHTM Scheme during XI FYP
S.No Name of the state
Fund released Year wise( Rs. in crore)
Total 2007-08 2008-09 2009-10 2010-11 2011-12
1 Andhra Pradesh 0 0 0.24 0 0 0.24
2 Arunachal Pradesh
0 0.06 0 0.05 0.21 0.32
3 Assam 0 1.1 0 0 0 1.1
4 Bihar 0 0.65 0 0 0 0.65
5 Chhattisgarh 0 0.07 0 0.68 0 0.75
6 Gujarat 0 0 0 0 0 0
7 Haryana 0 0.38 0 0 0 0.38
8 HP 0 0 0 0.16 0 0.16
9 J&K 0 0.42 0 0 0 0.42
10 Jharkhand 0 0 0 0 0 0
11 Karnataka 0 0 0 0.5 1.29 1.79
12 Kerala 0 0 0.14 0 0 0.14
13 MP 0 0.64 0 0.44 2.21 3.29
14 Maharashtra 0 0 0 0 0 0
15 Manipur 0.26 0.33 0.25 1.15 2.53 4.52
16 Mizoram 0 0.25 0 0 0.63 0.88
17 Meghalaya 0 0 0 0 0 0
18 Nagaland 0 0.3 0 0.88 1.09 2.27
19 Orissa 0.34 0 0 0.9 0.54 1.78
20 Punjab 0 0 0 0 0 0
21 Rajasthan 0 0 0 0.25 0 0.25
22 Sikkim 0 0 0 0 0.56 0.56
23 Tamil Nadu 0 0 0 0 0 0
24 Tripura 0 0 0 0 0 0
25 UP 0 0 0 0 0 0
26 Uttarakhand 0 0 0 0 0.79 0.79
27 West Bengal 0 0 0.7 0 0 0.7
28 ICAR 0.4 0.58 0 4.11 0 5.09
29 SFCI 0 0 0 0 0 0
Total 1 4.78 1.33 9.12 9.85 26.08

53
Annexure 2 Zone wise fund allocation under PHTM Scheme during XI FYP
(Rs. In Crore)
Zone State 2007-08 2008-09 2009-10 2010-11 2011-12 Total Percent (%)
North Zone
Haryana 0 0.38 0 0 0 0.38 1%
HP 0 0 0 0.16 0 0.16 1%
J&K 0 0.42 0 0 0 0.42 2%
Punjab 0 0 0 0 0 0 0%
UP 0 0 0 0 0 0 0%
Uttrakhand 0 0 0 0 0.79 0.79 3%
Sub Total 0 0.8 0 0.16 0.79 1.75 7%
South Zone
Andhra Pradesh 0 0 0.24 0 0 0.24 1%
Karnataka 0 0 0 0.5 1.29 1.79 7%
Kerala 0 0 0.14 0 0 0.14 1%
Tamil Nadu 0 0 0 0 0 0 0%
Sub Total 0 0 0.38 0.5 1.29 2.17 8%
North East Zone
Arunachal Pradesh 0 0.06 0 0.05 0.21 0.32 1%
Assam 0 1.1 0 0 0 1.1 4%
Manipur 0.26 0.33 0.25 1.15 2.53 4.52 17%
Mizoram 0 0.25 0 0 0.63 0.88 3%
Meghalaya 0 0 0 0 0 0 0%
Nagaland 0 0.3 0 0.88 1.09 2.27 9%
Sikkim 0 0 0 0 0.56 0.56 2%
Tripura 0 0 0 0 0 0 0%
Sub Total 0.26 2.04 0.25 2.08 5.02 9.65 37%
Central Zone
Chhattisgarh 0 0.07 0 0.68 0 0.75 3%
MP 0 0.64 0 0.44 2.21 3.29 13%
Sub Total 0 0.71 0 1.12 2.21 4.04 15%
East Zone
Bihar 0 0.65 0 0 0 0.65 2%
Jharkhand 0 0 0 0 0 0 0%
Orissa 0.34 0 0 0.9 0.54 1.78 7%
West Bengal 0 0 0.7 0 0 0.7 3%
Sub Total 0.34 0.65 0.7 0.9 0.54 3.13 12%
West Zone
Gujarat 0 0 0 0 0 0 0%
Maharashtra 0 0 0 0 0 0 0%
Rajasthan 0 0 0 0.25 0 0.25 1%
Sub Total 0 0 0 0.25 0 0.25 1%
Institutions
ICAR 0.4 0.58 0 4.11 0 5.09 20%
SFCI 0 0 0 0 0 0 0%
Sub Total 0.4 0.58 0 4.11 0 5.09 20%
Grand Total 1 4.78 1.33 9.12 9.85 26.08 100%

54
Annexure 3 State wise fund allocation and utilization under PHTM Scheme during XI FYP
S.No Name of the state Total Allocation (Rs. Crore)
Total Utilization (Rs Crore)
Percent (%)
1 Andhra Pradesh 0.24 0 0%
2 Arunachal Pradesh 0.32 0.11 34%
3 Assam 1.1 0 0%
4 Bihar 0.65 0.48 74%
5 Chhattisgarh 0.75 0.23 31%
6 Gujarat 0 0 -
7 Haryana 0.38 0.38 100%
8 HP 0.16 0.16 100%
9 J&K 0.42 0.42 100%
10 Jharkhand 0 0 -
11 Karnataka 1.79 1.79 100%
12 Kerala 0.14 0 0%
13 MP 3.29 2.99 91%
14 Maharashtra 0 0 -
15 Manipur 4.52 3.37 75%
16 Mizoram 0.88 0.25 28%
17 Meghalaya 0 0 -
18 Nagaland 2.27 1.18 52%
19 Orissa 1.78 0.78 44%
20 Punjab 0 0 -
21 Rajasthan 0.25 0 0%
22 Sikkim 0.56 0 0%
23 Tamil Nadu 0 0 -
24 Tripura 0 0 -
25 UP 0 0 -
26 Uttarkhand 0.79 0 0%
27 West Bengal 0.7 0.7 100%
28 ICAR 5.09 0.98 19%
29 SFCI 0 0 -
Total 26.08 13.82 53%
55
Annexure 4 Equipments demonstrated by CIPHET Centers during XI FYP
Sl Name of Equipment/ State/ Centers (SAU/Institute)
No of Demos
Area Covered (District/Villages Farmers Benefitted
(2008-09)
State-Karnataka Women SC ST Total
Bangalore Center
1 Manual Operated arecanut dehusker
3 Chitradurga (Hiriyur Taluk) - - - 100
2 White Pepper Machine 3 Chitradurga district, Kolar district, Chamarajanagar district - - - 75
3 Tamarind dehuller- cum desseeder 4 Banagalore, Hassan district, Chitradurga district - - - 130
4 Eco Friendly pulse storage technology
3 Hassan district, Kolar district Chitradurga district - - - 210
Raichur Center
5 Chilli dryer 8 Raichur district (Matamari, Poortippali, Marchthalll, Jakkaladinni, Ashapur, Yapaladinni, Chandrabanda) Dharwad (Devihosur)
20 - - 160
6 Ice Crusher 14 Dakhina Kannada (Mangalore- College of Fisherries, Fish landing Center & market- Ullal, South, Central, North, Mangalore, Fish landing Center auction yard, Central fish market stadium side, Bus stand side) Raichur district (Fish Market, Raichur)
18 - - 285
State- Kerala
Kasargod Center
7 Snow ball tender nut 4 Kasaragod (Nileswar, Madakai, Kasaragod), Allepy (Kumarapuram) 148 12 4 230
8 Tender nut punch 4 148 12 4 230
9 Tender nut punch 4 148 12 4 230
Trivendrum Center
10 Cassava chipping machine 4 Trivandrum (Karukulam, Venganoor, Nagaroor, Vattiyoorkavu, Kudappanajunnu) Kollam (Poothakulam)
102 49 - 133
11 Cassava rasper 4 102 49 - 133
State- Maharashtra
12 PKV Mini Dal Mill with splitter 24 Buldhana (Khathed), Yeotmal (mangkinhi), Akola (Malegaon Bazar), Amrawati (Bramhanwadithadi, Shendurjunaghat)
417 293 87 1339
State- Rajasthan

56
(Udaipur Center) Women SC ST Total
13 Garlic Bulk Breaker 9 Udaipur (Adakalia, Jetawara, Ghoromari, Turgarh, Baghpura, Ogana, Samija, Vana) Chittorgarh (Chittorgarh)
54 146 206 406
14 Garlic Flaking Machine 9 55 145 206 406
15 Ginger peeler cum polisher 9 64 167 240 471
State- Tamil Nadu ( Coimbatore Center)
16 Turmeric boiler 10 Erode district, Salem district 48 10 2 87
17 Household paddy parboiling unit 12 48 10 2 87
18 Mini Dhal mill 10 48 10 2 87
19 Tomato seed extractor 12 48 10 2 87
20 Hand operated pepper thresher 12 Yercaud district, Salem district 15 4 1 20
21 Power operated pepper thresher 4 15 4 1 20
State- Uttarakhand
(Almora Center)
22 Millet Thresher cum peeler 10 Almora (Bhagartola, Takula, Daulaghat, Shtlakhet, Toli, Hawalbagh, Dunagir, Govindpur) Nainital (Lwesaal, Darim)
37 33 32 205
Pantnagar Center
23 Jaggery striking point alarm 06 US Nagar (Kanakpur) 25 - - 60
US Nagar (Raghav Nagar) 35 - - 65
Haridwar (Mewadkala) 25 - - 60
Haridwar (Rangadwala) 20 - - 65
Haridwar (Kamalpur) 45 - - 55
Haridwar (Daulatpur 45 - - 55
24 Jaggery storage bin 06 US Nagar (Kanakpur) 25 - - 60
US Nagar (Raghav Nagar) 35 - - 65
Almora (Hawalbag) 45 - - 65
Almora (Tana) 30 - - 50
Almora (Dhaulad) 40 - - 55
Haridwar (Mewadkala) 25 - - 60
Haridwar (Rangadwala) 20 - - 65
Haridwar (Kamalpur) 45 - - 55
Haridwar (Daulatpur) 15 - - 50
Dehradun (Amwadi) 45 - - 60
Dehradun 25 - - 45

57
25 Potato peeler 12 US Nagar (Kanakpur) 25 - - 60
TOTAL 187 2115 966 793 6226
(2009-10)
State- Gujarat
Junagarh Center Women SC ST Total
1 Cumin Cleaner 02 Porbander (Khapat and Bhod) - - - 20
State- Himachal Pradesh
Ludhiana Center
2 Electric cum battery heated 02 Kangra (Jassour, Ichhi) - - - 02
State- Karnataka
Bangalore Center
3 Tamarind dehuller cum deseeder 06 Bangalore Rural (Shembulinganahalli, Hosakotte Taluk) - - - 81
Raichur Center
4 Chilli dryer 14 Raichur (Matmari and Raichur) 20 07 480
5 Pedal operated Ice Crusher 42 Dakshina Kannada (Mangalore, Fish landing center Bunder, Fish landing center south warf and ullal, fist Market Udupi and Padubidre) Raichur (Raichur)
43 27 681
State- Kerala
Kasargod Center
6 Snow ball tender nut machine 05 Kasargod (Nileswar, Madakai, Kasaragod) Alleppy (kumarapuram) Minicoy
- - - 20
7 Tender nut punch 05 - - - 20
8 Tender nut cutter 05 - - - 20
9 Cassava chipping machine 12 Malappurum district, Trichur District, Trivandrum district, Kollam District
447 188 10 668
10 Cassava rasper 12 Malappurum district, Trivandrum district, Kollam district 447 188 10 685
11 Mobile starch extraction plant 12 Malappuram district, Trichur district, Trivandrum district, Kollam district
447 188 10 668
State- Maharashtra
Akola Center
12 PKV mini dall mill 16 Akola, Amravati, Buldhana, Pusad, Chandrapur, Yavatmal, Washim 59 36 38 570
13 Chilly seed extractor 03 Jalgaon, Akola 7 9 9 77
14 Fruit grader 03 Amravati, Yavatmal, Washim 4 10 3 102
State- Orissa

58
Bhubneshwar Center
15 Millet Thresher cum pealer 02 Gangam 02 - - 53
State- Punjab
Ludhiana Center
16 Turmeric washing cum polishing machine
07 Ludhina, Jalandhar 190 82 20 685
17 Electric cum battery heated uncapping knife
13 Ludhiana, Patiala, Hoshiarpur 10 15 - 57
State- Rajasthan
Udaipur Center
18 Garlic Bulb Breaker 11 Udaipur division 109 205 313 627
19 Garlic flaking machine 11 Udaipur division 109 205 313 627
20 Ginger peeler cum polisher 06 Udaipur division, 56 25 222 303
State- Tamil Nadu
Coimbatore Center
21 Turmeric boiler 12 Erode & Salem Districts 75 15 4 127
22 Household paddy parboiling unit 14 Erode & Salem Districts 75 15 4 127
23 Mini dal mill 12 Erode & Salem Districts 75 15 4 127
24 Tomato seed extractor 14 Erode & Salem Districts 75 15 4 127
25 Hand operated pepper thresher 12 Yercaud district , Salem district 15 4 1 20
26 Power operated pepper thresher 4 Yercaud district, Salem district 15 4 1 20
State- Uttarakhand
Almora Center
27 Millet Thresher 10 Almora, Nainital 91 81 57 362
(2010-11)
State- Gujarat
Junagarh Center
1 Cumin Cleaner and grader 01 Thimmamrajupeta and Munagapaks villages 15
State- Karnataka
Banagalore Center
2 Demonstration on Post Harvest Machinery
01 Kuthinagere 15
3 Demo on Post Harvest machinery in Krishi mela
01 Hosakote 50
59
Raichur Center
4 Demonstration of Pedal operated ice crusher
05 Krishi Mela UAS Raichur More than 100
5 Demonstration of Pedal operated ice crusher
05 Krishi Mela UAS Raichur More than 100
6 Demonstration of chilli dryer (solar tunnel dryer)
01 Gadag district (Kallur) 4 9 3 30
7 Demonstration of pedal operated ice crusher
01 Raichur 5 1 15
State- Tamil Nadu
Coimbatore Center
8 Demo on Power operated pepper thresher, Hand operated pepper thresher and white pepper cum washer
02 Coimbatore (Thadiyankudisai) 5 - - 40
9 Demo on tomato seed extractor 02 Coimbatore (Periya Kulam) 25 - - 35
TOTAL 19 34 14 4 405
(2011-12)
State- Andhra Pradesh
Junagarh Center Women SC ST Total
1 Demo on 3 in 1 Decorticator 05 Jamnagar, Junagadh 25 25 - 210
2 Demo on fruit grader 02 Junagadh - 5 3 26
State- Maharashtra
Akola Center
3 Demo on PKV Mini Dal Mill 07 Murtizapur, Akola, 23 - - 151
4 Demo on Chilli seed extractor 06 Agril research station, Washim - - - 70
State- Odisha
Bhubneshwar Center
5 Demo on Ragi thresher cum peeler 06 Bhubneshwar, Ganjam, Rampalli 10 8 4 52
State- Rajasthan
Udaipur Center
6 Demo on Garlic bulb breaker 05 Udaipur 9 23 38 200

60
7 Demo on Hand operated pepper thresher, power operated pepper thresher and peeler
04 Theni 22 7 4 75
TOTAL 39 93 77 55 831

NABARD Consultancy Services Pvt. Ltd.
Corporate Office 3rd Floor, C-Wing, NABARD HO Building Plot No. C-24, G-Block Bandra Kurla Complex, Bandra (East) Mumbai – 400051 Website: www.nabcons.com Email: [email protected]
Zonal Office 1st Floor, NABARD Tower
24 Rajendra Place New Delhi – 110125
email: [email protected]


![[S] Science of Agricultural Mechanization [2010] · Science of Agricultural Mechanization 3 Acknowledgments The Science of Agricultural Mechanization curriculum was presented to the](https://static.fdocuments.us/doc/165x107/5e89f395fdf1fb7ddc317c08/s-science-of-agricultural-mechanization-2010-science-of-agricultural-mechanization.jpg)