Possible Causes of Elevated Ambient CO2 … Concentration in the City of Pardubice and its...
10
Possible Causes of Elevated Ambient CO 2 Concentration in the City of Pardubice and its surroundings JAROMÍRA CHÝLKOVÁ 1 , TOMÁŠ BRUNCLÍK 1 , ILONA OBRŠÁLOVÁ 2 , KWASI ASARE BAFFOUR DANQUAH 1 and RENATA ŠELEŠOVSKÁ 1 1 Faculty of Chemical Technology, Institute of Environmental and Chemical Engineering 2 Faculty of Economic and Administration, Institute of Public Administration and Law University of Pardubice Studentská 95, 532 10 Pardubice CZECH REPUBLIC [email protected]; [email protected]; [email protected]; [email protected]; [email protected] http://www.upce.cz Abstract: - This paper presents the results of monitoring of air pollution concentrations of CO 2 in the time period from October 2010 to April 2011. The measurement was carried out with the help of portable analyser ECOPROBE 5, which operates on the principle of measurement of IR radiation absorption. The results obtained were given more precision by means of calculations involving the effect of sensor temperature on the intensity of entering radiation. It was found out that the average CO 2 concentration in air in the above- mentioned time period was 400 ppm which is 20 ppm higher than the planet-wide average. Further research of the measured data and its comparison with atmospheric dispersion model study indicate that the elevated concentrations are probably caused mostly by increasing traffic intensity. Large industrial sources in the vicinity were found to have only marginal influence on the ambient CO 2 concentrations. Key-Words: - carbon dioxide, air pollution, infrared analyser. 1 Introduction At present, carbon dioxide is one of the most intensively monitored gases in the atmosphere. The present technological civilisation produces vast amounts of this greenhouse gas, which in many professionals’ opinion can contribute to global warming of the Earth accompanied by a number of negative phenomena. The frequently mentioned consequences of global warming include melting of glaciers with the concomitant raising of oceans’ level, which can endanger low-lying coastal areas. Furthermore, it tends to be connected with more frequent occurrences of extreme atmospheric phenomena, such as floods, excessively hot weather or hurricanes. However, it has to be noted that the significance of the mentioned threats and the extent of their impact on the Earth still remains a matter of controversies between the world scientists and politicians. The seriousness of these problems and the necessity to deal them is documented by the negotiations of the United Nations Climate Change Conference in Copenhagen (December 2009). Carbon dioxide gets to the atmosphere from both natural and anthropogenic sources. The natural sources of carbon dioxide include breathing of aerobic organisms, biochemical decomposition of plants and animals, fires and wildfires, and volcanic activity. The significant anthropogenic sources of CO 2 include combustion of fossil fuels, biomass and biogas as well as a number of industrial processes such as production of coke, metallurgy, manufacture of cement, glass, processing of cellulose, wood and others. A considerable contribution to the air pollution concentrations of CO 2 comes from transport [1], [2]: at present transport produces one quarter of all CO 2 emissions and by 2030 this contribution should increase up to 30 % [3]. WSEAS TRANSACTIONS on ENVIRONMENT and DEVELOPMENT Jaromíra Chýlková, Tomáš Brunclík, Ilona Obršálová, Kwasi Asare Baffour Danquah, Renata Šelešovská E-ISSN: 2224-3496 96 Issue 3, Volume 8, July 2012
Transcript of Possible Causes of Elevated Ambient CO2 … Concentration in the City of Pardubice and its...
Possible Causes of Elevated Ambient CO2 Concentration in the City of
Pardubice and its surroundings
JAROMÍRA CHÝLKOVÁ1, TOMÁŠ BRUNCLÍK1, ILONA OBRŠÁLOVÁ2, KWASI ASARE
BAFFOUR DANQUAH1 and RENATA ŠELEŠOVSKÁ1
1 Faculty of Chemical Technology, Institute of Environmental and Chemical Engineering 2 Faculty of Economic and Administration, Institute of Public Administration and Law
University of Pardubice Studentská 95, 532 10 Pardubice
CZECH REPUBLIC [email protected]; [email protected]; [email protected];
[email protected]; [email protected] http://www.upce.cz Abstract: - This paper presents the results of monitoring of air pollution concentrations of CO2 in the time period from October 2010 to April 2011. The measurement was carried out with the help of portable analyser ECOPROBE 5, which operates on the principle of measurement of IR radiation absorption. The results obtained were given more precision by means of calculations involving the effect of sensor temperature on the intensity of entering radiation. It was found out that the average CO2 concentration in air in the above-mentioned time period was 400 ppm which is 20 ppm higher than the planet-wide average. Further research of the measured data and its comparison with atmospheric dispersion model study indicate that the elevated concentrations are probably caused mostly by increasing traffic intensity. Large industrial sources in the vicinity were found to have only marginal influence on the ambient CO2 concentrations.
Key-Words: - carbon dioxide, air pollution, infrared analyser.
1 Introduction
At present, carbon dioxide is one of the most intensively monitored gases in the atmosphere. The present technological civilisation produces vast amounts of this greenhouse gas, which in many professionals’ opinion can contribute to global warming of the Earth accompanied by a number of negative phenomena. The frequently mentioned consequences of global warming include melting of glaciers with the concomitant raising of oceans’ level, which can endanger low-lying coastal areas. Furthermore, it tends to be connected with more frequent occurrences of extreme atmospheric phenomena, such as floods, excessively hot weather or hurricanes.
However, it has to be noted that the significance of the mentioned threats and the extent of their impact on the Earth still remains a matter of controversies between the world scientists and
politicians. The seriousness of these problems and the necessity to deal them is documented by the negotiations of the United Nations Climate Change Conference in Copenhagen (December 2009).
Carbon dioxide gets to the atmosphere from both natural and anthropogenic sources. The natural sources of carbon dioxide include breathing of aerobic organisms, biochemical decomposition of plants and animals, fires and wildfires, and volcanic activity. The significant anthropogenic sources of CO2 include combustion of fossil fuels, biomass and biogas as well as a number of industrial processes such as production of coke, metallurgy, manufacture of cement, glass, processing of cellulose, wood and others. A considerable contribution to the air pollution concentrations of CO2 comes from transport [1], [2]: at present transport produces one quarter of all CO2 emissions and by 2030 this contribution should increase up to 30 % [3].
WSEAS TRANSACTIONS on ENVIRONMENT and DEVELOPMENTJaromíra Chýlková, Tomáš Brunclík, Ilona Obršálová, Kwasi Asare Baffour Danquah, Renata Šelešovská
E-ISSN: 2224-3496 96 Issue 3, Volume 8, July 2012
The presence of a certain concentration of carbon dioxide in the atmosphere is inevitably necessary for life on the Earth: firstly it represents the source of carbon for green plants, which are able to transform carbon dioxide and water with contribution of solar radiation energy into complex organic compounds, and secondly it maintains favourable atmospheric conditions thanks to its greenhouse gas effect. Atmospheric carbon dioxide absorbs the infrared radiation of the Earth surface, which contributes to its warming.
However, at present the amounts of carbon dioxide that get to the atmosphere are much higher
than those that can be removed by natural processes, and so the concentration of this air pollution gas is increasing. From the standpoint of the impact upon the health of population it can be stated that the present concentrations of CO2 in the atmosphere are so low that they do not represent any direct health hazard [4]; nevertheless, this situation can change in the future if the present trend fails to be stopped: during the last 50 years the average concentration of CO2 in the atmosphere increased from the value of 0.0316 % v/v to the value of 0.038 % v/v (the value in the year 2004) [5].
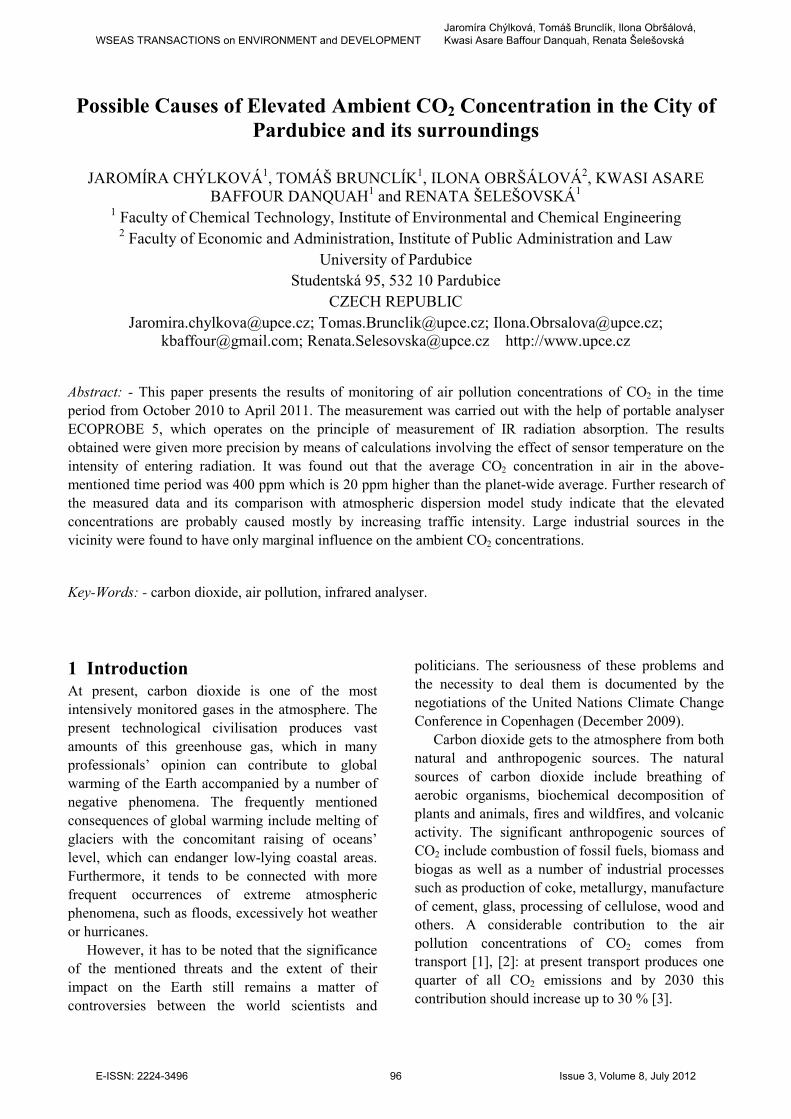
Fig. 1 Carbon dioxide sampling place in the Eastern Bohemian city of Pardubice
The content of carbon dioxide in the atmosphere
is most often determined on the basis of absorption of infrared radiation. Global changes of the amounts of this gas in the atmosphere are measured at special
observatories built at places sufficiently remote from human civilisation and vegetation, having stable conditions and usually rather high above sea level to avoid accumulation of atmospheric
WSEAS TRANSACTIONS on ENVIRONMENT and DEVELOPMENTJaromíra Chýlková, Tomáš Brunclík, Ilona Obršálová, Kwasi Asare Baffour Danquah, Renata Šelešovská
E-ISSN: 2224-3496 97 Issue 3, Volume 8, July 2012

admixtures. Long-term measurements at these observatories show that carbon dioxide concentration in the atmosphere provably permanently increases.
The aim of the investigation described in this paper was long-term monitoring of air pollution concentrations of CO2 in a densely populated area of Pardubice – on the premises of the University of Pardubice, which is situated near a very much frequented road to Hradec Králové and to the capital, Prague. The sampling place within the region of Eastern Bohemia is shown in Fig. 1.
2 Experimental
2.1 Description of portable analyser
The measurements of air pollution concentrations of carbon dioxide were performed using a portable analyser ECOPROBE 5, which is depicted in Fig. 2.
It is equipped with an infrared (IR) detector which determines carbon dioxide on the basis of determination of absorption values of specific IR wavelengths corresponding to CO2 absorption.
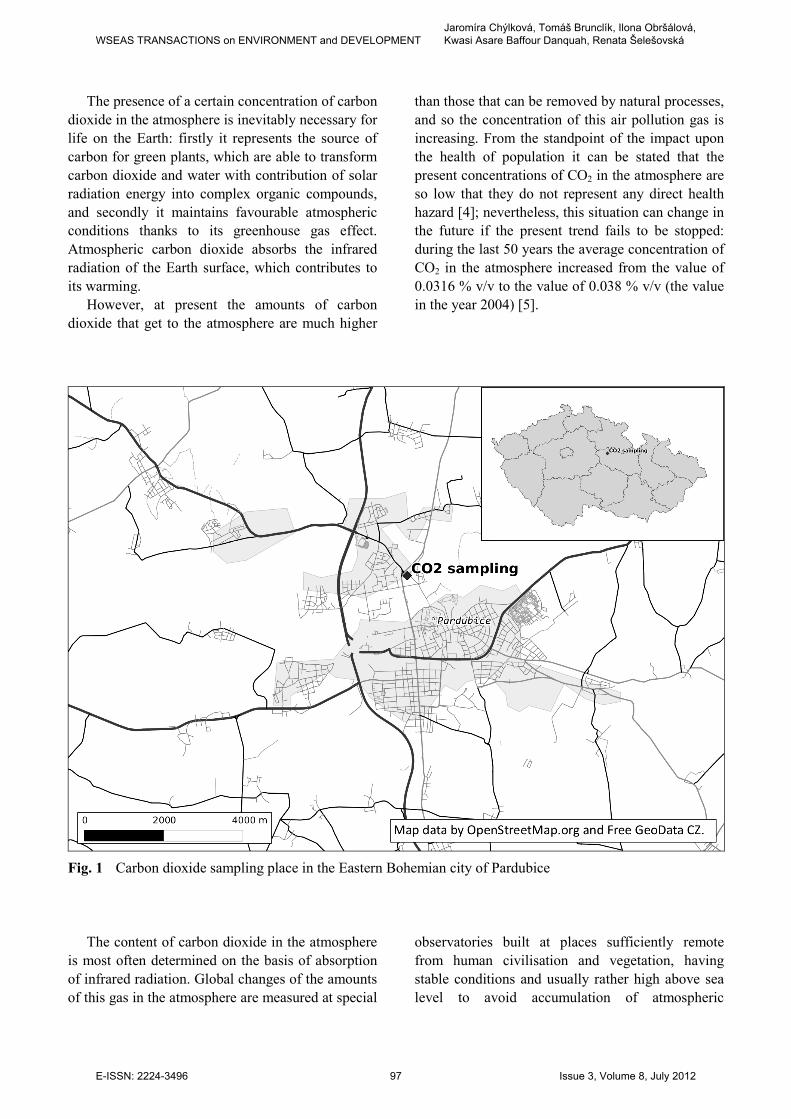
The modus operandi of the IR detector is shown in Fig. 3. It can be seen that the radiation emitted by the source passes through the measuring cell through which the analysed air is sucked. If the air contains carbon dioxide, then the characteristic radiation is absorbed, and the radiation decrease is directly proportional to CO2 concentration; this decrease is recorded by the detectors.
The analyser contains four detectors, three of them having in front of them selective filters transmitting only specific wavelengths characteristic for carbon dioxide, methane, and total hydrocarbons (TP). The detector for total hydrocarbons possesses a broad measuring range of wavelengths corresponding to C–H bonds in hydrocarbon molecules.
The fourth detector serves for reference measurements. It is placed in the instrument so as to obtain the whole spectrum of infrared radiation without interaction with the analysed gas. The intensity of incident rays can be affected by dust, humidity or other interferential effects.
The operation range of all three detectors is from 0 to 500 000 ppm with the detection limit of 50
ppm. The instrument is calibrated with calibration mixtures of nitrogen and carbon dioxide. This calibration was performed by the manufacturer (RS Dynamics) using ten calibration mixtures containing 250, 500, 1 000, 5 000, 10 000, 20 000, 50 000, 100 000, 250 000 and 450 000 ppm CO2 in N2.
Fig. 2 Measuring apparatus ECOPROBE 5
In order to obtain the most precise values
possible for the CO2 concentrations, the data measured were corrected with respect to the temperature; the intensity of radiation emitted from the source depends on the current temperature and can change in the course of measurement. The dependence between radiation intensity and temperature is based on the principle of ideal black body, i.e. physical body which completely absorbs the radiation of whole electromagnetic spectrum (it has absolutely black surface and its absorption coefficient is 1); on the other hand, it can emit radiation in the amount of 100 %. In practical cases, however, it has to be taken into account that ideal black body does not exist in nature; at a given temperature each real body emits less radiation than ideal black body. The ratio of spectral densities of emission from real body (M) and ideal black body (M)° is called spectral emissivity ε.
WSEAS TRANSACTIONS on ENVIRONMENT and DEVELOPMENTJaromíra Chýlková, Tomáš Brunclík, Ilona Obršálová, Kwasi Asare Baffour Danquah, Renata Šelešovská
E-ISSN: 2224-3496 98 Issue 3, Volume 8, July 2012
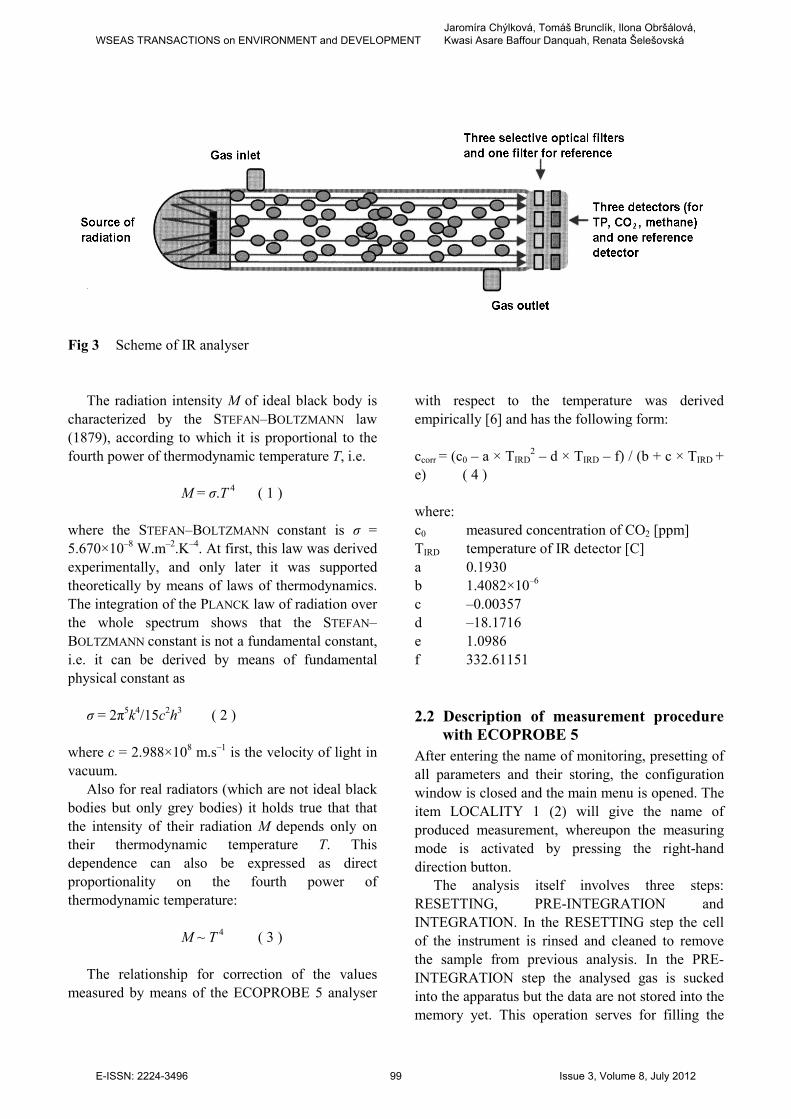
Fig 3 Scheme of IR analyser
The radiation intensity M of ideal black body is characterized by the STEFAN–BOLTZMANN law (1879), according to which it is proportional to the fourth power of thermodynamic temperature T, i.e.
M = σ.T 4 ( 1 )
where the STEFAN–BOLTZMANN constant is σ = 5.670×10⁻⁸ W.m–2.K–4. At first, this law was derived experimentally, and only later it was supported theoretically by means of laws of thermodynamics. The integration of the PLANCK law of radiation over the whole spectrum shows that the STEFAN–BOLTZMANN constant is not a fundamental constant, i.e. it can be derived by means of fundamental physical constant as
σ = 2π5
k4/15c
2h
3 ( 2 )
where c = 2.988×10⁸ m.s–1 is the velocity of light in vacuum.
Also for real radiators (which are not ideal black bodies but only grey bodies) it holds true that that the intensity of their radiation M depends only on their thermodynamic temperature T. This dependence can also be expressed as direct proportionality on the fourth power of thermodynamic temperature:
M ~ T 4 ( 3 )
The relationship for correction of the values
measured by means of the ECOPROBE 5 analyser
with respect to the temperature was derived empirically [6] and has the following form:
ccorr = (c0 – a × TIRD
2 – d × TIRD – f) / (b + c × TIRD + e) ( 4 )
where: c0 measured concentration of CO2 [ppm] TIRD temperature of IR detector [C] a 0.1930 b 1.4082×10⁻⁶
c –0.00357 d –18.1716 e 1.0986 f 332.61151
2.2 Description of measurement procedure
with ECOPROBE 5
After entering the name of monitoring, presetting of all parameters and their storing, the configuration window is closed and the main menu is opened. The item LOCALITY 1 (2) will give the name of produced measurement, whereupon the measuring mode is activated by pressing the right-hand direction button.
The analysis itself involves three steps: RESETTING, PRE-INTEGRATION and INTEGRATION. In the RESETTING step the cell of the instrument is rinsed and cleaned to remove the sample from previous analysis. In the PRE-INTEGRATION step the analysed gas is sucked into the apparatus but the data are not stored into the memory yet. This operation serves for filling the
WSEAS TRANSACTIONS on ENVIRONMENT and DEVELOPMENTJaromíra Chýlková, Tomáš Brunclík, Ilona Obršálová, Kwasi Asare Baffour Danquah, Renata Šelešovská
E-ISSN: 2224-3496 99 Issue 3, Volume 8, July 2012
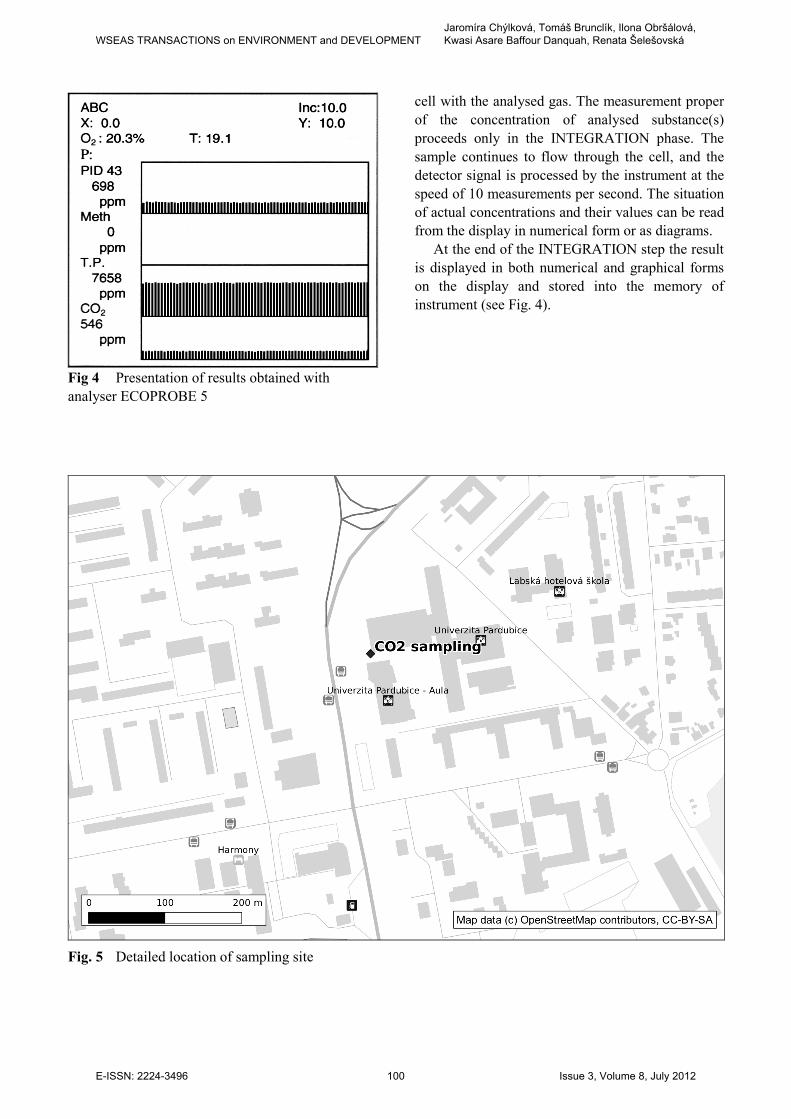
Fig 4 Presentation of results obtained with analyser ECOPROBE 5
cell with the analysed gas. The measurement proper of the concentration of analysed substance(s) proceeds only in the INTEGRATION phase. The sample continues to flow through the cell, and the detector signal is processed by the instrument at the speed of 10 measurements per second. The situation of actual concentrations and their values can be read from the display in numerical form or as diagrams.
At the end of the INTEGRATION step the result is displayed in both numerical and graphical forms on the display and stored into the memory of instrument (see Fig. 4).
Fig. 5 Detailed location of sampling site
WSEAS TRANSACTIONS on ENVIRONMENT and DEVELOPMENTJaromíra Chýlková, Tomáš Brunclík, Ilona Obršálová, Kwasi Asare Baffour Danquah, Renata Šelešovská
E-ISSN: 2224-3496 100 Issue 3, Volume 8, July 2012
2.3 Sampling site
Detailed location of sampling site near the premises of the University of Pardubice is shown in Fig. 5.
3 Results and Discussion
3.1 Measured data
The results of monitoring of air pollution concentrations of CO2 which are presented in this paper were measured in the time period from 19th October 2010 to 30th April 2011. There was approximately one hundred individual measurements.
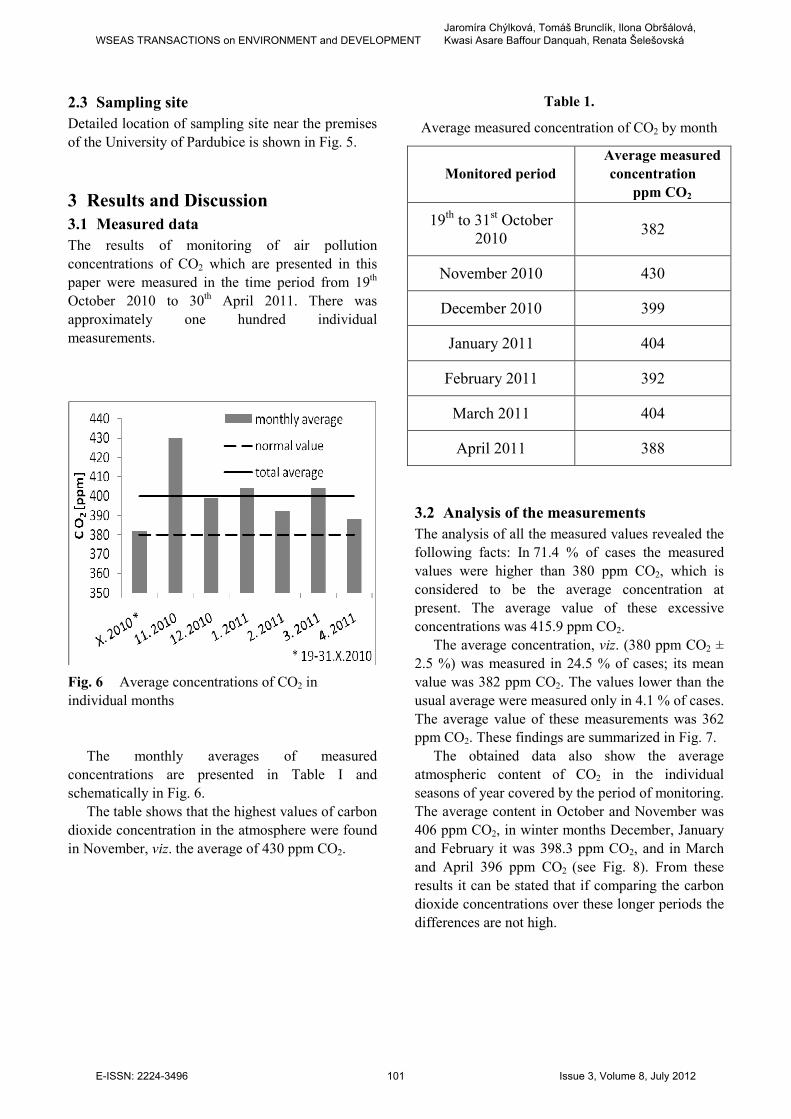
Fig. 6 Average concentrations of CO2 in individual months
The monthly averages of measured
concentrations are presented in Table I and schematically in Fig. 6.
The table shows that the highest values of carbon dioxide concentration in the atmosphere were found in November, viz. the average of 430 ppm CO2.
Table 1.
Average measured concentration of CO2 by month
Monitored period
Average measured
concentration
ppm CO2
19th to 31st October 2010
382
November 2010 430
December 2010 399
January 2011 404
February 2011 392
March 2011 404
April 2011 388
3.2 Analysis of the measurements
The analysis of all the measured values revealed the following facts: In 71.4 % of cases the measured values were higher than 380 ppm CO2, which is considered to be the average concentration at present. The average value of these excessive concentrations was 415.9 ppm CO2.
The average concentration, viz. (380 ppm CO2 ± 2.5 %) was measured in 24.5 % of cases; its mean value was 382 ppm CO2. The values lower than the usual average were measured only in 4.1 % of cases. The average value of these measurements was 362 ppm CO2. These findings are summarized in Fig. 7.
The obtained data also show the average atmospheric content of CO2 in the individual seasons of year covered by the period of monitoring. The average content in October and November was 406 ppm CO2, in winter months December, January and February it was 398.3 ppm CO2, and in March and April 396 ppm CO2
(see Fig. 8). From these results it can be stated that if comparing the carbon dioxide concentrations over these longer periods the differences are not high.
WSEAS TRANSACTIONS on ENVIRONMENT and DEVELOPMENTJaromíra Chýlková, Tomáš Brunclík, Ilona Obršálová, Kwasi Asare Baffour Danquah, Renata Šelešovská
E-ISSN: 2224-3496 101 Issue 3, Volume 8, July 2012

Fig. 7 Graphical representation of distribution of measured CO2 concentrations
Fig. 8 Ground-level concentrations of CO2, depending on the season in which monitoring was conducted
Figure 9 shows an example of changes in CO2
concentrations during the day time from 7.00 to 14.00. The figure shows that in the morning the CO2 content increased up to 40 ppm compared to the rest of the day's measurement that was taken. This may be caused by increased density of automobile traffic, as people mostly travel to work around that time. This assumption is in accordance with before mentioned information about important contribution of transportation to global CO2 emissions. Moreover, the share of traffic on local CO2 emissions is more substantial in urban areas [7].
Fig. 9 Change in air pollution concentrations of CO2 during the day, when the monitoring was conducted.
Fig. 10 Illustration of the wind direction during the monitoring of ambient concentrations of CO2, along with found concentrations (wind from north: 0).
During each measurement of ambient concentrations of CO2, the wind direction was also recorded. By plotting polar graph of the observed concentrations dependence on wind direction was found (Fig.10) that the concentration variations are not related to wind direction. With wind blowing in all directions, the measured values are located in a circle and the observed variations in the measured concentrations are quite evenly distributed. Based
WSEAS TRANSACTIONS on ENVIRONMENT and DEVELOPMENTJaromíra Chýlková, Tomáš Brunclík, Ilona Obršálová, Kwasi Asare Baffour Danquah, Renata Šelešovská
E-ISSN: 2224-3496 102 Issue 3, Volume 8, July 2012
on these results we can assume that the observed concentrations are not significantly influenced by a few major point sources of carbon dioxide, but on the contrary, the elevated CO2 levels probably mostly come from many scattered minor sources, evenly distributed in all directions around the measurement site.
3.3 Air pollution dispersion study
Apart from analyzing the measurement results autonomously, we also tried to assess the influence of large industrial sources of CO2 separately.
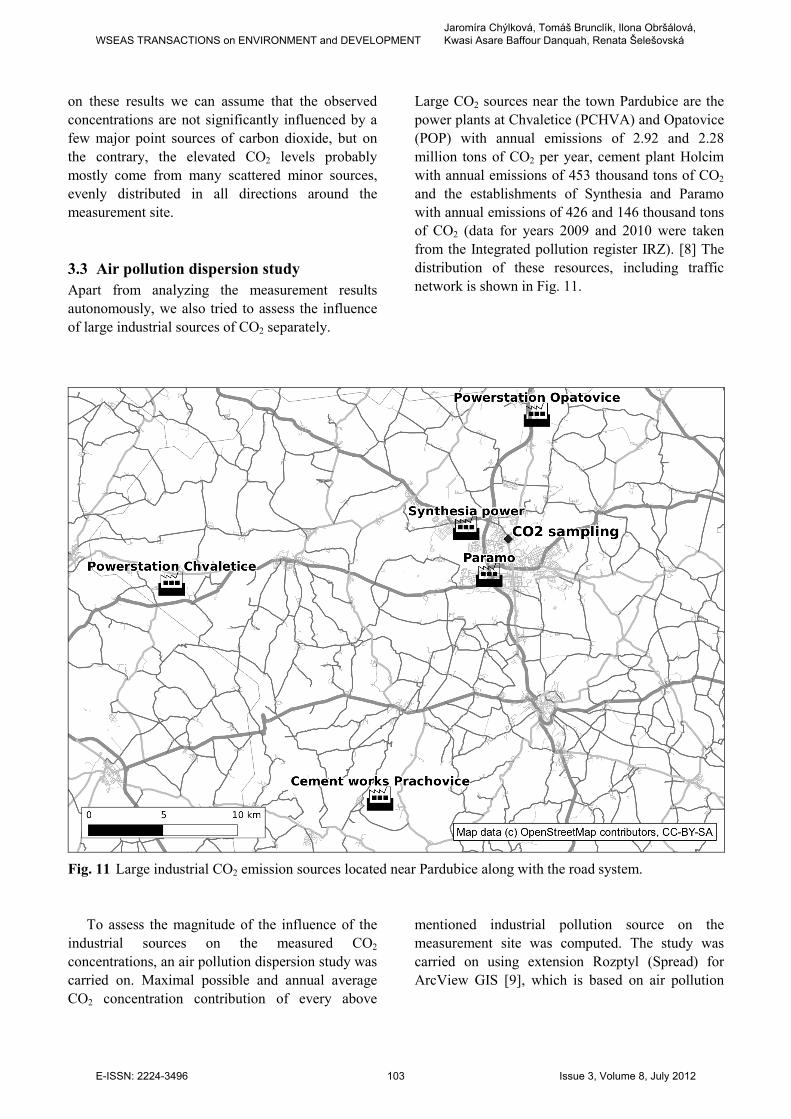
Large CO2 sources near the town Pardubice are the power plants at Chvaletice (PCHVA) and Opatovice (POP) with annual emissions of 2.92 and 2.28 million tons of CO2 per year, cement plant Holcim with annual emissions of 453 thousand tons of CO2 and the establishments of Synthesia and Paramo with annual emissions of 426 and 146 thousand tons of CO2 (data for years 2009 and 2010 were taken from the Integrated pollution register IRZ). [8] The distribution of these resources, including traffic network is shown in Fig. 11.
Fig. 11 Large industrial CO2 emission sources located near Pardubice along with the road system.
To assess the magnitude of the influence of the
industrial sources on the measured CO2 concentrations, an air pollution dispersion study was carried on. Maximal possible and annual average CO2 concentration contribution of every above
mentioned industrial pollution source on the measurement site was computed. The study was carried on using extension Rozptyl (Spread) for ArcView GIS [9], which is based on air pollution
WSEAS TRANSACTIONS on ENVIRONMENT and DEVELOPMENTJaromíra Chýlková, Tomáš Brunclík, Ilona Obršálová, Kwasi Asare Baffour Danquah, Renata Šelešovská
E-ISSN: 2224-3496 103 Issue 3, Volume 8, July 2012

dispersion model Symos ’97 [10]. The results of this study are summarized in the Table 2.
Table 2
Large industrial pollution sources and their contribution to ambient CO2 concentration.
Source Maximal CO2
[ppm] Average CO2
[ppm]
PCHVA 4.7 0.074
POP 2.8 0.0007
Holcim 0.06 0.0017
Synthesia 5.8 0.0052
Paramo 2.12 0.002
Every computed maximal concentration is model
estimation of maximal possible attribution of the given pollution source to existing concentrations in the worst atmospheric conditions, that is, the worst case of possible combinations of wind direction, atmospheric stability grade and wind speed for pollution spread. The values of the maximal concentrations are not additive, because the worst conditions are different for every pollution source.
The absolute values of maximal possible concentration attributions of the sources are relatively low compared to measured ambient concentrations on the sampling site, and the incidence of such conditions during the year is sparse. The average concentration attributions are even smaller, approximately by order of two. It is thus possible to conclude, that large industrial pollution sources in the vicinity of the city of Pardubice do not have major influence on ambient CO2 concentrations on the sampling site The increased concentrations are probably influenced more by many scattered small pollution sources than by a few isolated large ones
Such scattered pollution sources may include the transport (see road network on Fig. 5 and Fig. 11) and small local emission sources, for example combustion of fossil fuels for heating in homes.
Results of the air pollution study are in accordance with the data analyses in chapter 3.2 and with before mentioned information, that traffic is probably significant source of elevated CO2 levels.
4 Conclusion
This paper presents results of measurements of carbon dioxide content in free atmosphere of relatively densely populated area of Eastern Bohemian town Pardubice; the sampling site was located near a frequented road, ca 1.5 m above ground (i.e. in the layer from which an average adult person inhales air), and the monitoring covered the period from October 2010 to April 2011.
The measurements were carried out by means of analyser ECOPROBE 5 (RS Dynamics, Prague) operating on the basis of absorption of IR radiation by carbon dioxide. The results show that the highest concentrations were observed in November: this month is usually characterized by adverse dispersion conditions in the atmosphere. The overall average value measured is 400 ppm CO2, which is 20 ppm CO2 higher than the average value declared at present. This fact shows that the increase in atmospheric carbon dioxide concentration fails to be stopped and, therefore, manufacturing technologies will have to be intensified in order to decrease carbon dioxide emissions.
Analyses of the measured data and air pollution dispersion study indicate, that the elevated ambient CO2 concentrations in the urban area in Pardubice would be caused mostly by attributions of small scattered CO2 sources, for example by transportation and local heating facilities, while the influence of few major nearby industrial CO2 sources is comparatively less significant.
5 Acknowledgments
Financial support of this work was provided by the Ministry of Education, Youth and Sports of the Czech Republic through the project MSM 0021627502 and by the scientific research project of Ministry of Environment of the Czech Republic through Grant No SP/4i2/60/07.
WSEAS TRANSACTIONS on ENVIRONMENT and DEVELOPMENTJaromíra Chýlková, Tomáš Brunclík, Ilona Obršálová, Kwasi Asare Baffour Danquah, Renata Šelešovská
E-ISSN: 2224-3496 104 Issue 3, Volume 8, July 2012
References
[1] Zervas E.: Analysis of the European Market of
New Passenger Cars and Correlations with
their CO2 Emissions. [Online]. [cited 20.12.2009]. Accessible from <http://www.wseas.org/conferences/2008/corfu/wwai/Plenary2.htm>.
[2] Arapatsakos Ch. I.: General Information about
Renewable Energy Sources and Bio Fuels. [Online]. [cited 20.12.2009]. Accessible from <http://www.wseas.org/conferences/2008/rodos/hte/plenary14.htm>.
[3] Discussion about environmentally friendly
transport (in Czech). [Online]. [cited 30.12.2009]. Accessible from <http://www.europarl.europa.eu/sides/getDoc.do?language=CS&type=IM-PRESS&reference=20080307STO23281>.
[4] Woodcock, J. et al. Public health benefits of strategies to reduce greenhouse-gas emissions: urban land transport. The Lancet Vol. 374, No. 9705, 2009, pp. 1930-1943.
[5] Wagner V.: Study of time changes of carbon
dioxide content in atmosphere (in Czech). [Online]. [cited 20.12.2009]. Accessible from <http://ojs.ujf.cas.cz/~wagner/popclan/ekologie/Co2tretipol_verzepromujweb.htm>.
[6] ECOPROBE 5 Operator’s manual, Prague: RS Dynamics, 2004. 76 pp.
[7] C. Kennedy, J. Steinberger, B. Gasson, Y. Hansen, T. Hillman, M. Havránek, D. Pataki, A. Phdungsilp, A. Ramaswami, a G. V. Mendez, „Greenhouse Gas Emissions from Global Cities“, Environ. Sci. Technol., vol. 43, no. 19, pp. 7297–7302, 2009.
[8] Integrated Pollution Register (in Czech). [Online]. [cited 20.12.2011] URL <http://tomcat.cenia.cz/irz/>.
[9] Brunclík, T. GIS application for pollution
spread assessment (dissertation, in Czech). University of Pardubice, 2002, 184 pp.
[10] Bubnik, J., Keder, J., Macoun, J. & Manak, J. SYMOS 97–Stationary Sources Modeling
System–a reference manual, Czech Hyrometeorological Institute, 1998.
WSEAS TRANSACTIONS on ENVIRONMENT and DEVELOPMENTJaromíra Chýlková, Tomáš Brunclík, Ilona Obršálová, Kwasi Asare Baffour Danquah, Renata Šelešovská
E-ISSN: 2224-3496 105 Issue 3, Volume 8, July 2012