Position of Coal in Future Energy Scenario in India Kalyan Sen Director Central Fuel Research...
41
Position of Position of Coal in Future Coal in Future Energy Scenario Energy Scenario in India in India Kalyan Sen Director Central Fuel Research Institute, Dhanbad (India)
-
Upload
ralph-walters -
Category
Documents
-
view
214 -
download
0
Transcript of Position of Coal in Future Energy Scenario in India Kalyan Sen Director Central Fuel Research...
Position of Coal Position of Coal
in Future Energy in Future Energy
Scenario in Scenario in
IndiaIndiaKalyan Sen
Director
Central Fuel Research Institute, Dhanbad (India)

Status of Power Generation Status of Power Generation in Indiain India

Per capita Primary energy Consumption:
India 243 kgoe/y
developed Countries 1000
Average 7000-8000
(IEA Coal research, Nov.’98)
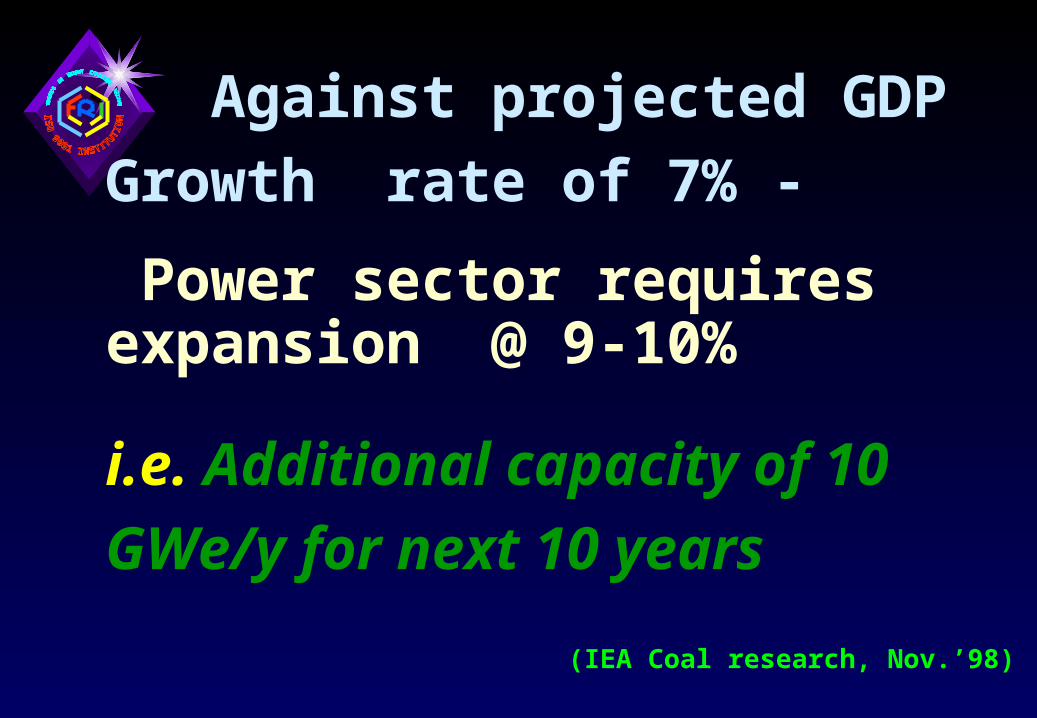
Against projected GDP Growth
rate of 7% -
Power sector requires expansion @ 9-10%
i.e. Additional capacity of 10 GWe/y for next 10 years (IEA Coal research, Nov.’98)
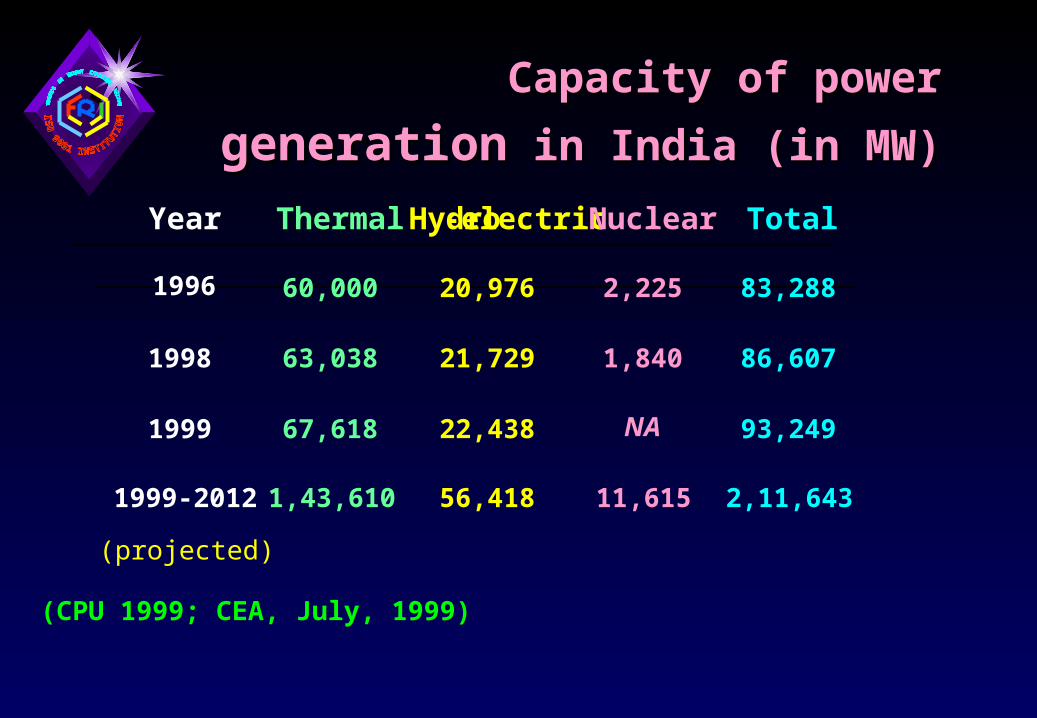
Capacity of power Capacity of power generationgeneration in India in India
(in MW)(in MW)
Year Thermal Hydro-electric Nuclear Total
1996 60,000 20,976 2,225 83,288
1998 63,038 21,729 1,840 86,607
1999 67,618 22,438 NA 93,249
1999-2012
(projected)
1,43,610 56,418 11,615 2,11,643
(CPU 1999; CEA, July, 1999)

Capacity Utilization of Power Fuels and Capacity Utilization of Power Fuels and
Electricity generatedElectricity generated
(Source: CPU 1999)
Thermal fuel No. of stations Capacity(MW) Generation(GWh)
Coal 73 51134 276605
Lignite 3 2280 13853
Gas 30 7203 35396
Oil/Diesel & others 11 1017 2387
Multi-fuel 2 1404 7292
119 63038 336033

'60-'61 '70-'71 '80-'81 '90-91 '96-'97* @'97-'98* '98-'99*0
10
20
30
40
50
60
70
Cap
acit
y (M
W)
(Th
ousa
nd
s)
0
100
200
300
400
Electricity (G
Wh
) (Th
ousan
ds)
Capacity (MW)
Electricity (GWh)
Growth of Installed capacity and Electricity generated in Thermal Power Plant
* Monitored capacity @ end of 8th plan
Coal consumption, Coal consumption,
productionproduction and and qualityquality

Increased demand and Increased demand and dependence on coaldependence on coallead tolead to
• ecological disbalance on mining site
• transportation overloading
• alarming emission of hazardous matters
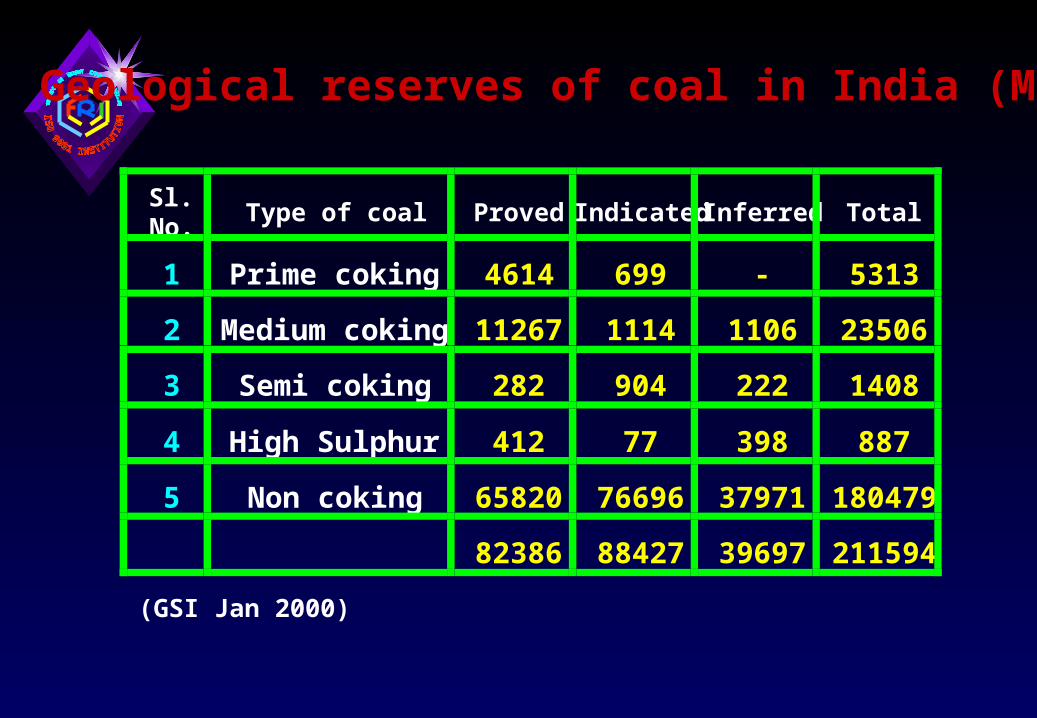
Geological reserves of coal in India (Mt)
Sl.No.
Type of coal Proved Indicated Inferred Total
1 Prime coking 4614 699 - 5313
2 Medium coking 11267 1114 1106 23506
3 Semi coking 282 904 222 1408
4 High Sulphur 412 77 398 887
5 Non coking 65820 76696 37971 180479
82386 88427 39697 211594
(GSI Jan 2000)
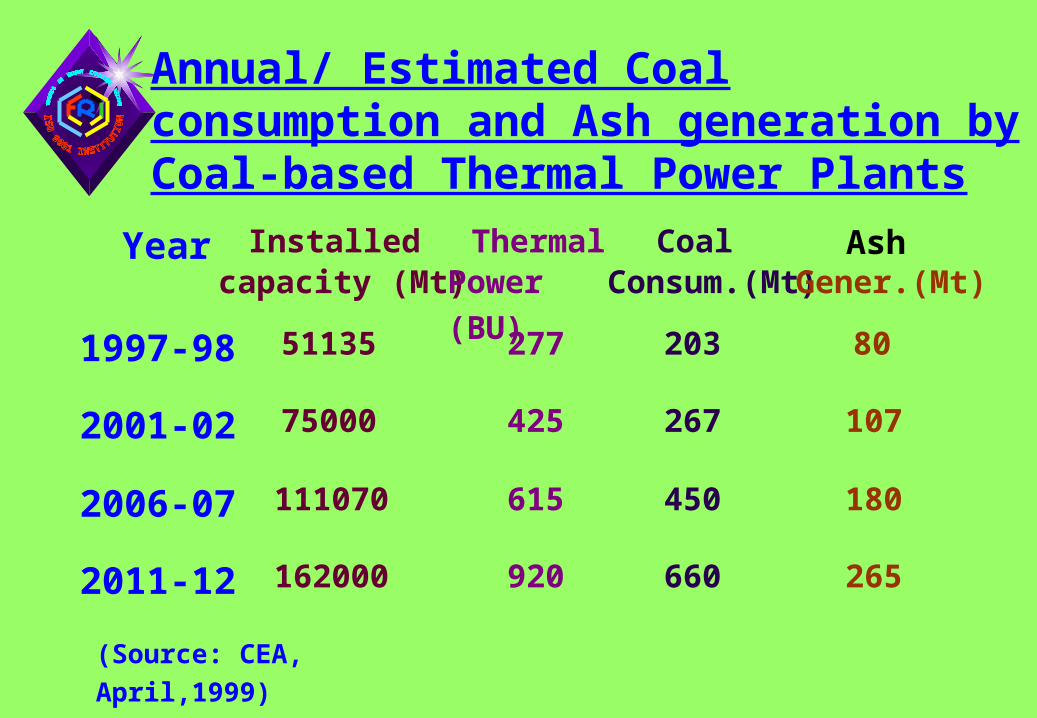
Annual/ Estimated Coal consumption and Ash generation by Coal-based Thermal Power PlantsYear
1997-98
2001-02
2006-07
2011-12
Installedcapacity (Mt)
51135
75000
111070
162000
ThermalPower (BU)
277
425
615
920
CoalConsum.(Mt)
203
267
450
660
AshGener.(Mt)
80
107
180
265
(Source: CEA, April,1999)

Coal Consumption pattern in different states (as on March,1999)
States
Delhi, Punjab, Hariana, Rajasthan
Bihar, West bengal & Orissa
Gujarat
Maharastra
Madhya Pradesh
Tamilnadu & Karnataka
Andhra Pradesh
Uttar Pradesh
Assam
No. ofPlants
Generation
(MW)
Coalconsumption
(Mt)10
21
5
8
7
5
6
10
1
73
5153
12300
3820
6476
7163
4020
5043
8941
240
53126
20
50
15
26
28
16
20
36
-
211
(Source: CEA, 1999)

Trend of Coal Production in India
0
50
100
150
200
250
300
350
Year
Pro
du
ctio
n (
Mt)
95-9
6
1900
1915
1930
1945
1956
1971
1980
1983
1986
1989
1992
1999
(A.B.Ghosh 1997, MoC 1998-99)
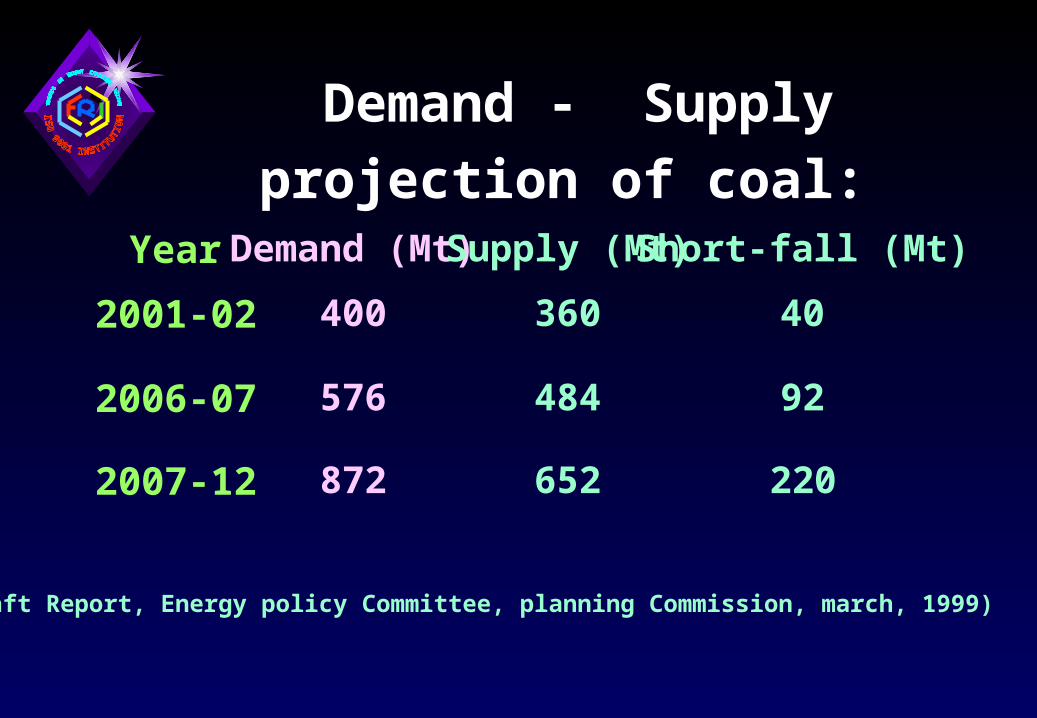
Demand - Supply projection of coal:
Year
2001-02
2006-07
2007-12
Demand (Mt)
400
576
872
Supply (Mt)
360
484
652
Short-fall (Mt)
40
92
220
(Draft Report, Energy policy Committee, planning Commission, march, 1999)
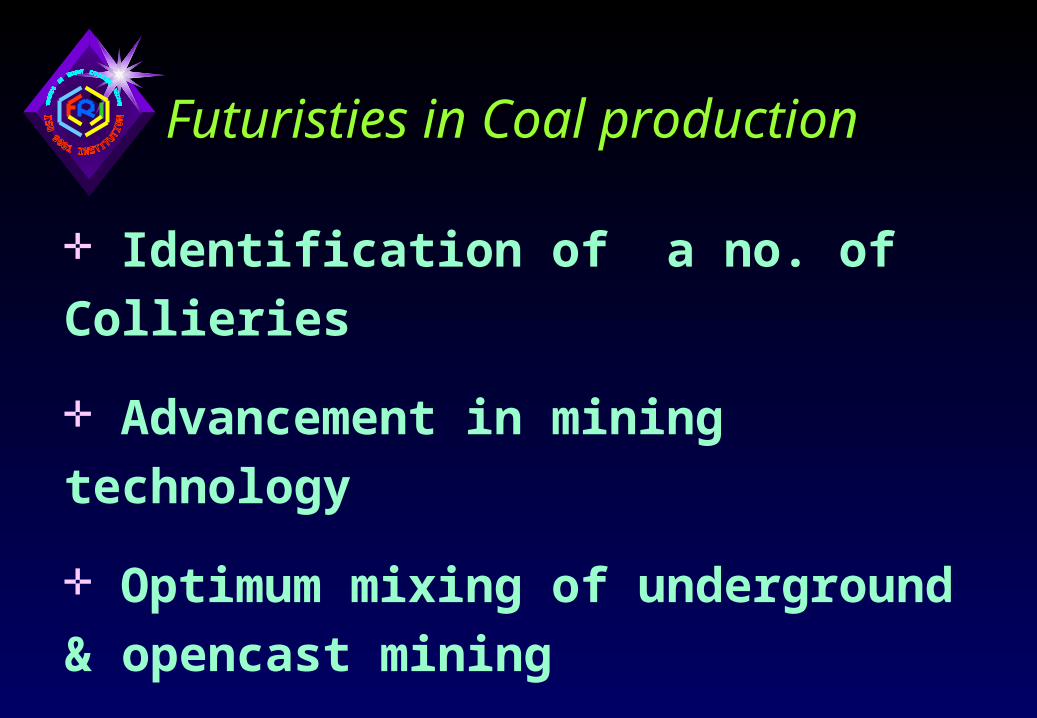
Futuristies in Coal productionFuturisties in Coal production
Identification of a no. of Collieries
Advancement in mining technology
Optimum mixing of underground &
opencast mining
Quality improvement by beneficiation

Coal for Power Plants Coal for Power Plants
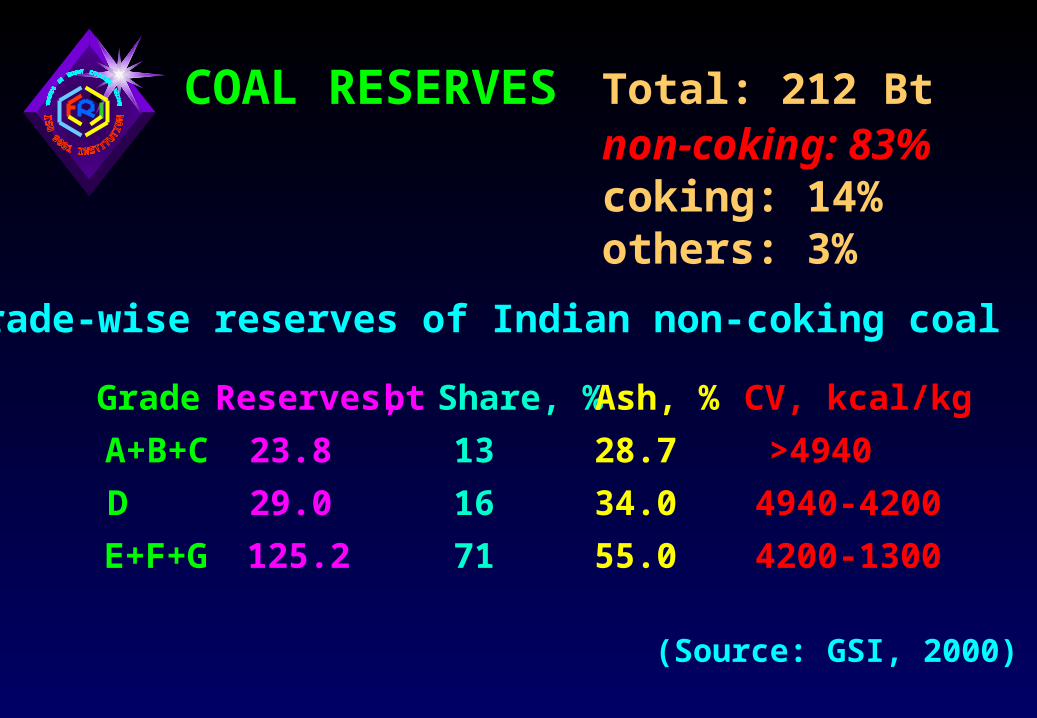
Grade-wise reserves of Indian non-coking coal
Grade Reserves, bt Share, % Ash, % CV, kcal/kg
A+B+C 23.8 13 28.7 >4940
D 29.0 16 34.0 4940-4200
E+F+G 125.2 71 55.0 4200-1300
(Source: GSI, 2000)
COAL RESERVES Total: 212 Btnon-coking: 83%coking: 14%others: 3%
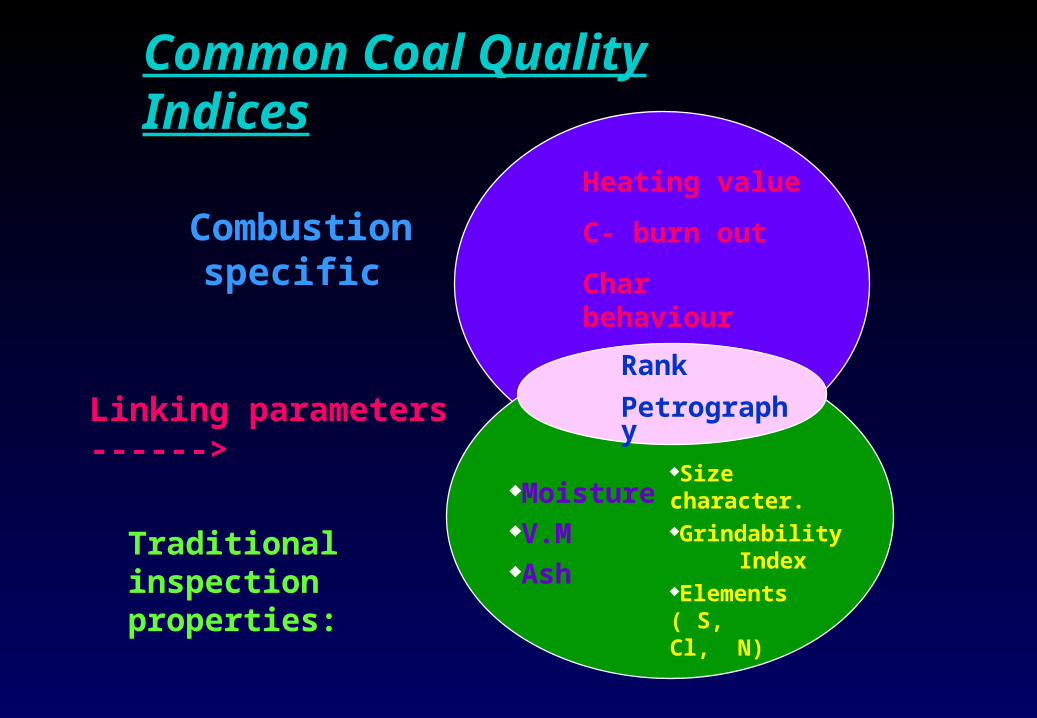
Common Coal Quality IndicesCommon Coal Quality Indices
Combustion specific
Heating value
C- burn out
Char behaviour
Traditional inspection properties:
MoistureV.MAsh
Size character.Grindability
IndexElements ( S,
Cl, N)
Rank
PetrographyLinking parameters ------>
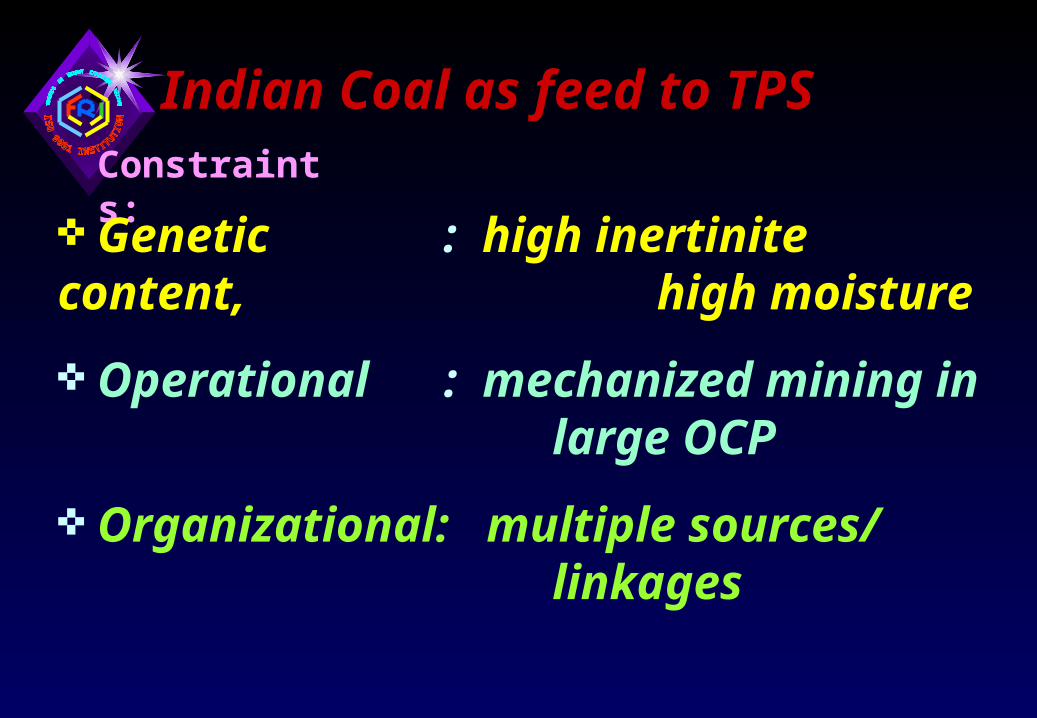
Indian Coal as feed to TPS Constraints:
Genetic : high inertinite content, high moisture
Operational : mechanized mining in large OCP
Organizational: multiple sources/ linkages

Indian Coal as feed to TPS (contd…)
Favourable qualities: Genetic
Low Sulphur content ( <0.6%) High ash fusion temperature (>1100oC) Low Iron content Low Chlorine content Low toxic trace elements Reactive inertinites
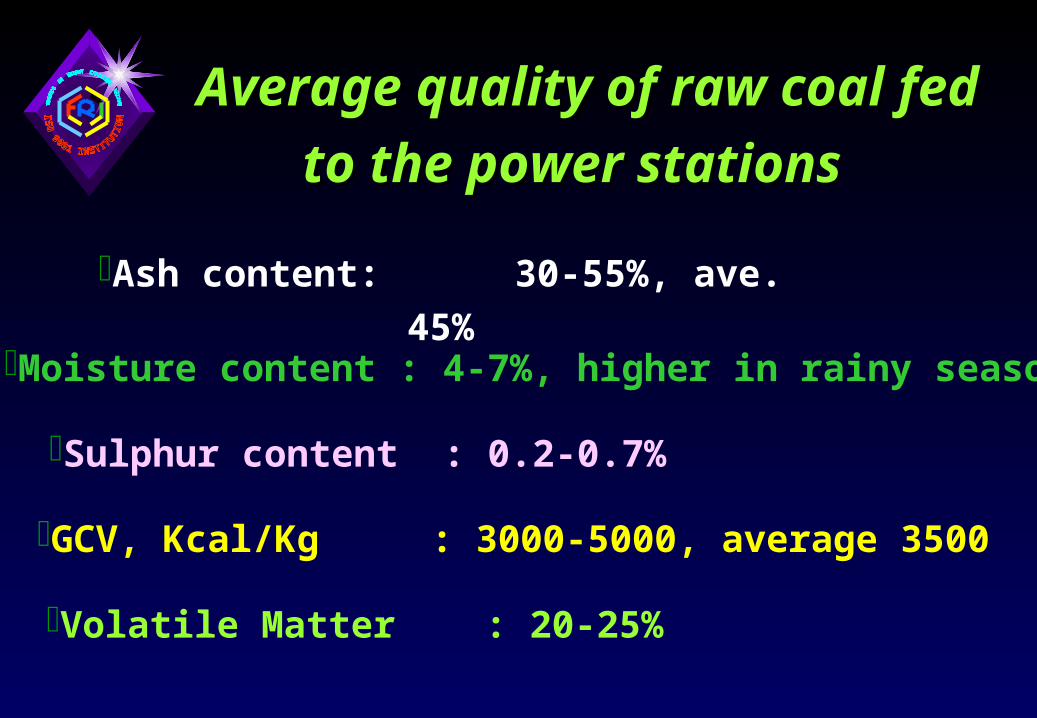
Average quality of raw coal Average quality of raw coal
fed to the power stationsfed to the power stations
Ash content: 30-55%, ave. 45%
Moisture content : 4-7%, higher in rainy season
Sulphur content : 0.2-0.7%
GCV, Kcal/Kg : 3000-5000, average 3500
Volatile Matter : 20-25%
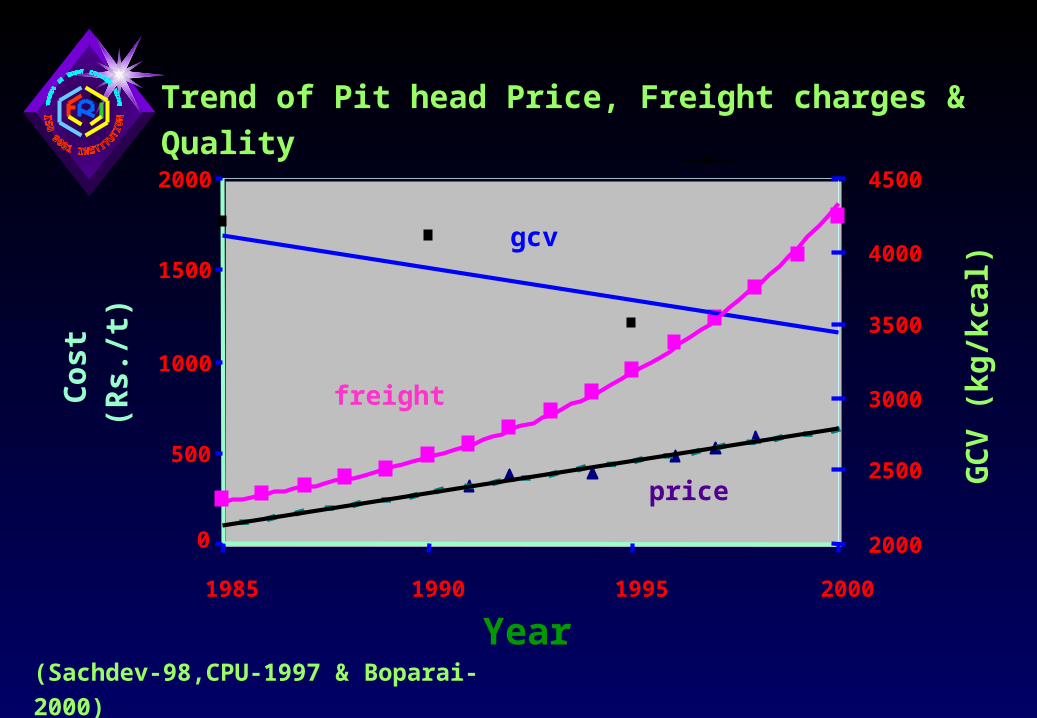
Year
Co
st
(R
s./t
)
GC
V (
kg
/kc
al)
0
500
1000
1500
2000
1985 1990 1995 2000
2000
2500
3000
3500
4000
4500
price
freight
gcv
Trend of Pit head Price, Freight charges & Quality
(Sachdev-98,CPU-1997 & Boparai-2000)

Quality and Cost of Coal and LogisticsQuality and Cost of Coal and Logistics
Cost of production is cheaper but freight is high For the last 18 years, increase in freight is 13%
against 9% coal price hike/ year For grade “F” transported beyond 750km,
freight increased from 43% to 54% of the delivered cost (1981 to 1999 )
In western and southern states, Indian coals have to compete with imported coals as freight is presently as high as 71%

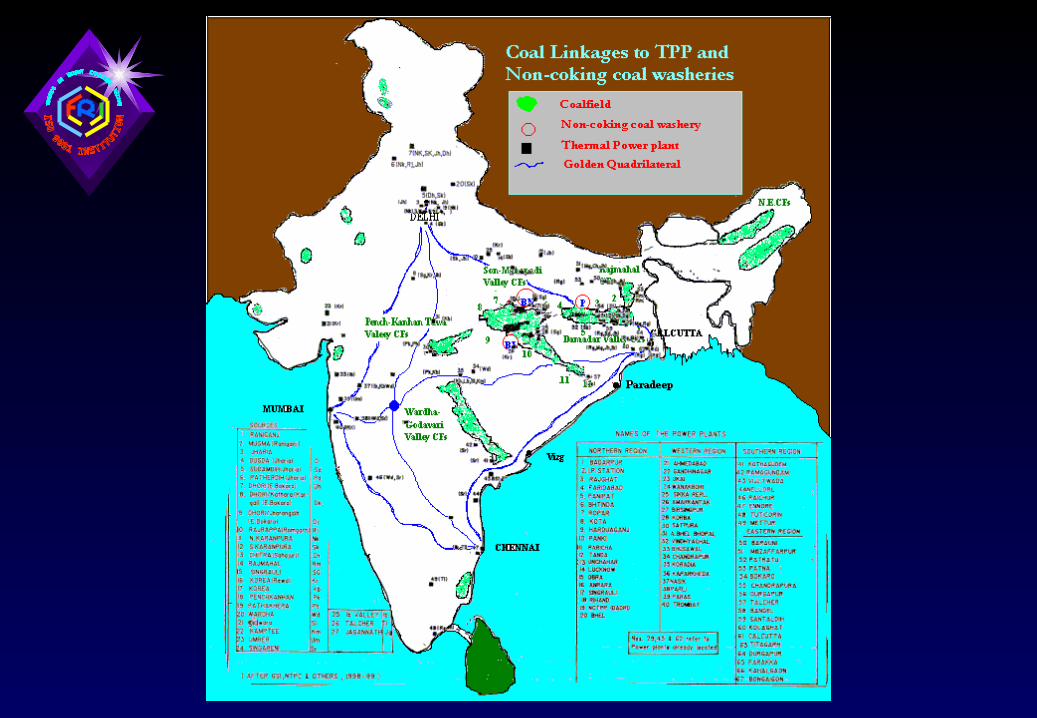
Non-coking Coal Washing Status in India

Probable Benefaction SchemesProbable Benefaction Schemes
blending low ash imported coal with high ash indigenous coal
mixing finer fraction with Cleans of coarser fraction
mixing cleans of all fractions (whole coal beneficiation )
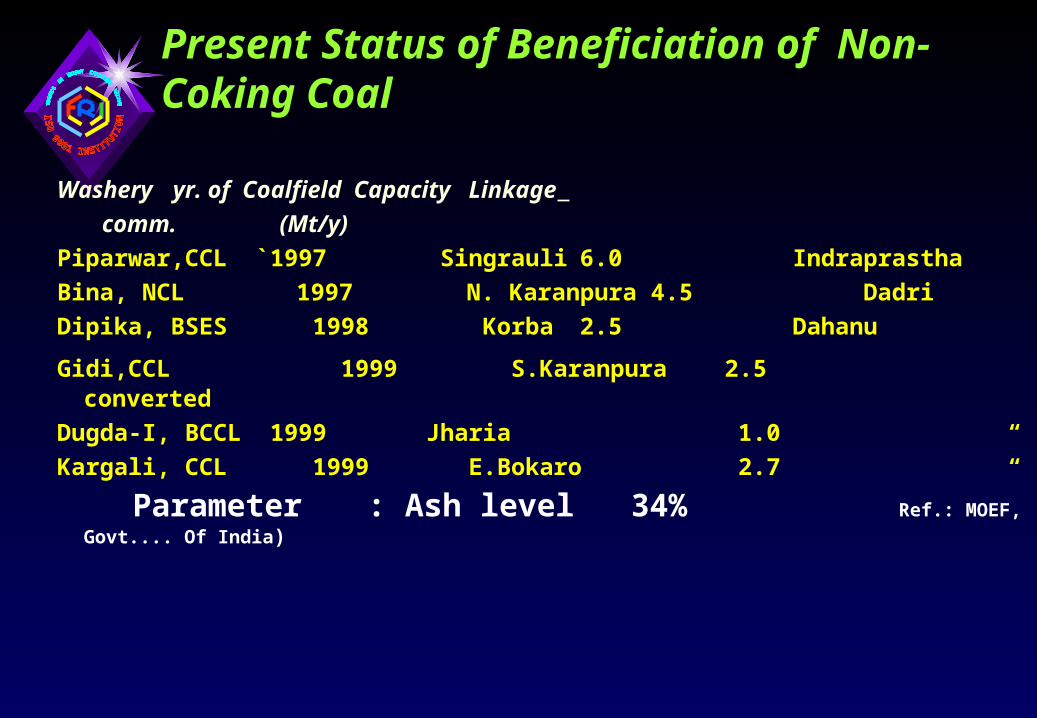
Present Status of Beneficiation of Non-Coking Coal
Washery yr. of Coalfield Capacity Linkage
comm. (Mt/y)Piparwar,CCL `1997 Singrauli 6.0 Indraprastha
Bina, NCL 1997 N. Karanpura 4.5 Dadri
Dipika, BSES 1998 Korba 2.5 Dahanu
Gidi,CCL 1999 S.Karanpura 2.5 converted
Dugda-I, BCCL 1999 Jharia 1.0 “
Kargali, CCL 1999 E.Bokaro 2.7 “
Parameter : Ash level 34% Ref.: MOEF, Govt.... Of India)
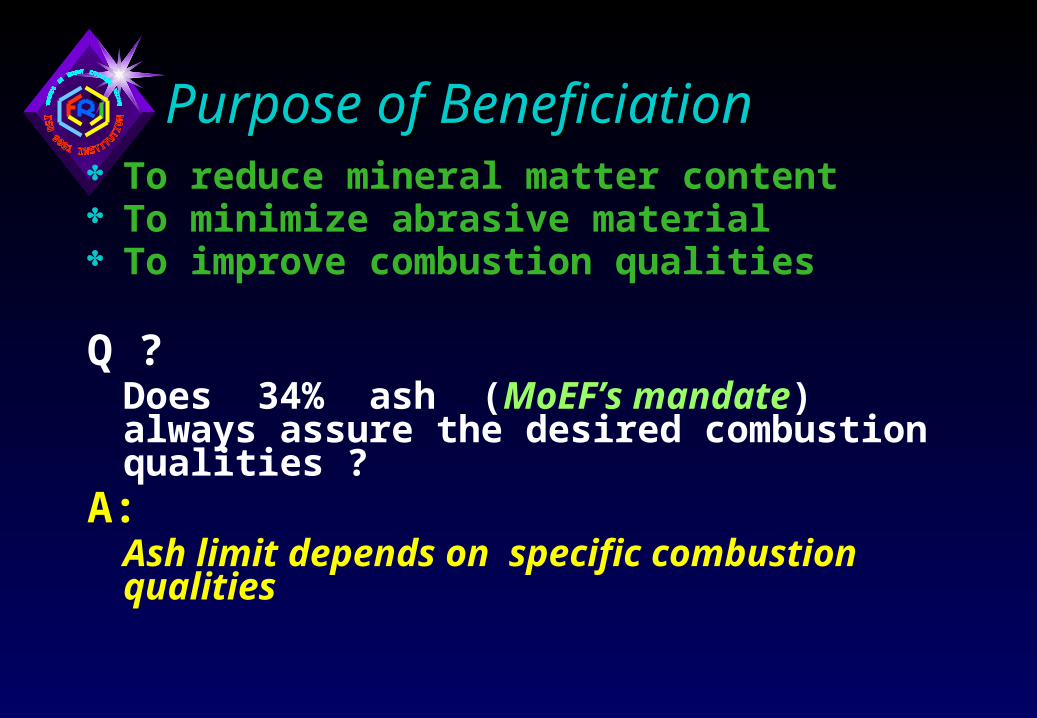
Purpose of Beneficiation Purpose of Beneficiation To reduce mineral matter content To minimize abrasive material To improve combustion qualities
Q ?Does 34% ash (MoEF’s mandate) always assure the desired combustion qualities ?
A: Ash limit depends on specific combustion qualities
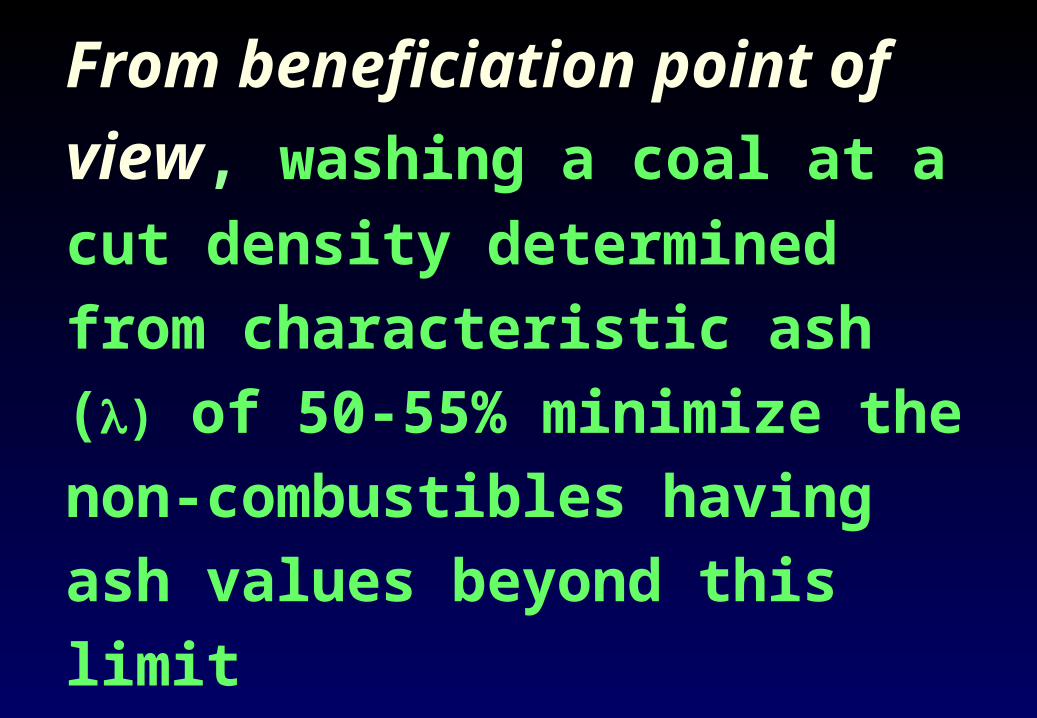
From beneficiation point of view, washing a coal at a cut density determined from characteristic ash () of 50-55% minimize the non-combustibles having ash values beyond this limit
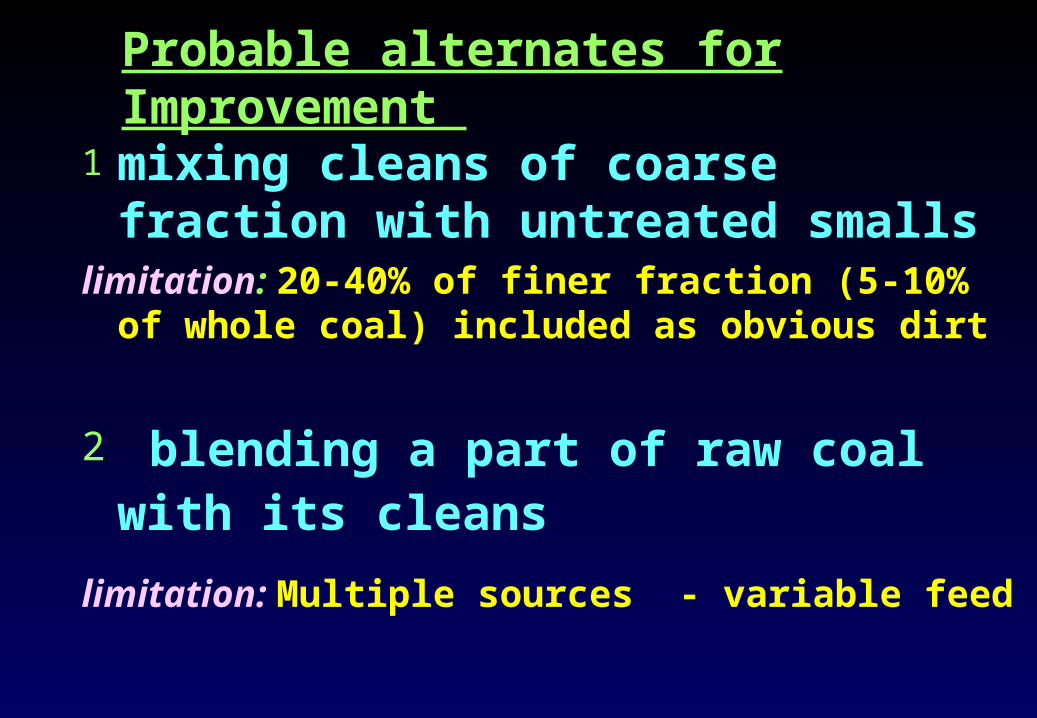
Probable alternates for Improvement Probable alternates for Improvement
1 mixing cleans of coarse fraction with untreated smalls
limitation: 20-40% of finer fraction (5-10% of whole coal) included as obvious dirt
2 blending a part of raw coal with its cleans
limitation: Multiple sources - variable feed
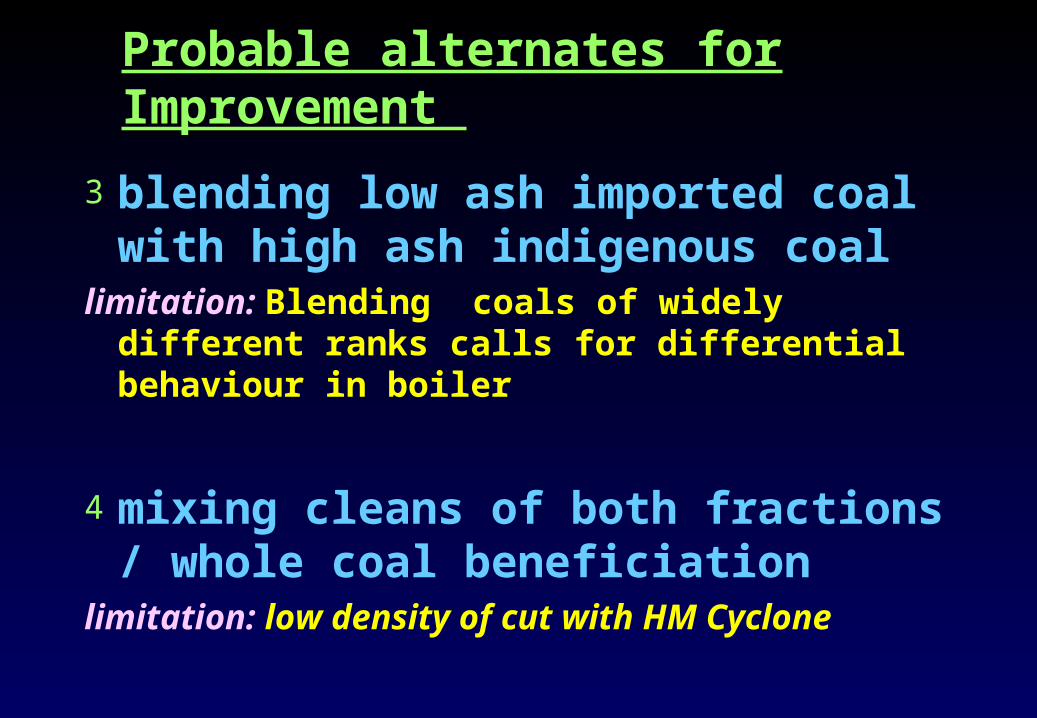
3 blending low ash imported coal with high ash indigenous coal
limitation: Blending coals of widely different ranks calls for differential behaviour in boiler
4 mixing cleans of both fractions / whole coal beneficiation
limitation: low density of cut with HM Cyclone
Probable alternates for Improvement Probable alternates for Improvement

beneficiating whole coal, particularly, where crushing to finer size does not help in liberation
washing a coal at a specific gravity determined from = 50-55%.
This will minimize the presence of non-combustibles and reduce the hazardous emissions/kWh electricity generated

CO2 EMISSION IS CONSIDERED
AS THE MAJOR THREAT (THE
GREENHOUSE EFFECT)
‘KYOTO PROTOCOL’ demands the
reduction in CO2- release and
identifies coal fired boilers as the
main industrial source

Coal Combustion Efficiency vs. CO2 emission
Source: Ecoal, vol 27, 1998
20 30 40 50 600
0.2
0.4
0.6
0.8
1
1.2
1.4
1.6
1.8
2
CO2 emission
Coal used, t

COCO2 2 emission can be reduced by emission can be reduced by
reducingreducing the the consumptionconsumption of of
coal /kWh of electricity coal /kWh of electricity
generatedgenerated
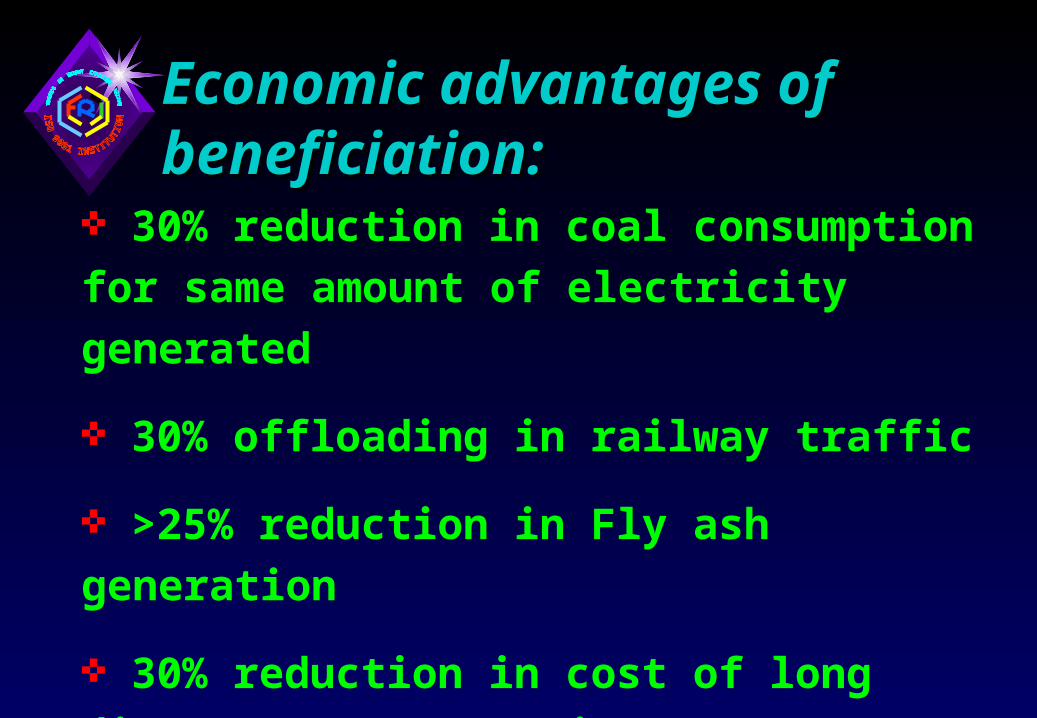
Economic advantages of Economic advantages of beneficiation:beneficiation:
30% reduction in coal consumption for same
amount of electricity generated
30% offloading in railway traffic
>25% reduction in Fly ash generation
30% reduction in cost of long distant
transportation
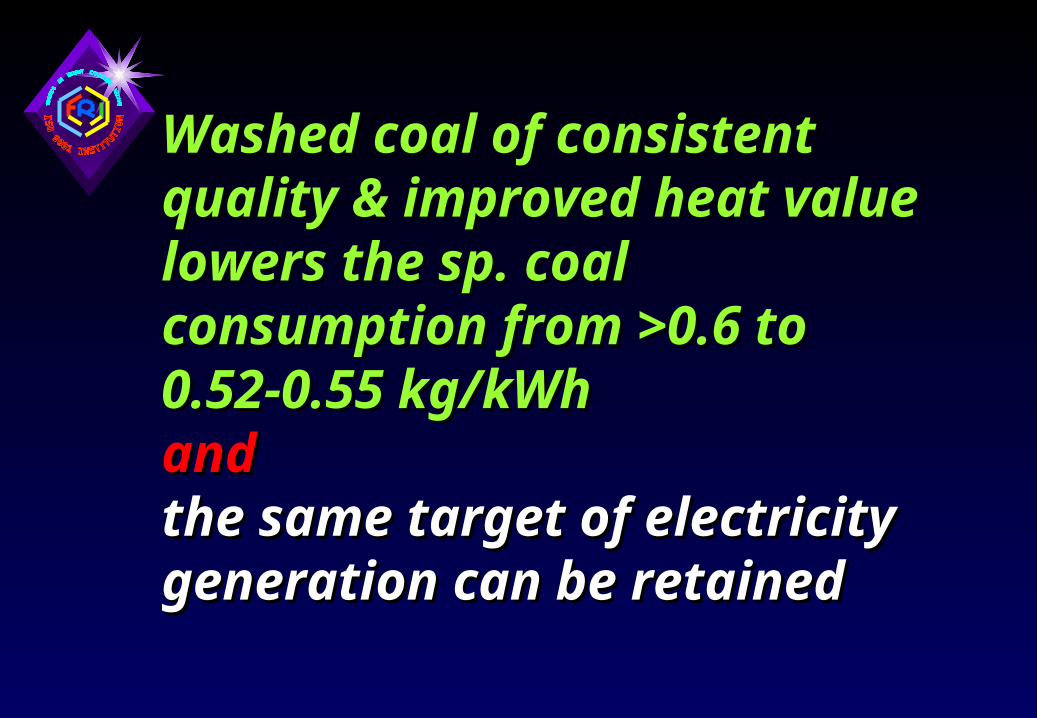
Washed coal of consistent quality Washed coal of consistent quality & improved heat value lowers the & improved heat value lowers the sp. coal consumption from >0.6 to sp. coal consumption from >0.6 to 0.52-0.55 kg/kWh0.52-0.55 kg/kWhandandthe same target of electricity the same target of electricity generation can be retainedgeneration can be retained
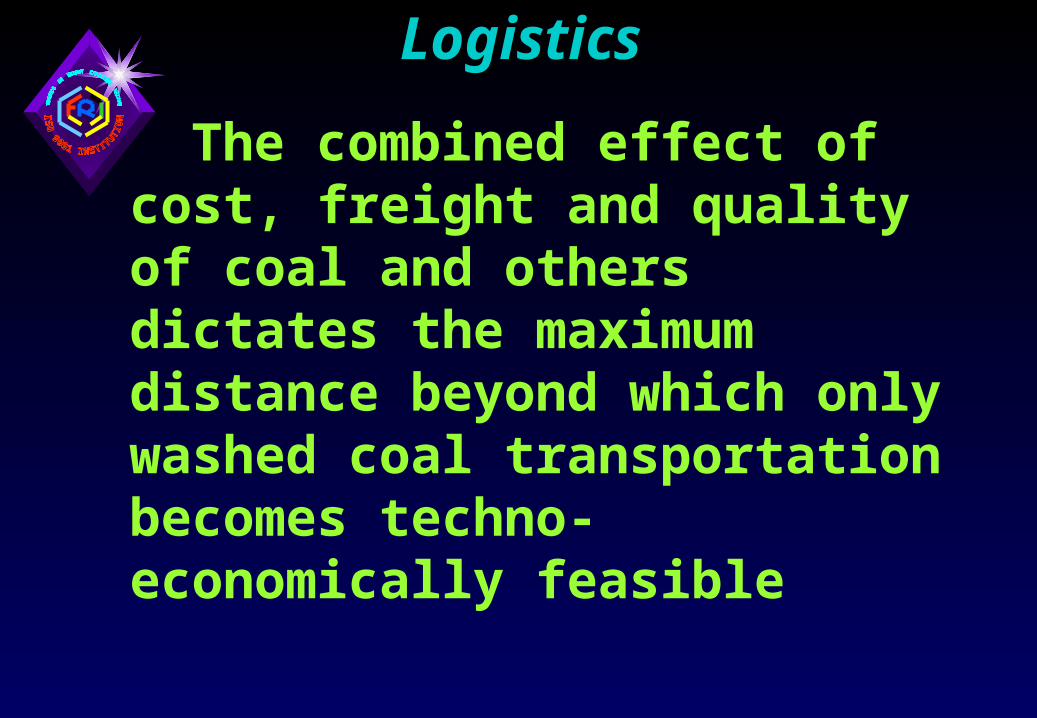
The combined effect of cost, freight and quality of coal and others dictates the maximum distance beyond which only washed coal transportation becomes techno-economically feasible
LogisticsLogistics
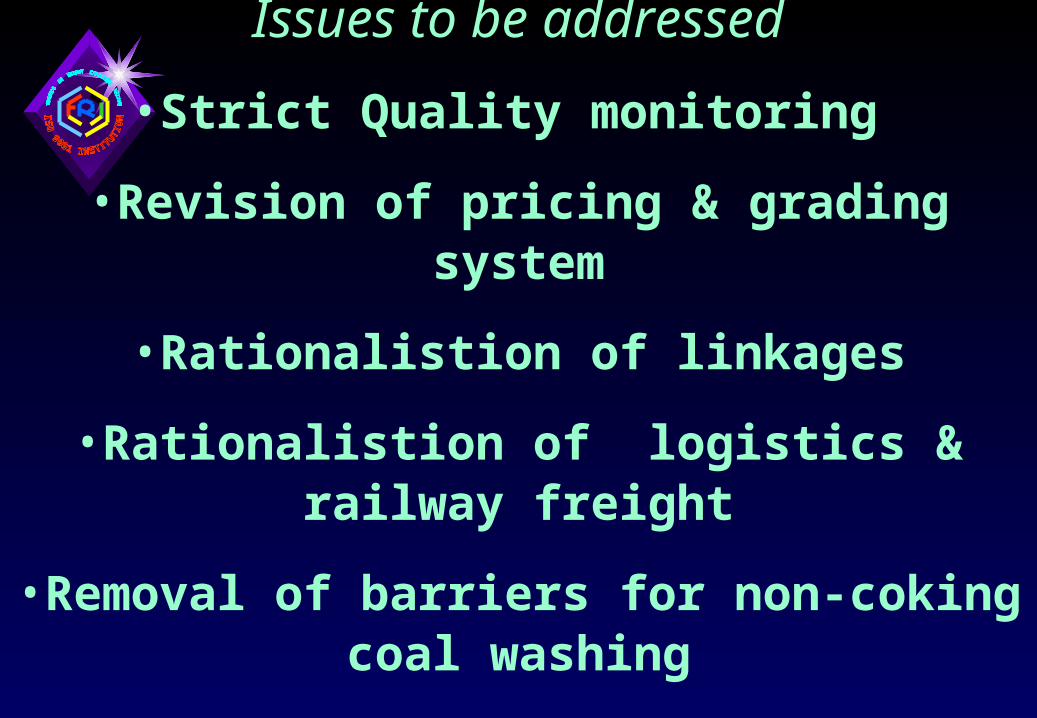
Issues to be addressed
•Strict Quality monitoring
•Revision of pricing & grading system
•Rationalistion of linkages
•Rationalistion of logistics & railway freight
•Removal of barriers for non-coking coal washing
•Advanced technology for power generation
•Proper waste management

Efficiency enhancement in Energy Sector must involve all the activities in ‘Coal - Energy chain’ with special emphasis to Improvement in coal quality by judicious
beneficiation
Conclusion:Conclusion:

Improvement in coal quality by
judicious beneficiation of Indian coal
is, therefore one of the options of
efficiency enhancement processes, if
not the bare necessity under present
context