
Port St. Lucie, Florida - HUD User...Port St. Lucie, Florida U.S. Department of Housing and Urban...
12
COMPREHENSIVE HOUSING MARKET ANALYSIS Port St. Lucie, Florida U.S. Department of Housing and Urban Development Office of Policy Development and Research As of January 1, 2016 Palm Beach Okeechobee Glades Atlantic Ocean Indian River Hendry Osceola Highlands Martin St. Lucie Housing Market Area The Port St. Lucie Housing Market Area (HMA), which is coterminous with the Port St. Lucie, FL Metropolitan Statistical Area (MSA), consists of Martin and St. Lucie Counties. The Port St. Lucie HMA, part of the Treasure Coast region on the southern Atlantic Coast of Florida, is approximately 60 miles north of West Palm Beach. The HMA is home to PGA Village-St. Lucie, a 54-hole golf resort, and Tradition Field, the spring training facility for the New York Mets Major League Baseball team. Summary Economy During 2015, economic growth con- tinued in the Port St. Lucie HMA for the fifth consecutive year, although at a slower pace, with nonfarm payrolls increasing by 4,300 jobs, or 3.3 percent, from the previous year to 135,600 jobs, following an increase of 5,300 jobs, or 4.2 percent, during 2014. The wholesale and retail trade sector is the largest employment sector in the HMA, ac- counting for approximately 19 percent of all jobs. During the next 3 years, nonfarm payrolls are expected to increase by an average of 5,025 jobs, or 3.7 percent, annually. Sales Market Sales housing market conditions in the HMA are balanced, with an estimated vacancy rate of 2.2 percent, down from 4.2 percent in April 2010. During 2015, new and existing home sales (includ- ing single-family homes, townhomes, and condominiums) increased less than 1 percent from the previous year and the average sales price increased 13 percent (CoreLogic, Inc., with adjustments by the analyst). During the 3-year forecast period, demand is expected for approximately 6,075 new homes in the HMA (Table 1). The 520 homes currently under construction will meet a portion of this demand. In addition, a portion of the estimated 27,000 other vacant units likely will reenter the market and satisfy some of the demand. Rental Market Overall rental housing market condi- tions are currently slightly soft in the HMA, with an estimated vacancy rate of 9.3 percent, down from 14.7 percent in April 2010. Apartment market conditions are tight, with a vacancy rate of 3.2 percent during the fourth quarter of 2015, down from 3.8 percent during the fourth quarter of 2014 (Axiometrics Inc.). During the next 3 years, demand is expected for 2,325 market-rate rental units (Table 1). The 290 units currently under construction will satisfy some of this demand. Table 1. Housing Demand in the Port St. Lucie HMA During the Forecast Period Port St. Lucie HMA Sales Units Rental Units Total demand 6,075 2,325 Under construction 520 290 Notes: Total demand represents estimated production necessary to achieve a balanced market at the end of the forecast period. Units under construction as of January 1, 2016. A portion of the estimated 27,000 other vacant units in the HMA will likely satisfy some of the forecast demand. Sales demand includes an estimated demand for 45 mobile homes. The forecast period is January 1, 2016, to January 1, 2019. Source: Estimates by analyst Market Details Economic Conditions ............... 2 Population and Households ..... 5 Housing Market Trends ............ 7 Data Profile ............................. 11
Transcript of Port St. Lucie, Florida - HUD User...Port St. Lucie, Florida U.S. Department of Housing and Urban...
C O M P R E H E N S I V E H O U S I N G M A R K E T A N A L Y S I S
Port St. Lucie, FloridaU.S. Department of Housing and Urban Development Office of Policy Development and Research As of January 1, 2016
Palm Beach
Okeechobee
Glades
Atlantic Ocean
Indian River
Hendry
Osceola
Highlands
Martin
St. Lucie
Housing Market Area
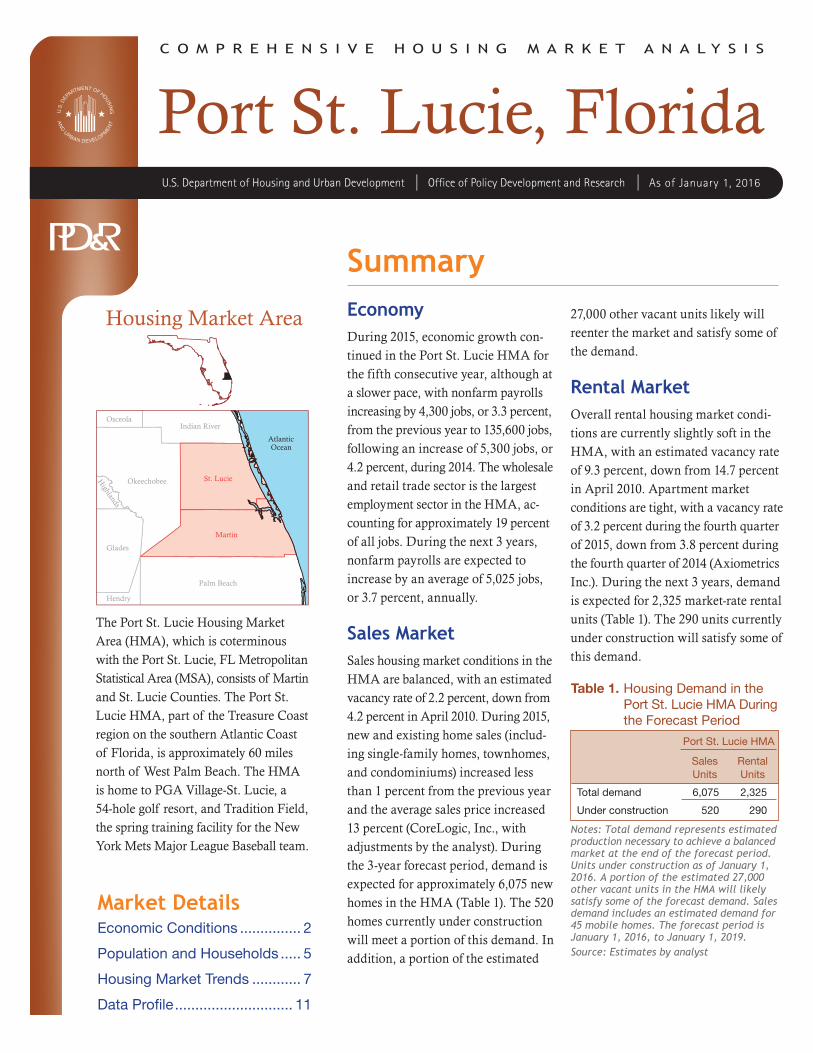
The Port St. Lucie Housing Market Area (HMA), which is coterminous with the Port St. Lucie, FL Metropolitan Statistical Area (MSA), consists of Martin and St. Lucie Counties. The Port St. Lucie HMA, part of the Treasure Coast region on the southern Atlantic Coast of Florida, is approximately 60 miles north of West Palm Beach. The HMA is home to PGA Village-St. Lucie, a 54-hole golf resort, and Tradition Field, the spring training facility for the New York Mets Major League Baseball team.
SummaryEconomy During 2015, economic growth con-tinued in the Port St. Lucie HMA for the fifth consecutive year, although at a slower pace, with nonfarm payrolls increasing by 4,300 jobs, or 3.3 percent, from the previous year to 135,600 jobs, following an increase of 5,300 jobs, or 4.2 percent, during 2014. The wholesale and retail trade sector is the largest employment sector in the HMA, ac-counting for approximately 19 percent of all jobs. During the next 3 years, nonfarm payrolls are expected to increase by an average of 5,025 jobs, or 3.7 percent, annually.
Sales MarketSales housing market conditions in the HMA are balanced, with an estimated vacancy rate of 2.2 percent, down from 4.2 percent in April 2010. During 2015, new and existing home sales (includ-ing single-family homes, townhomes, and condominiums) increased less than 1 percent from the previous year and the average sales price increased 13 percent (CoreLogic, Inc., with adjustments by the analyst). During the 3-year forecast period, demand is expected for approximately 6,075 new homes in the HMA (Table 1). The 520 homes currently under construction will meet a portion of this demand. In addition, a portion of the estimated
27,000 other vacant units likely will reenter the market and satisfy some of the demand.
Rental MarketOverall rental housing market condi-tions are currently slightly soft in the HMA, with an estimated vacancy rate of 9.3 percent, down from 14.7 percent in April 2010. Apartment market con ditions are tight, with a vacancy rate of 3.2 percent during the fourth quarter of 2015, down from 3.8 percent during the fourth quarter of 2014 (Axiometrics Inc.). During the next 3 years, demand is expected for 2,325 market-rate rental units (Table 1). The 290 units currently under construction will satisfy some of this demand.
Table 1. Housing Demand in the Port St. Lucie HMA During the Forecast Period
Port St. Lucie HMA
SalesUnits
RentalUnits
Total demand 6,075 2,325
Under construction 520 290
Notes: Total demand represents estimated production necessary to achieve a balanced market at the end of the forecast period. Units under construction as of January 1, 2016. A portion of the estimated 27,000 other vacant units in the HMA will likely satisfy some of the forecast demand. Sales demand includes an estimated demand for 45 mobile homes. The forecast period is January 1, 2016, to January 1, 2019.Source: Estimates by analyst
Market DetailsEconomic Conditions ............... 2
Population and Households ..... 5
Housing Market Trends ............ 7
Data Profile ............................. 11

Po
rt
St.
Lu
cie
, F
L •
CO
MP
RE
HE
NS
IVE
HO
US
ING
MA
RK
ET
AN
ALY
SIS
2Economic Conditions
Economic conditions in the Port St. Lucie HMA have improved
since 2011, following 3 years of annual job losses that significantly impacted the local economy. From 2001 through 2005, nonfarm payrolls increased by an average of 5,300 jobs, or 4.7 percent, annually, reaching peak annual growth of 8,300 jobs, or 6.9 percent, in 2005. The wholesale and retail trade sector accounted for 26 percent of the job growth during the 2001-through-2005 period, increasing by an average of 1,400 jobs, or 6.4 percent, annually. Tradition, an 8,200-acre master-planned community that is permitted for more than 18,000 residences, 8.2 million square feet of office and retail space, 940 hotel rooms, and a 300-bed hospital, opened its first phase in St. Lucie County in 2003, which contributed to job gains in the retail trade and construction subsectors during this period. Job growth began to slow in 2006, to 5,700 jobs, or 4.4 percent, and plummeted to 400 jobs, or 0.3 percent, in 2007 as a result of job losses that began primarily in the goods-producing sectors. In 2008, a period of substantial job loss began in the
HMA, partly due to the national re-cession, and from 2008 through 2010 payrolls declined by an average of 4,500 jobs, or 3.5 percent, annually. As a result of the housing crisis, the mining, logging, and construction sector lost the greatest number of jobs in the HMA during this period, de-clining by an average of 2,000 jobs, or 17.3 percent, annually. The economy began to improve in 2011, and from 2011 through 2014 nonfarm payrolls increased by an average of 2,400 jobs, or 1.9 percent, annually. Growth in the service-providing sectors accounted for nearly 88 percent of growth during this period, with the greatest average annual increase of 1,000 jobs, or 7.0 percent, in the professional and busi-ness services sector. The expansion of call centers contributed to growth during this period. In 2013, QVC, Inc., a home shopping network, and Aegis Communications Group, a customer management company, announced they would add 1,650 jobs at their call centers in the city of Port St. Lucie.
During 2015, economic conditions continued to strengthen in the HMA and, for the first year, employment levels surpassed prerecession peak levels. Nonfarm payrolls increased by 4,300 jobs, or 3.3 percent, from the previous year, to 135,600 jobs (Table 2). The unemployment rate continued to decline, to an average of 6.0 percent, from 7.3 percent during 2014 and a peak of 12.7 percent in 2010 (Figure 1). Virtually all the nonfarm payroll growth during the past year was attributed to increases in the service-providing sectors. The education and health services sector led job growth during the past year, increasing by 1,300 jobs, or 5.7 percent, from the previous year, to 24,300 jobs. This sector was the only
Table 2. 12-Month Average Nonfarm Payroll Jobs in the Port St. Lucie HMA, by Sector
12 Months EndingAbsolute Change
Percent ChangeDecember
2014December
2015
Total nonfarm payroll jobs 131,300 135,600 4,300 3.3Goods-producing sectors 14,100 14,000 – 100 – 0.7
Mining, logging, & construction 8,100 8,300 200 2.5Manufacturing 6,000 5,700 – 300 – 5.0
Service-providing sectors 117,300 121,500 4,200 3.6Wholesale & retail trade 24,900 25,800 900 3.6Transportation & utilities 4,100 4,200 100 2.4Information 1,400 1,400 0 0.0Financial activities 5,300 5,300 0 0.0Professional & business services 16,000 16,700 700 4.4Education & health services 23,000 24,300 1,300 5.7Leisure & hospitality 16,900 17,600 700 4.1Other services 7,100 7,600 500 7.0Government 18,700 18,700 0 0.0
Notes: Numbers may not add to totals because of rounding. Based on 12-month averages through December 2014 and December 2015.Source: U.S. Bureau of Labor Statistics

Po
rt
St.
Lu
cie
, F
L •
CO
MP
RE
HE
NS
IVE
HO
US
ING
MA
RK
ET
AN
ALY
SIS
3
Figure 1. Trends in Labor Force, Resident Employment, and Unemploy-ment Rate in the Port St. Lucie HMA, 2000 Through 2015
Note: The 2015 annual estimate includes preliminary data.Source: U.S. Bureau of Labor Statistics
one to add jobs every year since 2001, because increased services have been needed to support the rising retiree population in the HMA. Figure 2 shows the percentage change in sector growth from 2000 to the current date. Three of the five largest companies in the HMA are in the education and health services sector, including the largest employer, Martin Health System, with nearly 2,800 employees (Table 3). Tradition Medical Center, which is part of the Martin Health System, has started its $110 million
expansion that will add three stories to the hospital and double the number of patient rooms. Approximately 500 jobs will be added by the expected completion date in 2018.
The largest employment sector, wholesale and retail trade, accounts for approximately 19 percent of all nonfarm payrolls in the HMA and added the second most jobs during the past year (Figure 3). In 2015, the sector increased by 900 jobs, or 3.6 percent, to 25,800 jobs. The retail
Figure 2. Sector Growth in the Port St. Lucie HMA, Percentage Change, 2000 to Current
Note: Current is based on 12-month averages through December 2015.Source: U.S. Bureau of Labor Statistics
Economic Conditions Continued
Une
mpl
oym
ent r
ate
Labo
r fo
rce
and
resi
dent
em
ploy
men
t
220,000
200,000
180,000
160,000
140,000
120,000
2000
2002
2004
Labor force Resident employment Unemployment rate
14.0
12.0
10.0
8.0
6.0
4.0
2.0
0.0
2006
2001
2003
2005
2007
2009
2010
2008
2012
2013
2015
2014
2011
Total nonfarm payroll jobs
Goods-producing sectors
Mining, logging, & construction
Manufacturing
Service-providing sectors
Information
Financial activities
Professional & business services
Education & health services
Government
Other services
Leisure & hospitality
Transportation & utilities
Wholesale & retail trade
– 20 – 10 200 10– 30 30 40 50 60 70

Po
rt
St.
Lu
cie
, F
L •
CO
MP
RE
HE
NS
IVE
HO
US
ING
MA
RK
ET
AN
ALY
SIS
4
Table 3. Major Employers in the Port St. Lucie HMA
Name of Employer Nonfarm Payroll Sector Number of Employees
Martin Health System Education & health services 2,783Wal-Mart Stores, Inc. Wholesale & retail trade 2,000Liberty Medical, LLC Education & health services 1,670Lawnwood Regional Medical Center Education & health services 1,500Publix Super Markets Inc. Wholesale & retail trade 1,240Florida Power & Light Company Transportation & utilities 1,038Indian River State College Government 1,037St. Lucie Medical Center-HCA Education & health services 850QVC, Inc. Information 826PNC Financial Services Group, Inc. Financial activities 699
Note: Excludes local school districts.Source: Moody’s Analytics
Figure 3. Current Nonfarm Payroll Jobs in the Port St. Lucie HMA, by Sector
Note: Based on 12-month averages through December 2015.Source: U.S. Bureau of Labor Statistics
trade subsector accounts for nearly 81 percent of jobs in this sector in part because the Tradition community has added 4.9 million square feet of retail in the HMA since its opening. A new Wal-Mart Stores, Inc. Neighborhood Market is scheduled to open in March 2016 in the city of Port St. Lucie that is expected to add 95 full- and part-time jobs. The leisure and hospitality and the professional and business services sectors both added 700 jobs during the past year, increasing 4.1 and 4.4 percent, respectively. PGA Village-St. Lucie, the only Professional Golfers’ Association of America-owned-and-operated golf resort, and Tradition Field both bring thousands of people to the HMA annually, contributing to the
growth in the leisure and hospitality sector. McKesson Corporation, a new patient services facility, is opening a call center in the city of Port St. Lucie in May 2016. Approximately 30 em-ployees have already been hired, 80 to 100 more are expected to be hired within the next 6 to 8 months, and 700 employees could potentially be hired after the call center reaches full capacity within the next 18 months.
The only sector to lose jobs during the past year was the manufacturing sector, which declined by 300 jobs, or 5.0 percent, from 2014, to 5,700 jobs, marking the first decline in this sector since 2009. Expert Shutter Services Inc., a manufacturer of hurricane and security shutters, announced
Government 13.8%
Leisure & hospitality 13.0%
Other services 5.6%
Education & health services 17.9% Professional & business services 12.4%
Wholesale & retail trade 19.1%
Manufacturing 4.2%
Mining, logging, & construction 6.1%
Information 1.0%
Transportation & utilities 3.1%
Financial activities 3.9%
Economic Conditions Continued

Po
rt
St.
Lu
cie
, F
L •
CO
MP
RE
HE
NS
IVE
HO
US
ING
MA
RK
ET
AN
ALY
SIS
5
in June 2015 plans to build a new facility in the city of Port St. Lucie. The company, which currently has an estimated 30 employees, is expected to add 10 jobs to its workforce during the next several years.
Nonfarm payrolls are expected to increase consistently during each of the next 3 years, averaging growth of 5,025 jobs, or 3.7 percent, annually, to 150,300 jobs. The education and health services sector is expected to continue to lead job growth during the 3-year forecast period with the
continued expansion at Tradition Medical Center. Growth in the profes-sional and business services sector is expected to slow, however, because QVC announced that it would close its 800-employee call center in the city of Port St. Lucie in March 2016. In August 2015, Teleperformance USA, a customer services provider, announced that it would add 500 jobs to its call center in the city of Port St. Lucie, which will help offset some of the job losses in the professional and business services sector.
Population and Households
As of January 1, 2016, the estimated population of the
Port St. Lucie HMA is 440,000, an increase of 2,675, or 0.6 percent, an nually since 2010. All the population growth in the HMA since 2010 has been from net in-migration, which has averaged 2,800 people annually (Figure 4), of which 73 percent was in St. Lucie County. Approximately 66 percent of the total population resides in St. Lucie County. The coastal location of the HMA and its relative
affordability compared with neigh-boring MSAs makes it an attractive retirement destination for many. As a result, the average net natural change (resident births minus resident deaths) in the HMA has declined annually since 2010 as the population of resi dents ages 65 and older has increased. The elderly population has increased significantly faster than the total population, an average of 2.9 percent annually, since 2010 (Bureau of Economic and Business Research, 5-year estimates).
The slow population growth since 2010 has been a significant contrast from the growth that occurred during the 2000s. From 2000 to 2007, during a time of rapid economic expansion, population growth was strong, averag-ing 12,450 people, or 3.5 percent, annually (Bureau of Economic and Business Research, with adjustments by the analyst, estimates as of July 1). Net in-migration of 12,300 people annually accounted for nearly 99
Figure 4. Components of Population Change in the Port St. Lucie HMA, 2000 to Forecast
Notes: The current date is January 1, 2016. The forecast date is January 1, 2019.Sources: 2000 and 2010—2000 Census and 2010 Census; current and forecast—estimates by analyst
Economic Conditions Continued
12,000
10,000
8,000
6,000
4,000
2,000
0
– 2,0002000 to 2010 2010 to current Current to forecast
Ave
rage
ann
ual c
hang
e
Net natural change Net migration

Po
rt
St.
Lu
cie
, F
L •
CO
MP
RE
HE
NS
IVE
HO
US
ING
MA
RK
ET
AN
ALY
SIS
6
percent of population growth during this period. The development of Tradition contributed to the rapid population growth during this time. From 2007 to 2010, the period of economic decline, population growth slowed to an average of 4,775 people, or 1.1 percent, annually, with net in-migration accounting for all the population growth. As the HMA has rebounded from the economic down-turn since 2010, population growth has slowed further, in part because job growth remains below prerecession levels and the rapid growth of Tradition has tapered. During the next 3 years,
increased economic expansion is expected to contribute to an increased population growth of 3,625 people, or 0.8 percent, annually.
The growth in the number of house-holds in the HMA has been slowed by the low rate of population growth since 2010. An estimated 184,750 households are currently in the HMA, an increase of 2,150, or 1.2 percent, since 2010 compared with an increase of 4,025, or 2.7 percent, from 2000 to 2010, when population growth was higher. Figure 5 illustrates the number of households by tenure in the HMA for 2000, 2010, and the current date. The homeownership rate in the HMA declined from 78.8 percent in 2000 to 75.4 percent in 2010; however, the decline has accelerated since 2010, to a current rate of 71.8 percent, as the preference to rent rather than buy a home increases. The number of renter households increased an average of 3.6 percent annually from 2010 to a current estimate of 52,150, account-ing for nearly 79 percent of household growth during the period (Table DP-1 at the end of this report). By compari-son, the number of renter households increased 4.2 percent annually from 2000 to 2010 and accounted for 36 percent of household growth during the period. During the 3-year forecast period, the number of households is expected to increase by an average of 2,525, or 1.3 percent, as economic conditions strengthen and the rate of population growth increases slightly. Figure 6 shows population and household growth in the HMA from 2000 to the forecast date.
Figure 5. Number of Households by Tenure in the Port St. Lucie HMA, 2000 to Current
Note: The current date is January 1, 2016.Sources: 2000 and 2010—2000 Census and 2010 Census; current—estimates by analyst
Figure 6. Population and Household Growth in the Port St. Lucie HMA, 2000 to Forecast
Notes: The current date is January 1, 2016. The forecast date is January 1, 2019.Sources: 2000 and 2010—Bureau of Economic Business Research; current and forecast—estimates by analyst
2000 2010 Current
Renter Owner
140,000
120,000
100,000
80,000
60,000
40,000
20,000
0
Population Households
12,000
10,000
8,000
6,000
4,000
2,000
02000 to 2010 2010 to current Current to forecast
Ave
rage
ann
ual c
hang
e
Population and Households Continued

Po
rt
St.
Lu
cie
, F
L •
CO
MP
RE
HE
NS
IVE
HO
US
ING
MA
RK
ET
AN
ALY
SIS
7Housing Market Trends
Sales Market
Sales housing market conditions in the Port St. Lucie HMA are balanced, with an estimated vacancy rate of 2.2 percent, a decline from 4.2 percent in April 2010. Strong economic growth has contributed to increased demand for new and existing homes, significantly increasing traditional home sales and, at the same time, decreasing distressed home sales (real estate owned [REO] sales and short sales) because fewer homes are entering foreclosure or being sold for less than the amount owed. During 2015, sales of existing homes (includ-ing single-family homes, townhomes, and condominiums) totaled nearly 11,150, an increase of 1,300 homes, or 13 percent, from the previous year (CoreLogic, Inc., with adjustments by the analyst). Existing home sales were high from 2000 through 2005, during a period of strong job growth, averaging 21,500 homes sold annu-ally. In 2006, as job growth began to slow and mortgage lending standards became more restrictive, home sales declined nearly 50 percent, and they continued to decline annually, reaching a low of 5,075 homes sold in 2008. Home sales began to increase slightly in 2009, although sales levels remained below the previous high levels due, in part, to the housing crisis and slower household growth. From 2009 through 2014, home sales increased nearly 16 percent annually and averaged 7,200 homes sold per year. As a result of increasing demand, the average existing home sales price increased during the past year, to $205,400, an 8-percent increase from 2014. The average sales price peaked at $252,300 in 2006 and declined an average of 7 percent
annually from 2007 through 2011, to $166,400. Prices began to rebound in 2012 and increased an average of 5 percent annually from 2008 through 2014.
Distressed home sales in the HMA have slowed significantly in response to strengthening economic conditions. During 2015, the number of dis-tressed home sales declined to 2,525, a 34-percent decline from the 3,800 distressed sales during 2014 (Core-Logic, Inc., with adjustments by the analyst). Distressed sales accounted for nearly 17 percent of homes sold in 2015, down from 26 percent during the previous year. Distressed sales averaged 1,225 annually from 2006 through 2008, accounting for 16 percent of all sales, before peaking in 2009, when 5,300 home sales were distressed. Distressed home sales levels have fluctuated since 2009, with an average of 4,100 homes sold annually from 2009 through 2014. The average price of a distressed sale was $145,900 in 2015, up 16 percent from the previous year. Distressed sales prices averaged $196,500 in 2006 before declining to a low of $108,700 in 2009. Prices for distressed home sales increased 15 percent from 2009 through 2014. As of December 2015, 4.7 percent of home loans in HMA were seriously delinquent (90 or more days delinquent or in foreclosure) or had transitioned into REO status, down from 7.7 percent in December 2014. This rate is lower than the 5.3-percent state rate. The rate of seriously delinquent loans peaked in February 2010, when 21.3 percent of all home loans were seriously delinquent or had transitioned into REO status.

Po
rt
St.
Lu
cie
, F
L •
CO
MP
RE
HE
NS
IVE
HO
US
ING
MA
RK
ET
AN
ALY
SIS
8
New home sales in the Port St. Lucie HMA increased during the past year. The number of new homes sold (in cluding single-family homes, town-homes, and condominiums) totaled 1,025 during 2015, up by 110 homes, or 12 percent, from the previous year. New home sales increased annually from 2000 through 2005 and averaged 3,925 per year, peaking at 7,050 homes sold in 2005. Sales began to decline slightly in 2006 with the slowdown in job growth and declined nearly 16 percent annually from 2006 through 2011, averaging 1,950 homes sold a year. New home sales reached a low of 430 homes sold in 2011 before beginning to increase in 2012 as job growth increased significantly in the HMA. From 2012 through 2014, new home sales increased annually, aver-aging 700 homes sold each year. The average new home sales price was $317,000 in 2015, a 7-percent increase from 2014 and the highest average new home sales price since 2000. The previous peak occurred in 2007, when the average new home sales price was $312,900. Prices declined an average of 11 percent annually from 2008 through 2010 before increasing an average of 10 percent annually from
2011 through 2014, as the economy began to rebound from the economic downturn.
Builders responded to increasing home sales by expanding single-family homebuilding activity, as measured by the number of single-family homes permitted, during the past year. During 2015, permits were issued for nearly 1,100 single-family homes, up 50 homes, or 5 percent, from 2014 (preliminary data). From 2000 through 2005, single-family homebuilding increased by 27 percent annually in response to strong job growth (Figure 7). Permitting reached a peak in 2005, at more than 9,100 homes, as the HMA began to rebuild from Hur-ricanes Frances and Jeanne, which hit 3 weeks apart in 2004 and caused $16 million in damage in the Port St. Lucie HMA. As job growth slowed, permitting slowed to 5,575 homes in 2006, down nearly 39 percent from the previous year. Permitting declined 64 percent in 2007, to 2,000 homes, and remained low from 2008 through 2012, averaging 540 homes annually. Homebuilding activity increased in 2013 and 2014 as the economy improved, averaging 1,050 homes an-nually. Veranda Gardens is currently under construction in the city of Port St. Lucie. The 358-home subdivision has three-, four-, and five-bedroom single-family homes priced from $199,990 to $398,355. Completion is expected in spring 2016. Tradition has 11 neighborhoods, in clud ing 1 rental development, 4 of which have been completely built out. The remaining single-family home neighbor hoods are still partially undeveloped, with lots available for purchase.
During the next 3 years, demand is expected for an estimated 6,075 new
Figure 7. Single-Family Homes Permitted in the Port St. Lucie HMA, 2000 to Current
Notes: Includes townhomes. Current includes data through December 2015.Sources: U.S. Census Bureau, Building Permits Survey; estimates by analyst
Housing Market TrendsSales Market Continued
2000
2001
2002
2003
2004
2005
2006
10,000
9,000
8,000
7,000
6,000
5,000
4,000
3,000
2,000
1,000
0
2008
2009
2010
2011
2013
2015
2014
2012
2007

Po
rt
St.
Lu
cie
, F
L •
CO
MP
RE
HE
NS
IVE
HO
US
ING
MA
RK
ET
AN
ALY
SIS
9
homes in the HMA (Table 1). Nearly 67 percent of this demand is expected in St. Lucie County, with the remain-ing 33 percent expected in Martin County. Demand is expected to be
greatest in the $170,000-to-$249,000 price range. The relative affordability of the HMA is expected to continue to attract retirees, increasing home sales. Table 4 shows the estimated de-mand for market-rate sales housing by price range. The 520 homes currently under construction and a portion of the 27,000 other vacant units in the HMA that may reenter the market will satisfy some of the demand. Ap-proximately 20 percent of new homes should come on line during the first year of the 3-year forecast period, and production should increase during the second and third years to allow for the absorption of the homes currently under construction.
Table 4. Estimated Demand for New Market-Rate Sales Housing in the Port St. Lucie HMA During the Forecast Period
Price Range ($) Units of PercentFrom To Demand of Total
170,000 199,999 1,500 25.0200,000 249,999 1,500 25.0250,000 299,999 1,200 20.0300,000 349,999 600 10.0350,000 399,999 600 10.0400,000 499,999 300 5.0500,000 and higher 300 5.0
Notes: The 520 homes currently under construction and a portion of the estimat-ed 27,000 other vacant units in the HMA will likely satisfy some of the forecast demand. Demand for 45 mobile homes during the forecast period is excluded from this table. The forecast period is January 1, 2016, to January 1, 2019.Source: Estimates by analyst
Rental MarketRental housing market conditions are currently slightly soft in the Port St. Lucie HMA, with an estimated overall vacancy rate of 9.3 percent, down from 14.7 percent in April 2010 (Figure 8). Due to the seasonal nature of the HMA, many rental units are misclassified as vacant because they are seasonal housing units and not intended for long-term occupancy, resulting in elevated rental vacancy rates. Strict lending standards initiated
after the housing crisis increased the demand for rental units during the past 5 years, decreasing vacancy rates and increasing the average rent. Single-family homes comprise approximately 15 percent of the rental market. Apart ment market conditions in the HMA are currently tight as a result of demand outpacing new supply on the market. As of the fourth quarter of 2015, the apartment vacancy rate was 3.2 percent, down from 3.8 percent during the fourth quarter of 2014 and down from 13.8 percent during the first quarter of 2010 (Axiometrics Inc.). The average asking rent was $1,020, up 6 percent from the previous year.
Multifamily construction activity, as measured by the number of multi-family units permitted, picked up dur-ing the past 3 years as a response to increased rental demand but remains well below the prerecession level. During 2015, approximately 320
Figure 8. Rental Vacancy Rates in the Port St. Lucie HMA, 2000 to Current
Note: The current date is January 1, 2016.
Sources: 2000 and 2010—2000 Census and 2010 Census; current—estimates by analyst
Housing Market TrendsSales Market Continued
2000 Current2010
10.9
9.3
14.716.0
14.0
12.0
10.0
8.0
6.0
4.0
2.0
0.0

Po
rt
St.
Lu
cie
, F
L •
CO
MP
RE
HE
NS
IVE
HO
US
ING
MA
RK
ET
AN
ALY
SIS
10
units were permitted, down 30 units, or 8 percent, from 2014 (preliminary data). Less than 1 percent of all new multifamily construction during the past 8 years was for condominium units. Condominiums accounted for approximately 5 percent of multifam-ily construction from 2000 through 2007. From 2000 through 2005, multifamily construction increased 14 percent annually. Permitting dropped 50 percent in 2006 from the previous year as job growth declined signifi-cantly and declined each subsequent year to less than 60 units in 2012; an average of 340 units were permitted annually from 2006 through 2012. As the apartment market tightened, construction activity spiked in 2013 to more than five times the level reported in 2012 and averaged 330 units permitted annually in 2013 and 2014. Figure 9 shows the number of multifamily units permitted from 2000 to the current date.
The Atlantic at Tradition, the one rental neighborhood in Tradition, was completed in April 2015 in the city of Port St. Lucie. The 252-unit complex has one-, two-, and three-bedroom units starting at $1,134, $1,364, and $1,594, respectively. The 210-unit Grove Park Apartments are currently under construction in the city of Port St. Lucie. The property will consist of one-, two-, three-, and four-bedroom units scheduled to be complete in June 2016. Proposed asking rents have not yet been released. The growing retiree population is has also affected the rental market. Approximately eight properties with 830 apartments or assisted-living units for seniors are currently under construction or planning in the HMA.
During the 3-year forecast period, demand is expected for 2,325 new market-rate rental units in the HMA (Table 1). An estimated 52 percent of this demand is expected in St. Lucie County, with the remaining 48 percent expected in Martin County. The 290 units currently under construc-tion will satisfy some of the demand. Approximately 20 percent of the new units should come on line during the first year, and production should increase gradually during the second and third years of the forecast period to allow for absorption of the current units under construction. Table 5 shows the estimated demand by rent and number of bedrooms.
Figure 9. Multifamily Units Permitted in the Port St. Lucie HMA, 2000 to Current
Notes: Excludes townhomes. Current includes data through December 2015.Sources: U.S. Census Bureau, Building Permits Survey; estimates by analyst
Housing Market TrendsRental Market Continued
2000
2001
2002
2003
2004
2005
2006
1,800
1,600
1,400
1,200
1,000
800
600
400
200
0
2008
2009
2010
2011
2013
2015
2014
2012
2007

Po
rt
St.
Lu
cie
, F
L •
CO
MP
RE
HE
NS
IVE
HO
US
ING
MA
RK
ET
AN
ALY
SIS
11
Table 5. Estimated Demand for New Market-Rate Rental Housing in the Port St. Lucie HMA During the Forecast Period
One Bedroom Two Bedrooms Three or More Bedrooms
Monthly Gross Rent ($)
Units of Demand
Monthly Gross Rent ($)
Units of Demand
Monthly Gross Rent ($)
Units of Demand
1,100 to 1,299 210 1,200 to 1,399 300 1,300 to 1,499 901,300 to 1,499 110 1,400 to 1,599 580 1,500 to 1,699 451,500 to 1,699 110 1,600 or more 280 1,700 to 1,899 1301,700 to 1,899 190 1,900 or more 851,900 or more 190Total 810 Total 1,175 Total 350
Notes: Numbers may not add to totals because of rounding. Monthly rent does not include utilities or concessions. The 290 units currently under construction will likely satisfy some of the estimated demand. The forecast period is Janury 1, 2016, to Janury 1, 2019.Source: Estimates by analyst
Data Profile
Table DP-1. Port St. Lucie HMA Data Profile, 2000 to Current
Average Annual Change (%)
2000 2010 Current 2000 to 2010 2010 to Current
Total resident employment 136,376 170,447 186,700 2.3 1.8
Unemployment rate 5.1% 12.7% 6.0%
Nonfarm payroll jobs 102,600 121,600 135,600 1.7 2.2
Total population 321,237 424,677 440,000 2.8 0.6
Total households 132,221 172,422 184,750 2.7 1.2
Owner households 104,166 129,962 132,600 2.2 0.4
Percent owner 78.8% 75.4% 71.8%
Renter households 28,055 42,460 52,150 4.2 3.6
Percent renter 21.2% 24.6% 28.2%
Total housing units 156,733 215,160 220,100 3.2 0.4
Owner vacancy rate 2.3% 4.2% 2.2%
Rental vacancy rate 10.9% 14.7% 9.3%
Median Family Income $47,500 $59,600 $56,900 2.3 – 0.9
Notes: Numbers may not add to totals because of rounding. Employment data represent annual averages for 2000, 2010, and the 12 months through December 2015. Median Family Incomes are for 1999, 2009, and 2014. The current date is January 1, 2016.Sources: U.S. Census Bureau; U.S. Department of Housing and Urban Development; estimates by analyst
Housing Market TrendsRental Market Continued

Po
rt
St.
Lu
cie
, F
L •
CO
MP
RE
HE
NS
IVE
HO
US
ING
MA
RK
ET
AN
ALY
SIS
12
Data Definitions and Sources
2000: 4/1/2000—U.S. Decennial Census
2010: 4/1/2010—U.S. Decennial Census
Current date: 1/1/2016—Analyst’s estimates
Forecast period: 1/1/2016–1/1/2019—Analyst’s
estimates
The metropolitan statistical area definition in this
report is based on the delineations established by
the Office of Management and Budget (OMB) in
the OMB Bulletin dated February 28, 2013.
Demand: The demand estimates in the analysis
are not a forecast of building activity. They are
the estimates of the total housing production
needed to achieve a balanced market at the end
of the 3-year forecast period given conditions on
the as-of date of the analysis, growth, losses, and
excess vacancies. The estimates do not account
for units currently under construction or units in
the development pipeline.
Other Vacant Units: In the U.S. Department of
Housing and Urban Development’s (HUD’s)
analysis, other vacant units include all vacant
units that are not available for sale or for rent.
The term therefore includes units rented or sold
but not occupied; held for seasonal, recreational,
or occasional use; used by migrant workers; and
the category specified as “other” vacant by the
Census Bureau.
Building Permits: Building permits do not neces-
sarily reflect all residential building activity that
occurs in an HMA. Some units are constructed
or created without a building permit or are issued
a different type of building permit. For example,
some units classified as commercial structures are
not reflected in the residential building permits.
As a result, the analyst, through diligent fieldwork, makes
an estimate of this additional construction activity. Some
of these estimates are included in the discussions of
single-family and multifamily building permits.
For additional data pertaining to the housing market
for this HMA, go to huduser.gov/publications/pdf/
CMARtables_PortStLucieFL_16.pdf.
Contact Information
Robyn E. Bowen, Economist
Los Angeles HUD Field Office
213–534–2714
This analysis has been prepared for the assistance and
guidance of HUD in its operations. The factual informa-
tion, findings, and conclusions may also be useful to
builders, mortgagees, and others concerned with local
housing market conditions and trends. The analysis
does not purport to make determinations regarding the
acceptability of any mortgage insurance proposals that
may be under consideration by the Department.
The factual framework for this analysis follows the
guidelines and methods developed by HUD’s Economic
and Market Analysis Division. The analysis and findings
are as thorough and current as possible based on informa tion
available on the as-of date from local and national sources.
As such, findings or conclusions may be modified by sub-
sequent developments. HUD expresses its appreciation
to those industry sources and state and local government
officials who provided data and information on local
economic and housing market conditions.
For additional reports on other market areas, please go to huduser.gov/portal/ushmc/chma_archive.html.