Port of Los Angeles - JBAMorimoto-san)Jul24-2009.pdf · •Cruise •Fishing •Commercial/Retail...
36
Port of Los Angeles Japan Business Association July, 24, 2009
Transcript of Port of Los Angeles - JBAMorimoto-san)Jul24-2009.pdf · •Cruise •Fishing •Commercial/Retail...

Port of Los Angeles
Japan Business Association July, 24, 2009
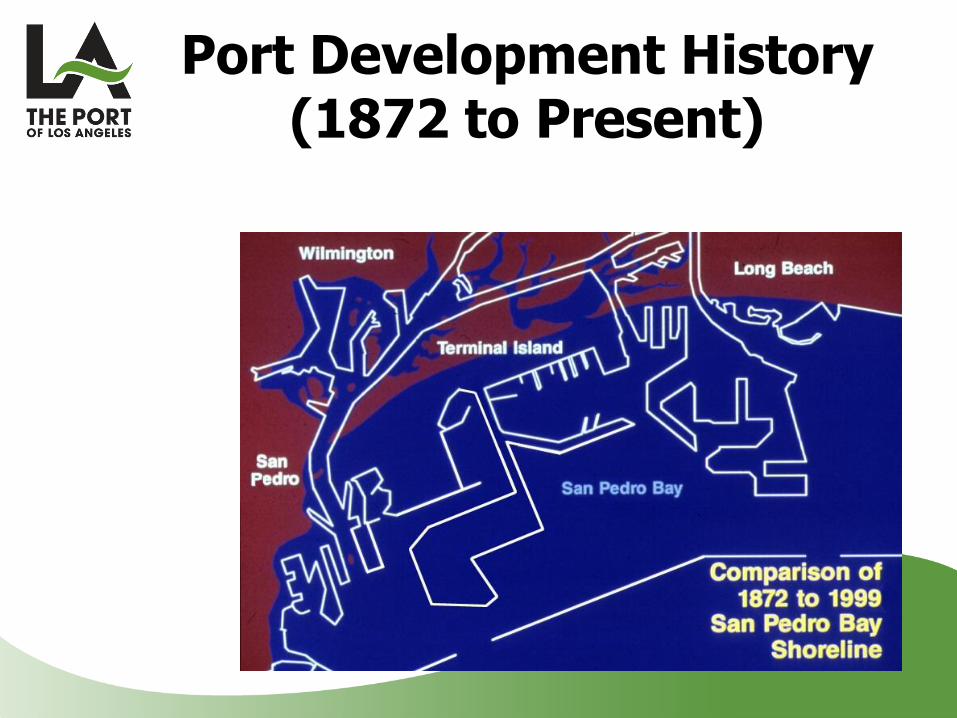
Port Development History(1872 to Present)

San Pedro Bay
APM – 484
APL – 292
Evergreen -205
YTI – 185
Vacant - 84
CSCL - 75
WBCT - 186
TRAPAC - 173
TTI - 375
Pier A - 170 Matson - 70
CUT - 108
LBCT - 102
ITS - 246
PCT - 256
CruiseCruise
Autos
Marinas
Liquid Bulk
Liquid Bulk
Pasha
SSA
Autos

• Founded in 1907
• Non-taxpayer supported
• 7,500 acres of land and water
• Annual container volume7.85 million TEUs (CY 2008) largestport in the nation
Port of Los Angeles

• Cruise
• Fishing
• Commercial/Retail
• Marinas
• Non-containerized cargo
• Container Cargo
Port of Los AngelesLand Use Diversity

Current Container
Terminal Area =
approx 1700 acres
Port of Los Angeles Container Terminals
APM Terminals
Maersk
APL / Eagle Marine
Evergreen / STS
YTI / NYK
TraPac / MOL
Yang Ming / WBCT
China Shipping
WBCT

1. Singapore 27,900
2. Shanghai 26,150
3. Hong Kong 23,880
4. Shenzhen 21,100
5. Busan 13,270
6. Rotterdam 10.790
7. Dubai 10.650
8. Kaohsiung 10,260
9. Hamburg 9,900
10. Qingdao 9,460
13. Los Angeles 7,850
15. Long Beach 6,488
*Los Angeles / Long Beach together rank
FIFTH in the world (15,7 million Teus)
Top World Ports
In TEUs, or Twenty-Foot Equivalent Units (000s)Calendar Year 2008
Top North American Ports
1. Los Angeles, CA 7,850
2. Long Beach, CA 6,488
3. New York/ New Jersey 5,236
4. Savannah 2.616
5. Oakland, CA 2,236
6. Vancouver, BC 2.154
7. Norfolk 2,083
8. Tacoma, WA 1,861
9. Houston 1,794
10. Seattle 1,704
Source: Containerisation Int.
L.A./ L.B.
2008 Top Container Ports
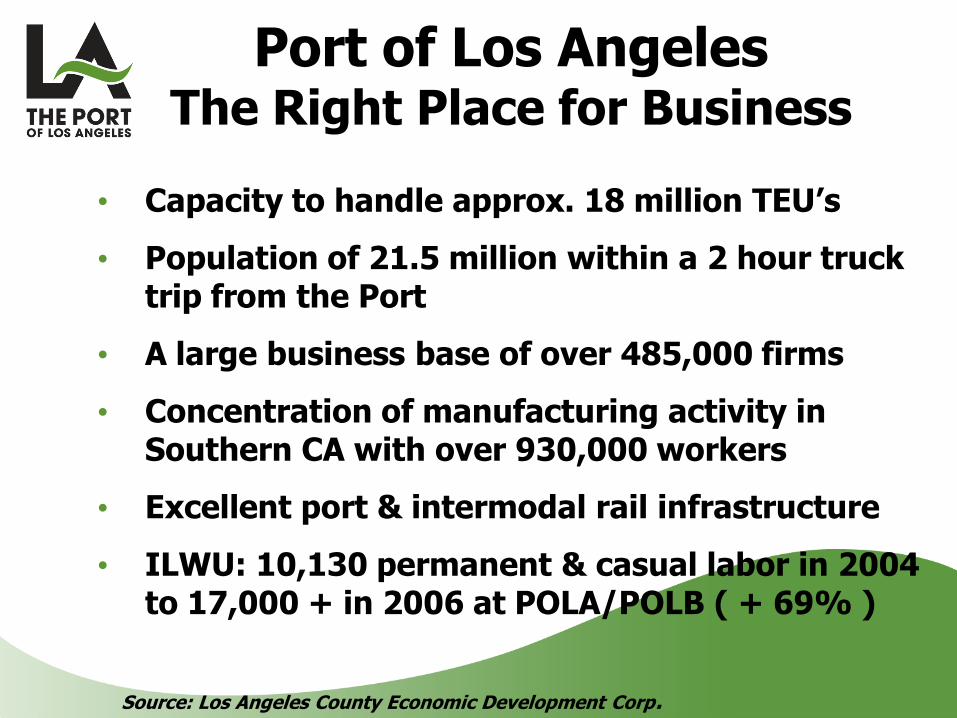
• Capacity to handle approx. 18 million TEU’s
• Population of 21.5 million within a 2 hour truck trip from the Port
• A large business base of over 485,000 firms
• Concentration of manufacturing activity in Southern CA with over 930,000 workers
• Excellent port & intermodal rail infrastructure
• ILWU: 10,130 permanent & casual labor in 2004 to 17,000 + in 2006 at POLA/POLB ( + 69% )
Source: Los Angeles County Economic Development Corp.
Port of Los AngelesThe Right Place for Business

Port of Los Angeles Top Trading Partners
(2007 Cargo Value)
• China/HK - $115.2 billion
• Japan - $39.2 billion
• Taiwan - $14.6 billion
• S. Korea - $9.7 billion
• Thailand - $6.9 billion

Port of Los Angeles
Containerized Cargo (CY 2008 in TEUs)
Top 5 Imports
Apparel/Footware 494,372
Furniture 415,273
Elect. /Computers 382,003
Auto Parts/Tires 309,740
General Cargo 131,784
TOTAL 1,423,432
Top 5 Exports
Wastepaper 243,360
Scrap Metal 183,096
Grain/Soybeans 138,942
Cotton 117,486
Pet & Animal Feed 77,448
TOTAL 760,332

San Pedro Bay Volumes
Source: Port of L.A. , Port of Long Beach, Global Insight and the Tioga Group

POLA Marketshare(inbound loaded containers)


1
2
3
4
5
56 7
8
9
10
How POLA Will Support Growth
1. TRAPAC - +60 acres
2. Yang Ming - +30 acres
3. China Shipping - +30 acres
4. Evergreen - +55 acres
5. PASHA
6. Valero
7. Berths 206-209
8. YTI - +80 acres
9. APL - +40 acres
10. Plains All American (Pacific
Energy)
11. ICTF modernization and new
BNSF Rail yard
After container terminal expansion Port can handle up to 21.5 million
TEUs
11

Infrastructure Improvements

1986 – SPRR/UPRR ICTF
1997 – TICTF (NYK/Ever Green) and APL
1999 – West Basin Container Terminal
(YML/China Shipping)
2002 – APM Terminals
(Maersk Line)
2012 – New on-dock rail for TRAPAC (MOL)
UPRR modernization plans
On/Near Dock Rail Facilities

DAS
PST
Non-Container Terminals

DAS
PST
Steel Products: 2.2 Million MT
Fruit: 135,919 MT
Auto: 151,584 Cars
Liquid Bulk: 10.6 Million MT
Cement: 142,240 MT
Metal Scrap: 1.07 Million MT
Non-Container Terminals

865,000 passengers
165 ship calls in 2008
Capacity for up to 3 Cruise vessels
Princess Cruises, Royal Caribbean, Celebrity Cruises, Crystal Cruises, Cunard Line, Holland America, Norwegian Cruise Line, Radisson and Seven Seas
San Pedro Waterfront Project proposes expansion of cruise operations to outer harbor.
Cruise Center Operations

• Close to 900,000 regional jobs
• Over 3.3 million jobs nationally
• $72.7 billion trade value, regional
• $298+ billion trade value, nationally
• 44% of all waterborne import
• $7.8 billion in regional taxes
Economic ImpactSan Pedro Bay Ports

Air Quality

Port Emission Sources

• Five-Year Action Plan
• Joint Port Initiative
• Pollution-Reduction Targets:
Diesel Particulate Matter by 47%
Nitrogen Oxide (NOx) by 45%
Sulfur Oxides (Sox) by 52%
• $2+ billion program
Our Solution.San Pedro Bay
Clean Air Action Plan
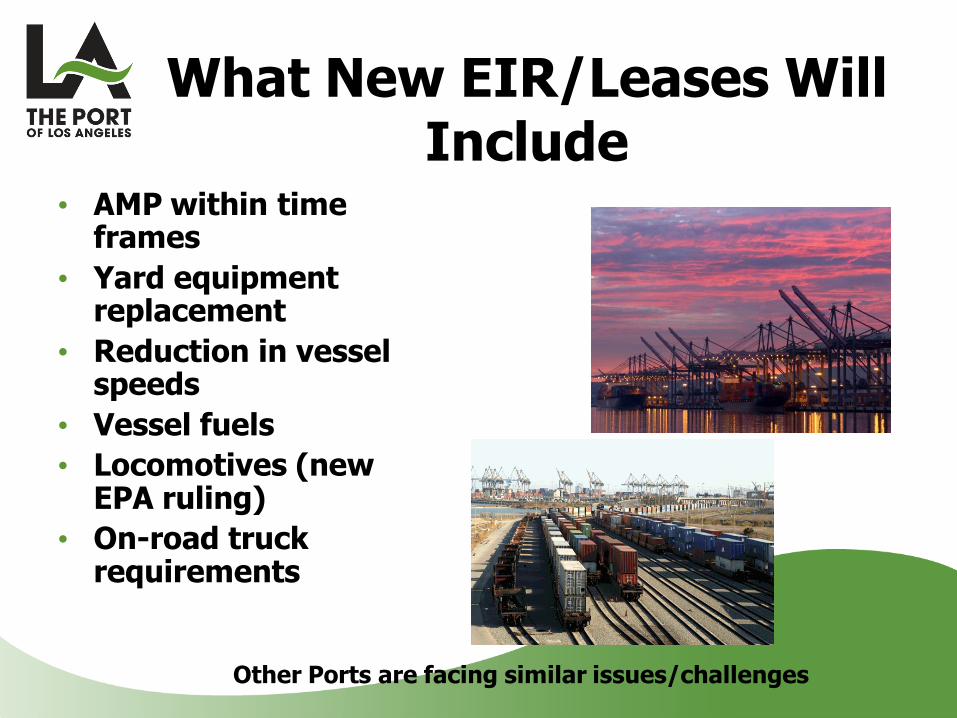
What New EIR/Leases Will Include
• AMP within time frames
• Yard equipment replacement
• Reduction in vessel speeds
• Vessel fuels
• Locomotives (new EPA ruling)
• On-road truck requirements
Other Ports are facing similar issues/challenges

Clean Trucks Program
• Reduction of 80% truck emissions
• Replacing 16,800 trucks by 2012
• Pre-1989 engine model year trucks banned on October 1, 2008
• Jan 1, 2010: prohibit entry to all trucks with MY1989-1993 engines.
• MY1994-2003 truck need retrofitted with an approved emission controls.
• Jan 1, 2012: Prohibit entry to all trucks with engines that do not meet 2007 EPA emission standards
• $35/TEU fee truck replacement

Where are we today?
• In the depths of a global recession.
• U.S. GDP projected to decline 3.9% in 2009.
• Longest Postwar Recession (previous record: 16 months in 1981-82).
• Unemployment to rise above 10%.

Port of Los AngelesVolume Since January 2008
0
100,000
200,000
300,000
400,000
500,000
600,000
700,000
800,000
Jan-
08
Feb-
08
Mar-
08
Apr-08 May-
08
Jun-
08
Jul-08 Aug-
08
Sep-
08
Oct-08 Nov-
08
Dec-
08
Jan-
09
Feb-
09
Mar-
09
Apr-09

All U.S. West Coast Portsare impacted
2009 1st
Quarter2008 1st
QuarterChange % Change
Los Angeles 1,527,402 1,849,885 -322,483 -17.43%
Long Beach 1,091,468 1,549,055 -457,587 -29.54%
Vancouver 435,009 529,784 -94,776 -17.89%
Oakland 459,865 545,733 -85,868 -15.73%
Tacoma 379,174 444,383 -65,209 -14.67%
Seattle 329,275 431,101 -101,826 -23.62%
Portland 45,589 65,565 -16,976 -25.89%
Total 4,270,781 5,415,506 -1,144,725 -21.14%

Economic Effects to the Shipping Lines
• Revenue declining – ocean freight rates under $1000 per 40’ (last year over $2000)
• Industry lay offs
• Vessel re-deployments
• No new container vessel orders
• Vessels sitting idle:
October 2008: 70 vessels or 150,000 TEU
July 20, 2009: 520 vessels or 1.28 million TEUs (10% of world’s containership fleet)

Is there any good news at all?
• By the end of 2009, most of the contractionary forces will have reversed and the various stimulus measures will begin to work.
• The average quarterly growth for 2010 is predicted to be 2.7%, and a more robust 4.1% in 2011.
• Imports go from being down 14.3% in 2009 to increasing 4.2% in 2010 and 7.3% in 2011.
• Consumer spending doesn’t return to bubble-era levels, but does increase - the savings rate of 6% will fall back to 4% in 2010 and 3% in 2011.(Predictions courtesy of the UCLA Anderson Forecast, March 2009)

What is the Port Doing now?
• Working with customers to offer incentives to keep cargo flowing.
• Delaying infrastructure fees.
• Supplemental space assignment at lower rates
• Going after stimulus dollars to help support job-creating port improvement projects.
• Terminal expansions for the future

The Future is Now!

Thank you!