Population statistics at regional level Statistics...
26
Population statistics at regional level Statistics Explained Source : Statistics Explained (http://ec.europa.eu/eurostat/statisticsexplained/) - 20/09/2017 1 Data extracted in March 2017. Most recent data: Further Eurostat information, Main tables and Database . Planned article update: September 2018. Maps can be explored interactively using Eurostat’s Statistical Atlas (see user manual ). This article forms part of Eurostat ’s annual flagship publication, the Eurostat regional yearbook . There are considerable differences in regional demographic patterns across the European Union (EU) from overcrowded, dynamic, metropolises which may have relatively youthful populations to more remote, rural regions that may have declining population numbers and poor access to a range of services. Statistics on regional demography are one of the few areas where detailed NUTS level 3 data are collected and published for each of the EU Member States, EFTA and candidate countries. At the time of writing, the latest information is available for vital demographic events (live births and deaths ) and a range of demographic indicators up to 2015, with statistics on the size and structure of the population available through to 1 January 2016. Main statistical findings • On average, a baby born in the EU-28 in 2015 could expect to live 80.6 years. • Net migration to the EU-28 in 2015 was 1.9 million: this was the highest level recorded since records began in 1961. A majority of the regions with the highest rates of net migration were situated in Germany, reflecting the large number of asylum seekers and refugees arriving during 2015. • The highest crude birth rate across the NUTS level 2 regions of the EU was recorded in the overseas French region of Mayotte (38.9 births per 1 000 inhabitants); this figure was more than six times as high as the lowest birth rate (6.2 births per 1 000 inhabitants) which was recorded in the northern Spanish region of Principado de Asturias. • The average age of women at childbirth peaked in Inner London - West at 33.5 years, suggesting that in this capital city region there was a growing number of women who chose to delay childbirth in order to be able to continue participating in further education and/or to establish themselves professionally within their chosen career. • 2015 was the first year on record when there were more deaths than live births in the EU-28. There were 5.22 million deaths in 2015, the highest number recorded since records began in 1961; the number of deaths rose by 5.7 % when compared with 2014, reflecting the growing number of elderly people in the EU’s population. This article presents demographic developments across the EU; it provides a picture of vital demographic events from the cradle to the grave, contrasting time series with the latest information available. The average pop- ulation of the EU-28 increased each and every year between 1961 and 2010. After falling by 282 thousand inhabitants in 2011 (which may be attributed to the revision of population statistics for Germany following the 2011 census), the upward pattern of population growth resumed and by 2015 there were 509.4 million inhabi- tants living in the EU-28 (see Figure 1). The average population of the EU-28 rose by 97.7 million inhabitants between 1961 and 2015, equivalent to an average increase of 0.4 % per annum. Historically, overall population growth in the EU has largely reflected developments in natural population change (the total number of births minus the total number of deaths), with a relatively minor role being played by migratory patterns. A closer examination shows that natural population increase in the EU was considerably
Transcript of Population statistics at regional level Statistics...
Population statistics atregional level Statistics Explained
Source Statistics Explained (httpeceuropaeueurostatstatisticsexplained) - 20092017 1
Data extracted in March 2017 Most recent data Further Eurostat information Main tables and Database Planned article update September 2018
Maps can be explored interactively using Eurostatrsquos Statistical Atlas (see user manual )
This article forms part of Eurostat rsquos annual flagship publication the Eurostat regional yearbook There areconsiderable differences in regional demographic patterns across the European Union (EU) from overcrowdeddynamic metropolises which may have relatively youthful populations to more remote rural regions that mayhave declining population numbers and poor access to a range of services Statistics on regional demography areone of the few areas where detailed NUTS level 3 data are collected and published for each of the EU MemberStates EFTA and candidate countries At the time of writing the latest information is available for vitaldemographic events (live births and deaths ) and a range of demographic indicators up to 2015 with statisticson the size and structure of the population available through to 1 January 2016
Main statistical findingsbull On average a baby born in the EU-28 in 2015 could expect to live 806 years
bull Net migration to the EU-28 in 2015 was 19 million this was the highest level recorded since recordsbegan in 1961 A majority of the regions with the highest rates of net migration were situated in Germanyreflecting the large number of asylum seekers and refugees arriving during 2015
bull The highest crude birth rate across the NUTS level 2 regions of the EU was recorded in the overseasFrench region of Mayotte (389 births per 1 000 inhabitants) this figure was more than six times as highas the lowest birth rate (62 births per 1 000 inhabitants) which was recorded in the northern Spanishregion of Principado de Asturias
bull The average age of women at childbirth peaked in Inner London - West at 335 years suggesting that inthis capital city region there was a growing number of women who chose to delay childbirth in order tobe able to continue participating in further education andor to establish themselves professionally withintheir chosen career
bull 2015 was the first year on record when there were more deaths than live births in the EU-28 Therewere 522 million deaths in 2015 the highest number recorded since records began in 1961 the numberof deaths rose by 57 when compared with 2014 reflecting the growing number of elderly people in theEUrsquos population
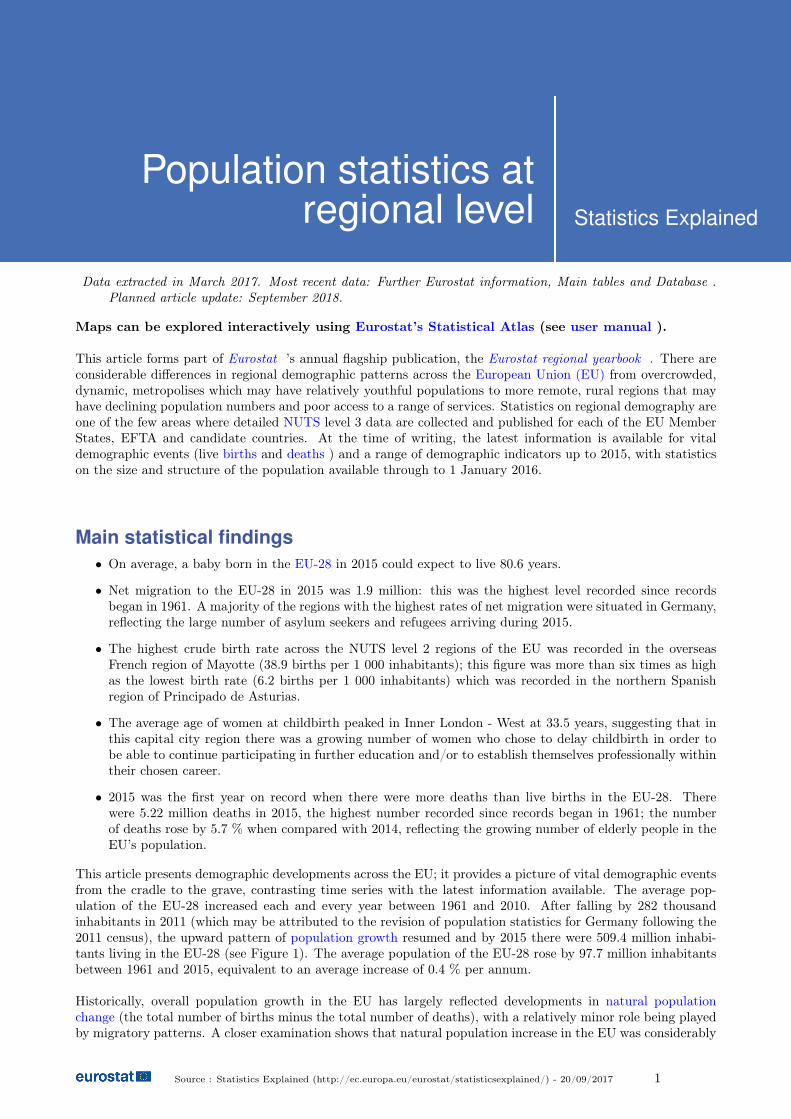
This article presents demographic developments across the EU it provides a picture of vital demographic eventsfrom the cradle to the grave contrasting time series with the latest information available The average pop-ulation of the EU-28 increased each and every year between 1961 and 2010 After falling by 282 thousandinhabitants in 2011 (which may be attributed to the revision of population statistics for Germany following the2011 census) the upward pattern of population growth resumed and by 2015 there were 5094 million inhabi-tants living in the EU-28 (see Figure 1) The average population of the EU-28 rose by 977 million inhabitantsbetween 1961 and 2015 equivalent to an average increase of 04 per annum
Historically overall population growth in the EU has largely reflected developments in natural populationchange (the total number of births minus the total number of deaths) with a relatively minor role being playedby migratory patterns A closer examination shows that natural population increase in the EU was considerably
higher in the 1960s than it is today From the 1970s onwards the rate of natural population growth started toslow both as a result of lower numbers of live births and increasing numbers of deaths By 2015 despite theconsiderably higher number of inhabitants in the EU-28 (compared with 1961) there were 25 million fewer livebirths by contrast the number of deaths had risen by 11 million when compared with 1961 Indeed 2015 wasthe first year on record (for an EU-28 time series) that the natural change in population was negative as thenumber of deaths exceeded the number of live births by 117 thousand
Since many of the EU Member States do not have accurate figures on immigration and emigration net migra-tion (the difference between immigration and emigration) often has to be estimated this is usually done byanalysing the difference between the total population change and the natural change each year Net migration(including statistical adjustment) was broadly balanced in the EU-28 during the period from the 1960s to the1980s with both positive and negative changes as such the impact of net migration on the overall changes inpopulation numbers during this period was relatively weak Since the start of the 1990s a pattern of highernumbers of migrants entering the EU has emerged Some of the peaks for net migration that are visible inFigure 1 may be associated with a range of international migration and refugee crises and resulting displacedpersons for example former Yugoslavia during the 1990s Afghanistan and Iraq in the early 2000s or Syriamore recently While natural population change was responsible for most of the population change in the EUduring the 1960s and 1970s this pattern slowly diminished as the difference between the number of births anddeaths gradually narrowed By 1992 the impact of net migration on total population change outweighed thatof natural population change and thereafter became the primary factor for explaining overall population changeas the number of births and deaths in the EU-28 became broadly balanced
Figure 1 Population change EU-28 1961ndash2015(millions)Source Eurostat (demogind)
Population statistics at regional level 2
Life expectancy
Life expectancy at birth has historically risen with increased longevity attributed to a range of factors includingimproved socio-economic and environmental conditions or better medical treatment and care During the periodfrom 2003 to 2014 life expectancy in the EU-28 increased by 32 years rising from an initial value of 777 yearsHowever 2015 was the first year since an EU-28 time series began in 2003 that there was a reduction as lifeexpectancy fell by 03 years to an average of 806 years Life expectancy in the EU ranged from a highof 845 years in the Spanish capital region down to 735 regions in the north-western Bulgarianregion of Severozapaden mdash a difference of 11 years
Map 1 presents life expectancy at birth for NUTS level 2 regions detailing the average (mean) number ofyears that a new born child could expect to live if subjected throughout hisher life to current mortality con-ditions In 2015 there were 21 NUTS level 2 regions where life expectancy at birth was 83 years or more (asshown by the darkest shade of yellow in Map 1) these were principally located in a band that ran from centralthrough northern Spain (eight regions) into southern France (three regions) and across to northern and centralregions of Italy (also eight regions) The only two exceptions located outside of this band were the capital cityregions Icircle de France (France) and Inner London - West (the United Kingdom) The highest life expectancyin the EU-28 among NUTS level 2 regions was recorded in another capital city region namely Comunidad deMadrid (845 years) the Spanish capital city region
At the other end of the range there were 42 NUTS level 2 regions where average life expectancy in 2015was less than 78 years (as shown by the lightest shade of yellow in Map 1) These regions were predominantlylocated in the eastern regions of the EU including all six regions from Bulgaria all seven regions from Hungaryand all eight regions from Romania as well as three out of four regions from Slovakia 11 out of 16 regionsfrom Poland one out of two regions from Croatia and two out of eight regions from the Czech Republic Two
Population statistics at regional level 3
of the three Baltic Member States Latvia and Lithuania (both single regions at this level of detail) and theoutermost regions of Mayotte (France) and Regiatildeo Autoacutenoma dos Accedilores (Portugal) were the only other EUregions where average life expectancy at birth was below 78 years The lowest life expectancy at birth in 2015was recorded in the north-western Bulgarian region of Severozapaden at 735 years As such the difference inlife expectancy between Severozapaden and Comunidad de Madrid was 11 years
Population statistics at regional level 4
Map 1 Life expectancy at birth by NUTS 2 regions 2015(years)Source Eurostat (demormlif-exp) and (demomlexpec)
Population statistics at regional level 5
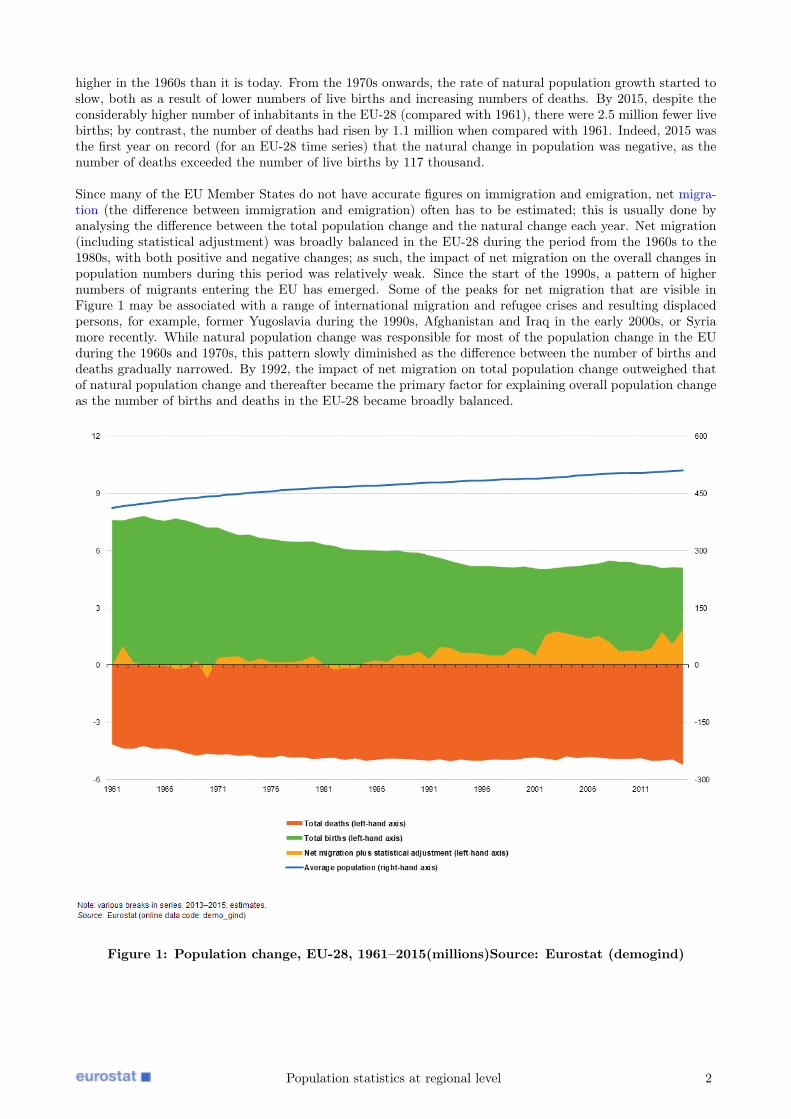
The largest gender gap for life expectancy was recorded in Lithuania mdash life expectancy was 105years higher for women than for men
It is important to note that while Map 1 presents information for the whole population there remain con-siderable differences in life expectancy between the sexes mdash despite evidence showing that this gender gap hasbeen gradually closing in most of the EU Member States In the EU-28 life expectancy at birth of women (833years in 2015) was on average 54 years higher than the corresponding figure for men (779 years)
Figure 2 illustrates this gap between the sexes for life expectancy for NUTS level 2 regions the biggest gapswhere women were likely on average to live more than 80 years longer than men were all concentrated inthe north-eastern corner of the EU within the three Baltic Member States (all single regions at this level ofdetail) and eight Polish regions In most of the EU Member States there was usually quite a narrow range whenanalysing the highest and lowest regional gender gaps However there were wider regional differences in threeof the Member States largely attributable to a single outlier for example there was a relatively large gap inlife expectancy between the sexes across the vast majority of regions in Spain France and Finland aside fromthe territory of Ciudad Autoacutenoma de Melilla (Spain) the overseas region of Mayotte (France) or the islandregion of Aringland (Finland) where the gender gap was much smaller
Figure 2 Gender gap for life expectancy at birth by NUTS 2 regions 2015(difference in yearsbetween the life expectancy of females and males)Source Eurostat (demormlifexp) and (demom-lexpec)
Population statistics at regional level 6
Median ageWith life expectancy at birth rising for successive generations and with historically low fertility rates it is notsurprising to find that the median age of the EU-28rsquos population continued to increase in recent years It roseby 28 years during the most recent decade for which data are available reaching 426 years on 1 January 2016Figure 3 shows that the median age ranged between 367 years in Ireland and 457 years in Germany suggestingrelatively young and relatively old population structures in these EU Member States The median age rose inevery one of the Member States during the period between 1 January 2006 and 1 January 2016 with increasesof more than 40 years recorded in Romania Lithuania Greece and Portugal while the smallest rises wereregistered in Luxembourg (10 year) and Sweden (06 years)
The median age in the central Greek region of Evrytania was 536 years which was slightlymore than three times as high as in the French overseas region of Mayotte
The highest median age among any of the NUTS level 3 regions was recorded in the central Greek regionof Evrytania (536 years) where the population declined by more than 10 in 2015 in part due to a relativelyhigh net outward migration By contrast the lowest median age (178 years) among NUTS level 3 regions wasrecorded in the overseas French region of Mayotte which also had the lowest life expectancy at birth (765years) among French regions at NUTS level 2 note the geographical coverage of Mayotte is identical at NUTSlevels 2 and 3
An analysis for capital city regions mdash again based on NUTS level 3 mdash shows that these regions usually recordeda median age that was below their respective national average There were three exceptions to this rule amongthe EU Member States in Poland and Slovakia the median age of the population living in Miasto Warszawa(410 years) and in Bratislavskyacute kraj (399 years) was some 11 years and 05 years higher than the respectivenational average the median age in three of the four Greek capital city regions (Dytikos Tomeas Athinon wasthe exception) was also higher than the national average By contrast the lowest (or joint lowest) median ageswere recorded in the capital city regions of 10 EU Member States Among these the largest gaps (in years)between the median age for the capital city region and the national average were recorded for the Danish capitalcity region Byen Koslashbenhavn (where the median age was 76 years lower than the national average) the Belgiancapital city region Arr de Bruxelles-CapitaleArr van Brussel-Hoofdstad (59 years lower) and the Bulgariancapital city region Sofia stolitsa (41 years lower) In those cases where the capital city region did not recordthe lowest median age it was often the case that the lowest median was registered by a region characterisedby its relatively high number of university students for example Heidelberg Stadtkreis in Germany OverigGroningen in the Netherlands Gdanski in Poland or Manchester in the United Kingdom
Population statistics at regional level 7
Figure 3 Median age of the population by NUTS 3 regions 1 January 2016(years)SourceEurostat (demorpjanind3) and (demopjanind)
Population changeThe EU-28rsquos population increased each and every year between 1 January 1960 and 1 January 2016 withthe exception of 2011 (as noted above the reduction in 2011 may be attributed to the revision of populationstatistics in Germany following the census) during these 56 years the total number of inhabitants living in theEU-28 rose by 1036 million There are wide-ranging differences in patterns of demographic change across theEU some of the most common medium-term developments may be summarised as follows
bull a capital region effect as populations continue to expand in and around many capital cities which ex-ert a rsquopull effectrsquo on national and international migrants associated with (perceived) education andoremployment opportunities
bull an urbanndashrural split with the majority of urban regions continuing to report population growth whilethe number of persons resident in many peripheral rural and post-industrial regions declines
bull a northndashsouth split between EU Member States with a high proportion of the population in northernMember States being single and living alone whereas Mediterranean regions are often characterised bylower birth rates but a more important role for family units
bull regional divergences within individual EU Member States which may impact on regional competitivenessand cohesion for example between the eastern and the western regions of Germany or between northernand southern regions of Belgium Italy and the United Kingdom
Population statistics at regional level 8
These general patterns were to some degree overtaken by events in 2015 as a result of very large numbers ofasylum seekers and refugees arriving in and moving within the EU The majority came from the Middle East orsub-Saharan Africa either crossing the Mediterranean or making the journey northwards by land and passingfrom the Balkans into the EU The impact of this mass movement of people was considerable and is reflectedin the statistics presented below
Map 2 presents the crude rate of total population change in 2015 the overall change in population is composedof two different effects natural population change (the difference between births and deaths) and net migration(plus statistical adjustment) mdash see the box below for more details Between 1 January 2015 and 1 January2016 the population of the EU-28 rose by 18 million inhabitants equivalent to a growth rate of 35 per 1 000inhabitants Among the 1 342 NUTS level 3 regions shown in Map 2 a considerable majority (835) reportedan increase in their overall number of inhabitants while there were 505 regions that recorded a decline in pop-ulation numbers leaving two regions with no change
Measuring population change Population change may be defined as the difference in the size of apopulation between the end and the beginning of a given time period (usually one year) more specifically thisperiod is usually the difference in population size on 1 January of two consecutive years
Population change has two components
bull natural population change (the number of live births minus the number of deaths)
bull net migration (the number of immigrants minus the number of emigrants) plus statistical adjustment itshould be noted that net migration as referred to in the context of population change statistics includesthe statistical adjustments occurring in the annual balance of the population and that it serves the purposeof closing this balance
A positive population change when the result of net migration plus live births minus deaths is positiveis referred to as population growth (or a population increase) whereas a negative change is referred to aspopulation decline (or a population decrease)
The crude rate of population change is the ratio of total population change during the year to the av-erage population for the year in question this value is expressed per 1 000 inhabitants
The fastest rate of overall population growth within the EU was recorded in Trier Kreisfreie Stadt(western Germany) its total number of inhabitants rose by 58 in 2015
In 2015 the fastest expanding populations were often concentrated in Germany or Austria while there wasalso relatively high population growth in the south-eastern corner of the United Kingdom the southern regionsof the Nordic Member States as well as several regions in Belgium France and Luxembourg (a single regionat the this level of detail) More specifically the darkest shade of blue in Map 2 shows the 243 NUTS level 3regions where the population grew on average by at least 12 per 1 000 inhabitants during 2015 these included51 regions where population growth was at least 20 per 1 000 inhabitants (or 20 ) The majority (35) ofthese were located in Germany while there were 10 regions from the United Kingdom (seven of which were inLondon the other three were Coventry Central Bedfordshire and Manchester) two regions from Austria (theurban regions of Innsbruck and Wien) and a single region from each of Belgium (Arr Bastogne) France (theoverseas region of Mayotte) Luxembourg (a single region at this level of detail) and Romania (Ilfov whichsurrounds the capital city region Bucuresti)
There were only five regions in the EU-28 where the population grew by at least 40 per 1 000 inhabitantsin 2015 The highest crude rates of population growth were recorded in two German regions Trier KreisfreieStadt (58 per 1 000 inhabitants) in the west and Schwerin Kreisfreie Stadt (49 per 1 000 inhabitants) in thenorth and three regions from London Tower Hamlets in the east of the city (55 per 1 000 inhabitants) andWestminster (46 per 1 000 inhabitants) and Camden amp City of London (42 per 1 000 inhabitants) in centralLondon A closer analysis reveals that the vast majority of the growth in population numbers in all five of theseregions could be attributed to net migration (as opposed to natural population growth) Indeed in the twoGerman regions the natural rate of population change was negative in other words there were more deathsthan births
The most rapid reductions in population were registered in the Baltic Member States as well as some ofthe more rural andor sparsely populated eastern and southernmost regions of the EU There were 81 regions
Population statistics at regional level 9
where the crude rate of total population change in 2015 was -10 per 1 000 inhabitants or less These included7 out of the 11 regions in Lithuania (the other four also recorded negative rates) four out of six regions inLatvia (the other two also recorded negative rates) slightly more than half of the Bulgarian (16 out of 28) andCroatian (11 out of 21) regions as well as 11 regions from Romania 10 regions from Spain seven regions eachfrom Greece and Portugal four regions from Hungary two regions from Estonia and a single region each fromFinland (Kainuu) and the United Kingdom (Blackpool)
Population statistics at regional level 10
Map 2 Crude rate of total population change by NUTS 3 regions 2015(per 1 000 inhabi-tants)Source Eurostat (demorgind3) and (demogind)
Population statistics at regional level 11
There were 12 million migrant arrivals in Germany
As noted above the overall change in population numbers in 2015 was impacted upon by atypical patternsof net migration The information presented in Map 3 concerns crude rates of net migration and is based on thetotal number of people migrating into each region from other regions of the same Member State from other re-gions in different EU Member States or from non-member countries outside the EU The distribution of regionsin Map 3 is quite similar to the distribution for the crude rate of total population change (Map 2) underliningthe fact that migratory patterns were often the principal factor in determining overall population change in 2015
The highest crude rates of net migration were recorded in the two German regions of Trier Kreisfreie Stadt andSchwerin Kreisfreie Stadt Alongside these there were numerous other German regions that had very high cruderates of net migration in 2015 a pattern that could be associated with the dramatic influx of asylum seekers andrefugees principally from the Middle East or the Balkans The considerable influx of migrants into Germanyduring 2015 (net arrivals of 12 million) was broadly distributed across the whole of the German territory asjust six of the 402 NUTS level 3 German regions recorded a crude rate of net migration that was below theEU-28 average
The regions with the highest crude rates of net migration were often those that also appeared at the topof the ranking for total population change as natural population change was often close to being balancedAside from the two German and three London regions mentioned above the remainder of the top 10 were alsoGerman regions (Bremerhaven Kreisfreie Stadt Luumlchow-Dannenberg Osnabruumlck Kreisfreie Stadt HeidekreisAnsbach Kreisfreie Stadt) Looking in more detail there were 302 regions where the crude rate of net migrationwas at least 12 per 1 000 inhabitants (as shown by the darkest shade in Map 3) the vast majority (264) ofthese were located in Germany Those regions with some of the highest rates were often characterised by thepresence of migrant reception centres andor refugee shelters
There were 416 NUTS level 3 regions in the EU-28 where net migration in 2015 was negative (in other wordswhere more people left a region than arrived in it) and in 65 of these the crude rate was less than -60 per1 000 inhabitants These regions were predominantly located across the Baltic Member States eastern andsouthernmost regions of the EU Among the exceptions was the EU region with the most rapid reduction in itspopulation as a result of net migration namely the sparsely-populated and heavily-forested Finnish region ofKainuu (which borders onto Russia) where the crude rate of net migration was -46 per 1 000 inhabitants
Population statistics at regional level 12
Map 3 Crude rate of net migration (plus statistical adjustment) by NUTS 3 regions 2015(per1 000 inhabitants)Source Eurostat (demorgind3) and (demogind)
Population statistics at regional level 13
Although an analysis of regional population changes supports the view that the leading factor affecting pop-ulation changes in 2015 was net migration there were some EU regions where natural change also played animportant role Aside from the overseas French regions of Mayotte (36 per 1 000 inhabitants) and Guyane (23per 1 000 inhabitants) the highest rates of natural population growth were recorded in the eastern Londonregions of Hackney amp Newham (14 per 1 000 inhabitants) and Tower Hamlets (12 per 1 000 inhabitants) andthe north-eastern Parisian suburbs of Seine-Saint-Denis (13 per 1 000 inhabitants)
At the other end of the range it is interesting to note that in 2015 the number of live births was lowerthan the number of deaths in a majority of the NUTS level 3 regions of the EU This pattern was particularlyprevalent across many rural and sparsely populated regions that were characterised by population age structuresskewed in favour of older generations The biggest decline in the crude rate of natural population change wasrecorded in the north-western Bulgarian region of Vidin (-16 per 1 000 inhabitants) while six additional regionsfrom Bulgaria (principally from the north-west) as well as two regions from the Portuguese interior and singleregions from Germany Greece Croatia Lithuania and Romania also recorded double-digit negative rates
Birth and fertility ratesThis section presents information on crude birth rates (the ratio of the number of births to the average pop-ulation expressed per 1 000 inhabitants) the average (mean) age of women at childbirth and fertility rates(the mean number of children born per woman) One of the main reasons why there has been a slowdown inEU population growth is that women are on average having fewer children such historically low fertility rateshave also impacted on the gradual ageing of the EUrsquos population structure
The EU-28 crude birth rate was 100 births per 1 000 inhabitants in 2015 Across the EU Member Statesthis rate peaked at 140 births per 1 000 inhabitants in Ireland and was also relatively high in France (120births) the United Kingdom (119 births) and Sweden (117 births) At the other end of the range the crudebirth rate was 100 births per 1 000 inhabitants or lower across many eastern (Bulgaria Croatia HungaryPoland Romania and Slovenia) and southern regions (Greece Spain Italy Malta and Portugal) as well as inGermany and Austria
The lowest crude birth rate was recorded in the northern Spanish region of the Principadode Asturias
Figure 4 shows crude birth rates for NUTS level 2 regions in 2015 Some EU Member States reported veryhomogeneous regional crude birth rates for example in the Czech Republic Hungary Bulgaria and PolandOthers were more heterogeneous often because of just one or a few regions with particularly high rates this wasthe case in the three French overseas regions of Mayotte (389 births per 1 000 inhabitants) Guyane (262) andLa Reacuteunion (165) as well as the Spanish territory of Ciudad Autoacutenoma de Melilla (178) They were followedby a number of capital city regions and regions within close proximity of capitals for example Inner London- East and Outer London - East (both 157) the Reacutegion de Bruxelles-CapitaleBrussels Hoofdstedelijk Gewest(154) Outer London - West and North West (149) Icircle de France (148) Southern and Eastern Ireland (143)Outer London - South (143) Furthermore one Irish region five more regions from the United Kingdom aswell as the Swedish capital city region Stockholm recorded rates of 130ndash140 births per 1 000 inhabitants Itis interesting to note that in all of the multi-regional EU Member States the crude birth rate for the capitalcity region was at least as high as the national average
Two of the three lowest crude birth rates (less than 70 births per 1 000 inhabitants in 2015) were recorded forItalian regions Liguria in the north-western corner mdash a popular retirement location mdash and the island regionof Sardegna However the lowest birth rate among NUTS level 2 regions was recorded in the northern Spanishregion of Principado de Asturias (62 births per 1 000 inhabitants)
Population statistics at regional level 14
Figure 4 Crude birth rate by NUTS 2 regions 2015(number of live births per 1 000 inhabi-tants)Source Eurostat (demorgind3) and (demogind)
In Inner London - West the average age of women at childbirth was 335 years this was 75 yearshigher than in the Bulgarian region of Yugoiztochen
With women tending to have fewer children one consequence is that it becomes more common to postpone thedecision of when to have a child This pattern may at least in part also be attributed to a growing number ofwomen participating in further education and trying to establish a professional career before deciding to starta family
Population statistics at regional level 15
In 2015 the average (mean) age of women in the EU-28 giving birth was 305 years while the mean age ofwomen at childbirth was at least 300 years in a majority of the EU Member States The highest average age forgiving birth was recorded in Spain at 319 years while Italy Ireland and Luxembourg each recorded averagesthat were within 04 years of this peak The lowest mean ages at childbirth were recorded in Slovakia (288years) Romania (277 years) and Bulgaria (274 years)
Looking in more detail the mean age of women at childbirth was relatively high across most of Spain andItaly (see Map 4) By contrast in most of the other EU Member States it was commonplace to find that urbanregions (in particular capital city regions) tended to record the highest average ages this would tend to supportthe view that some women delay having children in order to pursue a career
In 2015 the highest average age of women at childbirth across the NUTS level 2 regions of the EU wasrecorded in the more affluent of the two capital city regions of the United Kingdom Inner London - West (anaverage of 335 years) The mean age of women at childbirth in the Spanish capital city region Comunidad deMadrid was also relatively high (325 years) although it was surpassed by two northern Spanish regions namelyPaiacutes Vasco (328 years) and Galicia (326 years) Other capital city regions with high average ages of womenat childbirth included the Danish Greek and Italian capital city regions Hovedstaden Attiki and Lazio (eachrecording an average age of 321 years) two regions from the Netherlands (Utrecht and the capital city regionNoord-Holland) and the Swedish capital city region Stockholm (all 320 years)
Population statistics at regional level 16
At the other end of the range the three lowest average ages of women at childbirth in 2015 were all recorded inBulgaria Yuzhen tsentralen (267 years) Severozapaden (264 years) and Yugoiztochen (260 years) There weretwo further Bulgarian regions among the 27 EU regions that reported an average age of women at childbirthof less than 290 years (as shown by the lightest shade of yellow in Map 4) along with seven out of the eightRomanian regions (the only exception was the capital city region Bucuresti - Ilfov) five regions from northernand western Poland three overseas French regions two regions each from northern Hungary central and easternSlovakia and north-eastern England (in the United Kingdom) and a single region from the north-west of theCzech Republic Many of these regions with low average ages for women at childbirth were characterised aseither rural regions or former industrial regions in decline
Population statistics at regional level 17
Map 4 Mean age of women at childbirth by NUTS 2 regions 2015(years)Source Eurostat(demorfind2) and (demofind)
Population statistics at regional level 18
The highest fertility rates were recorded in France the overseas island region of Mayotte recordedthe highest value of 502 births per woman while for mainland regions the rate peaked in Seine-Saint-Denis (247 births)
In developed economies a total fertility rate of 210 live births per woman is considered to be the naturalreplacement rate in other words the level at which the size of the population would remain stable in thelong-run if there were no inward or outward migration Having fallen for several decades the total fertilityrate in the EU showed some signs of recovering at the start of the 21st century as it rose from a low of 146live births per woman in 2001 to reach an average of 162 births by 2010 Thereafter the EU-28 fertility ratedipped again to 155 in 2013 before a modest recovery to 158 children in 2014 a figure that was repeated in 2015
The highest fertility rate among the EU Member States was recorded in France (196 live births per womanin 2015) followed by Ireland (192) Sweden (185) and the United Kingdom (180) By contrast in 13 of theMember States the total fertility rate was no higher than 150 live births per woman The lowest rate wasrecorded in Portugal (131 live births per woman) in keeping with generally low rates in the southern MemberStates (135 live births or less) as well as Poland (132)
Differences in regional fertility may be linked to a range of factors among others the socioeconomic struc-ture of the population (for example educational attainment occupational status income or age) place ofresidence (for example the availability of infrastructure childcare facilities or the housing market) or culturalfactors (for example religious beliefs and customs attitudes to childbirth outside of marriage or attitudes tocontraception) A closer analysis of regional data reveals that fertility rates tended to be highest across Irelandmuch of France (including its overseas regions) in southern regions of the United Kingdom and several Nordicregions several of these regions were characterised by relatively high levels of migrants By contrast some ofthe lowest fertility rates were recorded for rural regions with relatively low levels of migration and where familyunits continued to play a relatively important role
In 2015 there were 27 NUTS level 3 regions that recorded a total fertility rate of at least 210 live births mdashthe natural replacement rate mdash with the majority of these located either in France (11 regions) or the UnitedKingdom (10 regions) Of the six remaining regions Ireland was the only other EU Member State to reportmore than a single region (Border and Mid-West) while the remaining regions included Sliven (Bulgaria) Ciu-dad Autoacutenoma de Melilla (Spain) Taurages apskritis (Lithuania) and Vaslui (Romania) The overseas Frenchregions of Mayotte and Guyane and the Spanish territory of Ciudad Autoacutenoma de Melilla reported the highestfertility rates in the EU averaging 502 352 and 253 live births per woman respectively They were followedby Seine-Saint-Denis (located next to the French capital city region) and another French overseas region LaReacuteunion
There were 161 NUTS level 3 regions where the fertility rate was 19 or more (as shown by the darkest shade ofyellow in Map 5) By contrast there were 247 NUTS level 3 regions where the fertility rate was below 135 livebirths per woman in 2015 (as shown by the lightest shade of yellow in Map 5) Among the latter there werefive regions where the fertility rate averaged less than 100 live birth per woman and all of these were located inthe south of the EU Zamora (north-west Spain) Carbonia-Iglesias (south-west Sardegna Italy) Alto Tacircmega(northern Portugal) Fokida (central Greece) and La Gomera (one of the Canary islands Spain)
The distribution of total fertility rates across NUTS level 3 regions is shown in Map 5 as with the crudebirth rate the regional data shows that there was often a homogeneous distribution in many of the EU Mem-ber States In 2015 the exceptions to this rule were often outliers in overseas regions for example MayotteGuyane La Reacuteunion and Guadeloupe (all France) However even after excluding these special cases there wasa relatively wide range in regional fertility rates across France and this diversity could even be observed forregions within close geographical proximity of each other for example (central) Paris where the total fertilityrate was 155 live births per woman and the neighbouring region of Seine-Saint-Denis where it averaged 247A similar situation was found in the United Kingdom with relatively low fertility rates recorded among theaffluent central London regions of Camden amp City of London (121) Westminster (124) or Kensington andChelsea amp Hammersmith and Fulham (132) whereas the total fertility rate rose to 217 live births per womanin the less well-off outer London region of Barking and Dagenham amp Havering
Population statistics at regional level 19
Map 5 Total fertility rate by NUTS 3 regions 2015(number of live births per woman)SourceEurostat (demorfrate3) and (demofind)
Population statistics at regional level 20
Infant mortalityThe significant increases recorded for life expectancy in the EU are not exclusively due to increased longevityrather they may at least in part be attributed to a reduction in infant mortality rates To give some idea ofthe rapid pace of change the EU-28 infant mortality rate was 362 deaths per 1 000 live births in 1961 (the firstreference year for which a value exists) this was approximately 10 times as high as the latest figure availableas the infant mortality rate was 36 deaths per 1 000 live births in 2015
Figure 5 shows the range in infant mortality rates among NUTS level 2 regions Among the EU MemberStates national averages ranged in 2015 from highs of 76 and 66 deaths per 1 000 live births in Romania andBulgaria down to 25 or less deaths per 1 000 live births in Estonia the Czech Republic Sweden Finland andSlovenia the latter recording the lowest rate at 16 deaths per 1 000 live births
For the fifth consecutive year there were no infant deaths in the Finnish island region of Aringland
In 2015 there were a number of EU Member States that recorded particularly homogeneous infant mortal-ity rates across their regions including the Nordic Member States Hungary Poland and Portugal By contrastthe range in infant mortality rates was wider in the regions of Spain Slovakia and France The highest ratesin these three Member States were recorded in the relatively poor overseas and island regions of France andthe Spanish autonomous cities or mdash in the case of Slovenia mdash the easternmost and poorest region of VyacutechodneacuteSlovensko
There were 17 regions where infant mortality rates rose above 70 deaths per 1 000 live births in 2015 Otherthan the Spanish autonomous cities French overseas regions and Vyacutechodneacute Slovensko these were exclusivelylocated in Romania (seven regions) or Bulgaria (four regions) The lowest infant mortality rate in the EU wasrecorded for the island region of Aringland (Finland) where no child aged less than one year died (thus the infantmortality rate was 00) this was the fifth consecutive year that a rate of zero had been recorded in this regionThe next lowest rates (13 deaths per 1 000 live births) were recorded in the north-eastern Finnish region ofPohjois- ja Itauml-Suomi and in the western Austrian region of Tirol There were 16 NUTS level 2 regions acrossthe EU which recorded infant mortality rates of less than 20 deaths per 1 000 live births in 2015 including thecapital city regions of Finland Slovakia the Czech Republic Slovenia and the United Kingdom (Inner London- West) Indeed it was relatively common to find capital city regions with low infant mortality rates andthis pattern was repeated across most of the multi-regional eastern EU Member States However in AustriaDenmark France and Portugal the infant mortality rate for the capital city region was above the nationalaverage
Population statistics at regional level 21
Figure 5 Infant mortality rate by NUTS 2 regions 2015(deaths per 1 000 live births)SourceEurostat (demorminfind) and (demominfind)
Death ratesCrude death rates generally reflect the age structure of the population as elderly persons are more likely to dieand the likelihood of catchingcontracting a specific illnessdisease or dying from an external cause as suchadverse weather conditions or an outbreak of a particular disease may impact on annual rates
In 2015 there were 522 million deaths in the EU-28 this was the highest number recorded since a timeseries for the EU-28 began in 1961 The number of deaths rose by almost 280 thousand or 57 when com-pared with 2014 Estonia was the only EU Member State to report that its overall number of deaths fell between2014 and 2015 (down 16 ) while there was no significant change in the number of deaths recorded in LatviaBy contrast the total number of deaths in France Austria Germany Croatia Greece and Spain rose by morethan 60 while even higher rates of change were recorded in Italy (82 ) and Cyprus (116 )
The EU-28 crude death rate was 102 deaths per 1 000 inhabitants in 2015 with this ratio ranging from ahigh of 153 in Bulgaria and 144 in both Latvia and Lithuania down to 80 or fewer deaths per 1 000 inhabi-tants in Malta Luxembourg Cyprus and Ireland
Crude death rates were often relatively low in capital city regions as working age people ac-counted for a higher than average share of their total number of inhabitants
Figure 6 shows how crude death rates varied among NUTS level 2 regions in 2015 it may be contrasted
Population statistics at regional level 22
with Figure 4 which shows a similar analysis for crude birth rates generally there was a much wider rangewhen analysing the distribution of regional death rates within each of the EU Member States The highestcrude death rates were recorded in those regions characterised by relatively old population structures this wasparticularly the case in several of the eastern and southern EU Member States the Baltic Member States andGermany Four Bulgarian regions recorded the highest crude death rates in the EU ranging from 150 to 199deaths per 1 000 inhabitants with a peak in the northern region of Severozapaden the other regions wereYuzhen tsentralen Yugoiztochen and Severen tsentralen
At the other end of the range the lowest crude death rates were recorded in two of the French overseasregions mdash Guyane and Mayotte mdash both characterised by their relatively youthful population structures Otherregions with relatively low death rates included both of the capital city regions of the United Kingdom namelyInner London - East (45) and Inner London - West (50) another French overseas region La Reacuteunion (53)and the Dutch region of Flevoland (56) which is located just to the east of the capital city of Amsterdam eachof these regions is characterised by a relatively young population In nearly all of the multi-regional MemberStates the crude death rate for the capital city region was below the national average the only exceptions tothis rule were Poland (where the capital city region Mazowieckie recorded a death rate that was identical tothe national average) and Croatia
Figure 6 Crude death rate by NUTS 2 regions 2015(number of deaths per 1 000 inhabi-tants)Source Eurostat (demorgind3) and (demogind)
Population statistics at regional level 23
Data sources and availabilityEurostat collects a wide range of regional demographic statistics these include data on population numbers andvarious demographic events which influence the populationrsquos size structure and specific characteristics Thedata may be used for a wide range of planning monitoring and evaluating actions for example to
bull analyse population ageing and its effects on sustainability and welfare
bull evaluate the economic impact of demographic change
bull calculate per inhabitant ratios and indicators mdash such as regional gross domestic product per capita whichmay be used to allocate structural funds to economically less advantaged regions
bull develop and monitor migration and asylum systems
Statistics on population change and the structure of population are increasingly used to support policymakingand to provide the opportunity to monitor demographic behaviour within a political economic social or cul-tural context The European Parliament passed a resolution on rsquo Demographic change and its consequences forthe future of the EUrsquos cohesion policy rsquo (2013C 153 E02) which underlined that demographic developmentsin the regions should be statistically measured and stressed that demographic change should be considered asa cross-cutting objective in future cohesion policy
For more informationPopulation change mdash demographic balance and crude rates at regional level
NUTSThe data presented in this article are based exclusively on the 2013 version of NUTS
Indicator definitionsGlossary entries on Statistics Explained are available for a wide range of demographic conceptsindicators in-cluding life expectancy at birth population change natural change net migration plus statistical adjustment the crude birth rate the crude death rate the total fertility rate and the infant mortality rate Crude ratesof change may be calculated for total population change natural population change and net migration plusstatistical adjustment In all cases the level of change during the year is compared with the average populationof the area in question in the same year and the resulting ratio is expressed per 1 000 inhabitants
For more informationDedicated section on population (demography migration and projections)
ContextDemographic changes in the EU are likely be of considerable importance in the coming years as most modelsfor future population trends suggest that the EUrsquos population will continue to age as a result of consistentlylow levels of fertility and extended longevity Although migration can play an important role in the populationdynamics within many of the EU Member States it is unlikely that it can reverse the ongoing trend of popu-lation ageing
The social and economic consequences associated with population ageing are likely to have profound impli-cations across the EU both nationally and regionally For example low fertility rates will lead to a reductionin the number of students in education there will be fewer working-age persons to support the remainder ofthe populace and there will be a higher proportion of elderly persons (some of whom will require additionalinfrastructure healthcare services and adapted housing) These structural demographic changes could impacton the capacity of governments to raise tax revenue balance their own finances or provide adequate pensionsand healthcare services
Population statistics at regional level 24
Policy developmentsFuture demographic developments have driven a range of policy developments in particular within the fieldsof employment and social policy health policy and policies concerning free movement asylum and migrationsee rsquo The demographic future of Europe mdash from challenge to opportunity rsquo (COM(2006) 571 final)
Five of the seven flagship initiatives of the Europe 2020 strategy have a particular demographic dimensionThe innovation union provides an opportunity to bring together public and private actors at various territoriallevels to tackle a number of challenges and in 2011 a European innovation partnership on active and healthyageing was launched its aim is to raise by two years the average healthy lifespan of Europeans by 2020
In May 2015 the European Commission presented a European agenda on migration outlining immediate mea-sures to respond to the influx of migrants and asylum seekers arriving in the EU from the Balkans and acrossthe Mediterranean The agenda also provided a range of options for the longer-term management of migrationinto the EU setting out four levels of action for migration policy namely
bull a new policy on legal migration mdash maintaining the EU as an attractive destination for migrants notablyby reprioritising migrant integration policies managing migration through dialogue and partnerships withnon-member countries and modernising the blue card scheme for highly educated persons from outsidethe EU
bull reducing incentives for irregular migration mdash through a strengthening of the role of Frontex especiallyin relation to migrant returns
bull border management mdash helping to strengthen the capacity of non-member countries to manage theirborders
bull a strong common asylum policy mdash to ensure a full and coherent implementation of the common Europeanasylum system
As a result of the migrant crisis in 2015 the European Commission announced a new assistance instrument foremergency support within the EU in March 2016 The plan allocated some EUR 700 million of aid over theperiod 2016ndash2018 to provide humanitarian assistance through the rapid delivery of food shelter and healthcareThere followed a number of further initiatives during the remainder of 2016 as the crisis remained high on thepolitical agenda among which the implementation of the EU-Turkey statement additional financial supportto Bulgaria Greece and Italy to help cope with specific migration challenges further provisions for supportingSyrian refugees (those displaced within Syria and those in other host countries) additional support for theprotection of unaccompanied minors renewed efforts to help save lives at sea and to disrupt smuggler networksas well as the creation of safe and legal routes for asylum-seekers
See alsobull Population and population change statistics
bull Population statistics introduced
bull Population structure and ageing
Further Eurostat informationData visualisation
bull Eurostat Statistical Atlas (Chapter 2)
bull Regional Statistics Illustrated
Publicationsbull Eurostat regional yearbook
bull Demography report mdash 2015 edition
Population statistics at regional level 25
Main tablesbull Regional statistics (treg) see
Regional demographic statistics (tregdem)
bull Population (tdemopop) see
Crude rates of population change by NUTS 2 region (tgs00099)
Population on 1 January by NUTS 2 region (tgs00096)
Databasebull Regional statistics by NUTS classification (reg) see
Regional demographic statistics (regdem)
Population and area (regdempoar)
Fertility (regdemfer)
Mortality (regdemmor)
bull Population (demopop) see
Regional data (demopreg)
Dedicated sectionbull Population (Demography Migration and Projections)
bull Regions
Methodology Metadatabull Population (ESMS metadata file mdash demopopesms)
Source data for tables figures and maps (MS Excel)bull Population at regional level
External linksbull European Commission mdash Employment Social Affairs amp Inclusion mdash Demographic analysis
View this article online at http ec europa eu eurostat statistics-explained index php Population_statistics_ at_ regional_ level
Population statistics at regional level 26
- Main statistical findings
-
- Life expectancy
- Median age
- Population change
- Birth and fertility rates
- Infant mortality
- Death rates
-
- Data sources and availability
-
- NUTS
-
- Indicator definitions
-
- Context
-
- Policy developments
-
- See also
-
- Further Eurostat information
-
- Data visualisation
- Publications
- Main tables
- Database
- Dedicated section
- Methodology Metadata
- Source data for tables figures and maps (MS Excel)
-
- External links
-
higher in the 1960s than it is today From the 1970s onwards the rate of natural population growth started toslow both as a result of lower numbers of live births and increasing numbers of deaths By 2015 despite theconsiderably higher number of inhabitants in the EU-28 (compared with 1961) there were 25 million fewer livebirths by contrast the number of deaths had risen by 11 million when compared with 1961 Indeed 2015 wasthe first year on record (for an EU-28 time series) that the natural change in population was negative as thenumber of deaths exceeded the number of live births by 117 thousand
Since many of the EU Member States do not have accurate figures on immigration and emigration net migra-tion (the difference between immigration and emigration) often has to be estimated this is usually done byanalysing the difference between the total population change and the natural change each year Net migration(including statistical adjustment) was broadly balanced in the EU-28 during the period from the 1960s to the1980s with both positive and negative changes as such the impact of net migration on the overall changes inpopulation numbers during this period was relatively weak Since the start of the 1990s a pattern of highernumbers of migrants entering the EU has emerged Some of the peaks for net migration that are visible inFigure 1 may be associated with a range of international migration and refugee crises and resulting displacedpersons for example former Yugoslavia during the 1990s Afghanistan and Iraq in the early 2000s or Syriamore recently While natural population change was responsible for most of the population change in the EUduring the 1960s and 1970s this pattern slowly diminished as the difference between the number of births anddeaths gradually narrowed By 1992 the impact of net migration on total population change outweighed thatof natural population change and thereafter became the primary factor for explaining overall population changeas the number of births and deaths in the EU-28 became broadly balanced
Figure 1 Population change EU-28 1961ndash2015(millions)Source Eurostat (demogind)
Population statistics at regional level 2
Life expectancy
Life expectancy at birth has historically risen with increased longevity attributed to a range of factors includingimproved socio-economic and environmental conditions or better medical treatment and care During the periodfrom 2003 to 2014 life expectancy in the EU-28 increased by 32 years rising from an initial value of 777 yearsHowever 2015 was the first year since an EU-28 time series began in 2003 that there was a reduction as lifeexpectancy fell by 03 years to an average of 806 years Life expectancy in the EU ranged from a highof 845 years in the Spanish capital region down to 735 regions in the north-western Bulgarianregion of Severozapaden mdash a difference of 11 years
Map 1 presents life expectancy at birth for NUTS level 2 regions detailing the average (mean) number ofyears that a new born child could expect to live if subjected throughout hisher life to current mortality con-ditions In 2015 there were 21 NUTS level 2 regions where life expectancy at birth was 83 years or more (asshown by the darkest shade of yellow in Map 1) these were principally located in a band that ran from centralthrough northern Spain (eight regions) into southern France (three regions) and across to northern and centralregions of Italy (also eight regions) The only two exceptions located outside of this band were the capital cityregions Icircle de France (France) and Inner London - West (the United Kingdom) The highest life expectancyin the EU-28 among NUTS level 2 regions was recorded in another capital city region namely Comunidad deMadrid (845 years) the Spanish capital city region
At the other end of the range there were 42 NUTS level 2 regions where average life expectancy in 2015was less than 78 years (as shown by the lightest shade of yellow in Map 1) These regions were predominantlylocated in the eastern regions of the EU including all six regions from Bulgaria all seven regions from Hungaryand all eight regions from Romania as well as three out of four regions from Slovakia 11 out of 16 regionsfrom Poland one out of two regions from Croatia and two out of eight regions from the Czech Republic Two
Population statistics at regional level 3
of the three Baltic Member States Latvia and Lithuania (both single regions at this level of detail) and theoutermost regions of Mayotte (France) and Regiatildeo Autoacutenoma dos Accedilores (Portugal) were the only other EUregions where average life expectancy at birth was below 78 years The lowest life expectancy at birth in 2015was recorded in the north-western Bulgarian region of Severozapaden at 735 years As such the difference inlife expectancy between Severozapaden and Comunidad de Madrid was 11 years
Population statistics at regional level 4
Map 1 Life expectancy at birth by NUTS 2 regions 2015(years)Source Eurostat (demormlif-exp) and (demomlexpec)
Population statistics at regional level 5
The largest gender gap for life expectancy was recorded in Lithuania mdash life expectancy was 105years higher for women than for men
It is important to note that while Map 1 presents information for the whole population there remain con-siderable differences in life expectancy between the sexes mdash despite evidence showing that this gender gap hasbeen gradually closing in most of the EU Member States In the EU-28 life expectancy at birth of women (833years in 2015) was on average 54 years higher than the corresponding figure for men (779 years)
Figure 2 illustrates this gap between the sexes for life expectancy for NUTS level 2 regions the biggest gapswhere women were likely on average to live more than 80 years longer than men were all concentrated inthe north-eastern corner of the EU within the three Baltic Member States (all single regions at this level ofdetail) and eight Polish regions In most of the EU Member States there was usually quite a narrow range whenanalysing the highest and lowest regional gender gaps However there were wider regional differences in threeof the Member States largely attributable to a single outlier for example there was a relatively large gap inlife expectancy between the sexes across the vast majority of regions in Spain France and Finland aside fromthe territory of Ciudad Autoacutenoma de Melilla (Spain) the overseas region of Mayotte (France) or the islandregion of Aringland (Finland) where the gender gap was much smaller
Figure 2 Gender gap for life expectancy at birth by NUTS 2 regions 2015(difference in yearsbetween the life expectancy of females and males)Source Eurostat (demormlifexp) and (demom-lexpec)
Population statistics at regional level 6
Median ageWith life expectancy at birth rising for successive generations and with historically low fertility rates it is notsurprising to find that the median age of the EU-28rsquos population continued to increase in recent years It roseby 28 years during the most recent decade for which data are available reaching 426 years on 1 January 2016Figure 3 shows that the median age ranged between 367 years in Ireland and 457 years in Germany suggestingrelatively young and relatively old population structures in these EU Member States The median age rose inevery one of the Member States during the period between 1 January 2006 and 1 January 2016 with increasesof more than 40 years recorded in Romania Lithuania Greece and Portugal while the smallest rises wereregistered in Luxembourg (10 year) and Sweden (06 years)
The median age in the central Greek region of Evrytania was 536 years which was slightlymore than three times as high as in the French overseas region of Mayotte
The highest median age among any of the NUTS level 3 regions was recorded in the central Greek regionof Evrytania (536 years) where the population declined by more than 10 in 2015 in part due to a relativelyhigh net outward migration By contrast the lowest median age (178 years) among NUTS level 3 regions wasrecorded in the overseas French region of Mayotte which also had the lowest life expectancy at birth (765years) among French regions at NUTS level 2 note the geographical coverage of Mayotte is identical at NUTSlevels 2 and 3
An analysis for capital city regions mdash again based on NUTS level 3 mdash shows that these regions usually recordeda median age that was below their respective national average There were three exceptions to this rule amongthe EU Member States in Poland and Slovakia the median age of the population living in Miasto Warszawa(410 years) and in Bratislavskyacute kraj (399 years) was some 11 years and 05 years higher than the respectivenational average the median age in three of the four Greek capital city regions (Dytikos Tomeas Athinon wasthe exception) was also higher than the national average By contrast the lowest (or joint lowest) median ageswere recorded in the capital city regions of 10 EU Member States Among these the largest gaps (in years)between the median age for the capital city region and the national average were recorded for the Danish capitalcity region Byen Koslashbenhavn (where the median age was 76 years lower than the national average) the Belgiancapital city region Arr de Bruxelles-CapitaleArr van Brussel-Hoofdstad (59 years lower) and the Bulgariancapital city region Sofia stolitsa (41 years lower) In those cases where the capital city region did not recordthe lowest median age it was often the case that the lowest median was registered by a region characterisedby its relatively high number of university students for example Heidelberg Stadtkreis in Germany OverigGroningen in the Netherlands Gdanski in Poland or Manchester in the United Kingdom
Population statistics at regional level 7
Figure 3 Median age of the population by NUTS 3 regions 1 January 2016(years)SourceEurostat (demorpjanind3) and (demopjanind)
Population changeThe EU-28rsquos population increased each and every year between 1 January 1960 and 1 January 2016 withthe exception of 2011 (as noted above the reduction in 2011 may be attributed to the revision of populationstatistics in Germany following the census) during these 56 years the total number of inhabitants living in theEU-28 rose by 1036 million There are wide-ranging differences in patterns of demographic change across theEU some of the most common medium-term developments may be summarised as follows
bull a capital region effect as populations continue to expand in and around many capital cities which ex-ert a rsquopull effectrsquo on national and international migrants associated with (perceived) education andoremployment opportunities
bull an urbanndashrural split with the majority of urban regions continuing to report population growth whilethe number of persons resident in many peripheral rural and post-industrial regions declines
bull a northndashsouth split between EU Member States with a high proportion of the population in northernMember States being single and living alone whereas Mediterranean regions are often characterised bylower birth rates but a more important role for family units
bull regional divergences within individual EU Member States which may impact on regional competitivenessand cohesion for example between the eastern and the western regions of Germany or between northernand southern regions of Belgium Italy and the United Kingdom
Population statistics at regional level 8
These general patterns were to some degree overtaken by events in 2015 as a result of very large numbers ofasylum seekers and refugees arriving in and moving within the EU The majority came from the Middle East orsub-Saharan Africa either crossing the Mediterranean or making the journey northwards by land and passingfrom the Balkans into the EU The impact of this mass movement of people was considerable and is reflectedin the statistics presented below
Map 2 presents the crude rate of total population change in 2015 the overall change in population is composedof two different effects natural population change (the difference between births and deaths) and net migration(plus statistical adjustment) mdash see the box below for more details Between 1 January 2015 and 1 January2016 the population of the EU-28 rose by 18 million inhabitants equivalent to a growth rate of 35 per 1 000inhabitants Among the 1 342 NUTS level 3 regions shown in Map 2 a considerable majority (835) reportedan increase in their overall number of inhabitants while there were 505 regions that recorded a decline in pop-ulation numbers leaving two regions with no change
Measuring population change Population change may be defined as the difference in the size of apopulation between the end and the beginning of a given time period (usually one year) more specifically thisperiod is usually the difference in population size on 1 January of two consecutive years
Population change has two components
bull natural population change (the number of live births minus the number of deaths)
bull net migration (the number of immigrants minus the number of emigrants) plus statistical adjustment itshould be noted that net migration as referred to in the context of population change statistics includesthe statistical adjustments occurring in the annual balance of the population and that it serves the purposeof closing this balance
A positive population change when the result of net migration plus live births minus deaths is positiveis referred to as population growth (or a population increase) whereas a negative change is referred to aspopulation decline (or a population decrease)
The crude rate of population change is the ratio of total population change during the year to the av-erage population for the year in question this value is expressed per 1 000 inhabitants
The fastest rate of overall population growth within the EU was recorded in Trier Kreisfreie Stadt(western Germany) its total number of inhabitants rose by 58 in 2015
In 2015 the fastest expanding populations were often concentrated in Germany or Austria while there wasalso relatively high population growth in the south-eastern corner of the United Kingdom the southern regionsof the Nordic Member States as well as several regions in Belgium France and Luxembourg (a single regionat the this level of detail) More specifically the darkest shade of blue in Map 2 shows the 243 NUTS level 3regions where the population grew on average by at least 12 per 1 000 inhabitants during 2015 these included51 regions where population growth was at least 20 per 1 000 inhabitants (or 20 ) The majority (35) ofthese were located in Germany while there were 10 regions from the United Kingdom (seven of which were inLondon the other three were Coventry Central Bedfordshire and Manchester) two regions from Austria (theurban regions of Innsbruck and Wien) and a single region from each of Belgium (Arr Bastogne) France (theoverseas region of Mayotte) Luxembourg (a single region at this level of detail) and Romania (Ilfov whichsurrounds the capital city region Bucuresti)
There were only five regions in the EU-28 where the population grew by at least 40 per 1 000 inhabitantsin 2015 The highest crude rates of population growth were recorded in two German regions Trier KreisfreieStadt (58 per 1 000 inhabitants) in the west and Schwerin Kreisfreie Stadt (49 per 1 000 inhabitants) in thenorth and three regions from London Tower Hamlets in the east of the city (55 per 1 000 inhabitants) andWestminster (46 per 1 000 inhabitants) and Camden amp City of London (42 per 1 000 inhabitants) in centralLondon A closer analysis reveals that the vast majority of the growth in population numbers in all five of theseregions could be attributed to net migration (as opposed to natural population growth) Indeed in the twoGerman regions the natural rate of population change was negative in other words there were more deathsthan births
The most rapid reductions in population were registered in the Baltic Member States as well as some ofthe more rural andor sparsely populated eastern and southernmost regions of the EU There were 81 regions
Population statistics at regional level 9
where the crude rate of total population change in 2015 was -10 per 1 000 inhabitants or less These included7 out of the 11 regions in Lithuania (the other four also recorded negative rates) four out of six regions inLatvia (the other two also recorded negative rates) slightly more than half of the Bulgarian (16 out of 28) andCroatian (11 out of 21) regions as well as 11 regions from Romania 10 regions from Spain seven regions eachfrom Greece and Portugal four regions from Hungary two regions from Estonia and a single region each fromFinland (Kainuu) and the United Kingdom (Blackpool)
Population statistics at regional level 10
Map 2 Crude rate of total population change by NUTS 3 regions 2015(per 1 000 inhabi-tants)Source Eurostat (demorgind3) and (demogind)
Population statistics at regional level 11
There were 12 million migrant arrivals in Germany
As noted above the overall change in population numbers in 2015 was impacted upon by atypical patternsof net migration The information presented in Map 3 concerns crude rates of net migration and is based on thetotal number of people migrating into each region from other regions of the same Member State from other re-gions in different EU Member States or from non-member countries outside the EU The distribution of regionsin Map 3 is quite similar to the distribution for the crude rate of total population change (Map 2) underliningthe fact that migratory patterns were often the principal factor in determining overall population change in 2015
The highest crude rates of net migration were recorded in the two German regions of Trier Kreisfreie Stadt andSchwerin Kreisfreie Stadt Alongside these there were numerous other German regions that had very high cruderates of net migration in 2015 a pattern that could be associated with the dramatic influx of asylum seekers andrefugees principally from the Middle East or the Balkans The considerable influx of migrants into Germanyduring 2015 (net arrivals of 12 million) was broadly distributed across the whole of the German territory asjust six of the 402 NUTS level 3 German regions recorded a crude rate of net migration that was below theEU-28 average
The regions with the highest crude rates of net migration were often those that also appeared at the topof the ranking for total population change as natural population change was often close to being balancedAside from the two German and three London regions mentioned above the remainder of the top 10 were alsoGerman regions (Bremerhaven Kreisfreie Stadt Luumlchow-Dannenberg Osnabruumlck Kreisfreie Stadt HeidekreisAnsbach Kreisfreie Stadt) Looking in more detail there were 302 regions where the crude rate of net migrationwas at least 12 per 1 000 inhabitants (as shown by the darkest shade in Map 3) the vast majority (264) ofthese were located in Germany Those regions with some of the highest rates were often characterised by thepresence of migrant reception centres andor refugee shelters
There were 416 NUTS level 3 regions in the EU-28 where net migration in 2015 was negative (in other wordswhere more people left a region than arrived in it) and in 65 of these the crude rate was less than -60 per1 000 inhabitants These regions were predominantly located across the Baltic Member States eastern andsouthernmost regions of the EU Among the exceptions was the EU region with the most rapid reduction in itspopulation as a result of net migration namely the sparsely-populated and heavily-forested Finnish region ofKainuu (which borders onto Russia) where the crude rate of net migration was -46 per 1 000 inhabitants
Population statistics at regional level 12
Map 3 Crude rate of net migration (plus statistical adjustment) by NUTS 3 regions 2015(per1 000 inhabitants)Source Eurostat (demorgind3) and (demogind)
Population statistics at regional level 13
Although an analysis of regional population changes supports the view that the leading factor affecting pop-ulation changes in 2015 was net migration there were some EU regions where natural change also played animportant role Aside from the overseas French regions of Mayotte (36 per 1 000 inhabitants) and Guyane (23per 1 000 inhabitants) the highest rates of natural population growth were recorded in the eastern Londonregions of Hackney amp Newham (14 per 1 000 inhabitants) and Tower Hamlets (12 per 1 000 inhabitants) andthe north-eastern Parisian suburbs of Seine-Saint-Denis (13 per 1 000 inhabitants)
At the other end of the range it is interesting to note that in 2015 the number of live births was lowerthan the number of deaths in a majority of the NUTS level 3 regions of the EU This pattern was particularlyprevalent across many rural and sparsely populated regions that were characterised by population age structuresskewed in favour of older generations The biggest decline in the crude rate of natural population change wasrecorded in the north-western Bulgarian region of Vidin (-16 per 1 000 inhabitants) while six additional regionsfrom Bulgaria (principally from the north-west) as well as two regions from the Portuguese interior and singleregions from Germany Greece Croatia Lithuania and Romania also recorded double-digit negative rates
Birth and fertility ratesThis section presents information on crude birth rates (the ratio of the number of births to the average pop-ulation expressed per 1 000 inhabitants) the average (mean) age of women at childbirth and fertility rates(the mean number of children born per woman) One of the main reasons why there has been a slowdown inEU population growth is that women are on average having fewer children such historically low fertility rateshave also impacted on the gradual ageing of the EUrsquos population structure
The EU-28 crude birth rate was 100 births per 1 000 inhabitants in 2015 Across the EU Member Statesthis rate peaked at 140 births per 1 000 inhabitants in Ireland and was also relatively high in France (120births) the United Kingdom (119 births) and Sweden (117 births) At the other end of the range the crudebirth rate was 100 births per 1 000 inhabitants or lower across many eastern (Bulgaria Croatia HungaryPoland Romania and Slovenia) and southern regions (Greece Spain Italy Malta and Portugal) as well as inGermany and Austria
The lowest crude birth rate was recorded in the northern Spanish region of the Principadode Asturias
Figure 4 shows crude birth rates for NUTS level 2 regions in 2015 Some EU Member States reported veryhomogeneous regional crude birth rates for example in the Czech Republic Hungary Bulgaria and PolandOthers were more heterogeneous often because of just one or a few regions with particularly high rates this wasthe case in the three French overseas regions of Mayotte (389 births per 1 000 inhabitants) Guyane (262) andLa Reacuteunion (165) as well as the Spanish territory of Ciudad Autoacutenoma de Melilla (178) They were followedby a number of capital city regions and regions within close proximity of capitals for example Inner London- East and Outer London - East (both 157) the Reacutegion de Bruxelles-CapitaleBrussels Hoofdstedelijk Gewest(154) Outer London - West and North West (149) Icircle de France (148) Southern and Eastern Ireland (143)Outer London - South (143) Furthermore one Irish region five more regions from the United Kingdom aswell as the Swedish capital city region Stockholm recorded rates of 130ndash140 births per 1 000 inhabitants Itis interesting to note that in all of the multi-regional EU Member States the crude birth rate for the capitalcity region was at least as high as the national average
Two of the three lowest crude birth rates (less than 70 births per 1 000 inhabitants in 2015) were recorded forItalian regions Liguria in the north-western corner mdash a popular retirement location mdash and the island regionof Sardegna However the lowest birth rate among NUTS level 2 regions was recorded in the northern Spanishregion of Principado de Asturias (62 births per 1 000 inhabitants)
Population statistics at regional level 14
Figure 4 Crude birth rate by NUTS 2 regions 2015(number of live births per 1 000 inhabi-tants)Source Eurostat (demorgind3) and (demogind)
In Inner London - West the average age of women at childbirth was 335 years this was 75 yearshigher than in the Bulgarian region of Yugoiztochen
With women tending to have fewer children one consequence is that it becomes more common to postpone thedecision of when to have a child This pattern may at least in part also be attributed to a growing number ofwomen participating in further education and trying to establish a professional career before deciding to starta family
Population statistics at regional level 15
In 2015 the average (mean) age of women in the EU-28 giving birth was 305 years while the mean age ofwomen at childbirth was at least 300 years in a majority of the EU Member States The highest average age forgiving birth was recorded in Spain at 319 years while Italy Ireland and Luxembourg each recorded averagesthat were within 04 years of this peak The lowest mean ages at childbirth were recorded in Slovakia (288years) Romania (277 years) and Bulgaria (274 years)
Looking in more detail the mean age of women at childbirth was relatively high across most of Spain andItaly (see Map 4) By contrast in most of the other EU Member States it was commonplace to find that urbanregions (in particular capital city regions) tended to record the highest average ages this would tend to supportthe view that some women delay having children in order to pursue a career
In 2015 the highest average age of women at childbirth across the NUTS level 2 regions of the EU wasrecorded in the more affluent of the two capital city regions of the United Kingdom Inner London - West (anaverage of 335 years) The mean age of women at childbirth in the Spanish capital city region Comunidad deMadrid was also relatively high (325 years) although it was surpassed by two northern Spanish regions namelyPaiacutes Vasco (328 years) and Galicia (326 years) Other capital city regions with high average ages of womenat childbirth included the Danish Greek and Italian capital city regions Hovedstaden Attiki and Lazio (eachrecording an average age of 321 years) two regions from the Netherlands (Utrecht and the capital city regionNoord-Holland) and the Swedish capital city region Stockholm (all 320 years)
Population statistics at regional level 16
At the other end of the range the three lowest average ages of women at childbirth in 2015 were all recorded inBulgaria Yuzhen tsentralen (267 years) Severozapaden (264 years) and Yugoiztochen (260 years) There weretwo further Bulgarian regions among the 27 EU regions that reported an average age of women at childbirthof less than 290 years (as shown by the lightest shade of yellow in Map 4) along with seven out of the eightRomanian regions (the only exception was the capital city region Bucuresti - Ilfov) five regions from northernand western Poland three overseas French regions two regions each from northern Hungary central and easternSlovakia and north-eastern England (in the United Kingdom) and a single region from the north-west of theCzech Republic Many of these regions with low average ages for women at childbirth were characterised aseither rural regions or former industrial regions in decline
Population statistics at regional level 17
Map 4 Mean age of women at childbirth by NUTS 2 regions 2015(years)Source Eurostat(demorfind2) and (demofind)
Population statistics at regional level 18
The highest fertility rates were recorded in France the overseas island region of Mayotte recordedthe highest value of 502 births per woman while for mainland regions the rate peaked in Seine-Saint-Denis (247 births)
In developed economies a total fertility rate of 210 live births per woman is considered to be the naturalreplacement rate in other words the level at which the size of the population would remain stable in thelong-run if there were no inward or outward migration Having fallen for several decades the total fertilityrate in the EU showed some signs of recovering at the start of the 21st century as it rose from a low of 146live births per woman in 2001 to reach an average of 162 births by 2010 Thereafter the EU-28 fertility ratedipped again to 155 in 2013 before a modest recovery to 158 children in 2014 a figure that was repeated in 2015
The highest fertility rate among the EU Member States was recorded in France (196 live births per womanin 2015) followed by Ireland (192) Sweden (185) and the United Kingdom (180) By contrast in 13 of theMember States the total fertility rate was no higher than 150 live births per woman The lowest rate wasrecorded in Portugal (131 live births per woman) in keeping with generally low rates in the southern MemberStates (135 live births or less) as well as Poland (132)
Differences in regional fertility may be linked to a range of factors among others the socioeconomic struc-ture of the population (for example educational attainment occupational status income or age) place ofresidence (for example the availability of infrastructure childcare facilities or the housing market) or culturalfactors (for example religious beliefs and customs attitudes to childbirth outside of marriage or attitudes tocontraception) A closer analysis of regional data reveals that fertility rates tended to be highest across Irelandmuch of France (including its overseas regions) in southern regions of the United Kingdom and several Nordicregions several of these regions were characterised by relatively high levels of migrants By contrast some ofthe lowest fertility rates were recorded for rural regions with relatively low levels of migration and where familyunits continued to play a relatively important role
In 2015 there were 27 NUTS level 3 regions that recorded a total fertility rate of at least 210 live births mdashthe natural replacement rate mdash with the majority of these located either in France (11 regions) or the UnitedKingdom (10 regions) Of the six remaining regions Ireland was the only other EU Member State to reportmore than a single region (Border and Mid-West) while the remaining regions included Sliven (Bulgaria) Ciu-dad Autoacutenoma de Melilla (Spain) Taurages apskritis (Lithuania) and Vaslui (Romania) The overseas Frenchregions of Mayotte and Guyane and the Spanish territory of Ciudad Autoacutenoma de Melilla reported the highestfertility rates in the EU averaging 502 352 and 253 live births per woman respectively They were followedby Seine-Saint-Denis (located next to the French capital city region) and another French overseas region LaReacuteunion
There were 161 NUTS level 3 regions where the fertility rate was 19 or more (as shown by the darkest shade ofyellow in Map 5) By contrast there were 247 NUTS level 3 regions where the fertility rate was below 135 livebirths per woman in 2015 (as shown by the lightest shade of yellow in Map 5) Among the latter there werefive regions where the fertility rate averaged less than 100 live birth per woman and all of these were located inthe south of the EU Zamora (north-west Spain) Carbonia-Iglesias (south-west Sardegna Italy) Alto Tacircmega(northern Portugal) Fokida (central Greece) and La Gomera (one of the Canary islands Spain)
The distribution of total fertility rates across NUTS level 3 regions is shown in Map 5 as with the crudebirth rate the regional data shows that there was often a homogeneous distribution in many of the EU Mem-ber States In 2015 the exceptions to this rule were often outliers in overseas regions for example MayotteGuyane La Reacuteunion and Guadeloupe (all France) However even after excluding these special cases there wasa relatively wide range in regional fertility rates across France and this diversity could even be observed forregions within close geographical proximity of each other for example (central) Paris where the total fertilityrate was 155 live births per woman and the neighbouring region of Seine-Saint-Denis where it averaged 247A similar situation was found in the United Kingdom with relatively low fertility rates recorded among theaffluent central London regions of Camden amp City of London (121) Westminster (124) or Kensington andChelsea amp Hammersmith and Fulham (132) whereas the total fertility rate rose to 217 live births per womanin the less well-off outer London region of Barking and Dagenham amp Havering
Population statistics at regional level 19
Map 5 Total fertility rate by NUTS 3 regions 2015(number of live births per woman)SourceEurostat (demorfrate3) and (demofind)
Population statistics at regional level 20
Infant mortalityThe significant increases recorded for life expectancy in the EU are not exclusively due to increased longevityrather they may at least in part be attributed to a reduction in infant mortality rates To give some idea ofthe rapid pace of change the EU-28 infant mortality rate was 362 deaths per 1 000 live births in 1961 (the firstreference year for which a value exists) this was approximately 10 times as high as the latest figure availableas the infant mortality rate was 36 deaths per 1 000 live births in 2015
Figure 5 shows the range in infant mortality rates among NUTS level 2 regions Among the EU MemberStates national averages ranged in 2015 from highs of 76 and 66 deaths per 1 000 live births in Romania andBulgaria down to 25 or less deaths per 1 000 live births in Estonia the Czech Republic Sweden Finland andSlovenia the latter recording the lowest rate at 16 deaths per 1 000 live births
For the fifth consecutive year there were no infant deaths in the Finnish island region of Aringland
In 2015 there were a number of EU Member States that recorded particularly homogeneous infant mortal-ity rates across their regions including the Nordic Member States Hungary Poland and Portugal By contrastthe range in infant mortality rates was wider in the regions of Spain Slovakia and France The highest ratesin these three Member States were recorded in the relatively poor overseas and island regions of France andthe Spanish autonomous cities or mdash in the case of Slovenia mdash the easternmost and poorest region of VyacutechodneacuteSlovensko
There were 17 regions where infant mortality rates rose above 70 deaths per 1 000 live births in 2015 Otherthan the Spanish autonomous cities French overseas regions and Vyacutechodneacute Slovensko these were exclusivelylocated in Romania (seven regions) or Bulgaria (four regions) The lowest infant mortality rate in the EU wasrecorded for the island region of Aringland (Finland) where no child aged less than one year died (thus the infantmortality rate was 00) this was the fifth consecutive year that a rate of zero had been recorded in this regionThe next lowest rates (13 deaths per 1 000 live births) were recorded in the north-eastern Finnish region ofPohjois- ja Itauml-Suomi and in the western Austrian region of Tirol There were 16 NUTS level 2 regions acrossthe EU which recorded infant mortality rates of less than 20 deaths per 1 000 live births in 2015 including thecapital city regions of Finland Slovakia the Czech Republic Slovenia and the United Kingdom (Inner London- West) Indeed it was relatively common to find capital city regions with low infant mortality rates andthis pattern was repeated across most of the multi-regional eastern EU Member States However in AustriaDenmark France and Portugal the infant mortality rate for the capital city region was above the nationalaverage
Population statistics at regional level 21
Figure 5 Infant mortality rate by NUTS 2 regions 2015(deaths per 1 000 live births)SourceEurostat (demorminfind) and (demominfind)
Death ratesCrude death rates generally reflect the age structure of the population as elderly persons are more likely to dieand the likelihood of catchingcontracting a specific illnessdisease or dying from an external cause as suchadverse weather conditions or an outbreak of a particular disease may impact on annual rates
In 2015 there were 522 million deaths in the EU-28 this was the highest number recorded since a timeseries for the EU-28 began in 1961 The number of deaths rose by almost 280 thousand or 57 when com-pared with 2014 Estonia was the only EU Member State to report that its overall number of deaths fell between2014 and 2015 (down 16 ) while there was no significant change in the number of deaths recorded in LatviaBy contrast the total number of deaths in France Austria Germany Croatia Greece and Spain rose by morethan 60 while even higher rates of change were recorded in Italy (82 ) and Cyprus (116 )
The EU-28 crude death rate was 102 deaths per 1 000 inhabitants in 2015 with this ratio ranging from ahigh of 153 in Bulgaria and 144 in both Latvia and Lithuania down to 80 or fewer deaths per 1 000 inhabi-tants in Malta Luxembourg Cyprus and Ireland
Crude death rates were often relatively low in capital city regions as working age people ac-counted for a higher than average share of their total number of inhabitants
Figure 6 shows how crude death rates varied among NUTS level 2 regions in 2015 it may be contrasted
Population statistics at regional level 22
with Figure 4 which shows a similar analysis for crude birth rates generally there was a much wider rangewhen analysing the distribution of regional death rates within each of the EU Member States The highestcrude death rates were recorded in those regions characterised by relatively old population structures this wasparticularly the case in several of the eastern and southern EU Member States the Baltic Member States andGermany Four Bulgarian regions recorded the highest crude death rates in the EU ranging from 150 to 199deaths per 1 000 inhabitants with a peak in the northern region of Severozapaden the other regions wereYuzhen tsentralen Yugoiztochen and Severen tsentralen
At the other end of the range the lowest crude death rates were recorded in two of the French overseasregions mdash Guyane and Mayotte mdash both characterised by their relatively youthful population structures Otherregions with relatively low death rates included both of the capital city regions of the United Kingdom namelyInner London - East (45) and Inner London - West (50) another French overseas region La Reacuteunion (53)and the Dutch region of Flevoland (56) which is located just to the east of the capital city of Amsterdam eachof these regions is characterised by a relatively young population In nearly all of the multi-regional MemberStates the crude death rate for the capital city region was below the national average the only exceptions tothis rule were Poland (where the capital city region Mazowieckie recorded a death rate that was identical tothe national average) and Croatia
Figure 6 Crude death rate by NUTS 2 regions 2015(number of deaths per 1 000 inhabi-tants)Source Eurostat (demorgind3) and (demogind)
Population statistics at regional level 23
Data sources and availabilityEurostat collects a wide range of regional demographic statistics these include data on population numbers andvarious demographic events which influence the populationrsquos size structure and specific characteristics Thedata may be used for a wide range of planning monitoring and evaluating actions for example to
bull analyse population ageing and its effects on sustainability and welfare
bull evaluate the economic impact of demographic change
bull calculate per inhabitant ratios and indicators mdash such as regional gross domestic product per capita whichmay be used to allocate structural funds to economically less advantaged regions
bull develop and monitor migration and asylum systems
Statistics on population change and the structure of population are increasingly used to support policymakingand to provide the opportunity to monitor demographic behaviour within a political economic social or cul-tural context The European Parliament passed a resolution on rsquo Demographic change and its consequences forthe future of the EUrsquos cohesion policy rsquo (2013C 153 E02) which underlined that demographic developmentsin the regions should be statistically measured and stressed that demographic change should be considered asa cross-cutting objective in future cohesion policy
For more informationPopulation change mdash demographic balance and crude rates at regional level
NUTSThe data presented in this article are based exclusively on the 2013 version of NUTS
Indicator definitionsGlossary entries on Statistics Explained are available for a wide range of demographic conceptsindicators in-cluding life expectancy at birth population change natural change net migration plus statistical adjustment the crude birth rate the crude death rate the total fertility rate and the infant mortality rate Crude ratesof change may be calculated for total population change natural population change and net migration plusstatistical adjustment In all cases the level of change during the year is compared with the average populationof the area in question in the same year and the resulting ratio is expressed per 1 000 inhabitants
For more informationDedicated section on population (demography migration and projections)
ContextDemographic changes in the EU are likely be of considerable importance in the coming years as most modelsfor future population trends suggest that the EUrsquos population will continue to age as a result of consistentlylow levels of fertility and extended longevity Although migration can play an important role in the populationdynamics within many of the EU Member States it is unlikely that it can reverse the ongoing trend of popu-lation ageing
The social and economic consequences associated with population ageing are likely to have profound impli-cations across the EU both nationally and regionally For example low fertility rates will lead to a reductionin the number of students in education there will be fewer working-age persons to support the remainder ofthe populace and there will be a higher proportion of elderly persons (some of whom will require additionalinfrastructure healthcare services and adapted housing) These structural demographic changes could impacton the capacity of governments to raise tax revenue balance their own finances or provide adequate pensionsand healthcare services
Population statistics at regional level 24
Policy developmentsFuture demographic developments have driven a range of policy developments in particular within the fieldsof employment and social policy health policy and policies concerning free movement asylum and migrationsee rsquo The demographic future of Europe mdash from challenge to opportunity rsquo (COM(2006) 571 final)
Five of the seven flagship initiatives of the Europe 2020 strategy have a particular demographic dimensionThe innovation union provides an opportunity to bring together public and private actors at various territoriallevels to tackle a number of challenges and in 2011 a European innovation partnership on active and healthyageing was launched its aim is to raise by two years the average healthy lifespan of Europeans by 2020
In May 2015 the European Commission presented a European agenda on migration outlining immediate mea-sures to respond to the influx of migrants and asylum seekers arriving in the EU from the Balkans and acrossthe Mediterranean The agenda also provided a range of options for the longer-term management of migrationinto the EU setting out four levels of action for migration policy namely
bull a new policy on legal migration mdash maintaining the EU as an attractive destination for migrants notablyby reprioritising migrant integration policies managing migration through dialogue and partnerships withnon-member countries and modernising the blue card scheme for highly educated persons from outsidethe EU
bull reducing incentives for irregular migration mdash through a strengthening of the role of Frontex especiallyin relation to migrant returns
bull border management mdash helping to strengthen the capacity of non-member countries to manage theirborders
bull a strong common asylum policy mdash to ensure a full and coherent implementation of the common Europeanasylum system
As a result of the migrant crisis in 2015 the European Commission announced a new assistance instrument foremergency support within the EU in March 2016 The plan allocated some EUR 700 million of aid over theperiod 2016ndash2018 to provide humanitarian assistance through the rapid delivery of food shelter and healthcareThere followed a number of further initiatives during the remainder of 2016 as the crisis remained high on thepolitical agenda among which the implementation of the EU-Turkey statement additional financial supportto Bulgaria Greece and Italy to help cope with specific migration challenges further provisions for supportingSyrian refugees (those displaced within Syria and those in other host countries) additional support for theprotection of unaccompanied minors renewed efforts to help save lives at sea and to disrupt smuggler networksas well as the creation of safe and legal routes for asylum-seekers
See alsobull Population and population change statistics
bull Population statistics introduced
bull Population structure and ageing
Further Eurostat informationData visualisation
bull Eurostat Statistical Atlas (Chapter 2)
bull Regional Statistics Illustrated
Publicationsbull Eurostat regional yearbook
bull Demography report mdash 2015 edition
Population statistics at regional level 25
Main tablesbull Regional statistics (treg) see
Regional demographic statistics (tregdem)
bull Population (tdemopop) see
Crude rates of population change by NUTS 2 region (tgs00099)
Population on 1 January by NUTS 2 region (tgs00096)
Databasebull Regional statistics by NUTS classification (reg) see
Regional demographic statistics (regdem)
Population and area (regdempoar)
Fertility (regdemfer)
Mortality (regdemmor)
bull Population (demopop) see
Regional data (demopreg)
Dedicated sectionbull Population (Demography Migration and Projections)
bull Regions
Methodology Metadatabull Population (ESMS metadata file mdash demopopesms)
Source data for tables figures and maps (MS Excel)bull Population at regional level
External linksbull European Commission mdash Employment Social Affairs amp Inclusion mdash Demographic analysis
View this article online at http ec europa eu eurostat statistics-explained index php Population_statistics_ at_ regional_ level
Population statistics at regional level 26
- Main statistical findings
-
- Life expectancy
- Median age
- Population change
- Birth and fertility rates
- Infant mortality
- Death rates
-
- Data sources and availability
-
- NUTS
-
- Indicator definitions
-
- Context
-
- Policy developments
-
- See also
-
- Further Eurostat information
-
- Data visualisation
- Publications
- Main tables
- Database
- Dedicated section
- Methodology Metadata
- Source data for tables figures and maps (MS Excel)
-
- External links
-
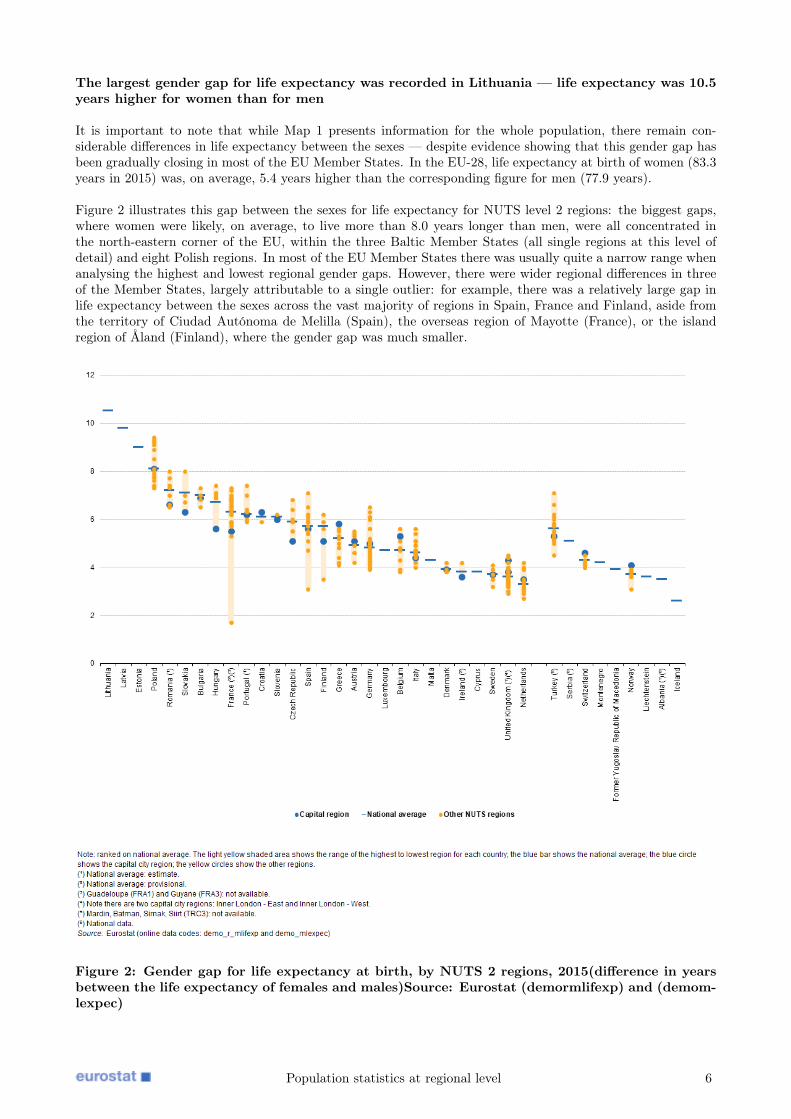
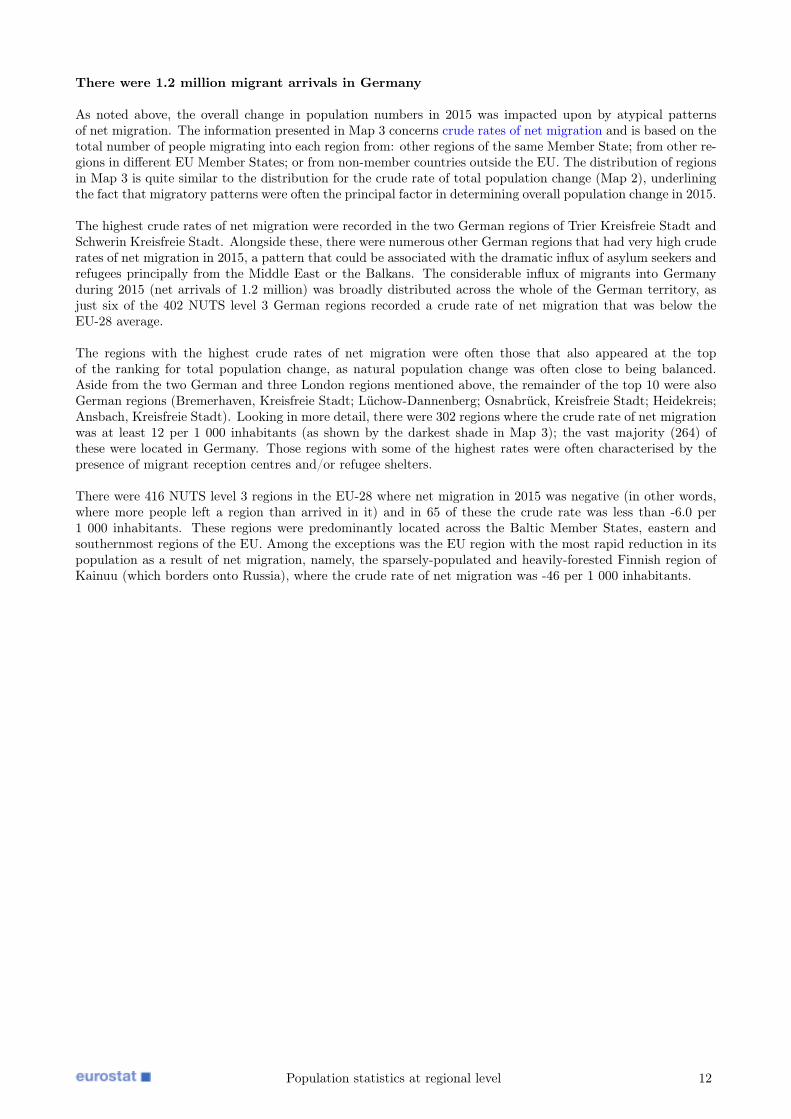
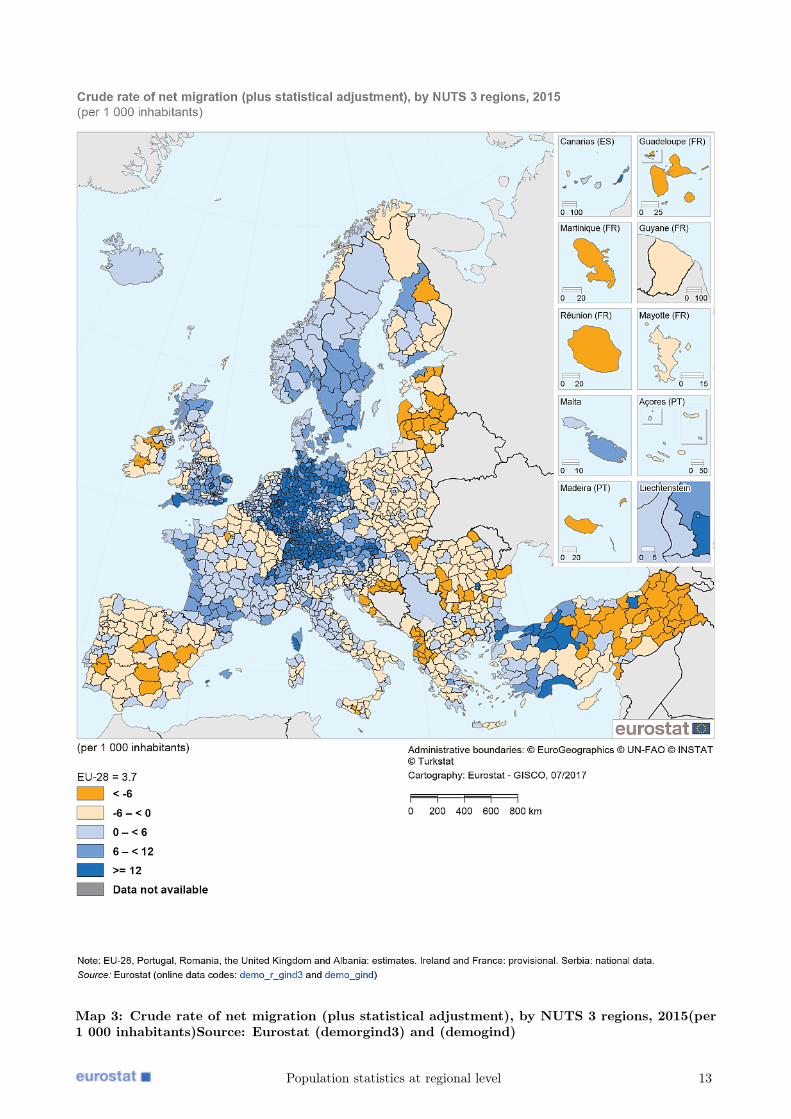
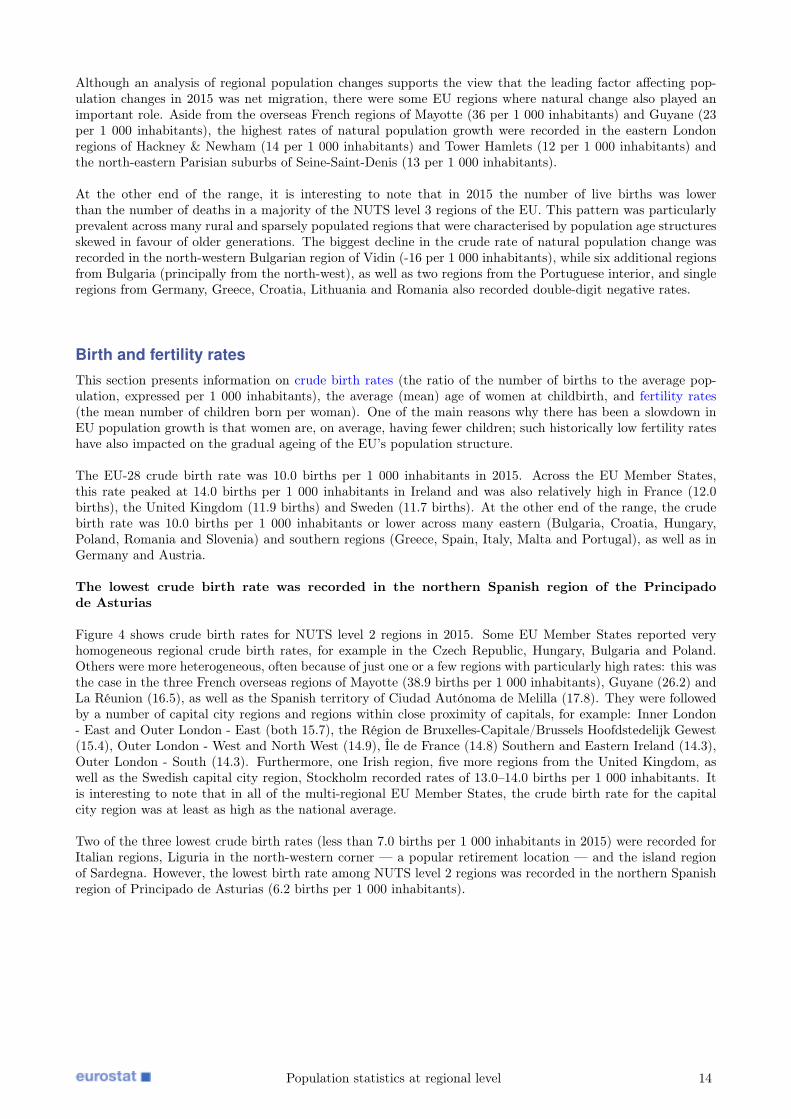
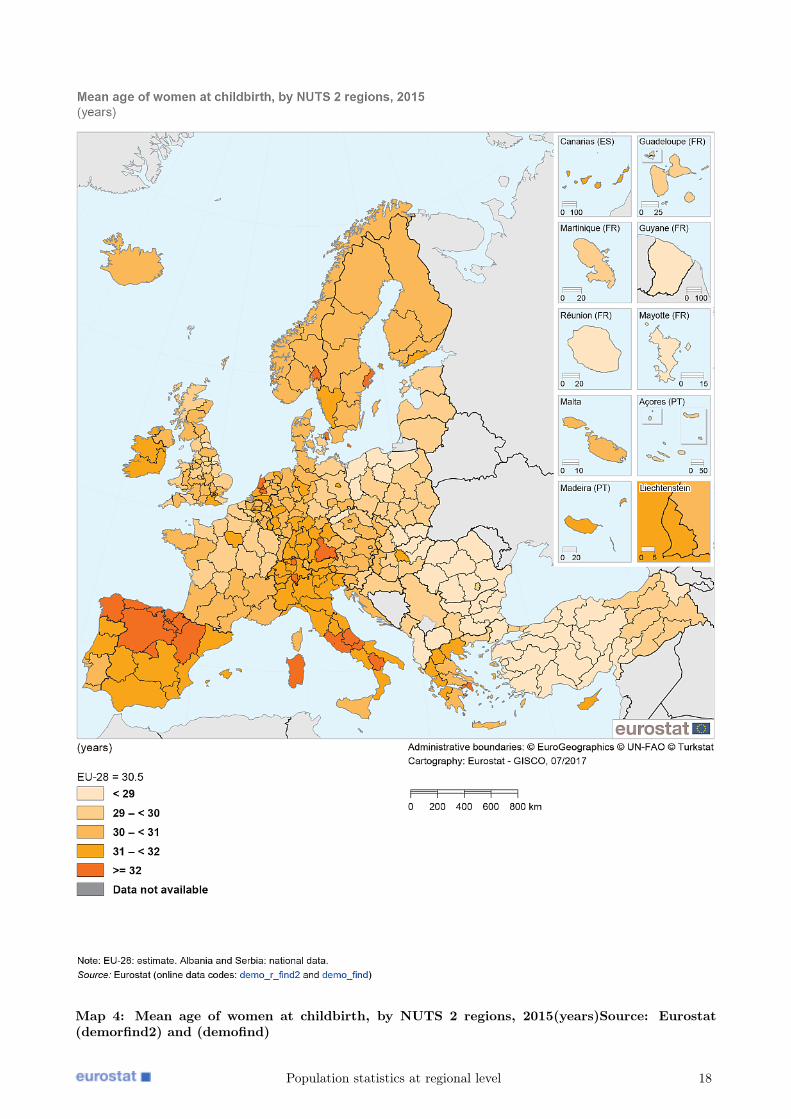
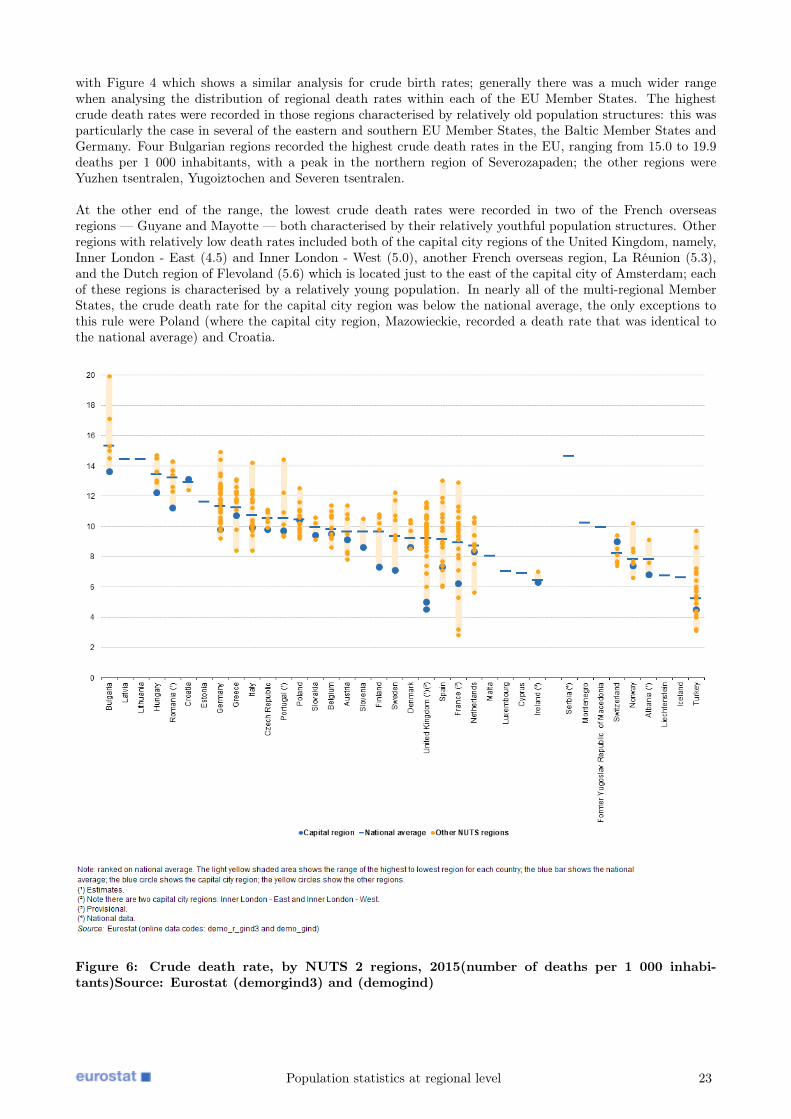