
Population Attraction and Retention Strategies for …...Population Attraction and Retention...
47
Population Attraction and Retention Strategies for Rural Victorian Communities July 2017
Transcript of Population Attraction and Retention Strategies for …...Population Attraction and Retention...
PopulationAttractionandRetentionStrategiesforRuralVictorianCommunities
July2017
PopulationAttractionandRetentionStrategiesforRuralVictorianCommunities
DENCH MCCLEAN CARLSON – RMCG – REMPLAN July2017 2
ExecutiveSummary
RuralCouncilsVictoria(RCV)hascommissionedthePopulationAttractionandRetentionStrategiesforRuralVictorianCommunitiesproject.TheprojectaimstoidentifyaprioritysetofProjectsforimplementationoverthreeyearsconsistentwithRCV’srole,mandateandcapacity,aswellasopportunitiesthatexisttoinfluenceStategovernmentpolicyandprograms.ThePopulationAttractionandRetentionStrategiesforRuralVictorianCommunitiesprojecthasinvolvedthefollowingkeyactivities:
1) AreviewofpopulationandeconomictrendsinruralVictoria
2) AreviewofpopulationattractionandretentionstrategiesbeingundertakeninAustralia,theUSA,CanadaandScotland
Thereviewofpopulationandeconomictrendsnotedthat:
• RuralVictoria’spopulationisprojectedtogrowby156,470from712,376in2011to868,846in2031;muchofthisgrowthwillbeexperiencedintheperi-urbanruralLGAs
• 12of38RuralLGAsareprojectedtoexperiencenetpopulationgrowthbutwillexperienceanoveralllossofpopulationagedunder65years.17of38RuralLGAsareprojectedtoexperiencenetpopulationlossbutwillexperienceanincreaseinpeopleaged65andolder
• RuralVictoria’spopulationofpeopleagedover65istheprojectedtoincreasebysome100,000throughto2031.
• RuralVictoriageneratessome9.24%ofVictoria’sGrossStateProduct
• Between2006and2011thenumberofjobsinruralVictoriagrewbymorethan5,000however20of38ruralLGAsexperiencednetjoblossesinthisperiod
ThereviewofpopulationattractionstrategiesinAustralia,theUSA,CanadaandScotlandobservedthatarangeofprogramsareinplacetosupportruralcommunitiesandeconomiesandthatthenumberofpeopleinrurallocationsandthat:
• ScotlandandTasmaniahaddefinedpopulationgrowthtargets
• TheUSAandScotlandplacegreatemphasisonacommunityeconomicdevelopmentapproach
• TheUSAhasarangeofCommunityDevelopmentFinancialInstitutionsthatprovideaccessible/lowcostfinancetoruralcommunities,businessesandindividuals
• Canada’sAtlanticProvinceshaveinplaceanEconomicGrowthStrategythatseekstoaddressanageingworkforce
• Victoria’sBarwonSouthWestRDA’sworkonpopulationattractionidentified“marketsegments”thataremoreattractedtomovingtoarurallocation
• populationattractionisafunctionoftheavailabilityofeconomicopportunities,liveabilityincludingaccesstokeyservices,andpromotion–i.e.theprovisionofrequiredinformationtotargetmarkets
TheProjectsidentifiedaresummarizedinthetablebelow
Project Overview
RuralPopulationGrowthPolicy AdvocacyplatformtoGovernment/Opposition
RuralInvestmentAttractionProgram Identify,collateandpromotesignificantprivatesectorinvestmentopportunities
RuralWorkforceDevelopmentPlan Identifycurrent/futureworkforceneeds–bothnumbersandskills
OlderPersonsServices&AccommodationProgram
OpportunitiesforNFP/privatesectorinvestmentinservices/housingstock
AlternateServiceDelivery Identify/promoteeffectivealternateservicedeliverymodels
CommunityPlanningUpdate Collateneeds/identifycommonthemes/reflectthevoiceof“potentialentrants”
RuralPromotionProgram PromoteopportunitiesandadvantagesoflivinginruralVictoria
PopulationAttractionandRetentionStrategiesforRuralVictorianCommunities
DENCH MCCLEAN CARLSON – RMCG – REMPLAN July2017 3
Contentssection page
1 Introduction 41.1 KeyProjectActivities 41.2 RuralLGAs 4
2 PopulationandEconomicTrendsinRuralVictoria 4
2.1 VictorianPopulation 52.2 RegionalCityLGAsPopulationTrends 52.3 RuralLGAsPopulationTrends 52.4 ImplicationsforPopulationAttractionProjects 62.5 RuralLGAsContributiontoGrossStateProduct 72.6 Jobs 72.7 RuralWorkforce 72.8 WorkforceAge 82.9 ImplicationsforPopulationAttractionProjects 8
3 ReviewofPopulationAttractionApproachesinOtherRuralAreas 103.1 USA 10
3.1.1 OverviewofFindings 113.1.2 PopulationAttractionStrategies 113.1.3 USDepartmentofAgriculture–RuralDevelopment 113.1.4 RuralLISC 123.1.4.1 LISCInstituteforComprehensiveCommunityDevelopment 133.1.5 NationalMainStreetCenter,Inc. 133.1.6 MarketingHometownAmerica 143.1.7 CostAdvantages 143.1.8 InvestmentReadiness 143.1.9 ImplicationsforPopulationAttractionProjects 14
3.2 Canada 153.2.1 OverviewofFindings 153.2.2 StateofRuralCanadaReport 153.2.3 AtlanticProvinces 153.2.4 BritishColumbia 163.2.5 Alberta 163.2.6 ImplicationsforPopulationAttractionProjects 17
3.3 Scotland 173.3.1 Population–PurposeTarget 173.3.2 ScottishRuralDevelopmentProgramme2014–2020 183.3.3 LEADER 193.3.4 ImplicationsforPopulationAttractionProjects 19
3.4 Australia 203.4.1 CommonwealthGovernment 203.4.2 Queensland 213.4.3 NewSouthWales 213.4.4 SouthAustralia 223.4.5 WesternAustralia 233.4.6 Tasmania 243.4.7 Victoria 25
4 RelevantStudies/Commentary 26
4.1 Peoplecount:Populationgrowthcausesbasiceconomicgrowth 264.2 Superconnectedlifestylelocations-Theriseofthe‘e-change’movement 274.3 AttractingandretainingskilledpeopleinregionalAustralia:Apractitioner’sguide 284.4 RuralMigrationTrendsandDrivers-RuralCouncilsVictoria 284.5 RegionalAustraliaInstitute 294.6 ImplicationsforPopulationAttractionProjects 30
5 RCVPopulationAttractionandRetentionProjects 305.1 KeyAssumptions 305.2 OverviewofPopulationAttractionandRetentionProjects 315.3 EstimationofRequiredResources 32
AppendixI-PopulationAttractionandRetentionProjects–DescriptionandEstimatedResourcesProject#1-RuralPopulationGrowthPolicy 34Project#2-RuralWorkforceDevelopmentPlan 36Project#3-RuralInvestmentAttractionProgram 38Project#4-OlderPersonsServicesandAccommodationProgram 40Project#5–AlternateServiceDelivery 42Project#6-CommunityPlanningUpdate 43Project#7-RuralPromotionProgram 44AppendixII-RCVAnalysis 47
PopulationAttractionandRetentionStrategiesforRuralVictorianCommunities
DENCH MCCLEAN CARLSON – RMCG – REMPLAN July2017 4
1. Introduction
RuralCouncilsVictoria(RCV)hascommissionedthePopulationAttractionandRetentionStrategiesforRuralVictorianCommunitiesproject.
TheprojectaimstodeterminedriversandbarrierstopopulationattractionandretentionandeconomicdevelopmentrelevanttoVictorianruralcommunitiesandidentifyaprioritysetofProjectsforimplementationoverthreeyearsconsistentwithRCV’srole,mandateandcapacity,aswellasopportunitiesthatexisttoinfluenceStategovernmentpolicyandprograms.
1.1 KeyProjectActivities
ThePopulationAttractionandRetentionStrategiesforRuralVictorianCommunitiesprojecthasinvolvedthefollowingkeyactivities:
3) AreviewofpopulationandeconomictrendsinruralVictoria–i.e.the38ruralLocalGovernmentAreas(LGAs).
4) AreviewofpopulationattractionandretentionstrategiesbeingundertakeninAustralia,theUSA,CanadaandScotland(95%ofScotlandisclassifiedasrural)andtheidentificationofpracticesthatcouldbeutilisedinruralVictoria
Thefindingsof1and2werepresentedtotheRCVExecutivefordiscussionandreview
5) TheidentificationofrelevantprojectsforimplementationoverthreeyearsthatareconsistentwithRCV’srole,mandateandcapacity,aswellasopportunitiesthatexisttoinfluenceStategovernmentpolicyandprograms.
AdraftprogramofProjectswasdevelopedwithfeedbackfromaWorkingGroupoftheRCVExecutive.TheseProjectswerealsopresentedtoRCVMayorsandCEOsForum.
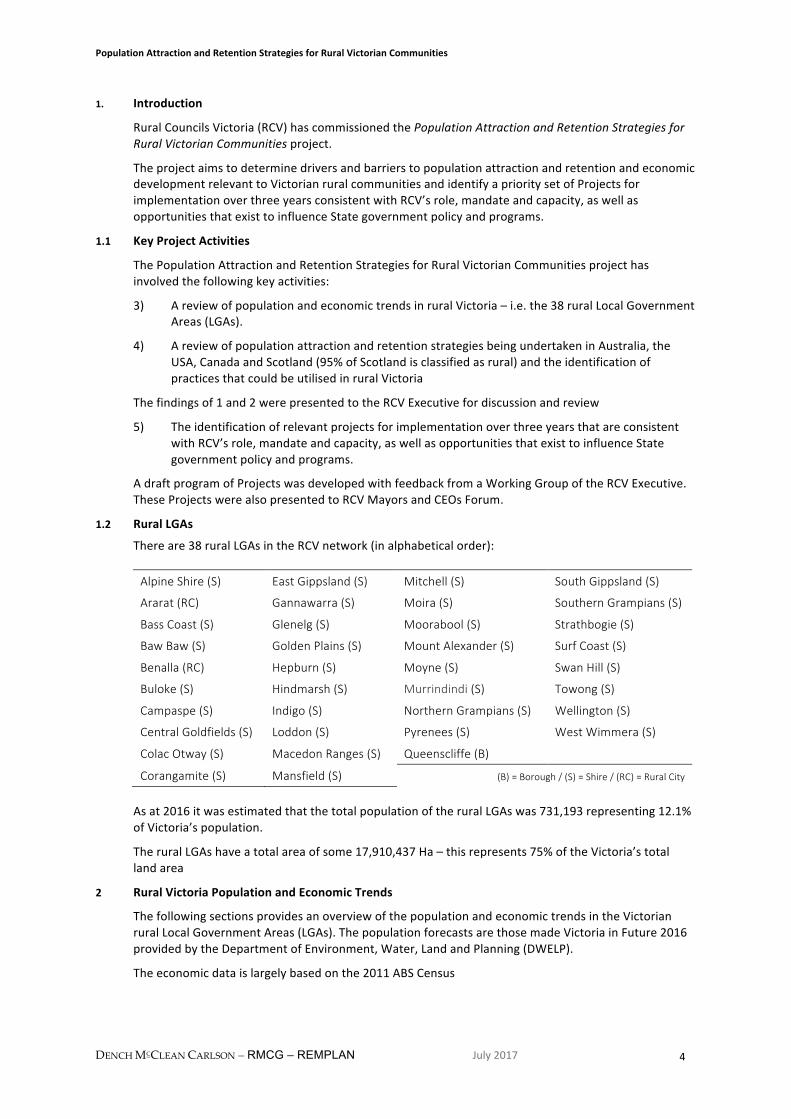
1.2 RuralLGAs
Thereare38ruralLGAsintheRCVnetwork(inalphabeticalorder):
AlpineShire(S) EastGippsland(S) Mitchell(S) SouthGippsland(S)
Ararat(RC) Gannawarra(S) Moira(S) SouthernGrampians(S)
BassCoast(S) Glenelg(S) Moorabool(S) Strathbogie(S)
BawBaw(S) GoldenPlains(S) MountAlexander(S) SurfCoast(S)
Benalla(RC) Hepburn(S) Moyne(S) SwanHill(S)
Buloke(S) Hindmarsh(S) Murrindindi(S) Towong(S)
Campaspe(S) Indigo(S) NorthernGrampians(S) Wellington(S)
CentralGoldfields(S) Loddon(S) Pyrenees(S) WestWimmera(S)
ColacOtway(S) MacedonRanges(S) Queenscliffe(B)
Corangamite(S) Mansfield(S) (B)=Borough/(S)=Shire/(RC)=RuralCity
Asat2016itwasestimatedthatthetotalpopulationoftheruralLGAswas731,193representing12.1%ofVictoria’spopulation.
TheruralLGAshaveatotalareaofsome17,910,437Ha–thisrepresents75%oftheVictoria’stotallandarea
2 RuralVictoriaPopulationandEconomicTrends
ThefollowingsectionsprovidesanoverviewofthepopulationandeconomictrendsintheVictorianruralLocalGovernmentAreas(LGAs).ThepopulationforecastsarethosemadeVictoriainFuture2016providedbytheDepartmentofEnvironment,Water,LandandPlanning(DWELP).
Theeconomicdataislargelybasedonthe2011ABSCensus
PopulationAttractionandRetentionStrategiesforRuralVictorianCommunities
DENCH MCCLEAN CARLSON – RMCG – REMPLAN July2017 5
2.1 VictorianPopulation
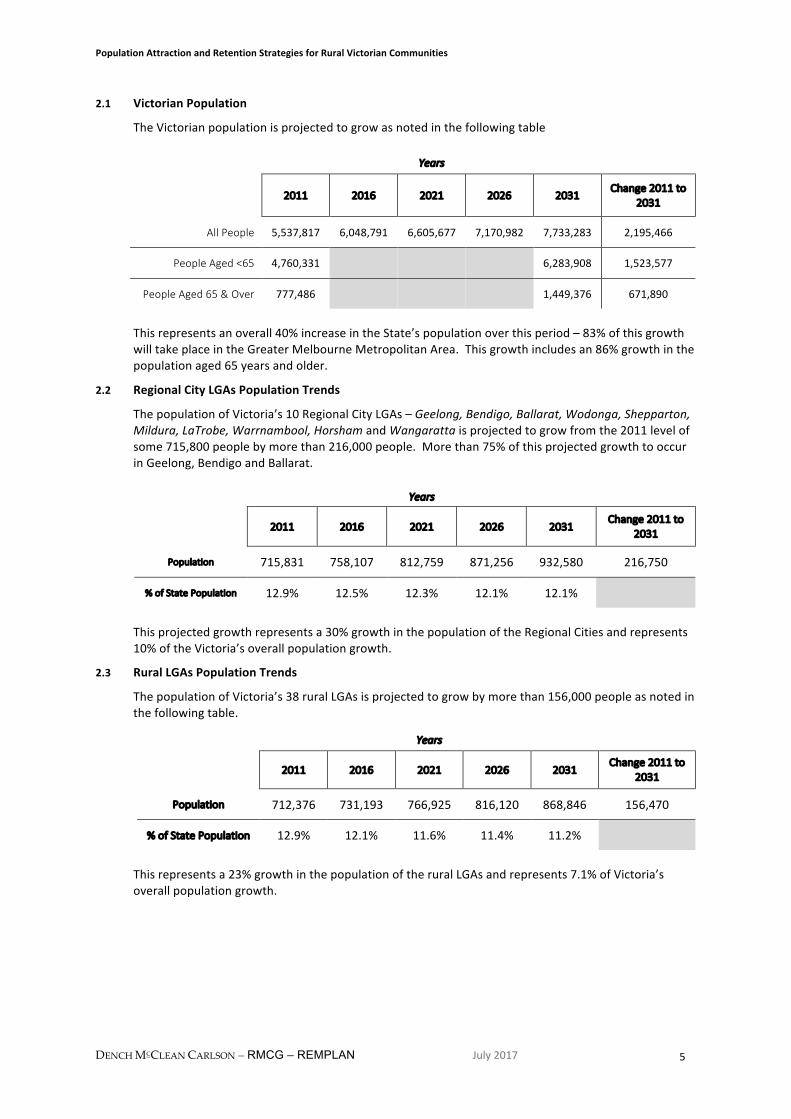
TheVictorianpopulationisprojectedtogrowasnotedinthefollowingtable
Years
2011 2016 2021 2026 2031Change2011to
2031
AllPeople 5,537,817 6,048,791 6,605,677 7,170,982 7,733,283 2,195,466
PeopleAged<65 4,760,331 6,283,908 1,523,577
PeopleAged65&Over 777,486 1,449,376 671,890
Thisrepresentsanoverall40%increaseintheState’spopulationoverthisperiod–83%ofthisgrowthwilltakeplaceintheGreaterMelbourneMetropolitanArea.Thisgrowthincludesan86%growthinthepopulationaged65yearsandolder.
2.2 RegionalCityLGAsPopulationTrends
ThepopulationofVictoria’s10RegionalCityLGAs–Geelong,Bendigo,Ballarat,Wodonga,Shepparton,Mildura,LaTrobe,Warrnambool,HorshamandWangarattaisprojectedtogrowfromthe2011levelofsome715,800peoplebymorethan216,000people.Morethan75%ofthisprojectedgrowthtooccurinGeelong,BendigoandBallarat.
Years
2011 2016 2021 2026 2031Change2011to
2031
Population 715,831 758,107 812,759 871,256 932,580 216,750
%ofStatePopulation 12.9% 12.5% 12.3% 12.1% 12.1%
Thisprojectedgrowthrepresentsa30%growthinthepopulationoftheRegionalCitiesandrepresents10%oftheVictoria’soverallpopulationgrowth.
2.3 RuralLGAsPopulationTrends
ThepopulationofVictoria’s38ruralLGAsisprojectedtogrowbymorethan156,000peopleasnotedinthefollowingtable.
Years
2011 2016 2021 2026 2031Change2011to
2031
Population 712,376 731,193 766,925 816,120 868,846 156,470
%ofStatePopulation 12.9% 12.1% 11.6% 11.4% 11.2%
Thisrepresentsa23%growthinthepopulationoftheruralLGAsandrepresents7.1%ofVictoria’soverallpopulationgrowth.
PopulationAttractionandRetentionStrategiesforRuralVictorianCommunities
DENCH MCCLEAN CARLSON – RMCG – REMPLAN July2017 6
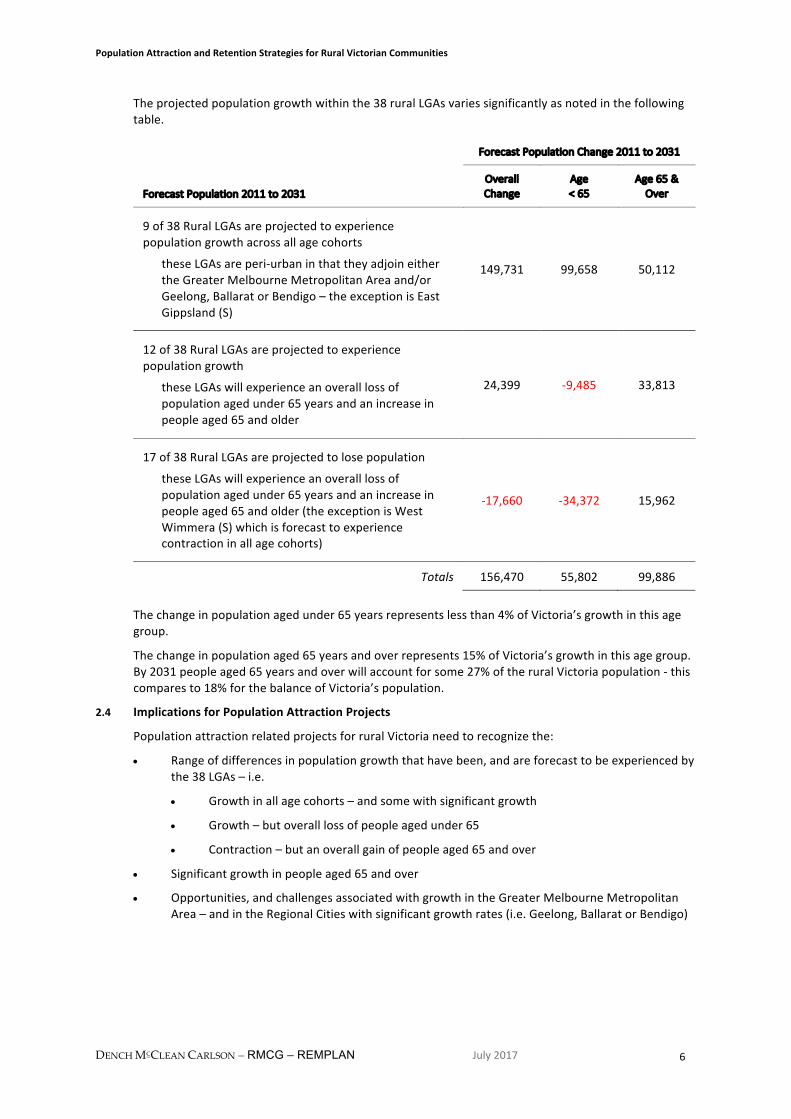
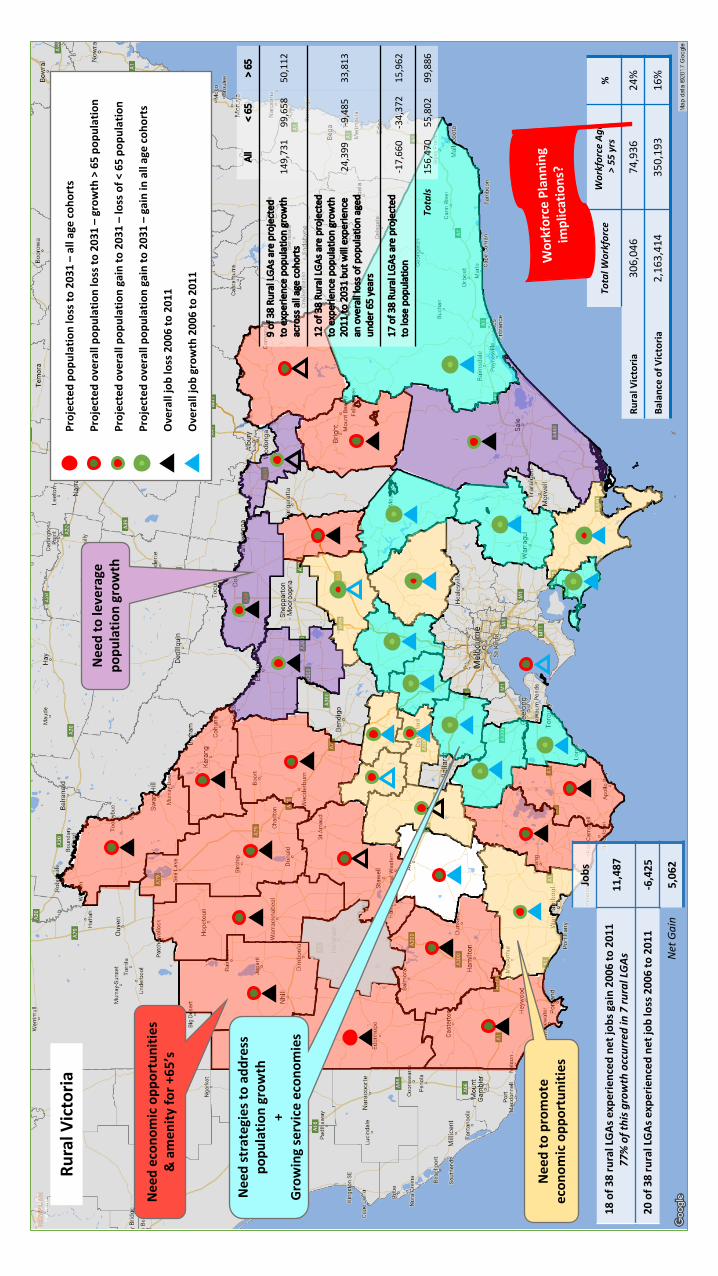
Theprojectedpopulationgrowthwithinthe38ruralLGAsvariessignificantlyasnotedinthefollowingtable.
ForecastPopulationChange2011to2031
ForecastPopulation2011to2031OverallChange
Age<65
Age65&Over
9of38RuralLGAsareprojectedtoexperiencepopulationgrowthacrossallagecohorts
theseLGAsareperi-urbaninthattheyadjoineithertheGreaterMelbourneMetropolitanAreaand/orGeelong,BallaratorBendigo–theexceptionisEastGippsland(S)
149,731 99,658 50,112
12of38RuralLGAsareprojectedtoexperiencepopulationgrowth
theseLGAswillexperienceanoveralllossofpopulationagedunder65yearsandanincreaseinpeopleaged65andolder
24,399 -9,485 33,813
17of38RuralLGAsareprojectedtolosepopulation
theseLGAswillexperienceanoveralllossofpopulationagedunder65yearsandanincreaseinpeopleaged65andolder(theexceptionisWestWimmera(S)whichisforecasttoexperiencecontractioninallagecohorts)
-17,660 -34,372 15,962
Totals 156,470 55,802 99,886
Thechangeinpopulationagedunder65yearsrepresentslessthan4%ofVictoria’sgrowthinthisagegroup.
Thechangeinpopulationaged65yearsandoverrepresents15%ofVictoria’sgrowthinthisagegroup.By2031peopleaged65yearsandoverwillaccountforsome27%oftheruralVictoriapopulation-thiscomparesto18%forthebalanceofVictoria’spopulation.
2.4 ImplicationsforPopulationAttractionProjects
PopulationattractionrelatedprojectsforruralVictorianeedtorecognizethe:
• Rangeofdifferencesinpopulationgrowththathavebeen,andareforecasttobeexperiencedbythe38LGAs–i.e.
• Growthinallagecohorts–andsomewithsignificantgrowth
• Growth–butoveralllossofpeopleagedunder65
• Contraction–butanoverallgainofpeopleaged65andover
• Significantgrowthinpeopleaged65andover
• Opportunities,andchallengesassociatedwithgrowthintheGreaterMelbourneMetropolitanArea–andintheRegionalCitieswithsignificantgrowthrates(i.e.Geelong,BallaratorBendigo)
PopulationAttractionandRetentionStrategiesforRuralVictorianCommunities
DENCH MCCLEAN CARLSON – RMCG – REMPLAN July2017 7
2.5 RuralLGAsContributiontoGrossStateProduct
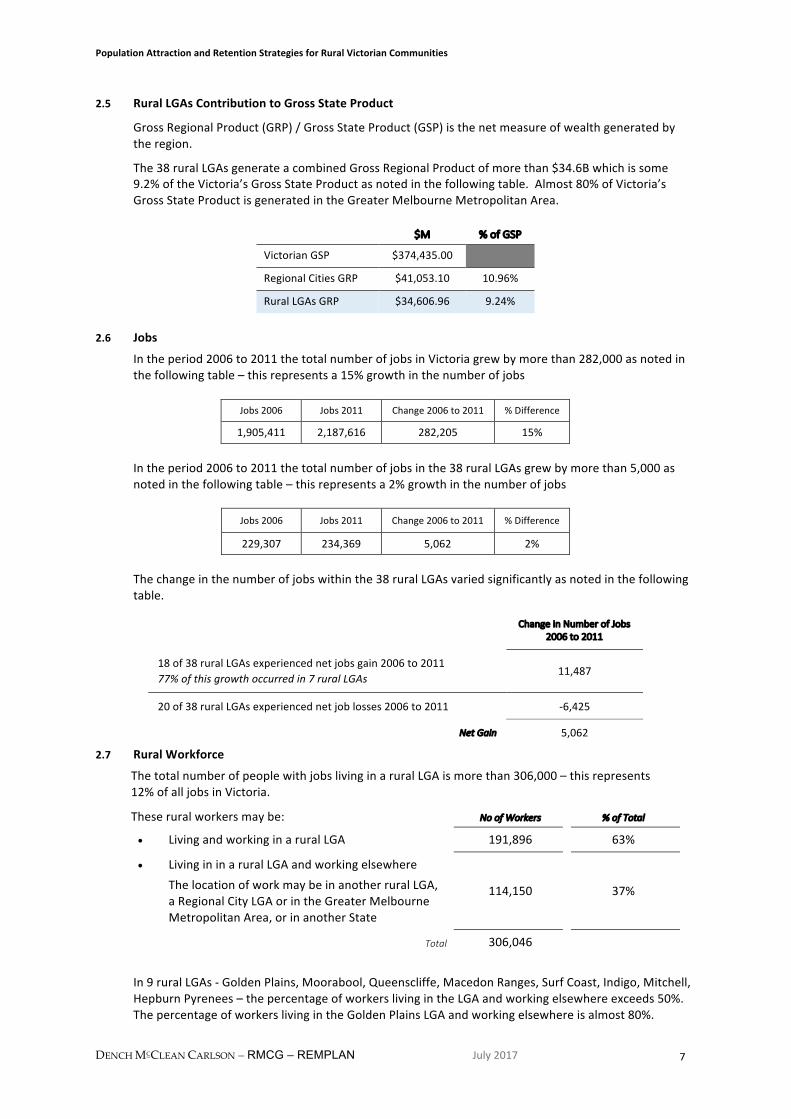
GrossRegionalProduct(GRP)/GrossStateProduct(GSP)isthenetmeasureofwealthgeneratedbytheregion.
The38ruralLGAsgenerateacombinedGrossRegionalProductofmorethan$34.6Bwhichissome9.2%oftheVictoria’sGrossStateProductasnotedinthefollowingtable.Almost80%ofVictoria’sGrossStateProductisgeneratedintheGreaterMelbourneMetropolitanArea.
$M %ofGSP
VictorianGSP $374,435.00
RegionalCitiesGRP $41,053.10 10.96%
RuralLGAsGRP $34,606.96 9.24%
2.6 Jobs
Intheperiod2006to2011thetotalnumberofjobsinVictoriagrewbymorethan282,000asnotedinthefollowingtable–thisrepresentsa15%growthinthenumberofjobs
Jobs2006 Jobs2011 Change2006to2011 %Difference
1,905,411 2,187,616 282,205 15%
Intheperiod2006to2011thetotalnumberofjobsinthe38ruralLGAsgrewbymorethan5,000asnotedinthefollowingtable–thisrepresentsa2%growthinthenumberofjobs
Jobs2006 Jobs2011 Change2006to2011 %Difference
229,307 234,369 5,062 2%
Thechangeinthenumberofjobswithinthe38ruralLGAsvariedsignificantlyasnotedinthefollowingtable.
ChangeinNumberofJobs2006to2011
18of38ruralLGAsexperiencednetjobsgain2006to201177%ofthisgrowthoccurredin7ruralLGAs
11,487
20of38ruralLGAsexperiencednetjoblosses2006to2011 -6,425
NetGain 5,062
2.7 RuralWorkforce
ThetotalnumberofpeoplewithjobslivinginaruralLGAismorethan306,000–thisrepresents12%ofalljobsinVictoria.
Theseruralworkersmaybe: NoofWorkers %ofTotal
• LivingandworkinginaruralLGA 191,896 63%
• LivingininaruralLGAandworkingelsewhereThelocationofworkmaybeinanotherruralLGA,aRegionalCityLGAorintheGreaterMelbourneMetropolitanArea,orinanotherState
114,150 37%
Total 306,046
In9ruralLGAs-GoldenPlains,Moorabool,Queenscliffe,MacedonRanges,SurfCoast,Indigo,Mitchell,HepburnPyrenees–thepercentageofworkerslivingintheLGAandworkingelsewhereexceeds50%.ThepercentageofworkerslivingintheGoldenPlainsLGAandworkingelsewhereisalmost80%.
PopulationAttractionandRetentionStrategiesforRuralVictorianCommunities
DENCH MCCLEAN CARLSON – RMCG – REMPLAN July2017 8
2.8 WorkforceAge
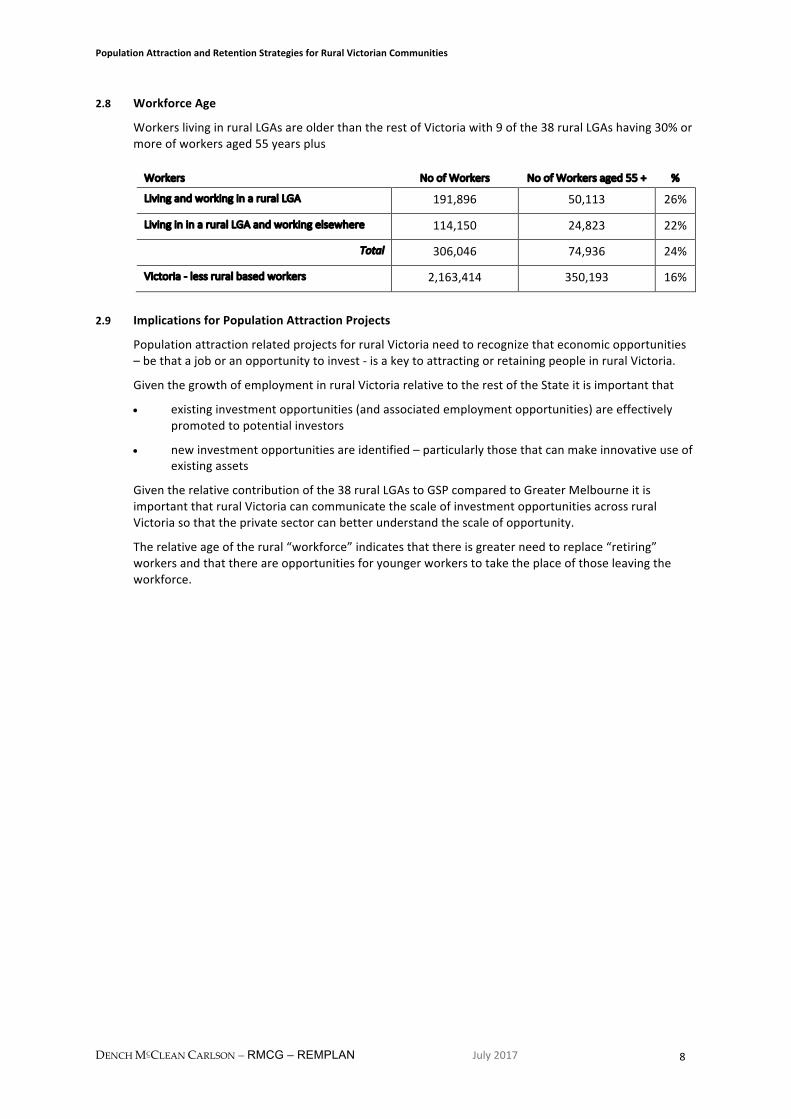
WorkerslivinginruralLGAsareolderthantherestofVictoriawith9ofthe38ruralLGAshaving30%ormoreofworkersaged55yearsplus
Workers NoofWorkers NoofWorkersaged55+ %
LivingandworkinginaruralLGA 191,896 50,113 26%
LivingininaruralLGAandworkingelsewhere 114,150 24,823 22%
Total 306,046 74,936 24%
Victoria-lessruralbasedworkers 2,163,414 350,193 16%
2.9 ImplicationsforPopulationAttractionProjects
PopulationattractionrelatedprojectsforruralVictorianeedtorecognizethateconomicopportunities–bethatajoboranopportunitytoinvest-isakeytoattractingorretainingpeopleinruralVictoria.
GiventhegrowthofemploymentinruralVictoriarelativetotherestoftheStateitisimportantthat
• existinginvestmentopportunities(andassociatedemploymentopportunities)areeffectivelypromotedtopotentialinvestors
• newinvestmentopportunitiesareidentified–particularlythosethatcanmakeinnovativeuseofexistingassets
Giventherelativecontributionofthe38ruralLGAstoGSPcomparedtoGreaterMelbourneitisimportantthatruralVictoriacancommunicatethescaleofinvestmentopportunitiesacrossruralVictoriasothattheprivatesectorcanbetterunderstandthescaleofopportunity.
Therelativeageoftherural“workforce”indicatesthatthereisgreaterneedtoreplace“retiring”workersandthatthereareopportunitiesforyoungerworkerstotaketheplaceofthoseleavingtheworkforce.
RuralV
ictoria
Projectedpo
pulatio
nlossto
2031–allageco
horts
Projectedoverallpop
ulationlossto
2031–grow
th>65po
pulatio
n
Overalljobloss2006to2011
Projectedoverallpop
ulationgainto
2031–lossof<
65po
pulatio
n
Overalljobgrow
th2006to2011
TotalW
orkforce
Workforce
Age
>55yrs
%
RuralV
ictoria
306,046
74,936
24%
BalanceofVictoria
2,163,414
350,193
16%
Projectedoverallpop
ulationgainto
2031–gainin
allagecoho
rts
Needecon
omicopp
ortunitie
s&amen
ityfo
r+65
’s
Needtoleverage
popu
latio
ngrow
th
Needtopromote
econ
omicopp
ortunitie
s
Needstrategiesto
add
ress
popu
latio
ngrow
th+
Grow
ingserviceecon
omies
Jobs
18of3
8ruralLGA
sexperienced
netjo
bsgain2006
to2011
77%ofthisg
rowthoccurredin7ru
ralLGA
s11,487
20of3
8ruralLGA
sexperienced
netjo
bloss2006to2011
-6,425
NetG
ain
5,062
All
<65
>65
9of38Ru
ralLGAsareprojected
toexperiencepo
pulatio
ngrow
th
acrossallagecoho
rts
149,731
99,658
50,112
12of3
8Ru
ralLGAsareprojected
toexperiencepo
pulatio
ngrow
th
2011to
2031bu
twillexperience
anoveralllossofp
opulationaged
un
der6
5years
24,399
-9,485
33,813
17of3
8Ru
ralLGAsareprojected
tolosepop
ulation
-17,660
-34,372
15,962
Totals
156,470
55,802
99,886
PopulationAttractionandRetentionStrategiesforRuralVictorianCommunities
DENCH MCCLEAN CARLSON – RMCG – REMPLAN July2017 10
3 ReviewofPopulationAttractionApproachesinOtherRuralAreas
ThePopulationAttractionandRetentionStrategiesforRuralVictorianCommunitiesprojecthasincludedareviewofpopulationattractionandretentionstrategiesandtheidentificationofpracticesthatcouldbeutilisedinruralVictoriatosupportpopulationattractionand/orretentionbeingundertakeninAustralia,theUSA,Canada,andScotland(95%ofScotlandisclassifiedasrural)
Thereviewinvolvedadesktopreviewofinformationfromrelevantwebsitesandphoneinterviewswith
• Governmentrepresentatives(bothStateandFederal)
• Universityrepresentatives
• NGOrepresentatives
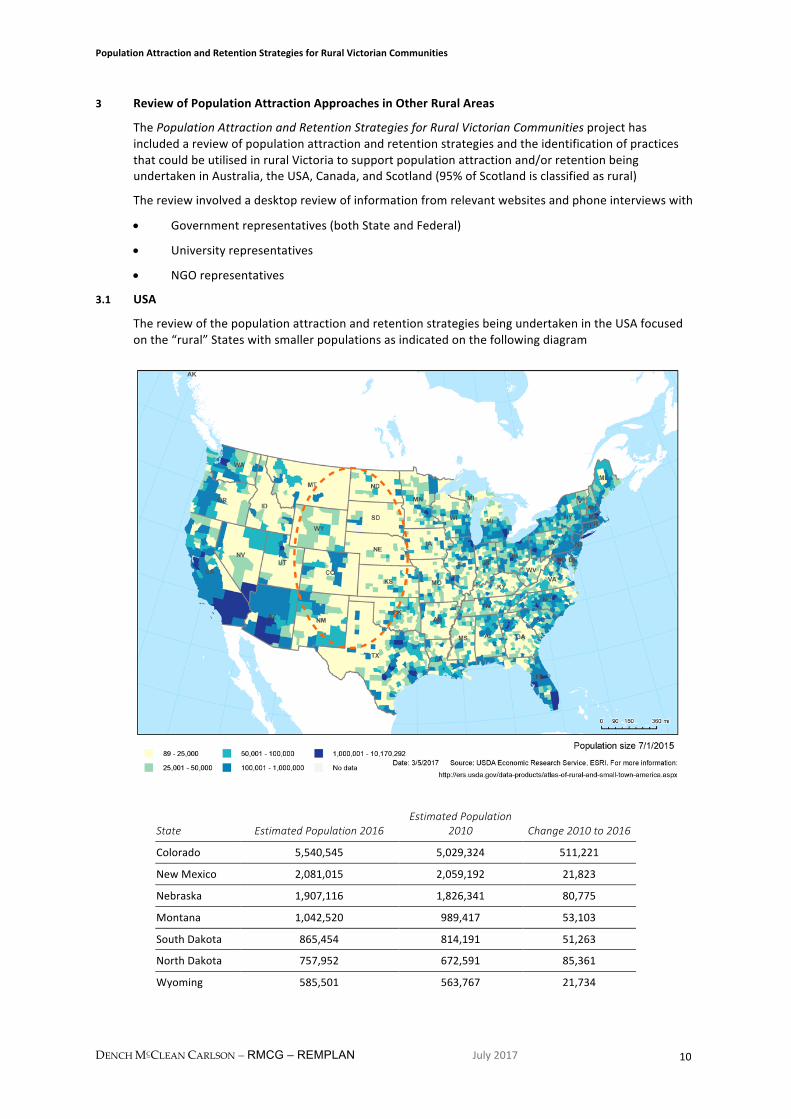
3.1 USA
ThereviewofthepopulationattractionandretentionstrategiesbeingundertakenintheUSAfocusedonthe“rural”Stateswithsmallerpopulationsasindicatedonthefollowingdiagram
State EstimatedPopulation2016EstimatedPopulation
2010 Change2010to2016
Colorado 5,540,545 5,029,324 511,221
NewMexico 2,081,015 2,059,192 21,823
Nebraska 1,907,116 1,826,341 80,775
Montana 1,042,520 989,417 53,103
SouthDakota 865,454 814,191 51,263
NorthDakota 757,952 672,591 85,361
Wyoming 585,501 563,767 21,734
PopulationAttractionandRetentionStrategiesforRuralVictorianCommunities
DENCH MCCLEAN CARLSON – RMCG – REMPLAN July2017 11
PopulationchangesinruralAmericamirrorthatoftheVictorian/Australianexperience
Thenumberofpeoplelivinginruralcountiesstoodatjustover46millionin2014—nearly15 percent of U.S. residents. However, the population of rural America has declined by116,000overthelast4years,withlossesofabout30,000peopleineachofthelast2years.Whilethesedeclinesaresmall,2010-2014isthefirstperiodofoverallpopulationdeclineonrecordforruralAmericaasawhole,andstandsinstarkcontrastwiththeurbanpopulation,which continues to grow by more than 2 million per year. Not all rural areas haveexperienced population loss in recent years. Some rural counties have seen populationgrowth, with nearly 700 growing rural counties together adding over 400,000 residentsbetween2010and2014.ThesecountiesareconcentratedinscenicareassuchastheRockyMountainsorsouthernAppalachia,orinenergyboomregionssuchasinthenorthernGreatPlains. The 1,300 rural counties losing population since 2010 are widespread in regionsdependentonfarming,manufacturing,orresourceextraction.
USDepartmentofAgriculture–RuralDevelopment
3.1.1 OverviewofFindings
Therewerenodedicatedpopulationattractionstrategies/policiesinplace.Thereiswiderecognitionthatmanyruralcommunitiesneedsupportwithrespecttoretaining/attractingpeople.
Ruralcommunities/businesseshaveaccesstoarangeofGovernmentdevelopmentprograms,fundingprogramsand/orlow/nointerestloans
ArangeofCommunityDevelopmentOrganisations(CDOs)supportruralcommunitiesparticularlywithrespecttohousing–manyCDOsare:
• providingcommunityeconomicdevelopmentprogramsaimedathelpingtoidentifyandleverageassetsthatcouldattractinvestment
• alsoCommunityDevelopmentFinancialInstitution(CDFI)whichprovidelowinterestfinancingforcommunitiesand/orbusinesses–oftenfinancingiscontingentuponacommunityhavingundertakenacommunityeconomicdevelopmentprocess
3.1.2 PopulationAttractionStrategies
Therewerenospecificpopulationattractionstrategiesbutpopulationgrowthwasadesiredoutcomeofbroaderstrategies/programsbeingundertaken.
3.1.3 USDepartmentofAgriculture–RuralDevelopment
https://www.rd.usda.gov/
Focus-helpingimprovetheeconomyandqualityoflifeinruralAmericatosupportviabilityofagriculturesector
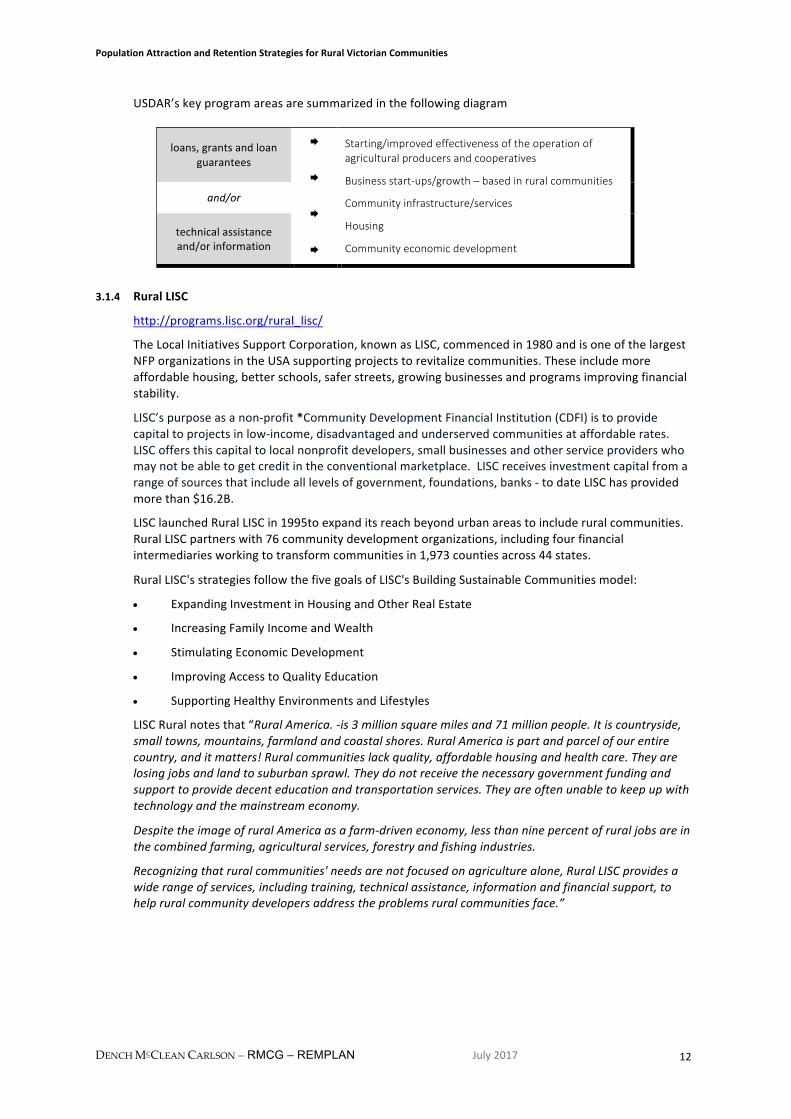
ThekeymechanismsemployedbyUSDARDtoachievethisare:
• providingloans,grantsandloanguaranteestosupportessentialservicessuchashousing,economicdevelopment,healthcare,firstresponderservicesandequipment,andwater,electricandcommunicationsinfrastructure.
• promotingeconomicdevelopmentbysupportingloanstobusinessesthroughbanks,creditunionsandcommunity-managedlendingpools.
• providingtechnicalassistance(i.e.consulting)andinformationtohelpagriculturalproducersandcooperativesgetstartedandimprovetheeffectivenessoftheiroperations.
• providingtechnicalassistance(i.e.consulting)tohelpcommunitiesundertakecommunityempowermentprograms.helpruralresidentsbuyorrentsafe,affordablehousingandmakehealthandsafetyrepairstotheirhomes.
PopulationAttractionandRetentionStrategiesforRuralVictorianCommunities
DENCH MCCLEAN CARLSON – RMCG – REMPLAN July2017 12
USDAR’skeyprogramareasaresummarizedinthefollowingdiagram
loans,grantsandloanguarantees
Æ
Æ
Æ
Æ
Starting/improvedeffectivenessoftheoperationofagriculturalproducersandcooperatives
Businessstart-ups/growth–basedinruralcommunities
Communityinfrastructure/services
Housing
Communityeconomicdevelopment
and/or
technicalassistanceand/orinformation
3.1.4 RuralLISC
http://programs.lisc.org/rural_lisc/
TheLocalInitiativesSupportCorporation,knownasLISC,commencedin1980andisoneofthelargestNFPorganizationsintheUSAsupportingprojectstorevitalizecommunities.Theseincludemoreaffordablehousing,betterschools,saferstreets,growingbusinessesandprogramsimprovingfinancialstability.
LISC’spurposeasanon-profit*CommunityDevelopmentFinancialInstitution(CDFI)istoprovidecapitaltoprojectsinlow-income,disadvantagedandunderservedcommunitiesataffordablerates.LISCoffersthiscapitaltolocalnonprofitdevelopers,smallbusinessesandotherserviceproviderswhomaynotbeabletogetcreditintheconventionalmarketplace.LISCreceivesinvestmentcapitalfromarangeofsourcesthatincludealllevelsofgovernment,foundations,banks-todateLISChasprovidedmorethan$16.2B.
LISClaunchedRuralLISCin1995toexpanditsreachbeyondurbanareastoincluderuralcommunities.RuralLISCpartnerswith76communitydevelopmentorganizations,includingfourfinancialintermediariesworkingtotransformcommunitiesin1,973countiesacross44states.
RuralLISC'sstrategiesfollowthefivegoalsofLISC'sBuildingSustainableCommunitiesmodel:
• ExpandingInvestmentinHousingandOtherRealEstate
• IncreasingFamilyIncomeandWealth
• StimulatingEconomicDevelopment
• ImprovingAccesstoQualityEducation
• SupportingHealthyEnvironmentsandLifestyles
LISCRuralnotesthat“RuralAmerica.-is3millionsquaremilesand71millionpeople.Itiscountryside,smalltowns,mountains,farmlandandcoastalshores.RuralAmericaispartandparcelofourentirecountry,anditmatters!Ruralcommunitieslackquality,affordablehousingandhealthcare.Theyarelosingjobsandlandtosuburbansprawl.Theydonotreceivethenecessarygovernmentfundingandsupporttoprovidedecenteducationandtransportationservices.Theyareoftenunabletokeepupwithtechnologyandthemainstreameconomy.
DespitetheimageofruralAmericaasafarm-driveneconomy,lessthanninepercentofruraljobsareinthecombinedfarming,agriculturalservices,forestryandfishingindustries.
Recognizingthatruralcommunities'needsarenotfocusedonagriculturealone,RuralLISCprovidesawiderangeofservices,includingtraining,technicalassistance,informationandfinancialsupport,tohelpruralcommunitydevelopersaddresstheproblemsruralcommunitiesface.”
PopulationAttractionandRetentionStrategiesforRuralVictorianCommunities
DENCH MCCLEAN CARLSON – RMCG – REMPLAN July2017 13
RuralLISCstaffcollaboratewithCDCstohelpidentifyprioritiesandchallenges,deliveringthemostappropriatesupporttomeetlocalneeds.RuralLISCforgesalliancesamongruralorganizations,funders,lendersandpolicymakers,mobilizingcorporate,governmentandphilanthropicsupporttoprovideruralcommunitydevelopmentorganizationswith:
• loans,grantsandequityinvestments
• local,statewideandnationalpolicysupport
• technicalandmanagementassistance
3.1.4.1 LISCInstituteforComprehensiveCommunityDevelopment
http://www.instituteccd.org/About-us.html
LISChasestablishedtheLISCInstituteforComprehensiveCommunityDevelopmentservesLISCstaff,organizationsandindividualswhopartnerwithLISC,andothersworkinginurbanandruralcommunitiesacrossthecountrybyprovidingtrainingandinformationaboutbestpractices,ideasandnewsfromaroundthefieldofcomprehensivecommunitydevelopment.
3.1.5 NationalMainStreetCenter,Inc.
ManyruralcentersutilisetheMainStreetapproach.
http://www.mainstreet.org/main-street/about-main-street/main-street-america/the-main-street-approach.html
Establishedin1980asaprogramoftheNationalTrustforHistoricPreservation,theNationalMainStreetCenter,Inc.workswithanationwidenetworkofcoordinatingprogramsandlocalcommunitiestoencouragepreservation-basedcommunityrevitalization,andhasequippedmorethan2,000oldercommercialdistrictswiththeskills,andorganizingframeworktheyneedforrenewalduringits35-yearhistory.
TheNationalMainStreetCenter,Inc.notesthat“since1980,over2,000communitieshavebeenpartofMainStreet,bringingrenewedenergyandactivitytoAmerica’sdowntownsandcommercialdistricts,securing$65.6billioninnewinvestment,creatingmorethan556,000netnewjobs,andrehabilitating260,000buildings.
TheMainStreetApproachbeginswithcreatingavisionforsuccessonMainStreetthatisrootedinasolidunderstandingofthemarketrealitiesofthedistrict,andisinformedbybroadcommunityengagement.MainStreetpromotesacommunity-drivenprocessthatbringsdiversestakeholdersfromallsectorstogether,invitingthemtobeproactiveparticipantsintherevitalizationprocess.Thisessentialstepprovidesafoundationforoutliningthecommunity’sownidentity,expectations,andidealswhileconfirmingrealandperceivedperceptions,needsandopportunities.Italsoensuresthatthevisionisatruereflectionofthediversityofthecommunity.
PopulationAttractionandRetentionStrategiesforRuralVictorianCommunities
DENCH MCCLEAN CARLSON – RMCG – REMPLAN July2017 14
Avisionofsuccessaloneisnotenough.Communitiesmustworktogethertoidentifykeystrategies,knownasCommunityTransformationStrategiesthatwillprovideaclearsenseofprioritiesanddirectionfortherevitalizationefforts.Typically,communitieswillfindtwotothreeCommunityTransformationStrategiesareneededtohelpreachacommunityvision.Thesestrategieswillfocusonbothlongandshort-termactionsthatwillmoveacommunityclosertoachievingitsgoals.
3.1.6 MarketingHometownAmerica
ThisprogramhasbeendevelopedbytheUniversityofNebraska.Theprogramprovidessupportforruralcommunitiestobeabletoundertakeaprocesstoattractpeopletoliveinruraltownsthroughtheidentificationofdesired,andshared,outcomes,thekeyassetsthatcanbeleveragedandthekeychallengestobeaddressed.
Theprojectsthatcommunitieshaveundertakenvaryaccordingtotheneedsofthecommunityinvolved.
Theprocesshasbeendevelopedusingfeedbackfrompeoplewhoareconsideringmovingtoaruralcommunity.
http://viewer.zmags.com/publication/29de58a3-/29de58a3/1
3.1.7 CostAdvantages
MostoftheStatesprovideinformationregardingtheirrelativestandingtootherStateswithrespecttothecostsassociatedwithmovingbusinessestoand/oroperatingabusiness.
3.1.8 InvestmentReadiness
ManyofthefundingprogramsthatStateGovernmentprovidetosupportlocalgovernments/townsrequirethemtobe“investmentready”.Whiletherecanabeanumberoffactorsthatrelatetobeinginvestmentreadythecommonrequirementrelatestohaving
• aneconomicdevelopmentstrategywithidentifiedpriorities
• appropriatetownplanning/landuseplanningframeworksinplace.
TheStateGovernmentswillprovidefundingfortheusetechnicalexpertise/consultingsupporttofacilitateinvestmentreadiness.
3.1.9 ImplicationsforPopulationAttractionProjects
• Strongfocusoncommunityeconomicdevelopmentrelatedprocessesincluding:-
• communityengagement
• afocusoncommunitywellbeing
• theidentificationandbroadagreementofthekeyassetsthatcanbeleveragedtoengagetheprivatesectorandgrowthelocaleconomy
• Importanceofresearchaboutunderstandingprioritiesofpeopleconsideringmovingtoruraltowns
• Availabilityofaccessible/lowcostfinance
• Accesstotechnicalsupport
PopulationAttractionandRetentionStrategiesforRuralVictorianCommunities
DENCH MCCLEAN CARLSON – RMCG – REMPLAN July2017 15
3.2 Canada
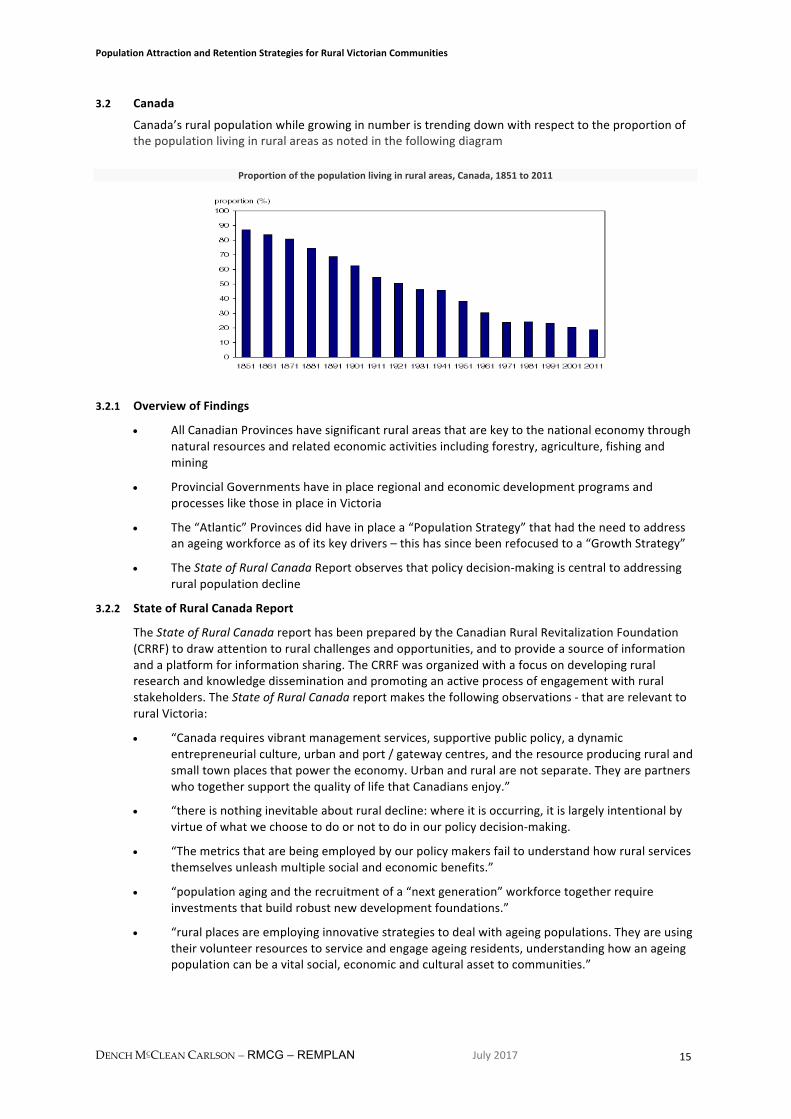
Canada’sruralpopulationwhilegrowinginnumberistrendingdownwithrespecttotheproportionofthepopulationlivinginruralareasasnotedinthefollowingdiagram
Proportionofthepopulationlivinginruralareas,Canada,1851to2011
3.2.1 OverviewofFindings
• AllCanadianProvinceshavesignificantruralareasthatarekeytothenationaleconomythroughnaturalresourcesandrelatedeconomicactivitiesincludingforestry,agriculture,fishingandmining
• ProvincialGovernmentshaveinplaceregionalandeconomicdevelopmentprogramsandprocesseslikethoseinplaceinVictoria
• The“Atlantic”Provincesdidhaveinplacea“PopulationStrategy”thathadtheneedtoaddressanageingworkforceasofitskeydrivers–thishassincebeenrefocusedtoa“GrowthStrategy”
• TheStateofRuralCanadaReportobservesthatpolicydecision-makingiscentraltoaddressingruralpopulationdecline
3.2.2 StateofRuralCanadaReport
TheStateofRuralCanadareporthasbeenpreparedbytheCanadianRuralRevitalizationFoundation(CRRF)todrawattentiontoruralchallengesandopportunities,andtoprovideasourceofinformationandaplatformforinformationsharing.TheCRRFwasorganizedwithafocusondevelopingruralresearchandknowledgedisseminationandpromotinganactiveprocessofengagementwithruralstakeholders.TheStateofRuralCanadareportmakesthefollowingobservations-thatarerelevanttoruralVictoria:
• “Canadarequiresvibrantmanagementservices,supportivepublicpolicy,adynamicentrepreneurialculture,urbanandport/gatewaycentres,andtheresourceproducingruralandsmalltownplacesthatpowertheeconomy.Urbanandruralarenotseparate.TheyarepartnerswhotogethersupportthequalityoflifethatCanadiansenjoy.”
• “thereisnothinginevitableaboutruraldecline:whereitisoccurring,itislargelyintentionalbyvirtueofwhatwechoosetodoornottodoinourpolicydecision-making.
• “Themetricsthatarebeingemployedbyourpolicymakersfailtounderstandhowruralservicesthemselvesunleashmultiplesocialandeconomicbenefits.”
• “populationagingandtherecruitmentofa“nextgeneration”workforcetogetherrequireinvestmentsthatbuildrobustnewdevelopmentfoundations.”
• “ruralplacesareemployinginnovativestrategiestodealwithageingpopulations.Theyareusingtheirvolunteerresourcestoserviceandengageageingresidents,understandinghowanageingpopulationcanbeavitalsocial,economicandculturalassettocommunities.”
PopulationAttractionandRetentionStrategiesforRuralVictorianCommunities
DENCH MCCLEAN CARLSON – RMCG – REMPLAN July2017 16
• “InNewfoundland,weseethesuccessofengagingyoungentrepreneurstoaddress,inpart,localeconomicdecline.Whiletherearehurdlestoovercome,theiryouth-orientedentrepreneurshipprogramsarehelpingtorevitalizecommunityeconomiesandbuildimportantskillsforthefuture.
• “wearefacingacriticalwindowforsuccessionplanninginbusinessesacrossthecountry.
• “Ruralcommunitiesthemselvesmustbeactiveparticipantsinunderstanding,planningandinvestingintheirownfutures-AnecessaryshiftforruralCanadafromcasemaking(i.e.,repeatedlymakingthecasethatruralcommunitiesdeservemorehelpandattention),toplacemaking(i.e.,gettingonwiththetaskofplanningandbuildingcommunitieswithahighqualityoflifethatwillattractandretainbothresidentsandcapital).”
3.2.3 BritishColumbia
Nospecificpopulationattractionstrategy–focusonabroaderapproach–“onarisingtideallboatswillfloat”.TheProvincialGovernmentprovideswebsiteforeconomicdevelopmentwith“toolkits”andsuccessstoriesfromseveralsectors/locationsinBC.Manyofthesesuccessstoriesemphasizetheimportanceofcommunitiescomingtogethertoidentifyandagreekeypriorities
http://www2.gov.bc.ca/gov/content/employment-business/economic-development/success-stories
3.2.4 Alberta
Nospecificpopulationattractionstrategy.Alberta'sRegionalEconomicDevelopmentAlliances(REDAs)developedoutofaneedtostimulatelong-termeconomicdevelopmentandgrowthstrategiesinAlberta'sruralandurbancommunities.REDAsinAlbertaareautonomousgrassroots-basednon-profitorganizationscomprisedofmembercommunitiesandregionalstakeholdersthatworktogethertofosterbusinessdevelopmentandprosperityinadefinedgeographicarea.Thiscollaborationandcooperationenablesmembersandstakeholderstoundertakeprojectsthattheycouldnotnecessarilydoontheirown.
AreviewofREDAwebsitesnotesthatallhaveinformationregardingmovingtoand/orinvestingintheregion.Somesitesindicate“development”projectsbeingundertakenbytheREDA
http://communityeconomicdevelopment.alberta.ca/regional-economic-development-alliances-redas/
3.2.5 AtlanticProvinces
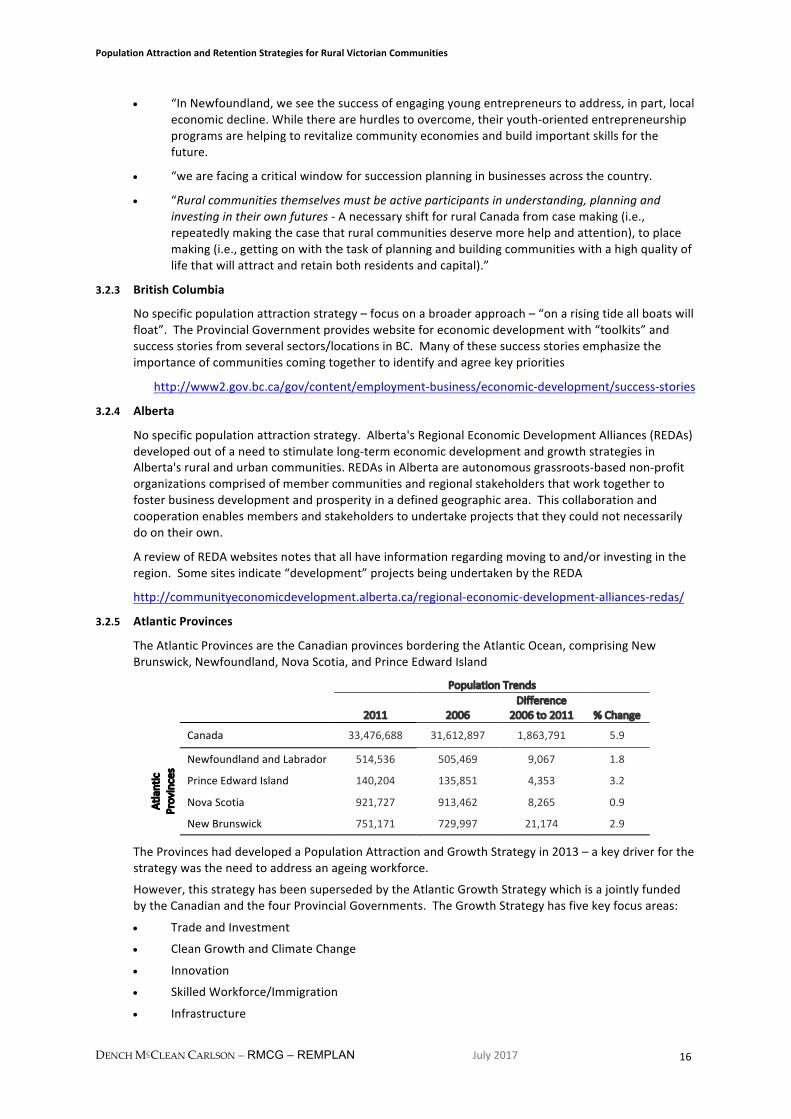
TheAtlanticProvincesaretheCanadianprovincesborderingtheAtlanticOcean,comprisingNewBrunswick,Newfoundland,NovaScotia,andPrinceEdwardIsland
PopulationTrends
2011 2006Difference
2006to2011 %Change Canada 33,476,688 31,612,897 1,863,791 5.9
Atlantic
Provinces
NewfoundlandandLabrador 514,536 505,469 9,067 1.8
PrinceEdwardIsland 140,204 135,851 4,353 3.2
NovaScotia 921,727 913,462 8,265 0.9
NewBrunswick 751,171 729,997 21,174 2.9
TheProvinceshaddevelopedaPopulationAttractionandGrowthStrategyin2013–akeydriverforthestrategywastheneedtoaddressanageingworkforce.
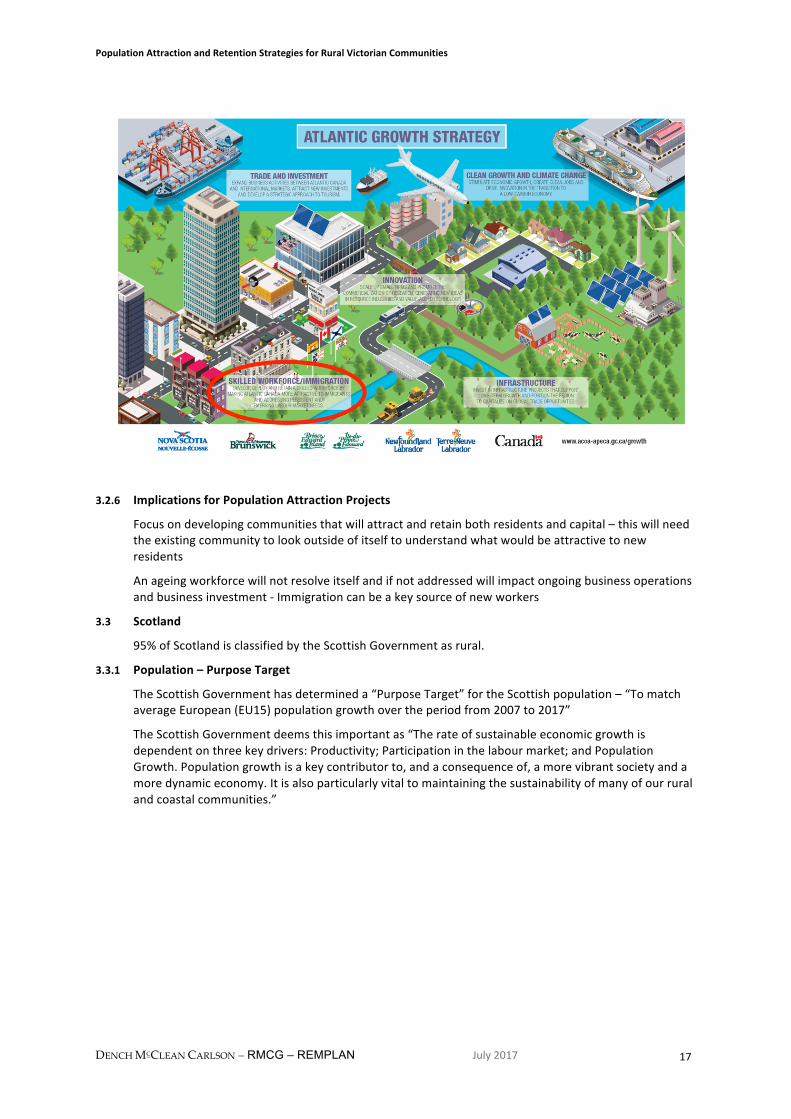
However,thisstrategyhasbeensupersededbytheAtlanticGrowthStrategywhichisajointlyfundedbytheCanadianandthefourProvincialGovernments.TheGrowthStrategyhasfivekeyfocusareas:
• TradeandInvestment
• CleanGrowthandClimateChange
• Innovation
• SkilledWorkforce/Immigration
• Infrastructure
PopulationAttractionandRetentionStrategiesforRuralVictorianCommunities
DENCH MCCLEAN CARLSON – RMCG – REMPLAN July2017 17
3.2.6 ImplicationsforPopulationAttractionProjects
Focusondevelopingcommunitiesthatwillattractandretainbothresidentsandcapital–thiswillneedtheexistingcommunitytolookoutsideofitselftounderstandwhatwouldbeattractivetonewresidents
Anageingworkforcewillnotresolveitselfandifnotaddressedwillimpactongoingbusinessoperationsandbusinessinvestment-Immigrationcanbeakeysourceofnewworkers
3.3 Scotland
95%ofScotlandisclassifiedbytheScottishGovernmentasrural.
3.3.1 Population–PurposeTarget
TheScottishGovernmenthasdetermineda“PurposeTarget”fortheScottishpopulation–“TomatchaverageEuropean(EU15)populationgrowthovertheperiodfrom2007to2017”
TheScottishGovernmentdeemsthisimportantas“Therateofsustainableeconomicgrowthisdependentonthreekeydrivers:Productivity;Participationinthelabourmarket;andPopulationGrowth.Populationgrowthisakeycontributorto,andaconsequenceof,amorevibrantsocietyandamoredynamiceconomy.Itisalsoparticularlyvitaltomaintainingthesustainabilityofmanyofourruralandcoastalcommunities.”
PopulationAttractionandRetentionStrategiesforRuralVictorianCommunities
DENCH MCCLEAN CARLSON – RMCG – REMPLAN July2017 18
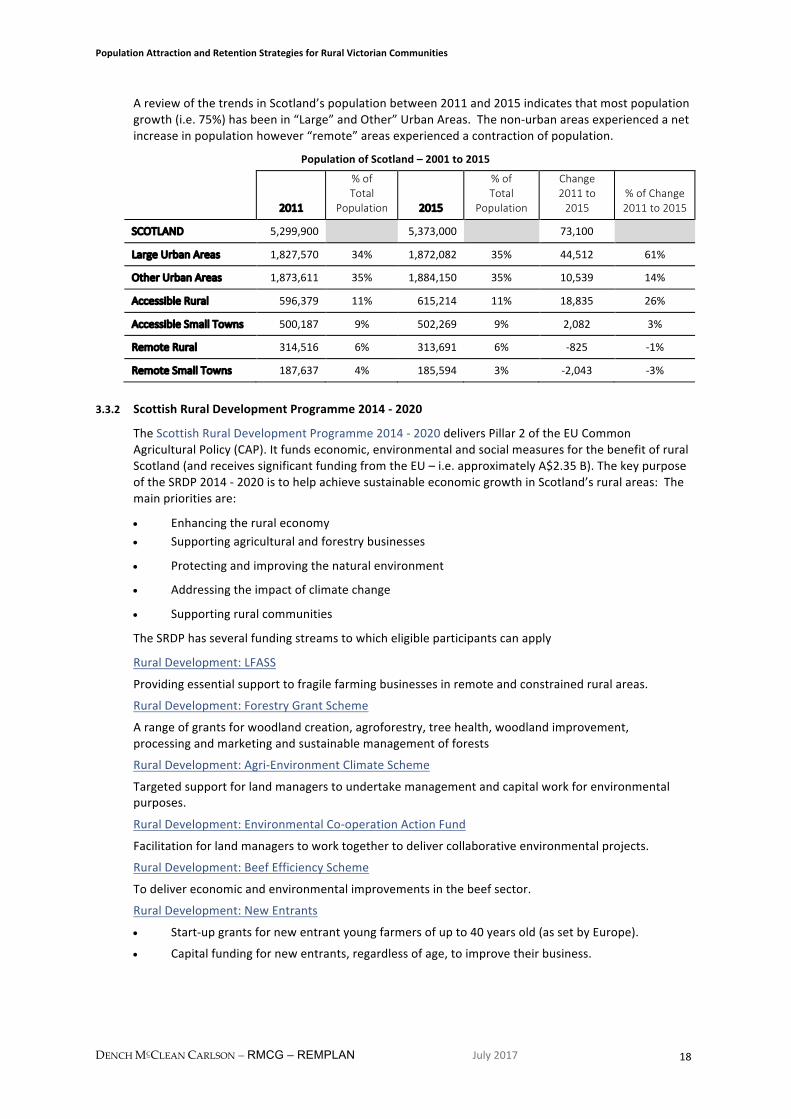
AreviewofthetrendsinScotland’spopulationbetween2011and2015indicatesthatmostpopulationgrowth(i.e.75%)hasbeenin“Large”andOther”UrbanAreas.Thenon-urbanareasexperiencedanetincreaseinpopulationhowever“remote”areasexperiencedacontractionofpopulation.
PopulationofScotland–2001to2015
2011
%ofTotal
Population 2015
%ofTotal
Population
Change2011to2015
%ofChange2011to2015
SCOTLAND 5,299,900 5,373,000 73,100
LargeUrbanAreas 1,827,570 34% 1,872,082 35% 44,512 61%
OtherUrbanAreas 1,873,611 35% 1,884,150 35% 10,539 14%
AccessibleRural 596,379 11% 615,214 11% 18,835 26%
AccessibleSmallTowns 500,187 9% 502,269 9% 2,082 3%
RemoteRural 314,516 6% 313,691 6% -825 -1%
RemoteSmallTowns 187,637 4% 185,594 3% -2,043 -3%
3.3.2 ScottishRuralDevelopmentProgramme2014-2020
TheScottishRuralDevelopmentProgramme2014-2020deliversPillar2oftheEUCommonAgriculturalPolicy(CAP).Itfundseconomic,environmentalandsocialmeasuresforthebenefitofruralScotland(andreceivessignificantfundingfromtheEU–i.e.approximatelyA$2.35B).ThekeypurposeoftheSRDP2014-2020istohelpachievesustainableeconomicgrowthinScotland’sruralareas:Themainprioritiesare:
• Enhancingtheruraleconomy• Supportingagriculturalandforestrybusinesses
• Protectingandimprovingthenaturalenvironment
• Addressingtheimpactofclimatechange
• Supportingruralcommunities
TheSRDPhasseveralfundingstreamstowhicheligibleparticipantscanapply
RuralDevelopment:LFASS
Providingessentialsupporttofragilefarmingbusinessesinremoteandconstrainedruralareas.
RuralDevelopment:ForestryGrantScheme
Arangeofgrantsforwoodlandcreation,agroforestry,treehealth,woodlandimprovement,processingandmarketingandsustainablemanagementofforests
RuralDevelopment:Agri-EnvironmentClimateScheme
Targetedsupportforlandmanagerstoundertakemanagementandcapitalworkforenvironmentalpurposes.
RuralDevelopment:EnvironmentalCo-operationActionFund
Facilitationforlandmanagerstoworktogethertodelivercollaborativeenvironmentalprojects.
RuralDevelopment:BeefEfficiencyScheme
Todelivereconomicandenvironmentalimprovementsinthebeefsector.
RuralDevelopment:NewEntrants
• Start-upgrantsfornewentrantyoungfarmersofupto40yearsold(assetbyEurope).
• Capitalfundingfornewentrants,regardlessofage,toimprovetheirbusiness.
PopulationAttractionandRetentionStrategiesforRuralVictorianCommunities
DENCH MCCLEAN CARLSON – RMCG – REMPLAN July2017 19
RuralDevelopment:CroftingAgriculturalGrantScheme
Grantsto*crofterstotakeforwardimprovementsontheircroftswhichwillhelptosustaintheirbusiness.
*Note-Acrofterisonewhohastenureanduseoftheland,typicallyasatenantfarmer,especiallyinruralareas
RuralDevelopment:FoodProcessing,MarketingandCo-operation
SupportforSMEsinthefoodanddrinksectorwithstart-upgrantsfornewenterprises,andbusinessdevelopmentgrants.
RuralDevelopment:SmallFarmsGrantScheme
Targetedsupportforsmallfarmsthatfacesimilarissuesascroftersregardingsustainability.
RuralDevelopment:KnowledgeTransferandInnovationFund(KITF)
Takingadvantageofstrongperformanceinresearchanddevelopmentandensuringthatthelearningfromhereandelsewherecanbetransferredtoonthegroundimprovement.KTIFwillassistinthesharingandimplementationofinnovativewaysofimprovingworkingpracticesalongwithcontinuingsupportforMonitorFarms.
RuralDevelopment:AdvisoryService
ExpandedAdvisoryServicewhichwillprovideadviceandassistancetofarmers,croftersandotherlandmanagers.Weareaimingforthistobeavailablefrom2016.
RuralDevelopment:Broadband
Supportforbroadbandprovisioninruralareas.
ScottishRuralNetwork
Supportingandpromotingruraldevelopmentthroughthesharingofideasandbestpractice.
3.3.3 LEADER
LEADERisabottom-upmethodofdeliveringsupporttocommunitiesforruraldevelopment–thisprogramrunsthroughouttheEU.TheaimofLEADERistoincreasesupporttolocalruralcommunityandbusinessnetworkstobuildknowledgeandskills,andencourageinnovationandcooperationtotacklelocaldevelopmentobjectives.GrantsareawardedbyLocalActionGroupstoprojectsthatsupportdeliveryofaLocalDevelopmentStrategy.LocalDevelopmentStrategiesincludeactionsthatwillallowindividuals,communitiesandbusinessesto:
• drivecommunityactiononclimatechange
• enhanceruralservicesandfacilities,includingtransportinitiatives
• enhancenatural/culturalheritage,tourismandleisure
• supportfoodanddrinkinitiatives(forexampleshortsupplychains,communityfood)
• buildco-operationwithotherLAGsinScotland,UKandEurope
• exchangelearningandknowledgewitheachother,realisetheirpotential,buildopportunitiesforall
3.3.4 ImplicationsforPopulationAttractionProjects
Recognitionoftheimportanceofpopulationgrowthtooveralleconomicgrowth
Involvementofcommunitiesinidentifying/developingrelevantsolutions
Accesstosignificantlevelsoffunding-programstargetedatspecificruralneeds/relatedsectors–includingsupportfornewentrants
Sharing/exchangeofknowledgeandlearnings
PopulationAttractionandRetentionStrategiesforRuralVictorianCommunities
DENCH MCCLEAN CARLSON – RMCG – REMPLAN July2017 20
3.4 Australia
AreviewofprogramsandprocessinAustraliaidentifiesthattheCommonwealth,andallStateGovernmentsareattemptinginvariouswaystoaddressgrowthinregionalandruralareas.Thecommonthemeistheidentificationandprioritizationofprojectsthatareseentosupportimprovedeconomicand/orcommunityoutcomeswithinvariousregionsineachState.
TheonlyStatethathasaformal“populationattraction”strategyinplaceisTasmaniaincludingatargetforthelevelofpopulationtobeachieved.
3.4.1 CommonwealthGovernment
TheCommonwealthGovernmentsupportsregionalandruraldevelopmentthroughawiderangeofinitiativesacrossarangeofgovernmentdepartments.
RegionalAustraliaMinisterialTaskforce
TheRegionalAustraliaMinisterialTaskforcechairedbythePrimeMinisterwillaimtoimprovethelivesofrural,regionalandremoteAustralians.Itwillcomeupwithideasacrossportfoliosincludinghealth,education,transportandinfrastructure,employment,industryandcommunications.
Regions2030
TheCommonwealthGovernmenthasrecentlyreleaseditsRegions2030policywhichbringtogetherexistingandnewfundingprogramsaimedatsupportgrowthinregionalandruralAustraliawithafocusonthefollowingareas:
• Jobsandeconomicdevelopment
• Infrastructure
• Health
• Education
• Communications
DepartmentofInfrastructureandRegionalDevelopment
TheDepartmentprovides:
• arangeofprograms“whicharefundedundertheInfrastructureInvestmentProgrammeaswellastheRegionalandCommunityProgrammes.Additionalfundingassistanceisalsoofferedforlocalroads.”–notalloftheseprogramsareavailabletoruralVictoria
• adviceandassistancetodepartmentsandagenciescompletingRegionalAustraliaImpactStatements(RAIS)aspartofthepolicydevelopmentandCabinetsubmissionprocess
DecentralisationofGovernmentDepartments
MorerecentlytheMinisterforInfrastructureandRegionalDevelopmenthasrequiredallMinsterstoprovideinformationregardingthepotentialtomovemajorcity-baseddepartmentsandagenciesintoregionalAustralia.Thisinformationwillbeusedtodevelopbusinesscasesforsuchmovementbylate2017
CommunityDevelopmentFinancialInstitutions(CDFI)PilotProject
TheAustraliaGovernmentnotedtheworkofCommunityDevelopmentFinancialInstitutions(CDFI)intheUSAandUK–seeSection3.1.4.
In2014,theAustralianGovernment–throughtheDepartmentofSocialServices-undertookaCommunityDevelopmentFinancialInstitutions(CDFI)PilotProject–TheCDFIpilotprojectsoughtto“buildthecapacityandresilienceofdisadvantagedandfinanciallyexcludedindividualsbyattractinginvestmentandinjectingfundsintocommunityfinanceorganisationsthatofferthemfinancialservicesandproductsthattheywouldotherwisenotbeabletoaccessfrommainstreamsources.”
PopulationAttractionandRetentionStrategiesforRuralVictorianCommunities
DENCH MCCLEAN CARLSON – RMCG – REMPLAN July2017 21
Theevaluationofthepilotrecommendedthatoneoftherecommendationsarisingfromanevaluationofthepilotwasto“Extendthepilotforafurtherthreeyears.ThiswouldallowtimetoconductamorethoroughanalysisofthelongitudinalimpactsofCDFIsonfinancialexclusion.ItwouldalsofacilitatethedevelopmentofaCDFIsectorinAustralia”thefullevaluationcanbefoundathttps://www.dss.gov.au/sites/default/files/documents/02_2013/cdfi_evaluation_report_0.pdf
3.4.2 Queensland
EconomicDevelopmentQueensland(EDQ)hasestablishedtheAdvancingOurCitiesandRegionsStrategy.EDQnotesthatthe“Advancingourcitiesandregionsstrategyisaninnovativeapproachtorenewingandrepurposingsurplusandunderutilisedstatepropertytodeliverbettercommunityoutcomes,createjobsanddriveeconomicgrowth.
http://www.edq.qld.gov.au/infrastructure/advancing-our-cities-and-regions-strategy.html
PropertyQueenslandwithintheDepartmentofStateDevelopmentisworkingwithgovernmentland-owningagenciestoidentifysitesthatrepresentpropertyopportunitiesthatwilldeliverongovernmentpriorities, andgenerateeconomicdevelopmentandcommunityoutcomes.
Tohelpachievethisstrategy,eighteconomicandcommunityzoneshavebeenidentifiedwhereEconomicDevelopmentQueensland(EDQ)willleadthedeliveryofarangeofprojects,manyofwhichwillbeiconicdevelopmentstotransformprecinctsandcatalyseeconomicgrowthanddiversificationinourcitiesandregions.”
Developmentswillneedtodeliverstrongcommunitybenefits,meetbroadergovernmentprioritiessuchasinnovation,affordablehousingandexpandedtourism,andwillinvolveengagementwithlocalgovernments,thecommunity,stakeholdersandindustry.
NewprojectswillalsobuildonEDQ'sexistingdevelopmentportfolioofcommunity,residential,urbanrenewalandindustrialdevelopmentsandprovideadditionalincomeforreinvestmentinfutureinfrastructureprojects.
ProjectsofNote
AgeinginPlacepilotprojecthttp://www.edq.qld.gov.au/infrastructure/ageing-in-place-pilot-project.html
TheAgeinginPlacepilotprojectisaboutcaringforpeopleastheyentertheirsenioryearsbyprovidingsuitablehousingoptionstoenablepeopletostayintheirtowns,closetofriendsandfamily.Theprojectwillenhanceregionalliveabilityandsupportsustainabilityinlocalcommunitieswherethereisashortfallindwellingssuitableforolderpeople.OftenresidentsinmoreremoteorregionaltownsthroughoutQueenslandareconfrontedwiththedifficultdecisiontomovetoabiggercentrebecauseofalackofappropriateaccommodationintheirowncommunities.
IndustrialIncubator
Conceptistoprovidefacilitiestosupportstart-up“industrial”businesses–i.e.tradeservices,constructionetc.inruralcentres
3.4.3 NewSouthWales
TheNSWGovernmenthasestablishedtheRegionalDevelopmentFramework:whichhasthefollowingkeyareasoffocus:-
Program1:providingqualityservicesandinfrastructureinregionalNSW
Program2:aligningefforttosupportgrowingregionalcentres
Program3:identifyingandactivatingeconomicpotential
http://www.industry.nsw.gov.au/invest-in-nsw/regional-opportunities/regional-development-framework
TheprocessforidentifyingregionalprioritiesinNSWisyettobeimplemented.TheRegionalLeadershipGroupwillbecomethecoredecisionmakinggroupforeachregion.Itwillconsistofwillincludethe“rightpeoplefromeachagencyinvolvedinon-the-groundregionaldeliveryaswellasrepresentatives
PopulationAttractionandRetentionStrategiesforRuralVictorianCommunities
DENCH MCCLEAN CARLSON – RMCG – REMPLAN July2017 22
fromJointOrganisationsand/orRegionalOrganisationsofCouncils,andtherelevantRegionalParliamentarySecretary.TheRegionalLeadershipGroupwillagreeontheprioritiesforeachregion
TheimplementationoftheRegionalDevelopmentFrameworkwillbesupportedby
TheRegionalEnablersProject
TheRegionalEnablersProjectseekstoidentifythekeyeconomicdriversforregionssothatinvestmentscanbetargetedtothosesectors.ThisprojecthasalreadybeenpilotedinthreeregionsandisbeingrolledoutacrosstheState.
TheRegionalEconomicOpportunitiesandInfrastructurePrioritiesProject
TheRegionalEconomicOpportunitiesandInfrastructurePrioritisationProjectwillinvolveacomprehensiveliteraturereviewofproposalsfromalllevelsofgovernmentandnon-governmentorganisations,andtargetedstakeholderengagementtoidentifythekeyeconomicopportunitiesandbarriersinregionalNSW.TheprojectwillapplymodellingtoprioritiseprojectssothatinformationcaninformtheworkofInfrastructureNSW.
EnhancingCostBenefitAnalysis
TheDepartmentofIndustryislookingatwaysofenhancingitscostbenefitanalysistoensurethatestimatesareaccurate,reliableandbasedoncomprehensiveinformation.Thiswillinvolvetakingintoconsiderationnon-marketbenefitsandcommercialassessmentsofflowonprospects.Inusingthismethodology,itisexpectedthatresourceswillbemoreefficientlyallocatedtoactivitieswiththebestlongtermbenefitsforregionalcommunitiesandtheState.
3.4.3.1 Evocities
Thisisacollaborationofsevenregionalcitiestopromotetheadvantagesofliving/investinginaregionalcity.TheEvoCitieswebsitesnotesthatthe“campaignaimstochangeperceptionsoflifeinaregionalcityandencouragepeopletolive,workandinvestinanEvoCity.ItshowcasestheabundanceofopportunitiesintheEvocitiesduetotheirlowercostofliving,strongcareerandbusinessopportunitiesandenhancedlifestyle.
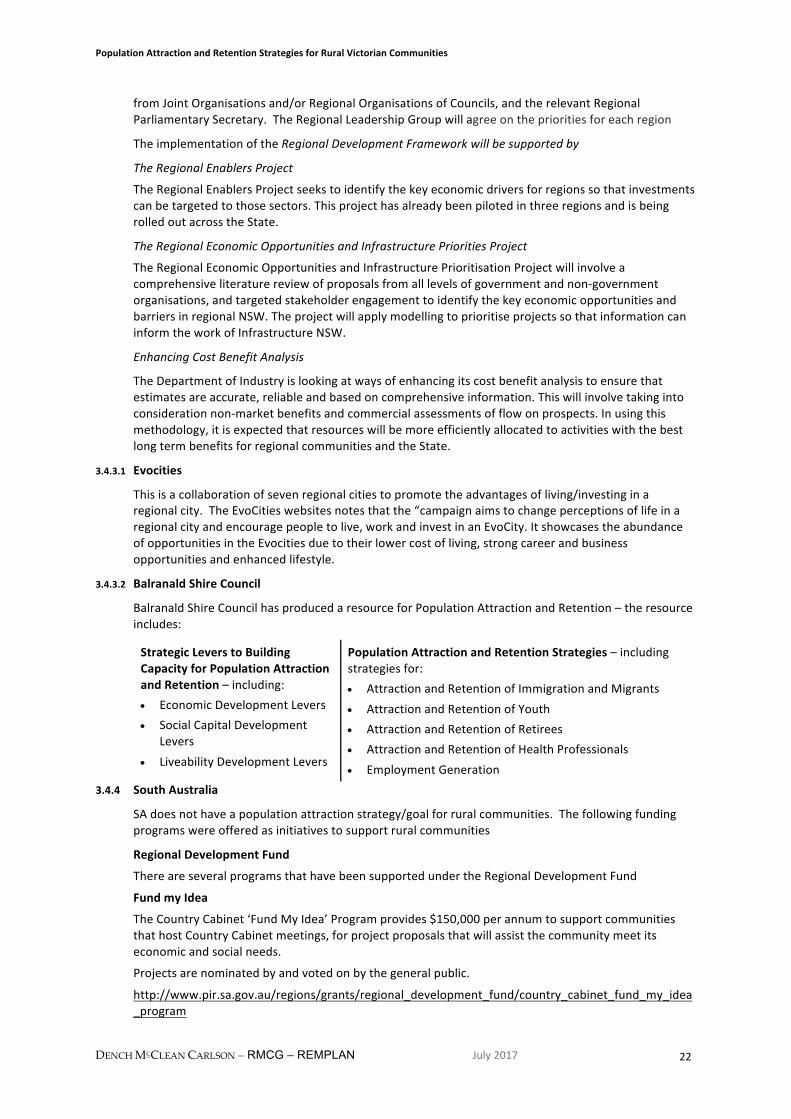
3.4.3.2 BalranaldShireCouncil
BalranaldShireCouncilhasproducedaresourceforPopulationAttractionandRetention–theresourceincludes:
StrategicLeverstoBuildingCapacityforPopulationAttractionandRetention–including:• EconomicDevelopmentLevers• SocialCapitalDevelopment
Levers• LiveabilityDevelopmentLevers
PopulationAttractionandRetentionStrategies–includingstrategiesfor:• AttractionandRetentionofImmigrationandMigrants• AttractionandRetentionofYouth• AttractionandRetentionofRetirees• AttractionandRetentionofHealthProfessionals• EmploymentGeneration
3.4.4 SouthAustralia
SAdoesnothaveapopulationattractionstrategy/goalforruralcommunities.Thefollowingfundingprogramswereofferedasinitiativestosupportruralcommunities
RegionalDevelopmentFund
ThereareseveralprogramsthathavebeensupportedundertheRegionalDevelopmentFund
FundmyIdea
TheCountryCabinet‘FundMyIdea’Programprovides$150,000perannumtosupportcommunitiesthathostCountryCabinetmeetings,forprojectproposalsthatwillassistthecommunitymeetitseconomicandsocialneeds.
Projectsarenominatedbyandvotedonbythegeneralpublic.
http://www.pir.sa.gov.au/regions/grants/regional_development_fund/country_cabinet_fund_my_idea_program
PopulationAttractionandRetentionStrategiesforRuralVictorianCommunities
DENCH MCCLEAN CARLSON – RMCG – REMPLAN July2017 23
RegionalFoodInitiatives
TheRegionalFoodInitiativesProgramhascommitted$600,000overatwo-yearperiodbetween2014-16tosupportregionally-basedfoodorganisationstobuildastrongerregionalfoodpresenceinSouthAustralia
http://www.pir.sa.gov.au/regions/grants/regional_development_fund/regional_food_initiatives_program
MajorProjects
TheMajorProjectsProgramsupportsmajoreconomicprojectsdesignedtostrengthenregionalindustries,supportlocaleconomiesandopportunitiesthroughinvestmentinstrategicprojects.
http://www.pir.sa.gov.au/regions/grants/regional_development_fund/major_projects_program
CommunityInfrastructure
TheCommunityInfrastructureProgramsupportsinvestmentinregionalcommunitiestodeveloptheireconomicinfrastructureandgrowtheircapabilitiesasafoundationforfuturejobsandeconomicgrowth.
http://www.pir.sa.gov.au/regions/grants/regional_development_fund/community_infrastructure_program
SmallGrants
In2014-15theSmallGrantsProgramawardedover$1.29milliontosupportnewregionalemploymentandinvestmentopportunitieslinkedwithStateGovernmentpriorities.
http://www.pir.sa.gov.au/regions/grants/regional_development_fund/small_grants_program
SouthAustralianRiverMurraySustainabilityProgram
TheRiverMurrayiscentraltothesocialandeconomicstructureoftheSouthAustralianMurray-DarlingBasinregion.
Therivercorridorishometomorethan90,000peoplewhorelyontheprosperityoftheirlocalindustriestosustaintheircommunities.
Byworkingtodevelopmoreindustriesintheregionthatarelessdependentonwater,ourrivercommunitiesarebetterplacedtorespondandbemoreresilienttotheeffectsoffluctuatingwateravailabilityandfutureclimatechangechallenges.
SARMSishelpingto:
• buildstrongandsustainableirrigationcommunities
• securewaterresourcesneededforahealthyenvironmentandaprosperousstate
• boostregionalproductivityandhelprivercommunitiesadapttoafutureofreducedwateravailability.
http://pir.sa.gov.au/regions/sarms
IndustryParticipationpolicy
TheSouthAustralianIndustryParticipationPolicy(IPP)specifiesthatforallexpenditureabove$33,000,thegovernmentmustdetermineifthereisabusinessinthestateortheregionthatcandelivertheproductorservice.
www.industryadvocate.sa.gov.au/industry-participation-policy
3.4.5 WesternAustralia
WA’sDepartmentofRegionalDevelopmentadvisesthatthereisnoruralpopulationattractionstrategy.Thedepartmentpromotesandfacilitatestheeconomic,businessandsocialdevelopmentofnineregionsinWesternAustralia:
Kimberley
Pilbara
Gascoyne
MidWest
Wheatbelt
Peel
SouthWest
GreatSouthern
Goldfields-Esperance
PopulationAttractionandRetentionStrategiesforRuralVictorianCommunities
DENCH MCCLEAN CARLSON – RMCG – REMPLAN July2017 24
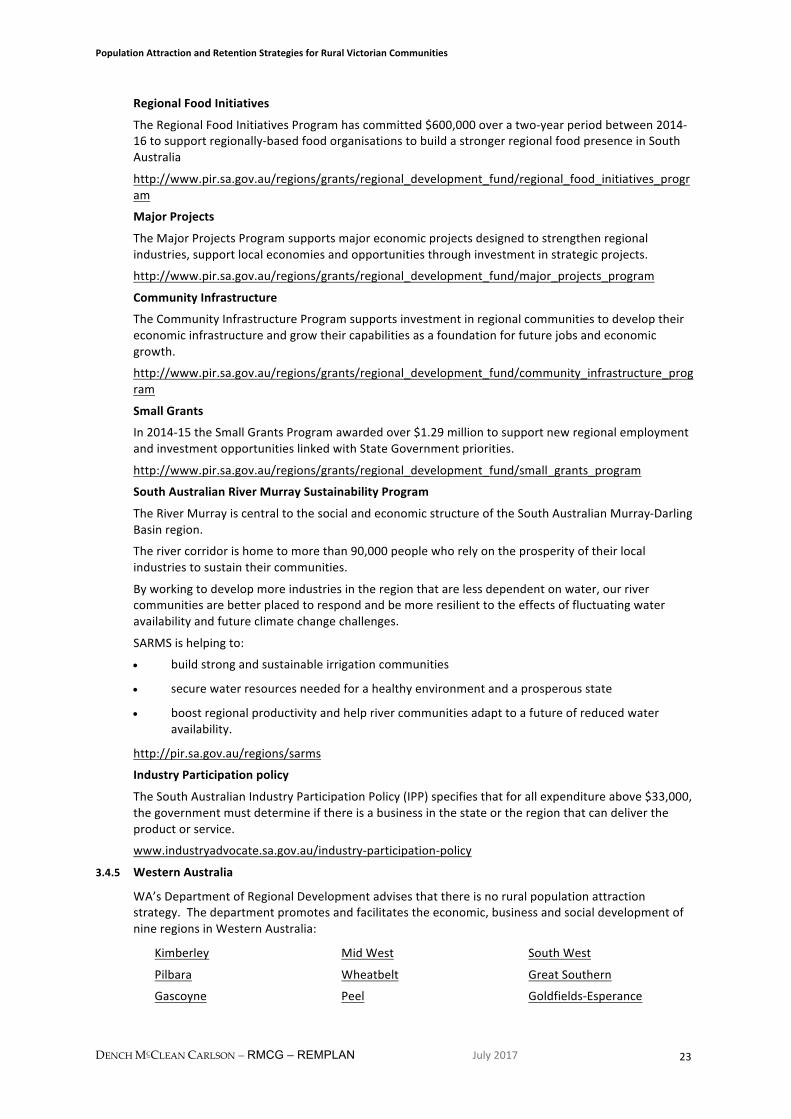
MajorProjects
Theregionaldevelopmentorganizationforeachoftheabovehaveidentifiedarangeofmajorprojects–thesehavebeenclassifiedintothefollowingareasofstrategicfocus
• AboriginalInitiatives
• Agriculture
• Community&Culture
• EconomicDevelopment
• Education
• Health
• Housing
• Justice
• Parks,Wildlife&Environment
• Recreation&Sport
• Roads&Transport
• Tourism
• Water
Note-TheRegionsandMajorProjectslistedabovearelinkedtotherespectivewebpages
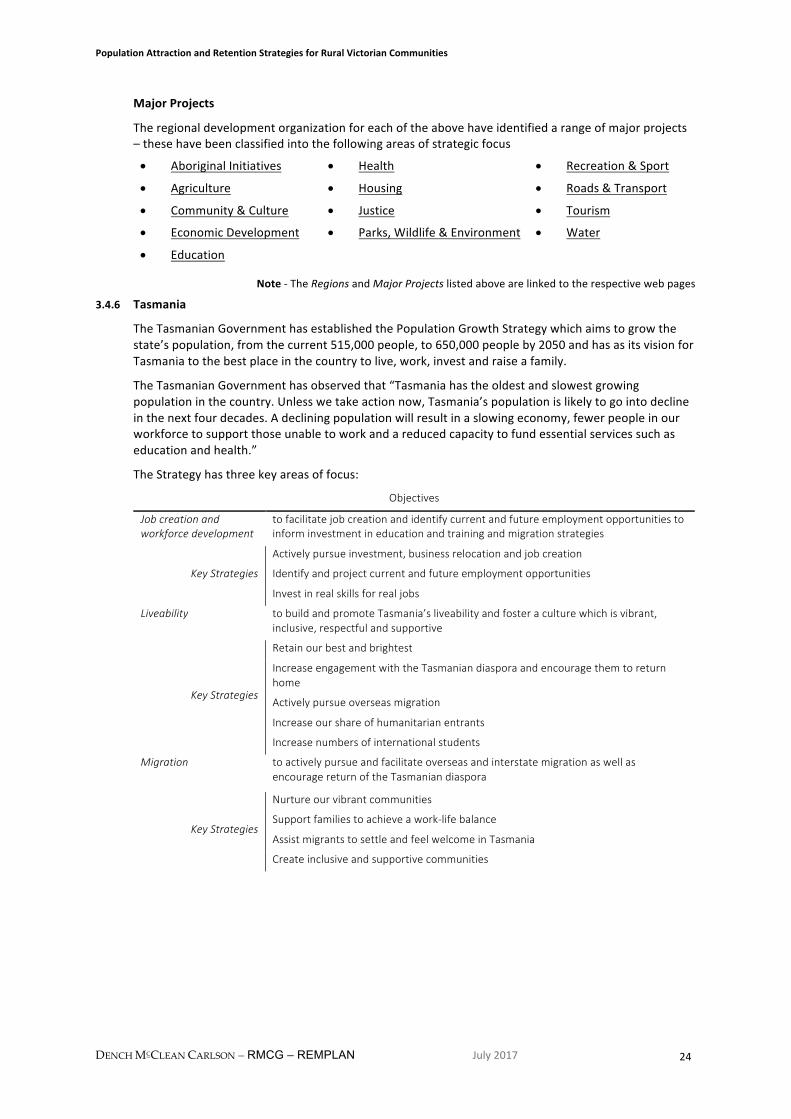
3.4.6 Tasmania
TheTasmanianGovernmenthasestablishedthePopulationGrowthStrategywhichaimstogrowthestate’spopulation,fromthecurrent515,000people,to650,000peopleby2050andhasasitsvisionforTasmaniatothebestplaceinthecountrytolive,work,investandraiseafamily.
TheTasmanianGovernmenthasobservedthat“Tasmaniahastheoldestandslowestgrowingpopulationinthecountry.Unlesswetakeactionnow,Tasmania’spopulationislikelytogointodeclineinthenextfourdecades.Adecliningpopulationwillresultinaslowingeconomy,fewerpeopleinourworkforcetosupportthoseunabletoworkandareducedcapacitytofundessentialservicessuchaseducationandhealth.”
TheStrategyhasthreekeyareasoffocus:
Objectives
Jobcreationandworkforcedevelopment
tofacilitatejobcreationandidentifycurrentandfutureemploymentopportunitiestoinforminvestmentineducationandtrainingandmigrationstrategies
KeyStrategies
Activelypursueinvestment,businessrelocationandjobcreation
Identifyandprojectcurrentandfutureemploymentopportunities
Investinrealskillsforrealjobs
Liveability tobuildandpromoteTasmania’sliveabilityandfosteraculturewhichisvibrant,inclusive,respectfulandsupportive
KeyStrategies
Retainourbestandbrightest
IncreaseengagementwiththeTasmaniandiasporaandencouragethemtoreturnhome
Activelypursueoverseasmigration
Increaseourshareofhumanitarianentrants
Increasenumbersofinternationalstudents
Migration toactivelypursueandfacilitateoverseasandinterstatemigrationaswellasencouragereturnoftheTasmaniandiaspora
KeyStrategies
Nurtureourvibrantcommunities
Supportfamiliestoachieveawork-lifebalance
AssistmigrantstosettleandfeelwelcomeinTasmania
Createinclusiveandsupportivecommunities

PopulationAttractionandRetentionStrategiesforRuralVictorianCommunities
DENCH MCCLEAN CARLSON – RMCG – REMPLAN July2017 25
3.4.7 Victoria
Thereisnopolicywithrespecttopopulationattractiontoregional/ruralVictoria.AllregionshavecompletedaRegionalGrowthPlanthatidentifiedwherefuturepopulationgrowthcanbeaccommodatedandthedevelopmentrequiredtosupportpopulationgrowth.
RegionalPlans
RegionsinVictoriahavedevelopedregionalplansthathaveidentifieddevelopmentprioritiesfortheregion.Thevariousregionsallaspireregardinggrowth–therearenospecificpopulationtargetsespousedbysuchplans.
RegionalPartnerships
MorerecentlytheStateGovernmenthasintroducednineRegionalPartnershipsacrossregionalandruralVictoria.Thepartnershipsaimtoengagewithcommunitiesonprioritiesfortheirregion,buildingonexistingstrategiesandplans-harnessingthegoodideas,theenergyandthepassionoflocals.PrioritieswillbepresenteddirectlytotheVictorianGovernment’sRuralandRegionalMinisterialCommittee.
BarwonSouthWestRegion
TheBarwonSouthWest(BSW)RDACommitteehasundertakenthedevelopmentofastudythatseekstoidentifyhowtheregioncanattractmorepeopletoresideand/orinvestintheBSWregion–thestudyidentified:
• asummaryofpopulationinfluences,drivers,attractorsandbarriersinthecontextofregionalVictoriaandtheBarwonSouthWest.ThesefallwithinfourkeyareasofLifestyle,Economic,Environment,andConnections
LIFESTYLE ECONOMICINFLUENCE/TRENDS Ageing agricultural workforce Ageing population - need for health services
DRIVERS Regional centre services Diverse range of services
INFLUENCE/TRENDS Reducing agricultural labour intensity Strong population growth in metropolitan Melbourne, decreasing affordability.
DRIVERS Regional centre employment Diverse range of jobs
ATTRACTORS Education Pace of life Health services Shopping
BARRIERS Lack of health and other services
ATTRACTORS Lower cost of living/housing Jobs
BARRIERS Lack of relevant employment Lower pay Cost of relocation Internet speed and availability
ENVIRONMENT CONNECTIONS
INFLUENCE/TRENDS Tree change, sea change movement (s)
DRIVERS Coastal amenity
INFLUENCE/TRENDS Social and professional/business networks
DRIVERS Inclusive communities
ATTRACTORS Natural beauty
BARRIERS Distance - many towns and areas are too far to commute to a regional centre
ATTRACTORS Family and friends Return migration
BARRIERS No social networks Loss of professional networks Responsibility to care for elderly relatives in current location
• targetmarketsmostlikelytobeattractedtotheregionandbestalignedwithexistingeconomicandlifestyleopportunitiesintheBSW:
• Overseasmigrants,includingskilledmigrantsandrecentmigrantgroupsalreadyinMelbourne;
• Students,includingbothregionalandmetropolitanstudents;
PopulationAttractionandRetentionStrategiesforRuralVictorianCommunities
DENCH MCCLEAN CARLSON – RMCG – REMPLAN July2017 26
• Regionalreturners,especiallyyoungfamilies;
• Businessowners,bothexistingwithintheregionandthosewithinmetropolitanMelbournewithpotentialtomovetoregionalareasorsetuparegionaloffice;and
• “Planttheseed”:touristsandstudentswhomayvisittheregionshortterm,andthenreturntoresideatalatertime.
• Objectiveswithrespecttoattractingpopulation:
Objective1: establishincentivesforbusinessesandgovernmentagenciestorelocatetotheregion
Objective2: attractskilled,youngAustralianstoliveintheBSW,especiallydiaspora
Objective3: addresslabourshortagesandincreaselocalpopulationthroughtargetedmigration
Objective4: retainandimprovehighereducationopportunitiesintheregion
Objective5: promoteliveabilitygains,especiallyinruralcentres
Objective6: improveresourcesforstrategicplanninginruralandregionalareas
4 RelevantStudies/Commentary
Areviewofrelevantstudiesand/orcommentarynotesthatthepopulationattractionandthereasonsforpeoplewantingtomovetorurallocationsaremultifactorial.
4.1 Peoplecount:Populationgrowthcausesbasiceconomicgrowth
Overview Populationgrowthiseconomicgrowth.Takingstepstoattractpeopletomovetoacommunityisanimportantstrategy.
PostedonJanuary19,2017byKurtSchindler,MichiganStateUniversityExtension
“Oneofthecharacteristicsoftheneweconomyisthatjobsfollowpeople.Peoplemovetoqualityplaces.Currentlymillennialstendtoseekurban,largecitydowntownstolive.Thattrendwillcontinueforsomeyearsyet.Itisageneralization.Noteveryonefitsthatmold.Thetaskforruralcommunitiesorsmalltownsistodefinetheirnicheandtargetthosepeoplewhoseektheassetsandattributestheyhavetooffer.
Theultimatelocalgoalfortheneweconomyistoattractandretainthesepeople-assets:well-educatedyouth,seniors,immigrantsandentrepreneurs.Forgrowthintheneweconomy,acommunityandregionshouldhaveadeliberate,purposeful,formally-adoptedpopulationattractionstrategy.Suchastrategymayinvolvemanyofthesamethingsthecommunitydoestoattracttourists,attractmedicalstafftoalocalhospital,andmore.
Whatattractspeopletoatown,countyandregion?Thesamethingsthathavealreadybeenpointedoutinthisseries:greenandblueinfrastructure,vibrantdowntowns,arts,culture,activityandthingstodo.Butmorespecifically,itcomesdownto“placematters”.Peopleareattractedtoaplace.Thetypesofplaceswhicharepopularandsuccessfulingettingnewpopulationhavethefollowing:• Entrepreneurialinfrastructure–acommunitythatissupportiveofnewbusinessesstartupsand
hasprogramssuchaseconomicgardeninginplace• Diversity–communitiesthataretolerantofandsociallywelcomediversityofrace,religions,
beliefsandlife-styles.• Greenandblueinfrastructure–naturalareas,parks,trails,waterresourcesandsoon• Socialinfrastructure–acommunitywithsocialactivities,eventsandthingstodo• Publictransportationinfrastructure–achoiceastohowonegetsaroundthecommunity,not
justautomobile,butalsobike,walking,andpublictransportationtoandbetweenamenities• Varietyofhousing–achoiceofdifferenttypesofhousing,notjustsinglefamilyhomesonlots,
butalsohousingdowntown,apartmentbuildings,andsoon(whatisimportantistoprovidechoice)
• Informationtechnologyinfrastructure–high-speedinternet• Collaborativecapacity–acommunitythatworkstogetherandhasmanycollaborativeand
cooperativeseffortsforaccomplishingcommunity-wideprojects
PopulationAttractionandRetentionStrategiesforRuralVictorianCommunities
DENCH MCCLEAN CARLSON – RMCG – REMPLAN July2017 27
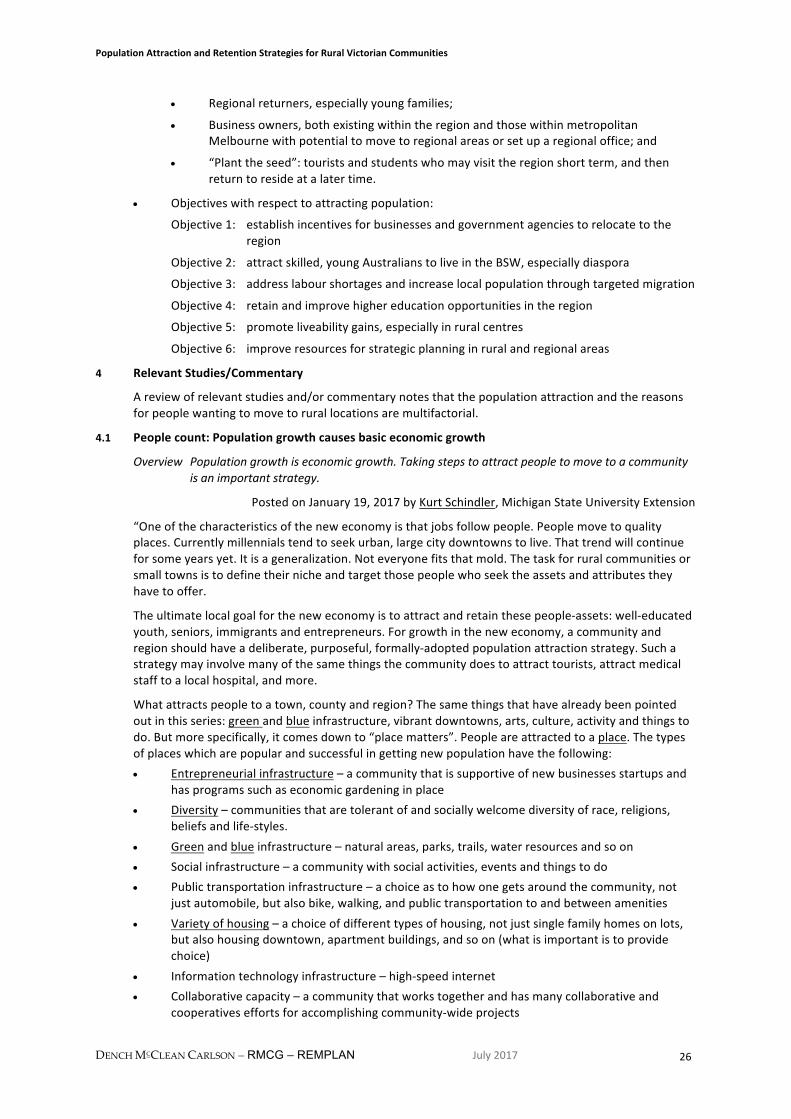
4.2 Superconnectedlifestylelocations-Theriseofthe‘e-change’movement
ThenbncocommissionedareportbyBernardSaltwithrespecttothelikelyimpactofaccesstothenationalbroadbandnetworktopeople’spropensitytomovefromlargerurbancentres.Thereportidentifiedmany“lifestyle”townsacrossAustraliaincluding164inVictoria.ManyoftheseareintheLGAsthatareprojectedtoexperiencesignificantpopulationgrowth–seeSection2.
Theresearchundertakeninpreparingthereportnotedasignificantincreaseinpeopleworkingfromhomeandprojectsthatby2026thismayasmanyas8%ofAustralia’sworkforceandcontendsthatthistrendwillgrowthepropensitytomovefromlargerurbancentres.
Thereportalsoincludesasurveyof1,000peopleonmattersrelatingtolifestylepreferences–thesurveyfoundthat:
• about40%ofAustralianssurveyedsaidtheyhadconsideredaseachangeand32%saidthattheyhadconsideredatreechange.Thesefigurescomparewithjust18%whohadthoughtaboutacitychange.
Thereportobservesthat“DreamylifestylelocationstrumppracticalworkplacecitiesintheAustralianmind.”
• whenitcomesdowntowhohadactuallymadethemovesome26%saidtheyhadchangedcities,14%saidtheyhadmovedtoaseachangetownand15%hadmovedtoatreechangetown.
ThereportobservesthatAustraliansarearoundtwotimesaslikelytothinkaboutmovingtoalifestyletownastheyaretoactuallymovetosuchatown.Nodoubtcommutingandthecostoflivingaremotivatingforces.Butitalwayscomesbacktojobs.Commutingfromalifestyletownisimpracticalasalong-termpropositionformostAustralians.
Superconnectedlifestylelocations–SurveyOutcomes
PopulationAttractionandRetentionStrategiesforRuralVictorianCommunities
DENCH MCCLEAN CARLSON – RMCG – REMPLAN July2017 28
Thereportpostulatesthat“superconnectivitymadeavailablebyaccesstothenbn™networkinthe2020sandAustralianswilllookatwaysoftelecommutingfromanyofthebythen650townswithinstrikingdistanceofcapitalcities.Whoknows,by2030perhapstheproportionofAustralianslivinginthise-changezone(between30kmand150kmfromacapitalcityCBD)mightrisefrom15percenttodaytocloserto20percent?”
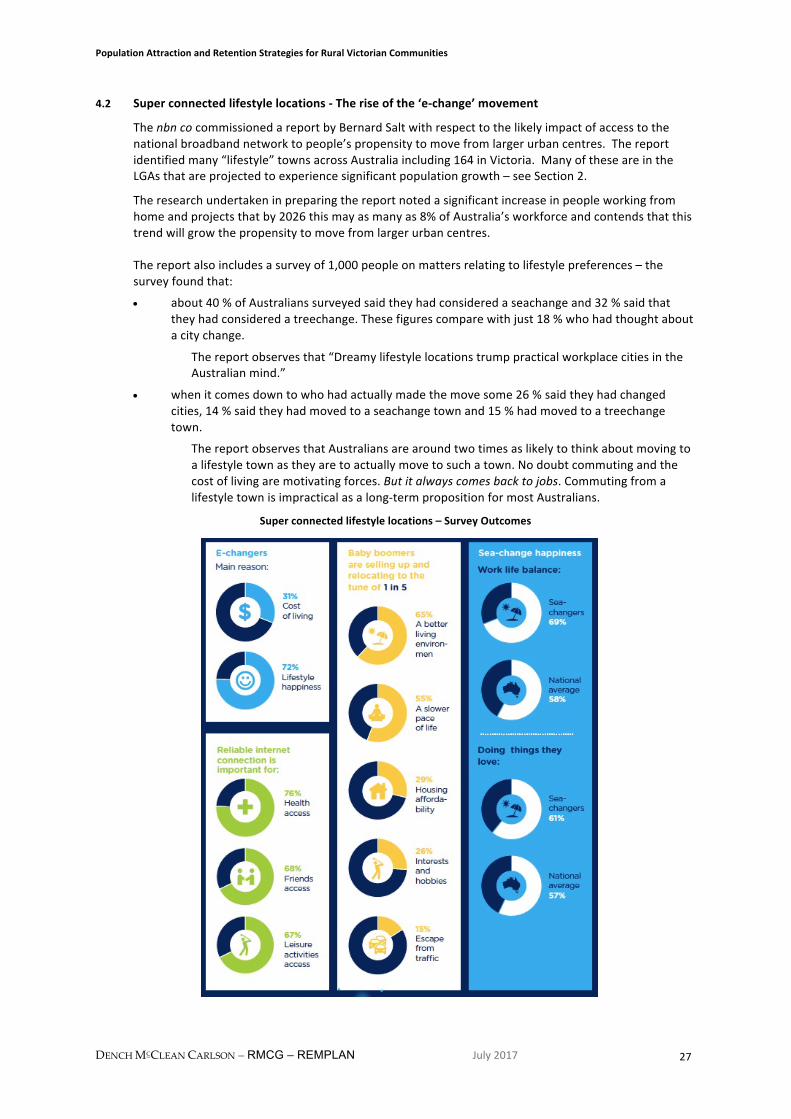
4.3 AttractingandretainingskilledpeopleinregionalAustralia:Apractitioner’sguide
ThereportwaspreparedbytheStandingCommitteeonRegionalDevelopmentin2004andobservesthat“Attractingandretainingprofessionalandskilledpeopletoliveandworkwithinregionalcommunitiesisoneofthemajorchallengesinbuildingsustainableregions.Acommunitythatcanalsooffertheservicessuppliedbyprofessionalandskilledworkerssupportsthepeoplewhoarelivinginregionalcommunitiesandthebusinessesoperatingthere.Thisprovidesthefoundationstoneforattractingnewresidentsandbusinesses.
Insummary,thisissueiscriticaltosustainingregionalcommunitiesasviableentitiesintothefuture–communitiesthatareself-sufficientintermsofprofessionalsandtradespeoplearemorelikelytoretaintheirresidentsandattractnewones.”
ThereportnotesanumberofKeySuccessFactorsasidentifiedinthefollowingdiagram.
Perceptionsoflifestyle&community Æ KEYIMPERATIVESONATTRACTINGANDRETAININGPROFESSIONALANDSKILLED
PEOPLEINREGIONALAUSTRALIA
ÅHousing
ÅEducation&Training
ÅHealth
ÅInfrastructureJobsandcareeropportunities Æ
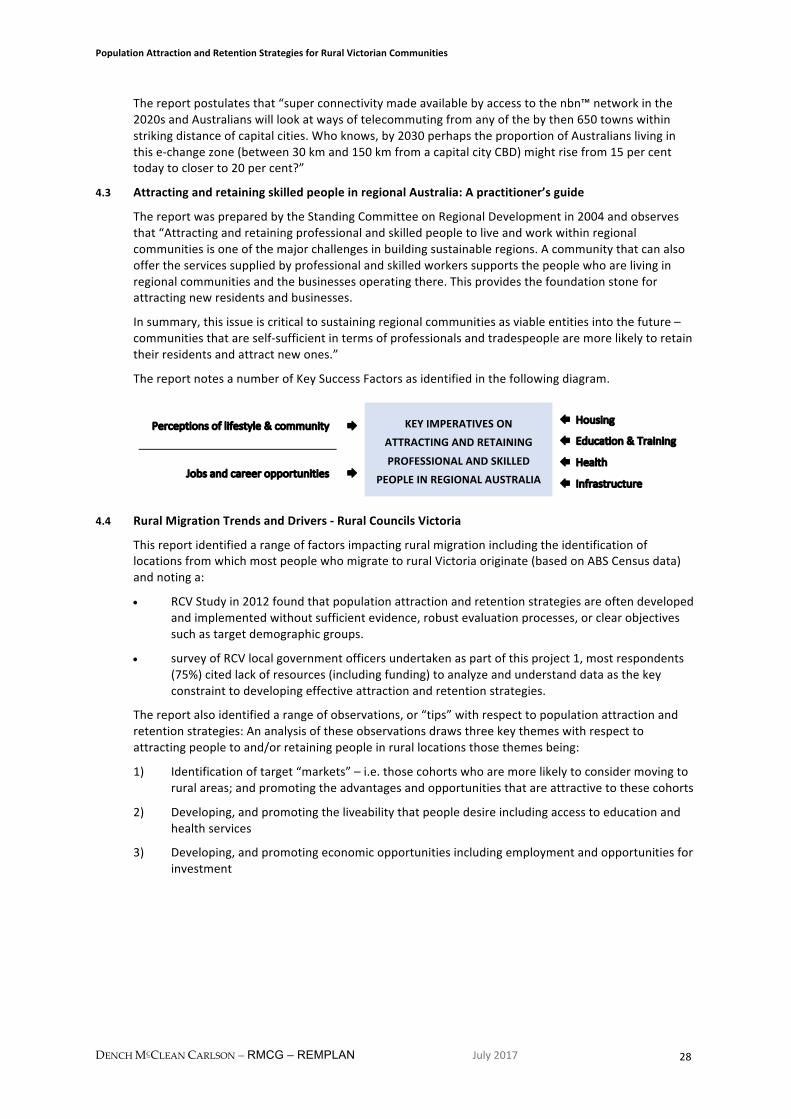
4.4 RuralMigrationTrendsandDrivers-RuralCouncilsVictoria
ThisreportidentifiedarangeoffactorsimpactingruralmigrationincludingtheidentificationoflocationsfromwhichmostpeoplewhomigratetoruralVictoriaoriginate(basedonABSCensusdata)andnotinga:
• RCVStudyin2012foundthatpopulationattractionandretentionstrategiesareoftendevelopedandimplementedwithoutsufficientevidence,robustevaluationprocesses,orclearobjectivessuchastargetdemographicgroups.
• surveyofRCVlocalgovernmentofficersundertakenaspartofthisproject1,mostrespondents(75%)citedlackofresources(includingfunding)toanalyzeandunderstanddataasthekeyconstrainttodevelopingeffectiveattractionandretentionstrategies.
Thereportalsoidentifiedarangeofobservations,or“tips”withrespecttopopulationattractionandretentionstrategies:Ananalysisoftheseobservationsdrawsthreekeythemeswithrespecttoattractingpeopletoand/orretainingpeopleinrurallocationsthosethemesbeing:
1) Identificationoftarget“markets”–i.e.thosecohortswhoaremorelikelytoconsidermovingtoruralareas;andpromotingtheadvantagesandopportunitiesthatareattractivetothesecohorts
2) Developing,andpromotingtheliveabilitythatpeopledesireincludingaccesstoeducationandhealthservices
3) Developing,andpromotingeconomicopportunitiesincludingemploymentandopportunitiesforinvestment
PopulationAttractionandRetentionStrategiesforRuralVictorianCommunities
DENCH MCCLEAN CARLSON – RMCG – REMPLAN July2017 29
AnAnalysisRuralMigrationTrendsandDrivers
Themes Needto:
Targetedmarketing&promotion
addresskeydecisiondriversformovingtoruralVictoria
identifytargetcohortsthataremorelikelytoconsidermigratingtorurallocations
promotekeyadvantagesoflivinginruralareas/communities
ensurethatnewcomers,potentialnewcomersandvisitorshavereadyaccesstoinformation
Liveabilitydevelop,andpromote,theaccesstoeducationandhealthservices
haveprocessestoengageyoungpeople
Economicopportunities
fosteremploymentandworkforcedevelopmentopportunities
fosterthedevelopmentofexistingandorthe“start-up”oflocalbusinesses
haveidentifiedandexpediteprivatesectorinvestmentopportunities
haveeffectivecommunityeconomicdevelopmentprocesses
4.5 RegionalAustraliaInstitute
TheRegionalAustraliaInstitute(RAI)hasreleasedthereport“LightingUpourGreatSmallCities:ChallengingMisconceptions”whichananalysisoftheeconomicopportunitiesin31regionalcitiesthroughoutAustralia–seehttp://www.regionalaustralia.org.au/home/wp-content/uploads/2017/06/Lighting-Up-our-Great-Small-Cities_Report_EMBARGOED.pdf
TheRAI’sprojectionsoffutureregionalcitycontendsthat“regionalcitieshavethepotentialtoproduce$375billioninoutputin2031,representinga65percentincreasefrom2013levelsandacontributionof15percenttothenationaleconomy’
Thereportcontendsthefollowing“myths”regardingthecapacityandcapabilityofregionalcitieswithrespecttoattractinginvestmentanddeliveringpositivereturnsforinvestors:
Myth1:SloworDecliningGrowth
Australiaengagesinamostlynegativepublicdiscussionaboutregionaleconomies.Asideeffectofthislong-termdebateisthatmanybelievethatregionalcityeconomicperformanceinevitablylagsmetropolitanoutcomesandthat‘manyregionalcitiesaresufferinglowandnegativegrowth’.
Myth2:RegionalCitieswillbeLeftBehindintheNewEconomyWorld
Australia’seconomyisbecomingservicesfocusedwiththegrowthofjobsconcentratinginneweconomyindustries.Itisassumedthatregionalcitiesareinevitablybeingleftbehindinthistrend.However,Regionalcitiesarealreadyproducingmoreoutputinneweconomyindustries(finance,education, health and professional services) than old industries (agriculture, mining andmanufacturing).
Myth3:PopulationSizeistheMostImportantFactorinPredictingEconomicPerformance
Regional cities are often characterised as interesting, only when they are big. This drives amisconceptionthatallthebenefitsofcitiesgrowwithpopulationsize.Infact,whenitcomestoparticipation, historical growth or projected growth in output there is no statistical differencebetweenbigorsmallregionalcities.Thechallengeforpolicymakersatthenational,stateandlocallevelsistocultivatecityperformance,notsize.
Myth4:PastPerformanceistheBestPredictorofFutureGrowth
Whiletrendsareimportant,historydoesnotpredeterminethedestinyofacity.Changingmacro-economicconditionsarehavingasignificantimpactonregionalcitygrowthtrajectoriesandathirdof all regional cities have already or are predicted to change their output growth trajectories.Developingsmartstrategiesthatrespondtochangingtrajectoriesisimportanttosuccessfulsmallcitiespolicy.
PopulationAttractionandRetentionStrategiesforRuralVictorianCommunities
DENCH MCCLEAN CARLSON – RMCG – REMPLAN July2017 30
Akeytenantofthereportistheneedtodemonstratetotheprivatesectorthatthereareattractiveinvestmentopportunitiesoutsideofthecapitalcities.
Whilethisreportisonregionalcitiesitstandstoreasonthatthesimilarmisconceptionsimpactinvestmentopportunitiesinruralareas.
4.6 ImplicationsforPopulationAttractionProjects
Populationattractionisdependentonacombinationoffactorsmostnotably:-
• Economicopportunities–i.e.accesstoemploymentand/orinvestmentopportunities
• Liveability–i.e.accesstorelevantservicesand/oradesiredlifestyle
• Promotion–i.e.providingrelevantinformationtotargetmarkets
5 RCVPopulationAttractionandRetentionProjects
ThePopulationAttractionandRetentionStrategiesforRuralVictorianCommunitiesprojecthassoughttoconsolidatethelessonsofRCV’spriorprojectsalongwithevidencefromthebroaderknowledgebasetodetermineapractical,actionablesetofProjectsfortheStrongerRuralCouncilsInitiative(SRCI)tosupportoverthenextthreeyearsforthebenefitofitsmembersandthatareconsistentwithRCV’srole,mandateandcapacity,aswellasopportunitiesthatexisttoinfluenceStategovernmentpolicyandprograms.
ThePopulationAttractionandRetentionStrategiesforRuralVictorianCommunitiesprojecthasconsideredtheimplicationsforpopulationattractionandretentionandeconomicdevelopmentrelevanttoVictorianruralcommunitiesarisingfromtheimplicationsarisingfromthereviewof:
• population,demographicandeconomicdataforeachofthe38RCVLGAs
• populationattractionandretentioneffortsinAustralia,USA,CanadaandScotland
• previousRCV,andotherrelevantstudies
5.1 KeyAssumptions
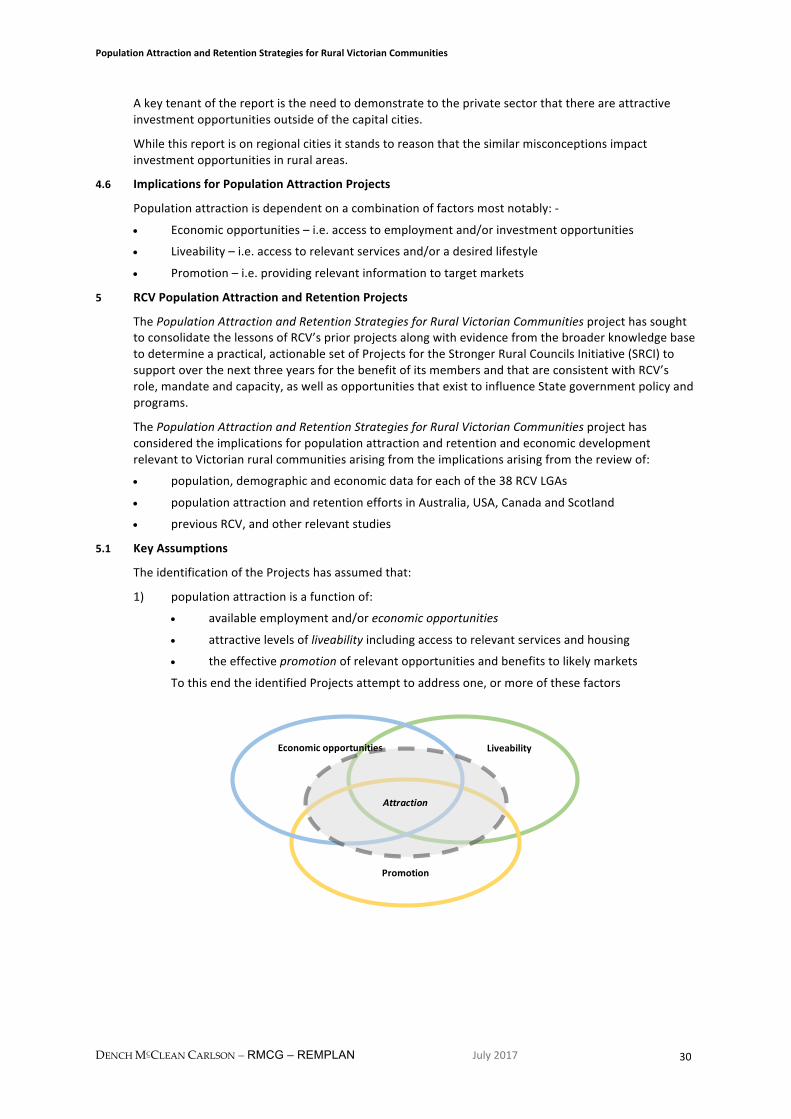
TheidentificationoftheProjectshasassumedthat:
1) populationattractionisafunctionof:
• availableemploymentand/oreconomicopportunities
• attractivelevelsofliveabilityincludingaccesstorelevantservicesandhousing
• theeffectivepromotionofrelevantopportunitiesandbenefitstolikelymarkets
TothisendtheidentifiedProjectsattempttoaddressone,ormoreofthesefactors
Liveability
Promotion
Economicopportunities
Attraction
PopulationAttractionandRetentionStrategiesforRuralVictorianCommunities
DENCH MCCLEAN CARLSON – RMCG – REMPLAN July2017 31
2) collectively,theProjectsneedtoaddvaluetoruralLGAsinvarioussituationsi.e.thosethatareprojectedto:
• losepopulation–butexperiencearelativegrowthofpopulationaged65yearsplus–andhaveexperiencedanetlossofjobs
• gainpopulation–butwillexperienceanetlossofpopulationagedunder65years–buthaveexperiencedanetlossofjobs
• gainpopulation–butwillexperienceanetlossofpopulationagedunder65yearsandhaveexperiencedanetincreaseinjobs
• gainpopulationacrossageagesandhaveexperiencedanetincreaseinjobs
3) RCVCouncilsareresourceconstrainedand/orhavelimitedskills/experiencewithrespecttoundertakingactivitiessuchamarketresearch,Investmentattraction–particularlywiththeprivatesector,andpromotion
4) Thereisnocommonmechanism/portalforpromotingruralVictoriatokeymarkets
5) RCVhaslimitedresourceswithrespecttothedeliveryofsignificantprojects
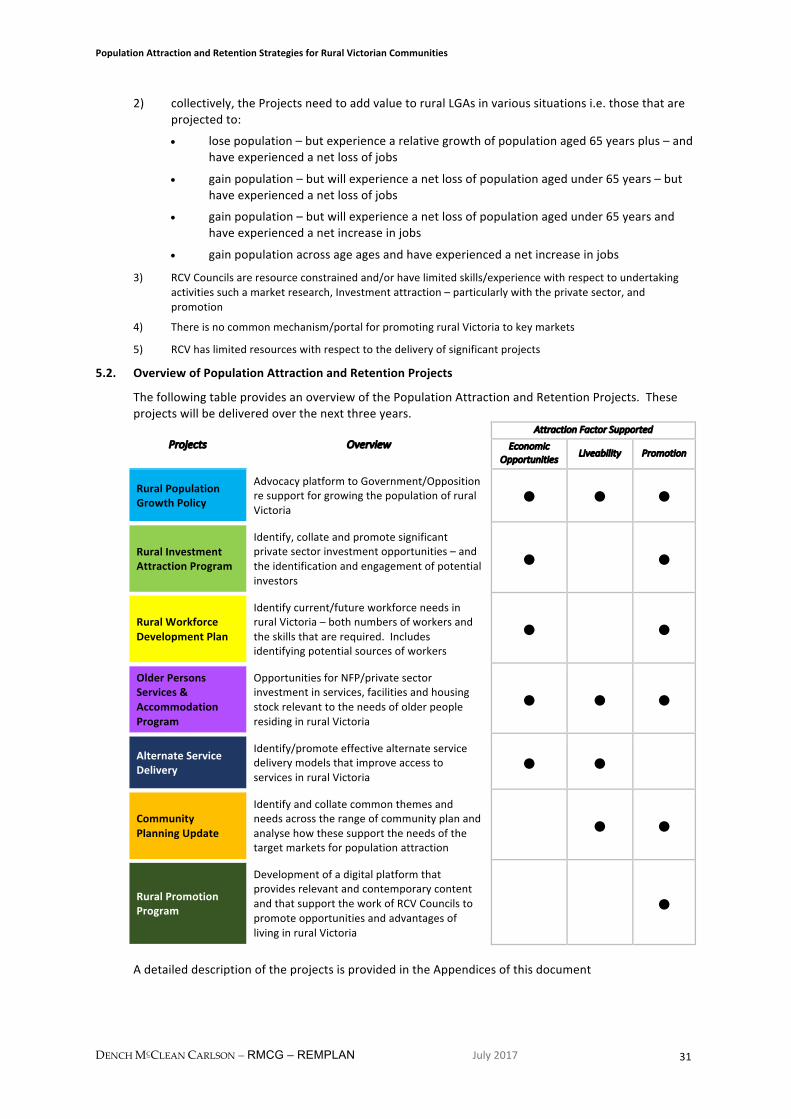
5.2. OverviewofPopulationAttractionandRetentionProjects
ThefollowingtableprovidesanoverviewofthePopulationAttractionandRetentionProjects.Theseprojectswillbedeliveredoverthenextthreeyears.
Projects OverviewAttractionFactorSupported
EconomicOpportunities
Liveability Promotion
RuralPopulationGrowthPolicy
AdvocacyplatformtoGovernment/OppositionresupportforgrowingthepopulationofruralVictoria
n n n
RuralInvestmentAttractionProgram
Identify,collateandpromotesignificantprivatesectorinvestmentopportunities–andtheidentificationandengagementofpotentialinvestors
n n
RuralWorkforceDevelopmentPlan
Identifycurrent/futureworkforceneedsinruralVictoria–bothnumbersofworkersandtheskillsthatarerequired.Includesidentifyingpotentialsourcesofworkers
n n
OlderPersonsServices&AccommodationProgram
OpportunitiesforNFP/privatesectorinvestmentinservices,facilitiesandhousingstockrelevanttotheneedsofolderpeopleresidinginruralVictoria
n n n
AlternateServiceDelivery
Identify/promoteeffectivealternateservicedeliverymodelsthatimproveaccesstoservicesinruralVictoria
n n
CommunityPlanningUpdate
Identifyandcollatecommonthemesandneedsacrosstherangeofcommunityplanandanalysehowthesesupporttheneedsofthetargetmarketsforpopulationattraction
n n
RuralPromotionProgram
DevelopmentofadigitalplatformthatprovidesrelevantandcontemporarycontentandthatsupporttheworkofRCVCouncilstopromoteopportunitiesandadvantagesoflivinginruralVictoria
n
AdetaileddescriptionoftheprojectsisprovidedintheAppendicesofthisdocument
PopulationAttractionandRetentionStrategiesforRuralVictorianCommunities
DENCH MCCLEAN CARLSON – RMCG – REMPLAN July2017 32
5.3. EstimationofRequiredResources
Anestimationoftheresourcesthatwillberequiredtodelivertheprojectshasbeenundertaken.Thisincludesanestimationofthe
• Consultingdaysrequiredtoundertaketheproject
• ProjectManagementhours–thisassumesthatRCVhaslimitedresourceswithrespecttoprojectmanagementandthateachprojectwillrequireresourcestoorganizerequirementswithrespectto:
• relevantmeetings
• engagementandconsultationwithRCVCouncilsandotherstakeholders
• otherexpertise
• Additionalexpertisethatmayberequired–thisexpertisefallintooneormoreofthefollowingcategories:
• EconomicResearchandImpactModelling
• EconomicDevelopmentandInvestmentAttraction
• LandUseAnalysis
• GraphicDesign–includingdigitalplatformdevelopmentandoperation
• EventManagement
• Relatedtravelcosts

PopulationAttractionandRetentionStrategiesforRuralVictorianCommunities
DENCH MCCLEAN CARLSON – RMCG – REMPLAN July2017 33
Appendix1-PopulationAttractionandRetentionProjects–DescriptionandEstimatedResources
PopulationAttractionandRetentionStrategiesforRuralVictorianCommunities
DENCH MCCLEAN CARLSON – RMCG – REMPLAN July2017 34
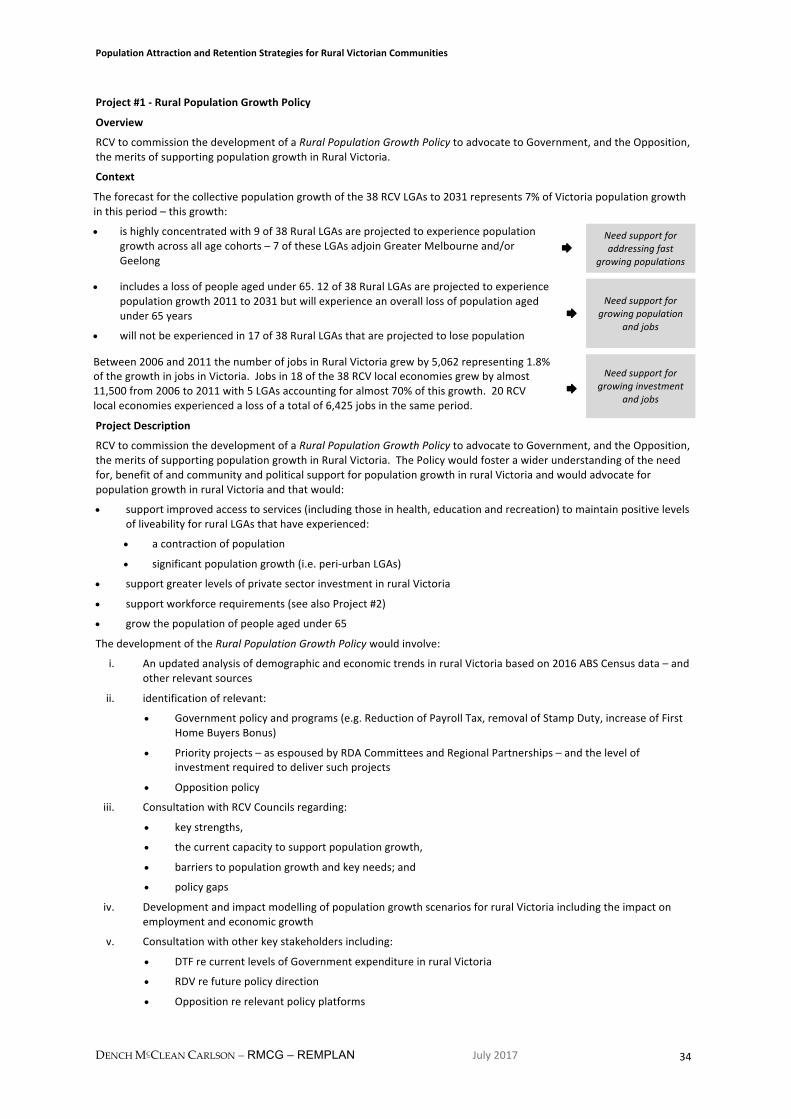
Project#1-RuralPopulationGrowthPolicy
Overview
RCVtocommissionthedevelopmentofaRuralPopulationGrowthPolicytoadvocatetoGovernment,andtheOpposition,themeritsofsupportingpopulationgrowthinRuralVictoria.
Context
Theforecastforthecollectivepopulationgrowthofthe38RCVLGAsto2031represents7%ofVictoriapopulationgrowthinthisperiod–thisgrowth:
• ishighlyconcentratedwith9of38RuralLGAsareprojectedtoexperiencepopulationgrowthacrossallagecohorts–7oftheseLGAsadjoinGreaterMelbourneand/orGeelong
ÆNeedsupportforaddressingfast
growingpopulations
• includesalossofpeopleagedunder65.12of38RuralLGAsareprojectedtoexperiencepopulationgrowth2011to2031butwillexperienceanoveralllossofpopulationagedunder65years
• willnotbeexperiencedin17of38RuralLGAsthatareprojectedtolosepopulation
ÆNeedsupportfor
growingpopulationandjobs
Between2006and2011thenumberofjobsinRuralVictoriagrewby5,062representing1.8%ofthegrowthinjobsinVictoria.Jobsin18ofthe38RCVlocaleconomiesgrewbyalmost11,500from2006to2011with5LGAsaccountingforalmost70%ofthisgrowth.20RCVlocaleconomiesexperiencedalossofatotalof6,425jobsinthesameperiod.
ÆNeedsupportfor
growinginvestmentandjobs
ProjectDescription
RCVtocommissionthedevelopmentofaRuralPopulationGrowthPolicytoadvocatetoGovernment,andtheOpposition,themeritsofsupportingpopulationgrowthinRuralVictoria.ThePolicywouldfosterawiderunderstandingoftheneedfor,benefitofandcommunityandpoliticalsupportforpopulationgrowthinruralVictoriaandwouldadvocateforpopulationgrowthinruralVictoriaandthatwould:
• supportimprovedaccesstoservices(includingthoseinhealth,educationandrecreation)tomaintainpositivelevelsofliveabilityforruralLGAsthathaveexperienced:
• acontractionofpopulation
• significantpopulationgrowth(i.e.peri-urbanLGAs)
• supportgreaterlevelsofprivatesectorinvestmentinruralVictoria
• supportworkforcerequirements(seealsoProject#2)
• growthepopulationofpeopleagedunder65
ThedevelopmentoftheRuralPopulationGrowthPolicywouldinvolve:
i. AnupdatedanalysisofdemographicandeconomictrendsinruralVictoriabasedon2016ABSCensusdata–andotherrelevantsources
ii. identificationofrelevant:
• Governmentpolicyandprograms(e.g.ReductionofPayrollTax,removalofStampDuty,increaseofFirstHomeBuyersBonus)
• Priorityprojects–asespousedbyRDACommitteesandRegionalPartnerships–andthelevelofinvestmentrequiredtodeliversuchprojects
• Oppositionpolicy
iii. ConsultationwithRCVCouncilsregarding:
• keystrengths,
• thecurrentcapacitytosupportpopulationgrowth,
• barrierstopopulationgrowthandkeyneeds;and
• policygaps
iv. DevelopmentandimpactmodellingofpopulationgrowthscenariosforruralVictoriaincludingtheimpactonemploymentandeconomicgrowth
v. Consultationwithotherkeystakeholdersincluding:
• DTFrecurrentlevelsofGovernmentexpenditureinruralVictoria
• RDVrefuturepolicydirection
• Oppositionrerelevantpolicyplatforms
PopulationAttractionandRetentionStrategiesforRuralVictorianCommunities
DENCH MCCLEAN CARLSON – RMCG – REMPLAN July2017 35
vi. CostBenefitAnalysis
UndertakethecostbenefitofgrowingthepopulationofruralVictoriaandhowitwouldmitigategrowthpressuresinGreaterMelbourneandRegionalCities.Theprocesswouldinvolve:
• consultationwithRCVCouncils(andthroughthemrelevantagencies)toidentify:
• currentcapacityofruralVictoriatoabsorbgrowth–including:
• capacityforresidentialgrowth
• capacityofkeyservices–includingschools
• supportfortheneedsoftheruralLGAsthatareprojectedtoexperienceasignificantincreaseinpopulationincludingtheidentificationofthesupportrequiredtogrowthenumberoflocaljobs
• theidentificationofmajorareasofcostsavingforGovernmentthroughtheefficientuseofinfrastructureinnothavingtoservicetheoffsetofgrowthinMelbournethatwouldbeaccommodatedinruralVictoria
• thepreparationofacostbenefitanalysisusingtheoutcomesofthepopulationgrowthscenariosandeconomicimpactmodelingfromthedevelopmentoftheRuralPopulationGrowthPolicyincludingidentifyinghowgrowingpopulationinruralVictoriacompareswithgrowingpopulationinGreaterMelbourne
vi. DevelopmentofafinalreportthatincludesrecommendationsforaRuralPopulationGrowthPolicy
EstimatedResources
Consulting
DaysEconomicResearch
GraphicDesign Travel
PolicyDevelopment AnupdatedanalysisofdemographicandeconomictrendsinruralVictoria 3 $15,000
IdentificationofGovernment(and✤Opposition)policy,programs,keyprojectsrelevanttopopulationattractioninRuralVictoria
5
Consultationwith*RCVCouncils 6 $1,500
Developmentandimpactmodellingofpopulationgrowthscenarios 5 $25,000
Consultationwithotherkeystakeholders 5 $1,500
Identificationofmajorcostsofinterfacedevelopmentcosts/costsofotherkeyprojects 10
$1,500
Costbenefitanalysis 7 $40,000
Developmentofafinalreport/recommendations 5 15,000 $1,500
ProjectManagement 5
totals 51 $80,000 15,000 $6,000
Notes✤TheStateOppositionhasestablishedtheVictorianPopulationPolicyTaskforce–seehttp://vicpopulation.com.au/
*AssumesthatRCVmemberswillmeetinrelevantgroupings
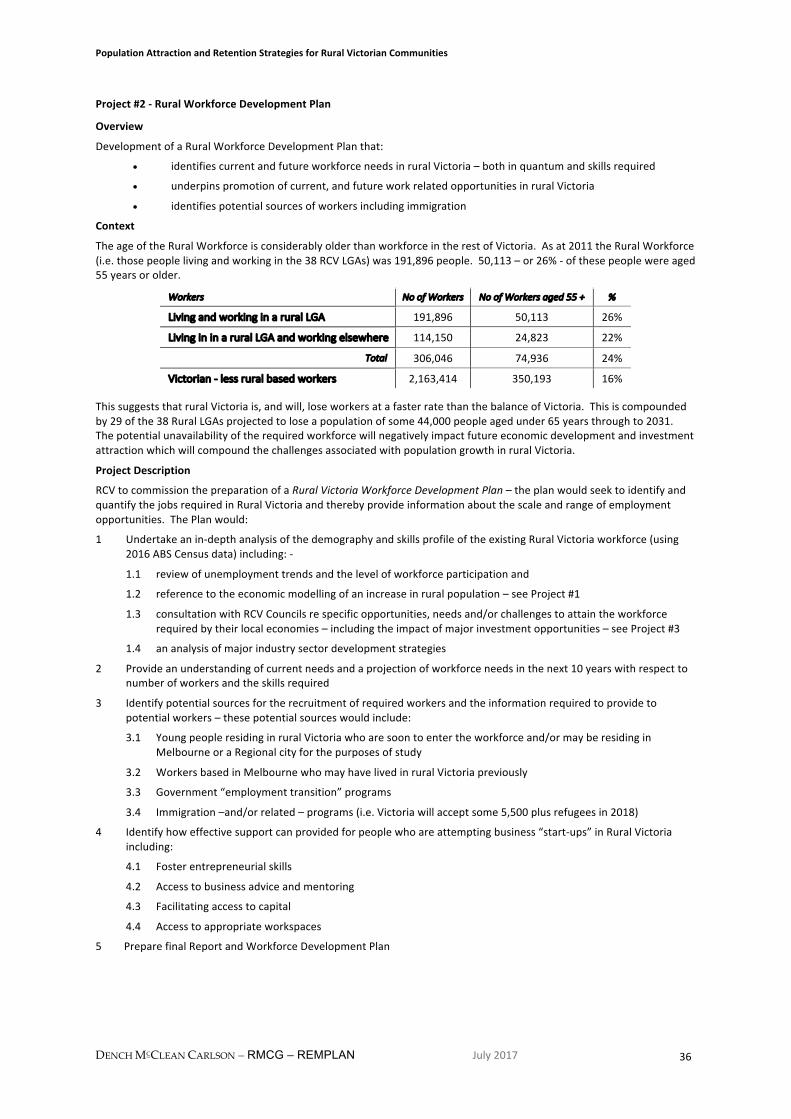
PopulationAttractionandRetentionStrategiesforRuralVictorianCommunities
DENCH MCCLEAN CARLSON – RMCG – REMPLAN July2017 36
Project#2-RuralWorkforceDevelopmentPlan
Overview
DevelopmentofaRuralWorkforceDevelopmentPlanthat:
• identifiescurrentandfutureworkforceneedsinruralVictoria–bothinquantumandskillsrequired
• underpinspromotionofcurrent,andfutureworkrelatedopportunitiesinruralVictoria
• identifiespotentialsourcesofworkersincludingimmigration
Context
TheageoftheRuralWorkforceisconsiderablyolderthanworkforceintherestofVictoria.Asat2011theRuralWorkforce(i.e.thosepeoplelivingandworkinginthe38RCVLGAs)was191,896people.50,113–or26%-ofthesepeoplewereaged55yearsorolder.
Workers NoofWorkers NoofWorkersaged55+ %
LivingandworkinginaruralLGA 191,896 50,113 26%
LivingininaruralLGAandworkingelsewhere 114,150 24,823 22%
Total 306,046 74,936 24%
Victorian-lessruralbasedworkers 2,163,414 350,193 16%
ThissuggeststhatruralVictoriais,andwill,loseworkersatafasterratethanthebalanceofVictoria.Thisiscompoundedby29ofthe38RuralLGAsprojectedtoloseapopulationofsome44,000peopleagedunder65yearsthroughto2031.ThepotentialunavailabilityoftherequiredworkforcewillnegativelyimpactfutureeconomicdevelopmentandinvestmentattractionwhichwillcompoundthechallengesassociatedwithpopulationgrowthinruralVictoria.
ProjectDescription
RCVtocommissionthepreparationofaRuralVictoriaWorkforceDevelopmentPlan–theplanwouldseektoidentifyandquantifythejobsrequiredinRuralVictoriaandtherebyprovideinformationaboutthescaleandrangeofemploymentopportunities.ThePlanwould:
1 Undertakeanin-depthanalysisofthedemographyandskillsprofileoftheexistingRuralVictoriaworkforce(using2016ABSCensusdata)including:-
1.1 reviewofunemploymenttrendsandthelevelofworkforceparticipationand
1.2 referencetotheeconomicmodellingofanincreaseinruralpopulation–seeProject#1
1.3 consultationwithRCVCouncilsrespecificopportunities,needsand/orchallengestoattaintheworkforcerequiredbytheirlocaleconomies–includingtheimpactofmajorinvestmentopportunities–seeProject#3
1.4 ananalysisofmajorindustrysectordevelopmentstrategies
2 Provideanunderstandingofcurrentneedsandaprojectionofworkforceneedsinthenext10yearswithrespecttonumberofworkersandtheskillsrequired
3 Identifypotentialsourcesfortherecruitmentofrequiredworkersandtheinformationrequiredtoprovidetopotentialworkers–thesepotentialsourceswouldinclude:
3.1 YoungpeopleresidinginruralVictoriawhoaresoontoentertheworkforceand/ormayberesidinginMelbourneoraRegionalcityforthepurposesofstudy
3.2 WorkersbasedinMelbournewhomayhavelivedinruralVictoriapreviously
3.3 Government“employmenttransition”programs
3.4 Immigration–and/orrelated–programs(i.e.Victoriawillacceptsome5,500plusrefugeesin2018)
4 Identifyhoweffectivesupportcanprovidedforpeoplewhoareattemptingbusiness“start-ups”inRuralVictoriaincluding:
4.1 Fosterentrepreneurialskills
4.2 Accesstobusinessadviceandmentoring
4.3 Facilitatingaccesstocapital
4.4 Accesstoappropriateworkspaces
5 PreparefinalReportandWorkforceDevelopmentPlan
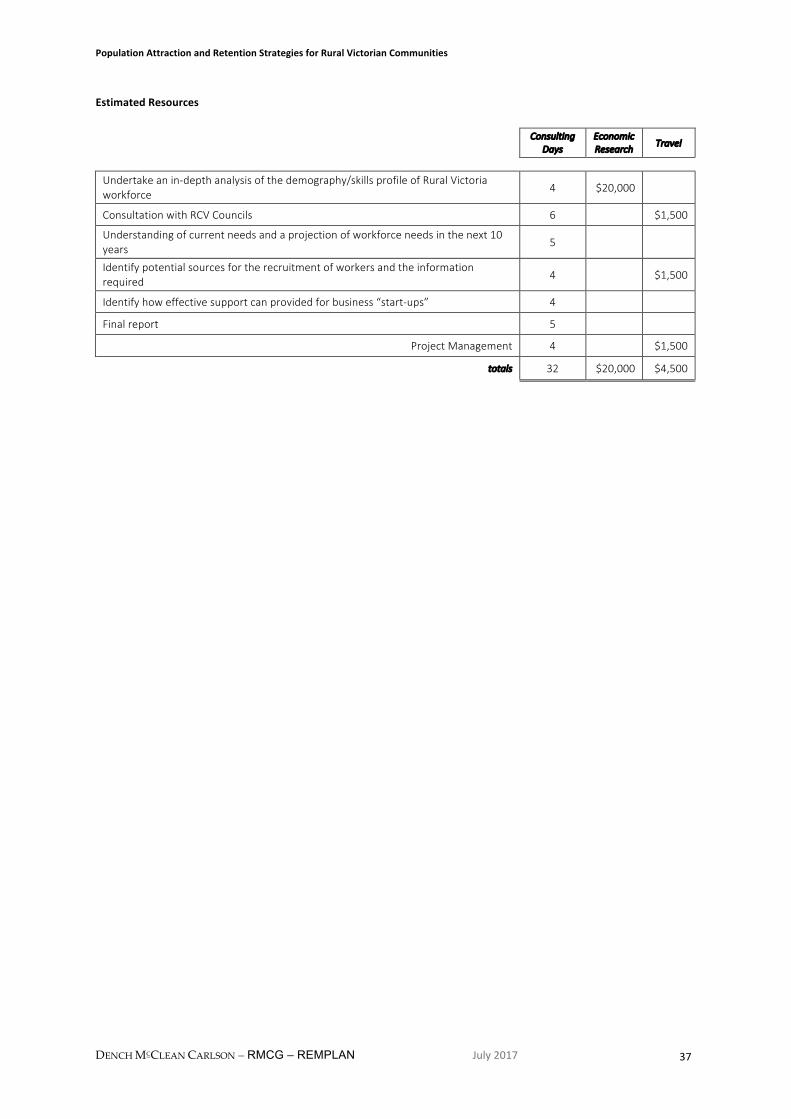
PopulationAttractionandRetentionStrategiesforRuralVictorianCommunities
DENCH MCCLEAN CARLSON – RMCG – REMPLAN July2017 37
EstimatedResources
ConsultingDays
EconomicResearch Travel
Undertakeanin-depthanalysisofthedemography/skillsprofileofRuralVictoriaworkforce 4 $20,000
ConsultationwithRCVCouncils 6 $1,500
Understandingofcurrentneedsandaprojectionofworkforceneedsinthenext10years 5
Identifypotentialsourcesfortherecruitmentofworkersandtheinformationrequired 4 $1,500
Identifyhoweffectivesupportcanprovidedforbusiness“start-ups” 4
Finalreport 5
ProjectManagement 4 $1,500
totals 32 $20,000 $4,500
PopulationAttractionandRetentionStrategiesforRuralVictorianCommunities
DENCH MCCLEAN CARLSON – RMCG – REMPLAN July2017 38
Project#3-RuralInvestmentAttractionProgram
Overview
Identification,promotionandfacilitationof*significantprivatesectorinvestmentopportunitiesinruralVictoriathroughacollaborativeapproachacrossRCVCouncilsthatpresentsanattractivescaleofinvestmenttotheprivatesectorandassociatedbenefitstoGovernmentandgrowsthecapabilityofRCVCouncilswithrespecttoinvestmentattraction.
Context
Accesstoeconomicopportunitiesiscentraltosupportingpopulationattractionand/orretentioninruralVictoria–thisincludesattractingprivatesectorinvestmentintosectorsthatthatenableruralLGAstoregeneratetheirrespectiveeconomiesandgeneratejobs.
Therelativesize,densityandgrowthofVictoria’smetropolitanbasedeconomyrelativetotheruraleconomypresentsachallengetoruralVictoriawithrespecttotheattractingprivatesectorawareness.TheRAIhaveidentifiedthattherearemisconceptionsofthevalueofeconomicopportunitiesoutsideofthecapitalcities.Thereisaneedtohighlightthescaleandrangeofavailableinvestmentopportunities.
Thereisalsoaneed,insomeLGAs,toidentifykeyassets(includingimprovedinfrastructure)thatcouldbeleveragedtocreateprivatesectorinvestmentopportunitiesthatareconsistentwithcommunityvaluesandinnovation.Thismayrequireinnovativeprocessesand/orinsightintomarketneeds,and/orunderstandingofpolicychangestoidentifytheleveragepoints.SomeRCVCouncilsmayneedassistancewiththisprocess.
Atpresent,manyofthe38RCVCouncilsareattemptingtoeitherattractprivatesectorinvestmenttoanexistingopportunityand/oridentifyopportunitiesforprivatesectorinvestment.RCVCouncils,inaratecappingoperatingenvironment,willfinditincreasinglydifficulttofindresourcestosupportinvestmentattractionand/orhavevaryinglevelsofexperienceandexpertiseinengagingtheprivatesector.Thescarcityofexpertise,experienceandresourceswilllikelycompromiseattemptstosecureprivatesectorinvestment.ThereisaneedtoidentifyhowamorecollaborativeprocessamongstRCVCouncilscouldcreateamorerobust“portal”thatmakesmoreefficient,andeffectiveuseofscarceresourcesintheattractionofprivatesectorinvestment.
Finally,theprocessforcollating,identifyingand/orpromotinginvestmentopportunitiesshouldcreatealegacyofimprovedcapabilitywithinRCVCouncilswithrespectattractinginvestmentfromtheprivatesector.
ProjectDescription
RCVtocommissionthedevelopmentaRuralInvestmentAttractionProgram.TheProgramwouldsupporttheimprovedattractionof*significantlevelsofprivatesectorinvestmentthroughacollaborativeapproachacrossRCVCouncilsthatpresentsamuchlargerscaleofinvestmenttotheprivatesectorandassociatedbenefitstoGovernment.TheProgramwouldinclude:
1 Developinganunderstandingoftheoverallscale,rangeandvalueoftheexistingsignificantprivatesectorinvestmentopportunitiesinruralLGAsincludingidentifyingthe:
1.1 typeandrangeofkeyassetsbeingleveragedandtheinvestmentattractionprocessesalreadyinplaceand/orunderway
1.2 likelysectors/sourcesthatwillbeattractedtotheopportunity
1.3 overalleconomicimpactoftheopportunities
2 Providingsupportforacollaborativeapproachtotheidentificationofpotentialinvestors,includingworkingwithRDVandInvestVictoria,andthedevelopmentofacollaborativeandmorecost-effectiveprocessfor:
2.1 identifyingpotentialinvestors
2.2 Promotinginvestmentopportunities
2.3 Engagingwithand/orhostingpotentialinvestors
3 ProvidingsupporttoRCVCouncilstohelpthemdevelopthecapabilityrequiredto:
3.1 identifyassetsthatcouldbeleveragedbytheprivatesectortocreatesignificantinvestmentthatrepresentsasustainablegrowthopportunityforthelocaleconomy
3.2 developmentofassociatedbusinessand/orinvestmentcases
4 GeneratealegacyofimprovedcapabilitywithinindividualCouncilwithrespecttomanaginginvestmentattraction–thiswould:
4.1 utilizetheoutcomesoftheprevioussteps
4.2 includethedevelopmentandconductof“InvestmentAttraction”workshopprogramforrelevantRCVCouncilOfficersandthedevelopmentofappropriatesupportmaterials
*Note SignificantinvestmentwouldbedefinedasalevelofinvestmentthatwouldprovideemploymentopportunitiesforpeopleintheLGAinwhichtheinvestmentistobesitedaswellasforadjoiningLGAs.
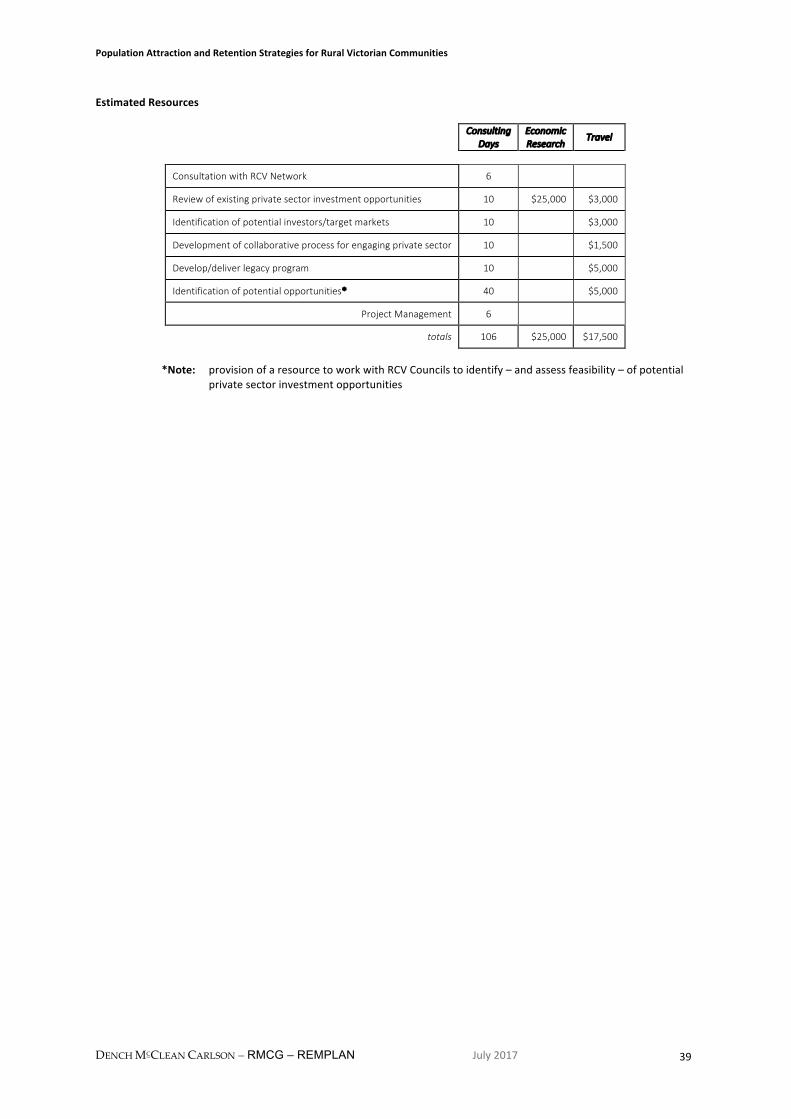
PopulationAttractionandRetentionStrategiesforRuralVictorianCommunities
DENCH MCCLEAN CARLSON – RMCG – REMPLAN July2017 39
EstimatedResources
Consulting
DaysEconomicResearch
Travel
ConsultationwithRCVNetwork 6
Reviewofexistingprivatesectorinvestmentopportunities 10 $25,000 $3,000
Identificationofpotentialinvestors/targetmarkets 10 $3,000
Developmentofcollaborativeprocessforengagingprivatesector 10 $1,500
Develop/deliverlegacyprogram 10 $5,000
Identificationofpotentialopportunities* 40 $5,000
ProjectManagement 6
totals 106 $25,000 $17,500
*Note: provisionofaresourcetoworkwithRCVCouncilstoidentify–andassessfeasibility–ofpotential
privatesectorinvestmentopportunities
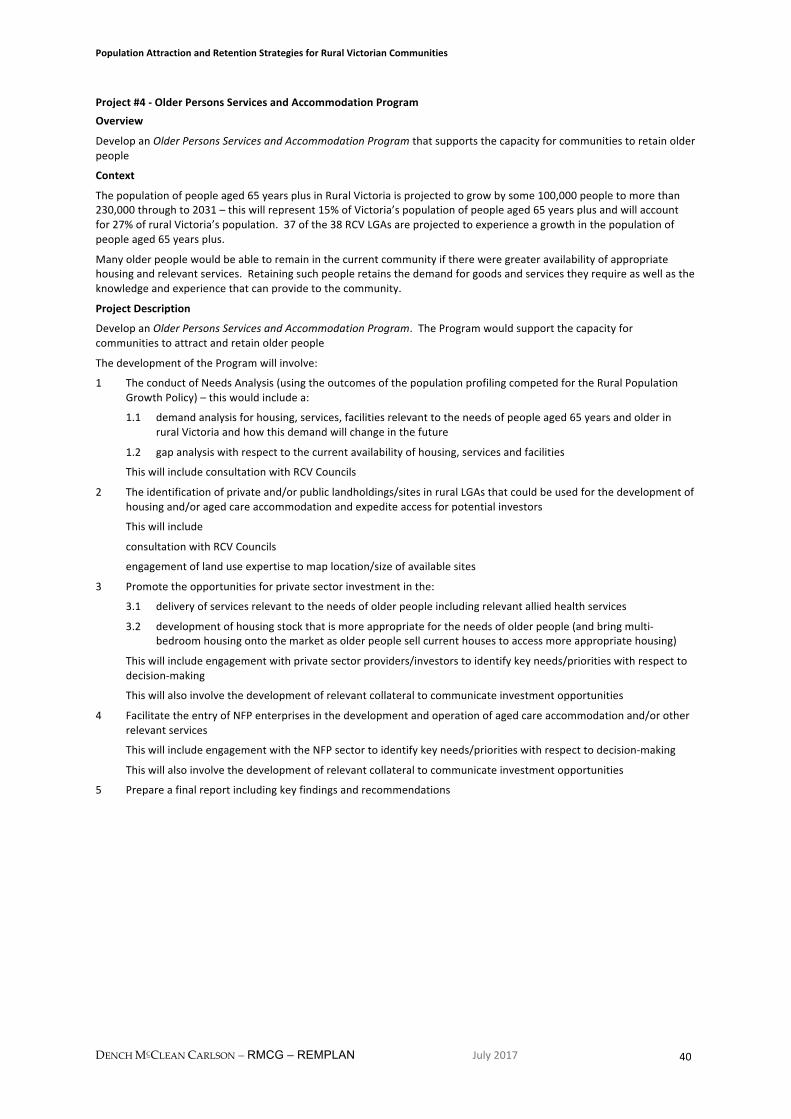
PopulationAttractionandRetentionStrategiesforRuralVictorianCommunities
DENCH MCCLEAN CARLSON – RMCG – REMPLAN July2017 40
Project#4-OlderPersonsServicesandAccommodationProgramOverview
DevelopanOlderPersonsServicesandAccommodationProgramthatsupportsthecapacityforcommunitiestoretainolderpeople
Context
Thepopulationofpeopleaged65yearsplusinRuralVictoriaisprojectedtogrowbysome100,000peopletomorethan230,000throughto2031–thiswillrepresent15%ofVictoria’spopulationofpeopleaged65yearsplusandwillaccountfor27%ofruralVictoria’spopulation.37ofthe38RCVLGAsareprojectedtoexperienceagrowthinthepopulationofpeopleaged65yearsplus.
Manyolderpeoplewouldbeabletoremaininthecurrentcommunityifthereweregreateravailabilityofappropriatehousingandrelevantservices.Retainingsuchpeopleretainsthedemandforgoodsandservicestheyrequireaswellastheknowledgeandexperiencethatcanprovidetothecommunity.
ProjectDescription
DevelopanOlderPersonsServicesandAccommodationProgram.TheProgramwouldsupportthecapacityforcommunitiestoattractandretainolderpeople
ThedevelopmentoftheProgramwillinvolve:
1 TheconductofNeedsAnalysis(usingtheoutcomesofthepopulationprofilingcompetedfortheRuralPopulationGrowthPolicy)–thiswouldincludea:
1.1 demandanalysisforhousing,services,facilitiesrelevanttotheneedsofpeopleaged65yearsandolderinruralVictoriaandhowthisdemandwillchangeinthefuture
1.2 gapanalysiswithrespecttothecurrentavailabilityofhousing,servicesandfacilities
ThiswillincludeconsultationwithRCVCouncils
2 Theidentificationofprivateand/orpubliclandholdings/sitesinruralLGAsthatcouldbeusedforthedevelopmentofhousingand/oragedcareaccommodationandexpediteaccessforpotentialinvestors
Thiswillinclude
consultationwithRCVCouncils
engagementoflanduseexpertisetomaplocation/sizeofavailablesites
3 Promotetheopportunitiesforprivatesectorinvestmentinthe:
3.1 deliveryofservicesrelevanttotheneedsofolderpeopleincludingrelevantalliedhealthservices
3.2 developmentofhousingstockthatismoreappropriatefortheneedsofolderpeople(andbringmulti-bedroomhousingontothemarketasolderpeoplesellcurrenthousestoaccessmoreappropriatehousing)
Thiswillincludeengagementwithprivatesectorproviders/investorstoidentifykeyneeds/prioritieswithrespecttodecision-making
Thiswillalsoinvolvethedevelopmentofrelevantcollateraltocommunicateinvestmentopportunities
4 FacilitatetheentryofNFPenterprisesinthedevelopmentandoperationofagedcareaccommodationand/orotherrelevantservices
ThiswillincludeengagementwiththeNFPsectortoidentifykeyneeds/prioritieswithrespecttodecision-making
Thiswillalsoinvolvethedevelopmentofrelevantcollateraltocommunicateinvestmentopportunities
5 Prepareafinalreportincludingkeyfindingsandrecommendations
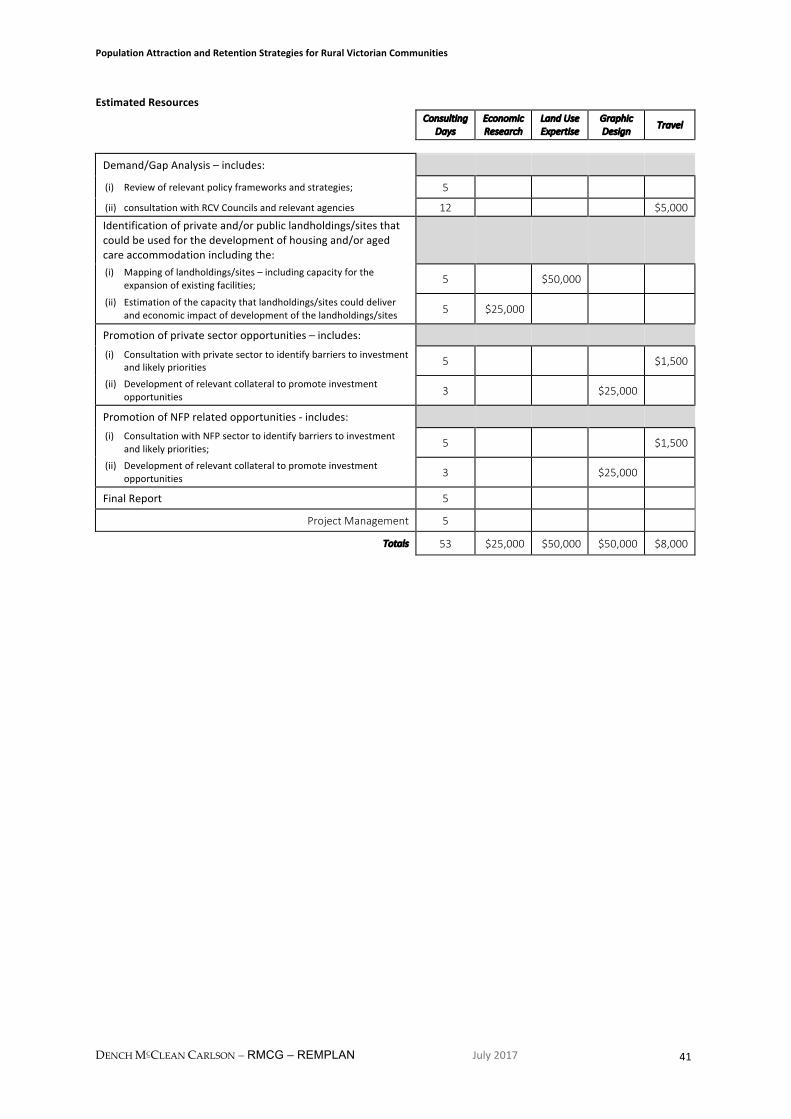
PopulationAttractionandRetentionStrategiesforRuralVictorianCommunities
DENCH MCCLEAN CARLSON – RMCG – REMPLAN July2017 41
EstimatedResources
Consulting
DaysEconomicResearch
LandUseExpertise
GraphicDesign
Travel
Demand/GapAnalysis–includes:
(i) Reviewofrelevantpolicyframeworksandstrategies; 5
(ii) consultationwithRCVCouncilsandrelevantagencies 12 $5,000Identificationofprivateand/orpubliclandholdings/sitesthatcouldbeusedforthedevelopmentofhousingand/oragedcareaccommodationincludingthe:
(i) Mappingoflandholdings/sites–includingcapacityfortheexpansionofexistingfacilities; 5 $50,000
(ii) Estimationofthecapacitythatlandholdings/sitescoulddeliverandeconomicimpactofdevelopmentofthelandholdings/sites 5 $25,000
Promotionofprivatesectoropportunities–includes:
(i) Consultationwithprivatesectortoidentifybarrierstoinvestmentandlikelypriorities 5 $1,500
(ii) Developmentofrelevantcollateraltopromoteinvestmentopportunities 3 $25,000
PromotionofNFPrelatedopportunities-includes:
(i) ConsultationwithNFPsectortoidentifybarrierstoinvestmentandlikelypriorities; 5 $1,500
(ii) Developmentofrelevantcollateraltopromoteinvestmentopportunities 3 $25,000
FinalReport 5
ProjectManagement 5
Totals 53 $25,000 $50,000 $50,000 $8,000
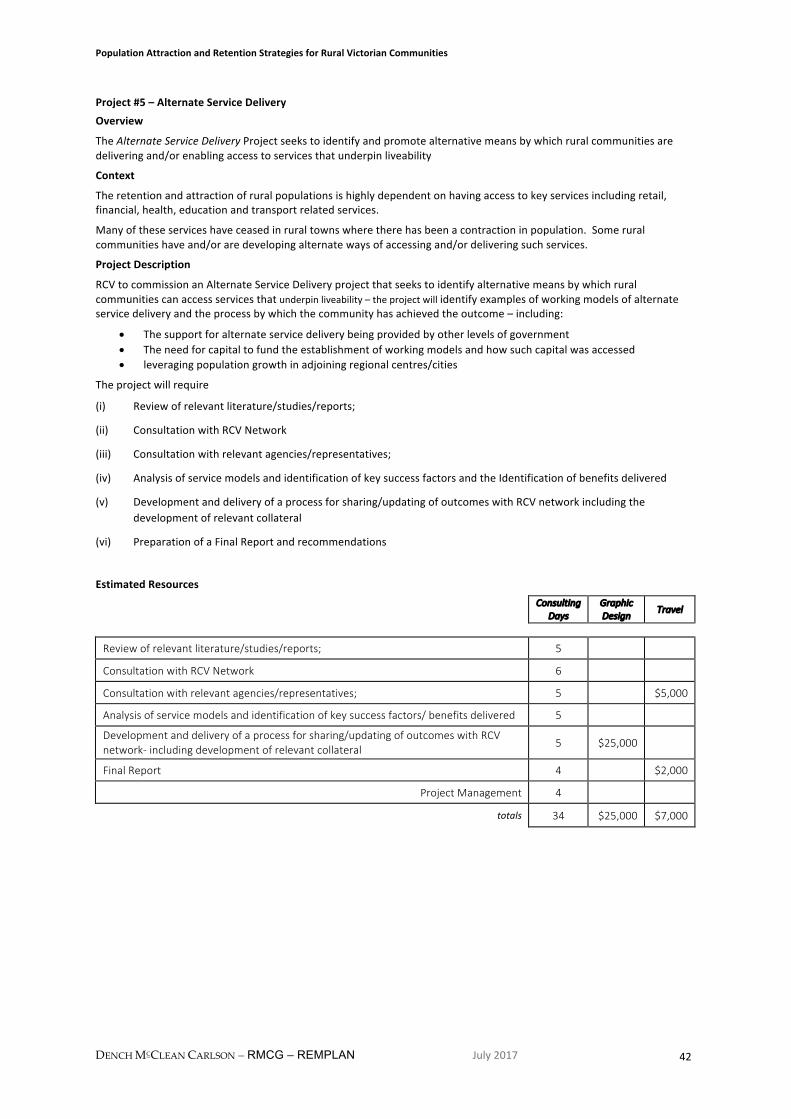
PopulationAttractionandRetentionStrategiesforRuralVictorianCommunities
DENCH MCCLEAN CARLSON – RMCG – REMPLAN July2017 42
Project#5–AlternateServiceDeliveryOverview
TheAlternateServiceDeliveryProjectseekstoidentifyandpromotealternativemeansbywhichruralcommunitiesaredeliveringand/orenablingaccesstoservicesthatunderpinliveability
Context
Theretentionandattractionofruralpopulationsishighlydependentonhavingaccesstokeyservicesincludingretail,financial,health,educationandtransportrelatedservices.
Manyoftheseserviceshaveceasedinruraltownswheretherehasbeenacontractioninpopulation.Someruralcommunitieshaveand/oraredevelopingalternatewaysofaccessingand/ordeliveringsuchservices.
ProjectDescription
RCVtocommissionanAlternateServiceDeliveryprojectthatseekstoidentifyalternativemeansbywhichruralcommunitiescanaccessservicesthatunderpinliveability–theprojectwillidentifyexamplesofworkingmodelsofalternateservicedeliveryandtheprocessbywhichthecommunityhasachievedtheoutcome–including:
• Thesupportforalternateservicedeliverybeingprovidedbyotherlevelsofgovernment• Theneedforcapitaltofundtheestablishmentofworkingmodelsandhowsuchcapitalwasaccessed• leveragingpopulationgrowthinadjoiningregionalcentres/cities
Theprojectwillrequire
(i) Reviewofrelevantliterature/studies/reports;
(ii) ConsultationwithRCVNetwork
(iii) Consultationwithrelevantagencies/representatives;
(iv) AnalysisofservicemodelsandidentificationofkeysuccessfactorsandtheIdentificationofbenefitsdelivered
(v) Developmentanddeliveryofaprocessforsharing/updatingofoutcomeswithRCVnetworkincludingthedevelopmentofrelevantcollateral
(vi) PreparationofaFinalReportandrecommendations
EstimatedResources Consulting
DaysGraphicDesign Travel
Reviewofrelevantliterature/studies/reports; 5
ConsultationwithRCVNetwork 6
Consultationwithrelevantagencies/representatives; 5 $5,000
Analysisofservicemodelsandidentificationofkeysuccessfactors/benefitsdelivered 5
Developmentanddeliveryofaprocessforsharing/updatingofoutcomeswithRCVnetwork-includingdevelopmentofrelevantcollateral 5 $25,000
FinalReport 4 $2,000
ProjectManagement 4
totals 34 $25,000 $7,000
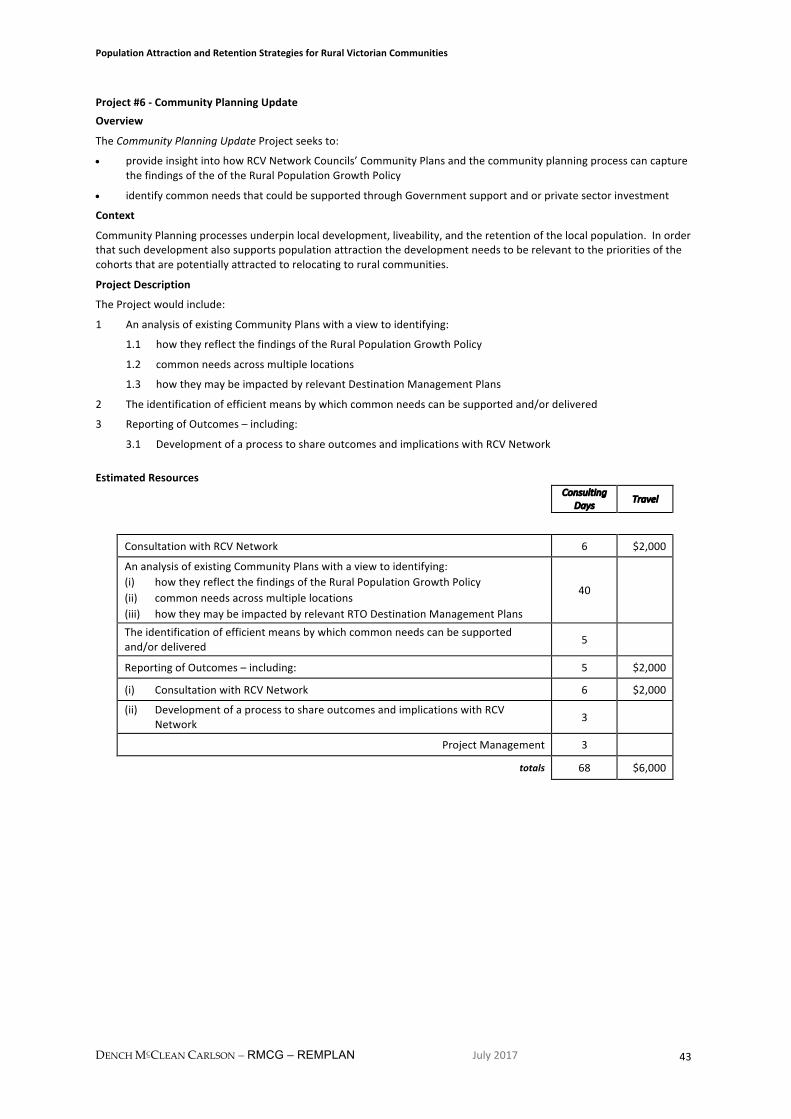
PopulationAttractionandRetentionStrategiesforRuralVictorianCommunities
DENCH MCCLEAN CARLSON – RMCG – REMPLAN July2017 43
Project#6-CommunityPlanningUpdateOverview
TheCommunityPlanningUpdateProjectseeksto:
• provideinsightintohowRCVNetworkCouncils’CommunityPlansandthecommunityplanningprocesscancapturethefindingsoftheoftheRuralPopulationGrowthPolicy
• identifycommonneedsthatcouldbesupportedthroughGovernmentsupportandorprivatesectorinvestment
Context
CommunityPlanningprocessesunderpinlocaldevelopment,liveability,andtheretentionofthelocalpopulation.Inorderthatsuchdevelopmentalsosupportspopulationattractionthedevelopmentneedstoberelevanttotheprioritiesofthecohortsthatarepotentiallyattractedtorelocatingtoruralcommunities.
ProjectDescription
TheProjectwouldinclude:
1 AnanalysisofexistingCommunityPlanswithaviewtoidentifying:
1.1 howtheyreflectthefindingsoftheRuralPopulationGrowthPolicy
1.2 commonneedsacrossmultiplelocations
1.3 howtheymaybeimpactedbyrelevantDestinationManagementPlans
2 Theidentificationofefficientmeansbywhichcommonneedscanbesupportedand/ordelivered
3 ReportingofOutcomes–including:
3.1 DevelopmentofaprocesstoshareoutcomesandimplicationswithRCVNetwork
EstimatedResources
ConsultingDays Travel
ConsultationwithRCVNetwork 6 $2,000
AnanalysisofexistingCommunityPlanswithaviewtoidentifying:(i) howtheyreflectthefindingsoftheRuralPopulationGrowthPolicy(ii) commonneedsacrossmultiplelocations(iii) howtheymaybeimpactedbyrelevantRTODestinationManagementPlans
40
Theidentificationofefficientmeansbywhichcommonneedscanbesupportedand/ordelivered 5
ReportingofOutcomes–including: 5 $2,000
(i) ConsultationwithRCVNetwork 6 $2,000
(ii) DevelopmentofaprocesstoshareoutcomesandimplicationswithRCVNetwork 3
ProjectManagement 3
totals 68 $6,000
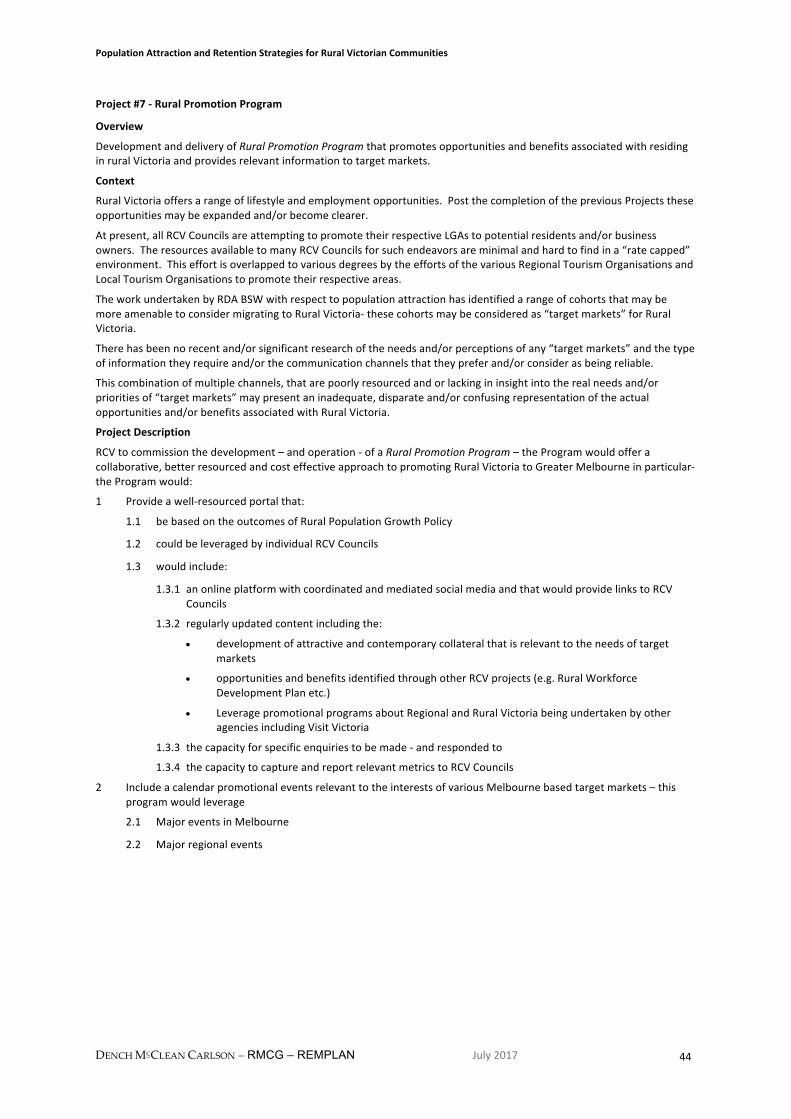
PopulationAttractionandRetentionStrategiesforRuralVictorianCommunities
DENCH MCCLEAN CARLSON – RMCG – REMPLAN July2017 44
Project#7-RuralPromotionProgram
Overview
DevelopmentanddeliveryofRuralPromotionProgramthatpromotesopportunitiesandbenefitsassociatedwithresidinginruralVictoriaandprovidesrelevantinformationtotargetmarkets.
Context
RuralVictoriaoffersarangeoflifestyleandemploymentopportunities.PostthecompletionofthepreviousProjectstheseopportunitiesmaybeexpandedand/orbecomeclearer.
Atpresent,allRCVCouncilsareattemptingtopromotetheirrespectiveLGAstopotentialresidentsand/orbusinessowners.TheresourcesavailabletomanyRCVCouncilsforsuchendeavorsareminimalandhardtofindina“ratecapped”environment.ThiseffortisoverlappedtovariousdegreesbytheeffortsofthevariousRegionalTourismOrganisationsandLocalTourismOrganisationstopromotetheirrespectiveareas.
TheworkundertakenbyRDABSWwithrespecttopopulationattractionhasidentifiedarangeofcohortsthatmaybemoreamenabletoconsidermigratingtoRuralVictoria-thesecohortsmaybeconsideredas“targetmarkets”forRuralVictoria.
Therehasbeennorecentand/orsignificantresearchoftheneedsand/orperceptionsofany“targetmarkets”andthetypeofinformationtheyrequireand/orthecommunicationchannelsthattheypreferand/orconsiderasbeingreliable.
Thiscombinationofmultiplechannels,thatarepoorlyresourcedandorlackingininsightintotherealneedsand/orprioritiesof“targetmarkets”maypresentaninadequate,disparateand/orconfusingrepresentationoftheactualopportunitiesand/orbenefitsassociatedwithRuralVictoria.
ProjectDescription
RCVtocommissionthedevelopment–andoperation-ofaRuralPromotionProgram–theProgramwouldofferacollaborative,betterresourcedandcosteffectiveapproachtopromotingRuralVictoriatoGreaterMelbourneinparticular-theProgramwould:
1 Provideawell-resourcedportalthat:
1.1 bebasedontheoutcomesofRuralPopulationGrowthPolicy
1.2 couldbeleveragedbyindividualRCVCouncils
1.3 wouldinclude:
1.3.1 anonlineplatformwithcoordinatedandmediatedsocialmediaandthatwouldprovidelinkstoRCVCouncils
1.3.2 regularlyupdatedcontentincludingthe:• developmentofattractiveandcontemporarycollateralthatisrelevanttotheneedsoftarget
markets
• opportunitiesandbenefitsidentifiedthroughotherRCVprojects(e.g.RuralWorkforceDevelopmentPlanetc.)
• LeveragepromotionalprogramsaboutRegionalandRuralVictoriabeingundertakenbyotheragenciesincludingVisitVictoria
1.3.3 thecapacityforspecificenquiriestobemade-andrespondedto
1.3.4 thecapacitytocaptureandreportrelevantmetricstoRCVCouncils
2 IncludeacalendarpromotionaleventsrelevanttotheinterestsofvariousMelbournebasedtargetmarkets–thisprogramwouldleverage
2.1 MajoreventsinMelbourne
2.2 Majorregionalevents
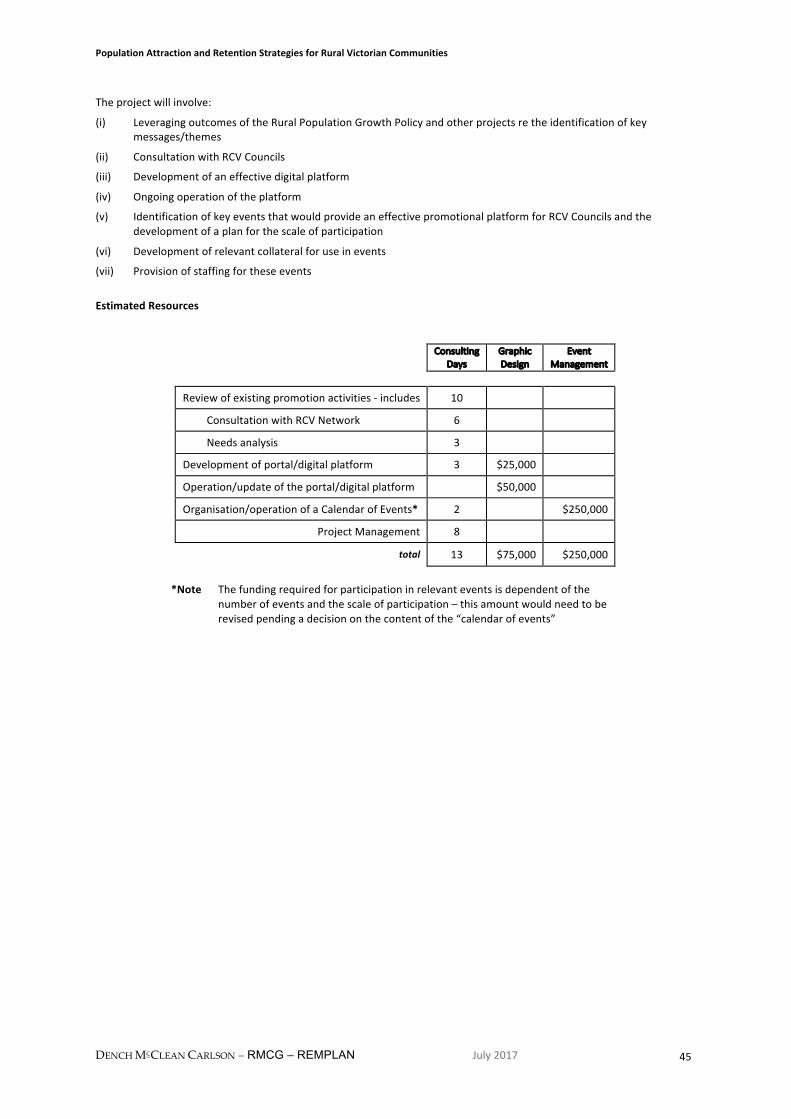
PopulationAttractionandRetentionStrategiesforRuralVictorianCommunities
DENCH MCCLEAN CARLSON – RMCG – REMPLAN July2017 45
Theprojectwillinvolve:
(i) LeveragingoutcomesoftheRuralPopulationGrowthPolicyandotherprojectsretheidentificationofkeymessages/themes
(ii) ConsultationwithRCVCouncils
(iii) Developmentofaneffectivedigitalplatform
(iv) Ongoingoperationoftheplatform
(v) IdentificationofkeyeventsthatwouldprovideaneffectivepromotionalplatformforRCVCouncilsandthedevelopmentofaplanforthescaleofparticipation
(vi) Developmentofrelevantcollateralforuseinevents
(vii) Provisionofstaffingfortheseevents
EstimatedResources
ConsultingDays
GraphicDesign
EventManagement
Reviewofexistingpromotionactivities-includes 10
ConsultationwithRCVNetwork 6
Needsanalysis 3
Developmentofportal/digitalplatform 3 $25,000
Operation/updateoftheportal/digitalplatform $50,000
Organisation/operationofaCalendarofEvents* 2 $250,000
ProjectManagement 8
total 13 $75,000 $250,000
*Note Thefundingrequiredforparticipationinrelevanteventsisdependentofthe
numberofeventsandthescaleofparticipation–thisamountwouldneedtoberevisedpendingadecisiononthecontentofthe“calendarofevents”

PopulationAttractionandRetentionStrategiesforRuralVictorianCommunities
DENCH MCCLEAN CARLSON – RMCG – REMPLAN July2017 46
AppendixII-RCVAnalysis
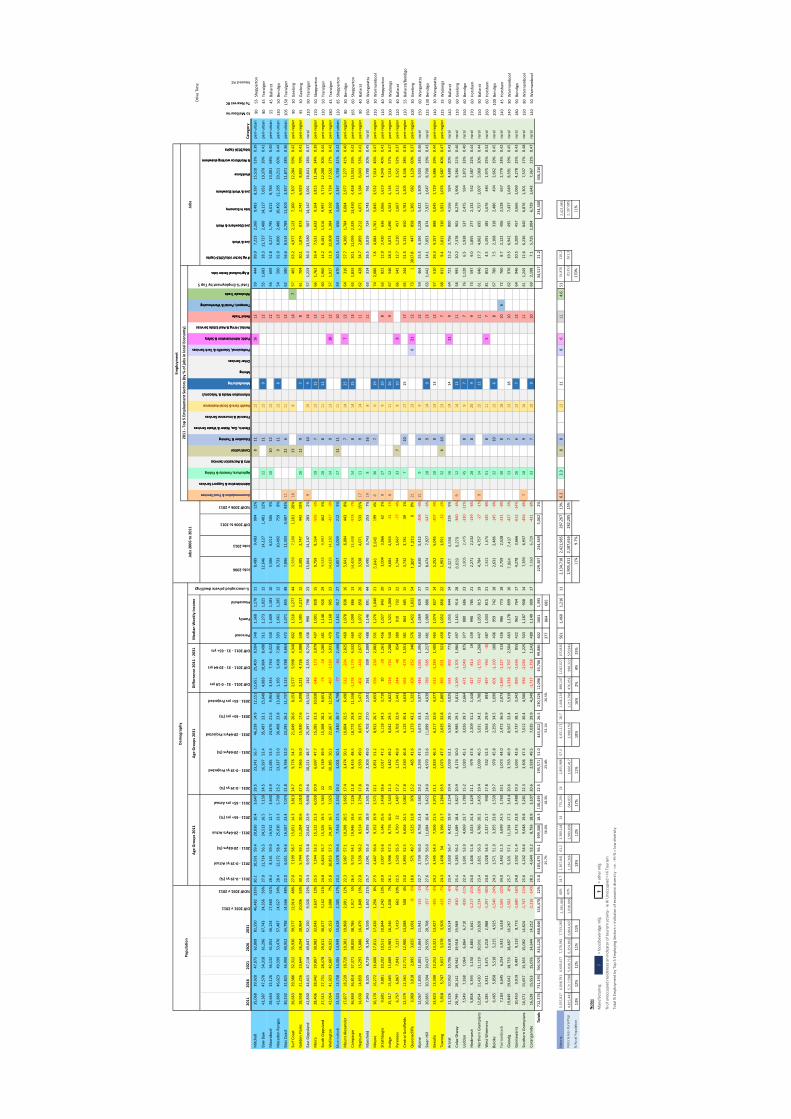
2011
2016
2021
2026
2031
Diff2031v2011
%Diff2031v2011
2011-0-19ys(%)
2011-0-19ysActual
2011-20-64yrs(%)
2011-20-64yrsActual
2011-65+yrs(%)
2011-65+yrsActual
2031-0-19ys(%)
2031-0-19ysProjected
2031-20-64yrs(%)
2031-20-64yrsProjected
2031-65+yrs(%)
2031-65+yrsProjected
Diff2011-31-0-19yrs
Diff2011-31-20-64yrs
Diff2011-31-65+yrs
Personal
Family
Household
Jobs2006
Jobs2011
Diff2006to2011
%Diff2006v2011
#AgSectorJobs/2016Capita
Live&Work
LiveElsewhere&Work
JobsinEconomy
Live&WorkElsewhere
Workforce
%Workforceworkingelsewhere
Jobs/2016Capita
Category
toMelbourne
ToNearestRC
NearestRC
Mitche
ll35,068
39,920
47,075
62,808
81,550
46,482
133%
30.2
10,591
59.4
20,830
10.4
3,647
28.5
23,242
56.7
46,239
14.9
12,151
12,651
25,409
8,504
548
1,368
1,170
118,489
9,483
994
12%
811
1216
1259
444
89.9
7,223
2,260
9,483
8,287
15,510
53%
0.39
peri-urban
9055
Shep
parton
BawBaw
43,387
47,578
54,318
61,296
67,743
24,356
56%
27.0
11,714
56.5
24,513
16.5
7,159
24.5
16,597
52.4
35,497
23.1
15,649
4,883
10,984
8,490
511
1,273
1,025
1212,646
14,127
1,481
12%
1211
129
1255
1,683
28.3
11,727
2,400
14,127
7,652
19,379
39%
0.41
peri-urban
8045
Traralgon
Moo
rabo
ol28,664
32,126
36,132
41,052
46,124
17,460
61%
28.4
8,141
59.0
16,912
12.7
3,640
24.9
11,485
53.5
24,676
21.6
9,963
3,344
7,764
6,322
540
1,409
1,183
105,506
6,012
506
9%10
1012
1212
56609
52.8
4,217
1,795
6,012
8,784
13,001
68%
0.40
peri-urban
5545
Ballarat
Maced
onRanges
42,860
46,023
49,599
53,470
57,487
14,627
34%
28.4
12,172
58.4
25,030
13.3
5,700
23.2
13,337
53.0
30,468
23.8
13,682
1,165
5,438
7,981
593
1,661
1,395
129,733
10,492
759
8%9
1112
813
54500
92.0
8,006
2,486
10,492
12,205
20,211
60%
0.44
peri-urban
130
50Be
ndigo
BassCoast
30,232
32,825
36,990
40,952
44,798
14,566
48%
22.0
6,651
54.6
16,507
23.4
7,074
21.8
9,766
52.0
23,295
26.2
11,737
3,115
6,788
4,663
472
1,071
855
487,896
11,303
3,407
43%
1122
611
1262
580
56.6
8,514
2,789
11,303
3,357
11,871
28%
0.36
peri-urban
105
150Traralgon
SurfCoast
26,663
29,386
32,312
35,930
39,577
12,914
48%
27.0
7,199
58.7
15,651
14.3
3,813
24.7
9,776
54.7
21,649
20.6
8,153
2,577
5,998
4,340
602
1,516
1,277
445,939
7,100
1,161
20%
1613
814
757
465
63.2
4,977
2,123
7,100
7,307
12,284
59%
0.42
peri-region
9030
Geelon
g
Golden
Plains
18,958
21,216
23,644
26,254
28,964
10,006
53%
30.3
5,744
59.1
11,204
10.6
2,010
27.5
7,965
55.0
15,930
17.6
5,098
2,221
4,726
3,088
538
1,385
1,217
122,305
2,747
442
19%
2611
97
861
704
30.1
1,874
873
2,747
6,929
8,803
79%
0.41
peri-region
9530
Geelon
g
EastGippsland
42,830
44,415
47,118
49,647
52,150
9,320
22%
23.3
9,979
53.8
23,042
22.9
9,808
19.6
10,221
48.7
25,397
31.7
16,532
242
2,355
6,724
436
990
798
2313,864
14,147
283
2%9
1015
914
571,223
36.3
13,580
567
14,147
3,061
16,641
18%
0.37
rural
210
90Traralgon
Moira
28,406
28,942
29,897
30,982
32,043
3,637
13%
25.5
7,244
53.2
15,112
21.3
6,050
20.9
6,697
47.7
15,285
31.3
10,030
-546
173
3,979
437
1,001
828
159,759
9,164
-595
-6%
197
1215
1266
1,762
16.4
7,531
1,633
9,164
3,815
11,346
34%
0.39
peri-region
170
50Shep
parton
SouthGipp
sland
27,515
27,751
28,478
29,611
30,677
3,162
11%
24.8
6,824
55.7
15,326
19.5
5,365
226,749
49.9
15,308
28.2
8,651
-75
-18
3,285
481
1,148
920
299,535
9,997
462
5%20
811
1111
601,960
14.2
8,481
1,516
9,997
3,719
12,200
30%
0.44
peri-region
120
50Traralgon
Wellington
42,064
41,923
42,687
43,921
45,153
3,088
7%25.8
10,853
57.5
24,187
16.7
7,025
2310,385
50.2
22,667
26.7
12,056
-467
-1,520
5,031
479
1,168
905
2314,629
14,192
-437
-3%
149
1310
1257
1,917
21.9
12,808
1,384
14,192
4,724
17,532
27%
0.42
peri-region
180
45Traralgon
Murrin
dind
i13,324
13,758
14,304
14,939
15,628
2,305
17%
23.1
3,078
59.4
7,914
17.5
2,332
19.2
3,001
50.1
7,830
30.7
4,798
-77
-84
2,466
473
1,161
917
273,857
4,069
212
5%17
1111
1110
59670
20.5
3,413
656
4,069
2,347
5,760
41%
0.42
peri-urban
120
85Shep
parton
Mou
ntAlexand
er17,877
18,239
18,729
19,301
19,968
2,091
12%
22.3
3,987
57.1
10,208
20.5
3,665
17.4
3,474
50.1
10,004
32.5
6,490
-512
-204
2,825
460
1,078
838
165,641
6,084
443
8%7
1425
712
64316
57.7
4,300
1,784
6,084
2,977
7,277
41%
0.40
peri-region
8030
Bend
igo
Campaspe
36,869
36,814
37,371
38,055
38,786
1,917
5%26.4
9,733
54.1
19,946
19.6
7,226
21.8
8,455
48.4
18,772
29.8
11,558
-1,278
-1,174
4,332
469
1,099
886
1314,408
13,430
-978
-7%
148
1415
1363
1,833
20.1
11,095
2,335
13,430
4,458
15,553
29%
0.42
peri-region
165
60Shep
parton
Hepb
urn
14,630
14,859
15,293
15,886
16,479
1,849
13%
22.8
3,336
58.2
8,514
19.1
2,794
17.8
2,933
49.0
8,075
33.2
5,471
-402
-440
2,677
451
1,072
850
263,538
4,071
533
15%
1711
914
1162
428
34.7
2,859
1,212
4,071
3,184
6,043
53%
0.41
peri-region
9040
Ballarat
Mansfield
7,943
8,325
8,719
9,140
9,595
1,652
21%
25.7
2,041
55.3
4,393
18.9
1,501
24.0
2,303
49.0
4,702
27.0
2,591
261
309
1,089
488
1,146
891
443,490
3,743
253
7%19
816
811
63314
26.5
3,019
724
3,743
761
3,780
20%
0.45
rural
150
60Wangaratta
Moyne
16,170
16,272
16,600
17,011
17,426
1,256
8%27.5
4,447
56.6
9,152
15.9
2,571
22.1
3,851
51.2
8,922
26.7
4,653
-596
-230
2,082
531
1,276
1,040
215,646
5,845
199
4%6
367
619
742,086
7.8
4,084
1,761
5,845
3,532
7,616
46%
0.47
peri-region
210
30Warrnam
bool
Strathbo
gie
9,601
9,881
10,202
10,511
10,844
1,242
13%
20.9
2,007
53.6
5,146
25.6
2,458
18.6
2,017
47.2
5,118
34.3
3,719
10-28
1,261
456
1,027
843
203,004
3,066
622%
827
910
863
821
12.0
2,430
636
3,066
1,619
4,049
40%
0.41
peri-region
110
40Shep
parton
Indigo
15,317
15,465
15,689
15,983
16,346
1,030
7%26.1
3,998
57.3
8,776
16.6
2,543
21.3
3,482
49.2
8,042
29.5
4,822
-516
-734
2,280
540
1,321
1,066
124,604
4,563
-41
-1%
812
1126
967
546
28.3
3,073
1,490
4,563
4,143
7,216
57%
0.47
peri-region
200
30Wadon
ga
Pyrene
es6,757
6,867
7,042
7,227
7,419
662
10%
22.5
1,520
55.5
3,750
221,487
17.2
1,276
49.9
3,702
32.9
2,441
-244
-48
954
389
910
732
221,744
1,667
-77
-4%
337
810
966
542
12.7
1,210
457
1,667
1,312
2,522
52%
0.37
peri-region
120
40Ba
llarat
CentralG
oldfields
12,579
12,561
12,711
12,900
13,088
508
4%23.0
2,893
52.5
6,604
24.5
3,082
17.8
2,330
46.8
6,125
35.4
4,633
-564
-479
1,551
381
864
685
153,732
3,781
491%
710
1715
1765
244
51.5
3,131
650
3,781
1,205
4,336
28%
0.35
peri-region
120
55Ba
llarat/Be
ndigo
Que
enscliffe
3,069
3,018
2,995
3,025
3,061
-80%
18.6
571
49.7
1,525
31.8
976
15.2
465
41.6
1,273
43.2
1,322
-106
-252
346
576
1,422
1,022
541,307
1,313
60%
2113
621
1273
1
3017.8
447
858
1,305
682
1,129
60%
0.37
peri-region
100
30Ge
elon
g
Alpine
12,067
11,835
11,801
11,864
11,942
-125
-1%
22.7
2,739
56.0
6,758
21.4
2,582
19.2
2,293
47.5
5,673
33.3
3,977
-446
-1,085
1,394
462
1,069
829
275,630
5,422
-208
-4%
219
89
1259
464
25.5
4,194
1,228
5,422
1,309
5,503
24%
0.46
rural
150
60Wangaratta
SwanHill
20,865
20,394
20,437
20,555
20,708
-157
-1%
27.6
5,759
56.0
11,684
16.4
3,422
24.0
4,970
53.6
11,099
22.4
4,639
-789
-585
1,217
481
1,089
886
138,474
7,927
-547
-6%
189
149
1363
1,442
14.1
7,053
874
7,927
1,647
8,700
19%
0.43
rural
225
130Be
ndigo
Benalla
13,823
13,390
13,252
13,321
13,427
-395
-3%
24.2
3,345
54.3
7,506
21.5
2,972
21.1
2,833
46.3
6,217
32.6
4,377
-512
-1,289
1,405
465
1,074
827
145,252
5,045
-207
-4%
108
1313
1257
510
26.3
4,157
888
5,045
1,729
5,886
29%
0.44
peri-region
140
30Wangaratta
Towon
g5,918
5,747
5,657
5,578
5,503
-415
-7%
24.3
1,438
543,196
21.7
1,284
19.5
1,073
47.7
2,625
32.8
1,805
-365
-571
521
459
1,052
850
221,953
1,921
-32
-2%
326
1013
768
611
9.4
1,611
310
1,921
1,076
2,687
40%
0.47
peri-region
225
35Wadon
ga
Ararat
11,326
10,952
10,706
10,618
10,614
-713
-6%
23.4
2,650
56.7
6,422
19.9
2,254
19.4
2,059
52.1
5,530
28.5
3,025
-591
-892
771
479
1,055
844
144,321
4,556
235
5%16
1414
119
64721
15.2
3,756
800
4,556
924
4,680
20%
0.43
rural
140
60Ba
llarat
ColacOtw
ay20,799
20,142
19,942
19,918
19,969
-830
-4%
25.4
5,283
56.2
11,689
18.4
3,827
20.9
4,174
50.0
9,985
29.1
5,811
-1,109
-1,705
1,984
497
1,161
914
288,639
8,279
-360
-4%
912
1413
1158
995
20.2
7,378
901
8,279
1,906
9,284
21%
0.46
rural
110
60Ge
elon
g
Lodd
on7,549
7,268
7,064
6,864
6,710
-839
-11%
22.4
1,691
53.9
4,069
23.7
1,789
15.2
1,020
45.1
3,026
39.7
2,664
-671
-1,043
875
377
880
686
232,805
2,475
-330
-12%
458
97
776
1,120
6.5
1,938
537
2,475
934
2,872
33%
0.40
rural
150
60Be
ndigo
Hind
marsh
5,858
5,393
5,130
4,883
4,641
-1,217
-21%
24.0
1,406
51.6
3,023
24.4
1,429
21.1
979
47.6
2,209
31.2
1,448
-427
-814
19439
990
785
212,271
2,132
-139
-6%
288
209
973
597
9.0
1,855
277
2,132
532
2,387
22%
0.44
rural
270
60Ho
rsham
NorthernGram
pians
12,054
11,420
11,119
10,931
10,820
-1,234
-10%
23.4
2,821
56.3
6,786
20.2
2,435
19.4
2,099
46.5
5,031
34.2
3,700
-722
-1,755
1,266
447
1,053
815
194,784
4,757
-27
-1%
914
1512
1161
646
17.7
4,062
695
4,757
1,007
5,069
20%
0.44
rural
150
90Ba
llarat
WestW
immera
4,285
3,811
3,471
3,210
2,988
-1,297
-30%
24.0
1,028
54.3
2,327
21.7
930
17.8
532
52.3
1,563
29.9
893
-497
-764
-36
487
1,033
815
211,821
1,676
-145
-8%
518
115
781
852
4.5
1,491
185
1,676
484
1,975
25%
0.52
rural
260
60Ho
rsham
Buloke
6,465
5,858
5,518
5,215
4,925
-1,540
-24%
24.3
1,571
51.9
3,355
23.8
1,539
19.7
970
45.8
2,256
34.5
1,699
-601
-1,100
160
406
959
742
182,631
2,486
-145
-6%
3210
126
867
786
7.5
2,168
318
2,486
494
2,662
19%
0.45
rural
200
100Be
ndigo
Yarriambiack
7,183
6,645
6,254
5,931
5,618
-1,565
-22%
34.0
2,442
51.5
3,699
24.5
1,760
19.1
1,073
44.0
2,472
36.9
2,073
-1,369
-1,227
313
426
986
773
182,759
2,528
-231
-8%
308
1810
672
760
8.7
2,122
406
2,528
657
2,779
24%
0.42
rural
240
45Ho
rsham
Glen
elg
19,849
19,042
18,733
18,487
18,267
-1,582
-8%
25.7
5,101
57.1
11,334
17.2
3,414
20.6
3,763
46.9
8,567
32.4
5,919
-1,338
-2,767
2,504
463
1,178
899
167,864
7,437
-427
-5%
137
1318
1062
976
19.5
6,942
495
7,437
1,649
8,591
19%
0.45
rural
240
80Warrnam
bool
Gann
awarra
10,453
9,919
9,497
9,119
8,773
-1,680
-16%
24.8
2,592
51.4
5,373
23.8
2,488
19.3
1,693
42.6
3,737
38.1
3,342
-899
-1,636
855
422
962
764
174,278
3,666
-612
-14%
266
127
1264
946
10.5
3,209
457
3,666
1,069
4,278
25%
0.43
rural
180
90Be
ndigo
Southe
rnGrampians
16,571
15,657
15,363
15,082
14,824
-1,747
-11%
25.6
4,242
54.6
9,048
19.8
3,281
22.3
3,306
47.3
7,012
30.4
4,506
-936
-2,036
1,225
503
1,187
908
147,393
6,937
-456
-6%
718
916
1161
1,245
12.6
6,236
640
6,876
1,301
7,537
17%
0.48
rural
150
80Warrnam
bool
Corangam
ite16,528
15,553
15,076
14,644
14,212
-2,316
-14%
28.1
4,644
53.2
8,793
18.8
3,107
20.6
2,928
49.5
7,035
29.9
4,249
-1,717
-1,758
1,142
480
1,149
909
177,160
6,729
-431
-6%
337
109
1069
2,198
7.1
5,725
1,004
6,729
1,642
7,367
22%
0.47
rural
140
50Warrnam
bool
Totals
712,376
731,193
766,925
816,120
868,846
156,470
22%
25.8
183,475
56.1
399,306
18.3
130,439
22.5
195,571
51.0
443,012
26.5
230,326
12,096
43,706
99,886
602
1661
1,395
229,307
234,369
5,062
2%34,517
21.2
234,300
306,316
25.7%
56.0%
18.3%
23.4%
53.1%
26.5%
377
864
685
Victoria
5,53
7,81
76,04
8,79
16,60
5,67
77,17
0,98
27,73
3,28
32,19
5,46
640
%24
.71,36
7,84
161
.23,38
9,14
414
775,29
424
1,85
5,98
857
.34,43
1,17
118
.71,44
6,12
448
8,14
71,04
2,02
767
0,83
0561
1,460
1,216
112,134,718
2,421,985
287,267
13%
6.2
2.3
88
1211
86
114.6
5154
,870
11
0.2
2,42
1,98
5
VictorialessRuralPop
4,82
5,44
15,31
7,59
85,83
8,75
26,35
4,86
26,86
4,43
72,03
8,99
642
%1,18
4,36
62,98
9,83
864
4,85
51,66
0,41
73,98
8,15
91,21
5,79
847
6,05
199
8,32
257
0,94
31,905,411
2,187,616
282,205
15%
20,353
261.3
2,18
7,68
5
%RuralPop
ulation
13%
12%
12%
11%
11%
13%
12%
17%
11%
10%
16%
2%4%
15%
11%
9.7%
170%
11%
Notes
Manufacturin
g?
=fo
od/beveridgem
fg?
=otherm
fg
%ofu
noccup
iedresid
encesanindicatoro
ftou
rismactivity-ieHiU
noccup
ied=HiTou
rism
Total%
Employmentb
yTop5Em
ployingSectors=indicatoro
fecono
micdiversity-i.e.:-Hi%
=lowdiversity
%unoccupiedprivatedwellings
Jobs200
6to201
1Po
pulatio
n
Mining
OtherServices
Demograph
y2011-To
p5Em
ploymen
tSectors(b
y%ofjob
sinlocalEcono
my)
PublicAdministration&Safety
Employmen
t
Rental,Hiring&RealEstateServices
RetailTrade
Professional,Scientific&TechServices
AgeGrou
ps2011
Accommodation&FoodServices
Administrative&SupportServices
Agriculture,Forestry&Fishing
Arts&RecreationServices
Construction
Med
ianWeeklyIncome
Diffe
rren
ce2011-2
031
AgeGrou
ps2031
Education&Training
Electric,Gas,Water&WasteServices
Financial&InsuranceServices
HealthCare&SocialAssistance
InformationMedia&Telecom/s
Manufacturing
DriveTime
Transport,Postal&Warehousing
WholesaleTrade
Total%EmploymentbyTop5
#AgriculturalSectorJobs
Jobs