Policy Implications of Dementia Tsunami May 2, 2014 Joan M Teno MD, MS Professor of Health Services,...
76
Policy Implications of Dementia Tsunami May 2, 2014 Joan M Teno MD, MS Professor of Health Services, Policy, and Practice Warren Alpert School of Medicine
-
Upload
carmel-garrison -
Category
Documents
-
view
214 -
download
0
Transcript of Policy Implications of Dementia Tsunami May 2, 2014 Joan M Teno MD, MS Professor of Health Services,...

Policy Implications ofDementia Tsunami May 2, 2014
Joan M Teno MD, MSProfessor of Health Services, Policy, and Practice Warren Alpert School of Medicine

Overview
From a health system perspective, examine feeding tube decision making in NH residents with advanced cognitive impairment

Objective
Recognize the Demographic Changes in the Number of Older Americans Dying of Dementia
Understand and Debate the policy implications of Medicare and Medicaid financial incentives on care of persons with advanced dementia

Trends of US deaths from Alzheimer’s disease
National Center for Health Statistics

New Data Regarding Dementia As Cause of Death

Dementia: Change as Cause of Death
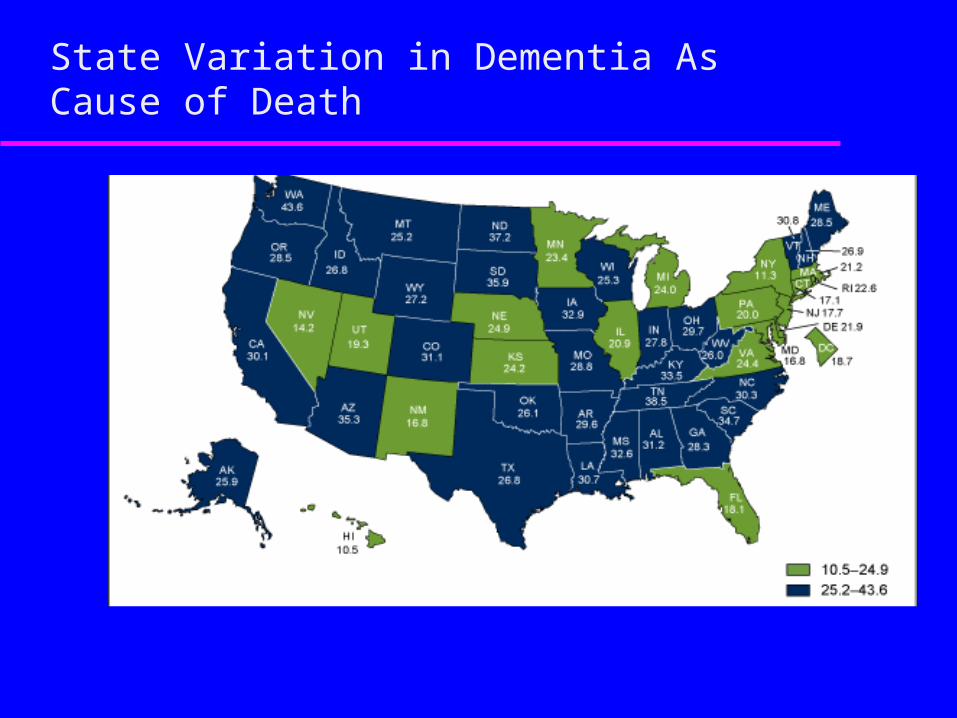
State Variation in Dementia As Cause of Death

New Financial Implications of Dementia (NEJM, 2013)
Current $ 2010• Dementia $109 Billion • Heart $102 Billion • Cancer $ 77 Billion
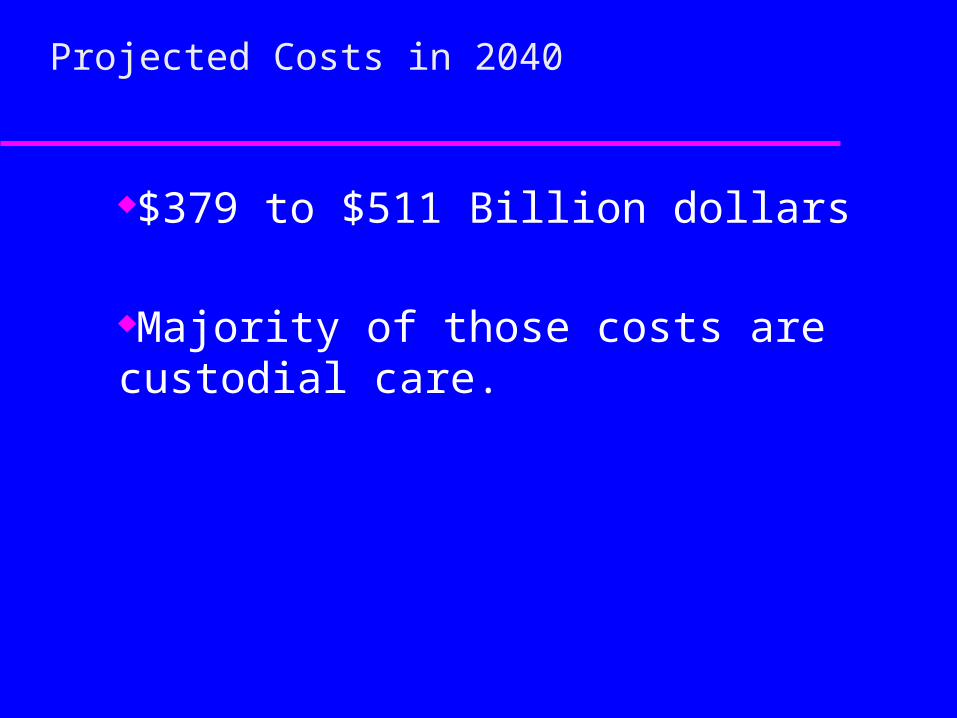
Projected Costs in 2040
$379 to $511 Billion dollars
Majority of those costs are custodial care.
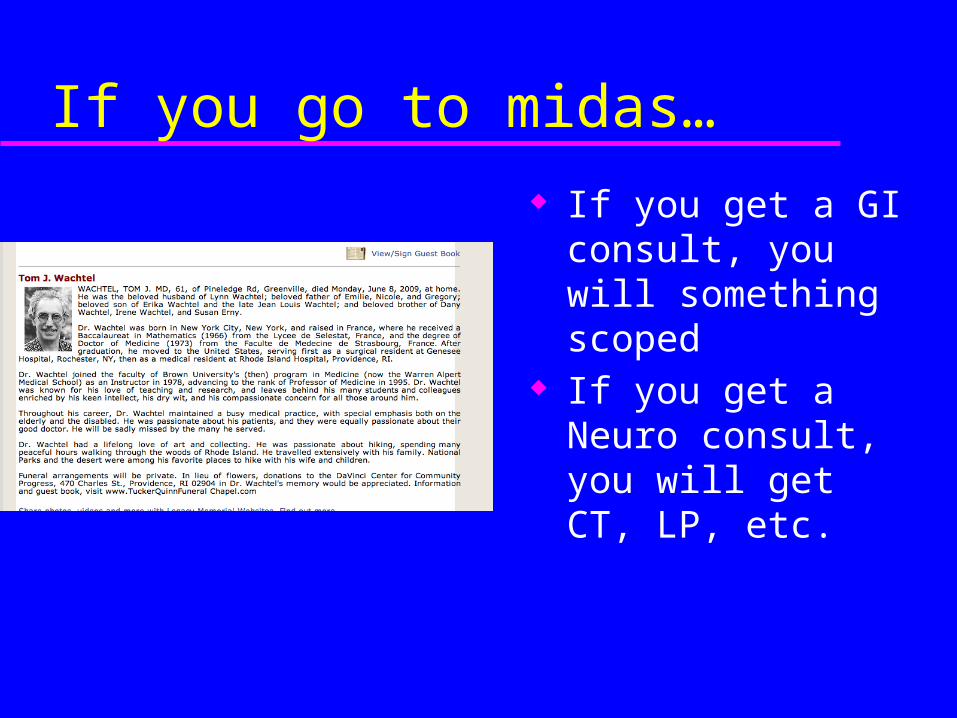
If you go to midas…
If you get a GI consult, you will something scoped
If you get a Neuro consult, you will get CT, LP, etc.

Disease Trajectory in Dementia
• Despite the advances in pharmacologic treatment, dementia is often a terminal illness with trajectory of progressive decline to point of being bed bound with dysphagia that results in recurrent aspiration pneumonias and in ability to maintain nutrition

MILD MODERATE SEVERE ADVANCED
MEMORYPERSONALITYSPATIALDISORIENTATION
APHASIAAPRAXIACONFUSIONAGITATIONINSOMNIA
RESISTIVENESSINCONTINENCEMOTOR IMPAIRMENT
BEDFASTMUTENO MEMORY
TIME
INDEPENDENCE
EATING PROBLEMS
RECURRENT INFECTIONS
?
?INSTITUTIONALIZATION
DRIVING
†

CASCADE
Choices, Attitudes, and Strategies for Care of Advanced Dementia at the End-of-Life
Eligibility 60+ LOS of at least 30 days in NHSevere cognitive impairment –Global Deterioration Scale of 7Proxy

Choices, Attitudes, and Strategies for Care of Advanced Dementia at the End-of-Life

CASCADE: Aims
• To establish a cohort of nursing home residents with advanced dementia and their proxies (families), follow repeatedly for 18 months:
1. Clinical Course2. Decision-Making 3. Satisfaction with End-of-Life Care 4. Complicated Grief

Patients with
advanced dementia
†18
months
Health care
proxy
18 months
3 months
†
2 months post-death
7 months post-death
Death
3 months 3 months 3 months 3 months 3 months

Facilities
• 22 facilities • Within 60 mile radius of Boston• > 60 beds

Eligibility criteria
• Eligibility criteria– > 60 y, length of stay > 30 days– Dementia– Global Deterioration Scale = 7– Proxy available and communicates in
English

1728 residents met screening criteria> 60y, CPS = 5, 6, LOS > 30 days
570 eligibleDementia, GDS=7, HCP available
and speaks English
0.36
323 dyads recruited
0.57
246 HCP refused1 physician refused

Survival
• N=177/323 (55%)• Median = 478 days• 6-months = 25%• 93% die in NH
*Adjusted for age, gender, disease duration

Pneumonia
Probability of > 1 pneumonia: 41% (N=132/323)
6-month mortality after pneumonia: 47%

Survival after Multiple Admissions for Expected Complications of Dementia

Febrile Episodes
Probability of > 1 febrile episode: 53% (N=171/323)
6-month mortality after febrile episode: 44.5%
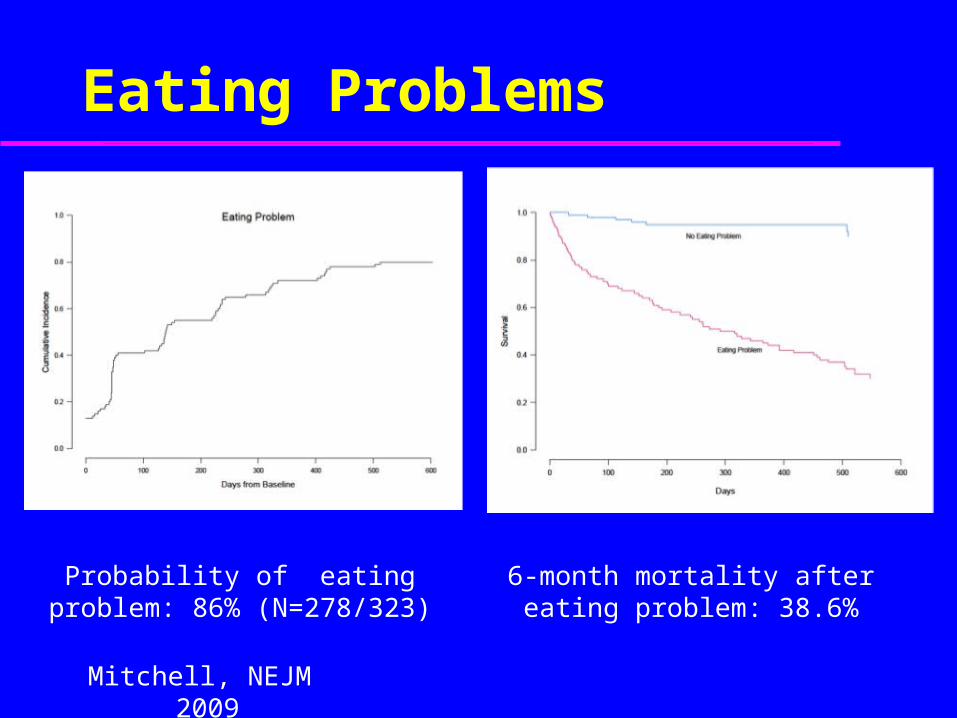
Eating Problems
Probability of eating problem: 86% (N=278/323)
6-month mortality after eating problem: 38.6%
Mitchell, NEJM 2009

Existing evidence regarding feeding tubes in persons with dementia
Structured literature review of observational studies found that feeding tubes was NOT associated:– Improved survival – Healing of pressure sores– Prevention of aspiration pneumonia– Improved quality of life
Finucane, Jama 1999

Rate of Feeding Tube Use Among Nursing Home Residents with Severe Cognitive Impairment
Teno, JAMA 2001

Study of Feeding tubes in Persons with Advance Cognitive Impairment
National MDS data repository Medicare Denominator, Part A and Part B
data Merged to examine the incidence use of
feeding tubes and characterize health care markets that vary in feeding tube incidence

Examining incidence feeding tube insertion among 97241 nursing home residents (74% female, mean age 84.8 years) with Cognitive Performance Score of 4,5, and 6.

Incidence of Feeding tube
Low States– HI– ND– SD– UT– Iowa– Less than 5/1000
• High States– MS 108/1000– AL 100/1000
• Rhode Island – 20/1000
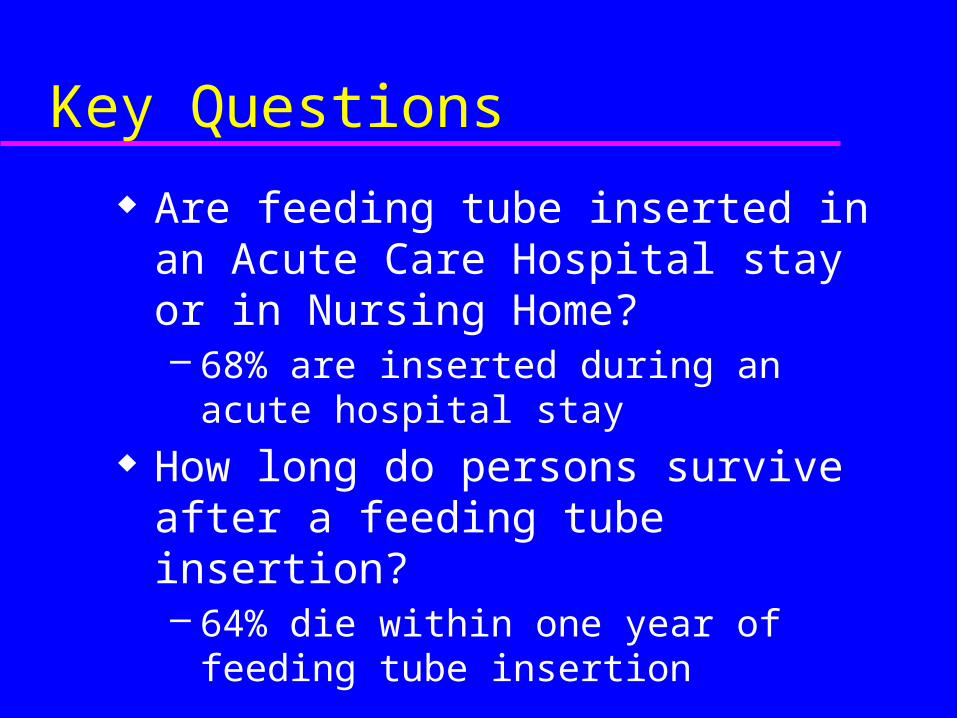
Key Questions
Are feeding tube inserted in an Acute Care Hospital stay or in Nursing Home? – 68% are inserted during an acute hospital stay
How long do persons survive after a feeding tube insertion? – 64% die within one year of feeding tube
insertion

Rate of Health Care Transitions in the Last Six months of Life among NH Residents

Incidence of feeding tubes Insertion


Concerns with retrospective case series
Studies only decedents (tells us nothing about the living)
Potentially ICU care could be saving life Cancer patients may follow different
disease trajectories


Our approach
Prospective cohort that studies a “clean” cohort of NH residents with advance dementia (e.g., Teno JAMA 2010)
Retrospective cohort with decedents – 120 days prior to death with MDS evidence of
advanced cognitive impairment and severe functional dependency (Gozalo, NEJM 2011)


Striking Variation
12% of the Hospitals - NO feeding tube insertion over 8 years
25% hospitals you one in ten chance of getting a feeding tube insertion
Highest, one in three NH residents with advanced dementia had a feeding tube inserted.
Two Hospitals about a mile from each other. One has 3.3 FT insertions per 100 vs. another hospital in LA has 13.3 FT insertions per 100 admission

Factors Associated with Higher FT Insertion Rates
For Profit - AOR 1.33 Larger hospitals AOR 1.48 Hospitals more aggressive care AOR 2.6

Feeding tubes and Survival 0
.25
.5.7
51
Sur
viva
l
0 100 200 300 400Days from Baseline
No FT FT
1 Year Survival from Baseline by FT Status

Rate of Feeding Tube Use Among Nursing Home Residents with Severe Cognitive Impairment
Teno, JAMA 2001

5 State Survey of FT Decision Making
1/2 stated conversations under 15 minutes 1/3 stated did not discuss risks 1/2 said MD strongly in favor 13% stated felt pressured by MD to insert 1/4 family member regretted the decision

And there is Risks to FT
39% are bothered by feeding tube 22% were physically restrained 20% were pharmacologically restrained

Feeding Tubes and Pressure Ulcers

Methods
National MDS data repository 1999-2007 Medicare Denominator, Part A and Part B data Screened MDS for the first Cognitive Performance Score of 6 indicating that NH residents needed assistance in feeding and diagnosis of dementia

Statistical Approach
• Propensity matched cohort study with nearest neighbor match 3 cases without FT: 1 case (PEG feeding tube) with replacement
• Separate propensity score match for hospitalized NH residents with feeding tube insertion and no evidence of PU (MDS or hospital diagnosis, N=1124). A second model examined those with PU prior to an hospitalization with a feeding tube insertion (N=461).
47

Statistical Analyses (2)
• Outcome was stage II and higher PU on the next MDS for the prevention analysis and healing was noted by improvement of PU Stage.
• Sensitivity Analyses • Prevent PU – we examined risk of development of
Stage IV PU • Heal PU - i) we examined whether results varied by
stage of PU and ii) whether the MDS was completed within 30 days of hospitalization
48

Results – Prevent Pressure Ulcer?
Characteristic Case with FT Case w/o FT
Avg. Age 82.9 82.7
Gender (%F) 70.8 68.7
Race (% Black) 27.0 25.5
DNR 33.7 35.3
Mech. Altered Diet
44.8 42.5
Swallowing problems
38.9 35.8
60 Day Mortality 7.0 5.5

Prevention Pressure Ulcer ??
• Risk of developing of a new PU was examined among 1124 cases with FT and 2082 cases without a FT. 35.6% vs. 19.8% AOR 2.27 (95% CI 1.95, 2.65)
• Sensitivity – only Stage IV AOR 3.20 (95% CI 2.14 to 4.89)
50

Results – Heal Pressure Ulcer?
Characteristic Case with FT Cases w/o FT
Avg. Age 83.0 82.5
Gender (%F) 65.3 64.6
Race (% Black) 32.1 32.2
DNR 33.8 33.8
Mech. Altered Diet
53.4 51.5
Swallowing problems
43.2 41.5
60 Day Mortality 12.7 10.6

Heal Pressure Ulcer??
• Healing of PU was examined among 461 cases and 754 controls 27.1% improved vs. 34.6% cases without a FT AOR 0.70 (95% CI .55, .89)
• Sensitivity Analyses By stage, no change in conclusions MDS done within a month, AOR = 0.76
52

Limitations
Unobserved factors that is not measured in the MDS. We could only match for those characteristics that were observed. We relied on MDS for whether there was pressure ulcer. For the analysis of healing of PU, the MDS is completed a variable time period prior to that hospitalization. It is possible that we missed a healing early stage PU.
53

Conclusion
PEG FT are not associated with prevention or improved healing of a pressure ulcer. Rather, our findings suggest that use of PEG FT is associated with increase risk of pressure ulcer among NH residents with advanced cognitive impairment.
54

Our Conclusion
Our results suggest that decision to insert a feeding tube in nursing home residents with advance dementia is more about which hospitals you go to than a decision making process the illicit and supports patient choice.
There are important risks to feeding tube insertions.

The Role of the “System”

Incentives
Follow the money..

45.25 - 56.45 56.45 - 58.79 58.79 - 62.46
62.46+
Shading% Medicaid

Intrator, Health Services Reserch 2007

Hospitalizations is not..
Without important risks– Relocation stress– Medical Errors – Lack of care coordination – Duplication of diagnostic
work up– Hospital unable to meet
special needs


Table of Two Cities …
Outcome Grand Junction, CO
McAllen, TX US
Multiple Hospitalizations for Pneumonia, UTI, dehydration
1.1% 25.8% 8.1%
GBTI None 89.0% 64.5% 81.0%
GBTI =1 11.0% 28.0% 16.0%
GBTI=2+ 0% 7.3% 3.1%
Mor, Vincent
Watch title heads here

Association of BT and Adverse Outcomes
Outcomes in 2006 and 2007
Lowest Quintile
N=19,679(ARR, 95%
CI)
2nd QuintileN=21,141
(ARR, 95% CI)
3rd QuintileN=19,870
(ARR, 95% CI)
4th Quintile
N=21,374(ARR, 95%
CI)
Highest QuintileN=20,556
(ARR, 95% CI)
Feeding TubeInsertion
Ref. 1.14 (0.81-1.62)
1.97 (1.43-2.70)
2.06 (1.51-2.81)
3.38 (2.48-4.60)
Stage IV DU Ref 1.48 (1.31-1.66)
1.65(1.48-1.85)
2.00 (1.79-2.23)
2.28 (2.04-2.54)
ICU use- last 30 days
Ref 1.47 (1.34-1.61)
1.85 (1.69-2.01)
1.86 (1.71-2.03)
2.10 (1.93-2.29)
Late Hospice Referral
Ref 1.33 (1.23-1.44)
1.40 (1.29-1.51)
1.25 (1.15-1.36)
1.17 (1.07-1.28)

Hospitalizations, Feeding Tubes, and Harm
“ I will say absolutely with the MediCAL populations - with the 7 day bed hold policy, if the families squawks, I will send the resident out. What do you have to loose? We are still getting paid. Otherwise, we get sued. The family believes they are getting services.” “If it wasn’t so litigious, we would not be sending them out..”

Ho:
Feeding tube discussions are difficult – too often perceived as “care” vs. “no care”
The easiest pathway is not having discussions with default of hospitalizations and not addressing goals of care.

A proposal for a new order to allow for persons and/or family with neuro-degenerative disorder to
select feedings for their comfort, but not to the point of distress.

Role of Infections
Suspect that many of these feeding tubes are inserted too early – during an infection in an hospital. Those not hospitalize, many regain ability to undergo careful hand feeding. If they survive long enough, they may progress being unable to eat safely.

Some preliminary work on hospital based feeding tube insertions
42% of the hospitalizations are for a infection 80% of the time when a feeding tube was
inserted, a subspecialist billed for one of more days as the attending physician
75% of the time when a feeding tube was inserted there was discontinuity in type of physician (hospitalist, generalist, or subspecialist)

Attending Physician
Rate of Feeding Tube Insertion
Unadjusted Adjusted Odds Ratio95% CI
Hospitalist (n=9888)
2.20.78
(.63-.97)
Non-Hospitalist, General Internist
(n=24291)
2.5 Reference
Subspecialist (n=3588)
11.7 4.8
(4.0, 5.8)
Discontinuity of the Type of
Attending Physician (n=22762)
16.1 7.9
(6.9, 9.0)

jamanetwork.com
Slide 2Copyright restrictions may apply.

Methods
• Retrospective cohort 20% sample Medicare fee for service deaths from 2000, 2005, and 2009
• Test of trend and multivariate regression model that adjusted for sociodemographic and diseases
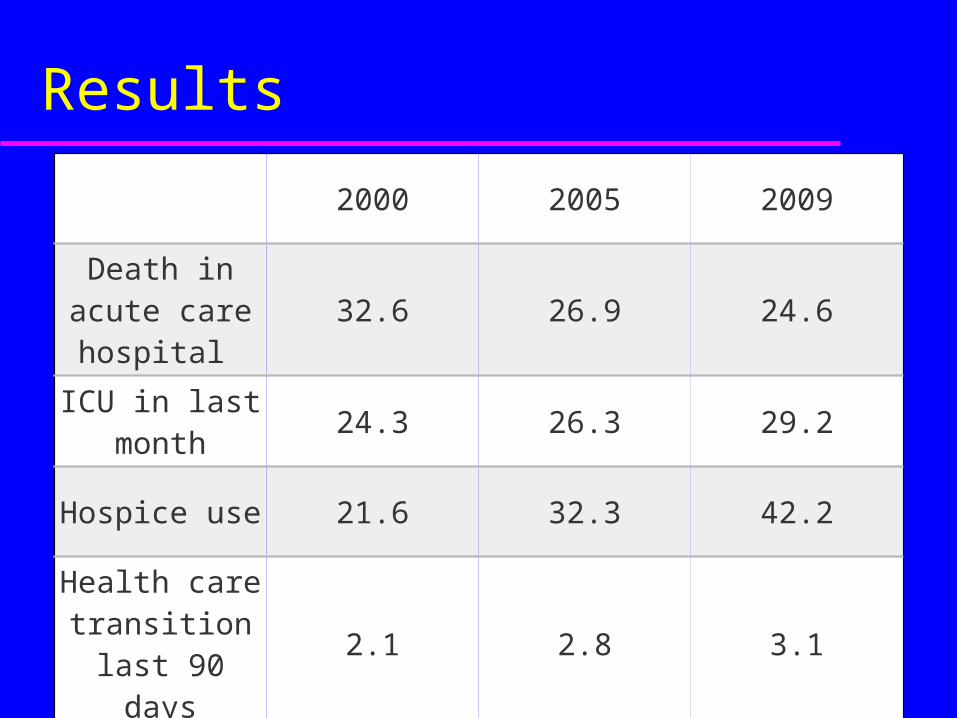
Results
2000 2005 2009
Death in acute care hospital
32.6 26.9 24.6
ICU in last month
24.3 26.3 29.2
Hospice use 21.6 32.3 42.2
Health care transition
last 90 days2.1 2.8 3.1
Transition last 3 days
10.3 12.4 14.2

Date of download: 2/5/2013Copyright © 2012 American Medical Association.
All rights reserved.
From: Change in End-of-Life Care for Medicare Beneficiaries: Site of Death, Place of Care, and Health Care Transitions in 2000, 2005, and 2009 JAMA. 2013;309(5):470-477. doi:10.1001/jama.2012.207624
Overall, nearly one-half of decedents experienced a transition in the last 2 weeks of life. Decedents with a diagnosis of cancer experienced increases in the use of hospice services, especially in the last week of life, while decedents with a diagnosis of chronic obstructive pulmonary disease (COPD) often transitioned to an acute care hospital. Decedents with dementia were predominantly in a nursing home with transitions to hospice services in last week of life.
Figure Legend:
Now is the time for Policy Innovation
Bundling of Payments Concurrent Care

Elgol, Scotland