Policy Considerations for Deploying Renewables CONSIDERATIONS FOR DEPLOYING RENEWABLES INTERNATIONAL...
76
SIMON MüLLER, ADAM BROWN, AND SAMANTHA ÖLZ INFORMATION PAPER RENEWABLE ENERGY POLICY CONSIDERATIONS FOR DEPLOYING RENEWABLES 2011 November
Transcript of Policy Considerations for Deploying Renewables CONSIDERATIONS FOR DEPLOYING RENEWABLES INTERNATIONAL...
Simon müller, AdAm Brown, And SAmAnthA Ölz
INFORMATION PAPER
RENEWABLE ENERGY
POLICY CONSIDERATIONS FOR DEPLOYING RENEWABLES
2011 November

Simon müller, AdAm Brown, And SAmAnthA Ölz
INFORMATION PAPER
2011 November
This information paper was drafted by the Renewable Energy Division. It is one of three information papers that complement the IEA publication Deploying Renewables 2011: Best and Future Policy Practice,
providing more detailed data and information. This paper is published under the authority of the Energy Markets and Security (EMS) Directorate and may not reflect the views of individual IEA member countries.
For further information, please contact Simon Müller, Renewable Energy Division, at: [email protected]
RENEWABLE ENERGY
POLICY CONSIDERATIONS FOR DEPLOYING RENEWABLES
INTERNATIONAL ENERGY AGENCY
The International Energy Agency (IEA), an autonomous agency, was established in November 1974. Its primary mandate was – and is – two-fold: to promote energy security amongst its member countries through collective response to physical disruptions in oil supply, and provide authoritative
research and analysis on ways to ensure reliable, affordable and clean energy for its 28 member countries and beyond. The IEA carries out a comprehensive programme of energy co-operation among its member countries, each of which is obliged to hold oil stocks equivalent to 90 days of its net imports. The Agency’s aims include the following objectives:
n Secure member countries’ access to reliable and ample supplies of all forms of energy; in particular, through maintaining effective emergency response capabilities in case of oil supply disruptions.
n Promote sustainable energy policies that spur economic growth and environmental protection in a global context – particularly in terms of reducing greenhouse-gas emissions that contribute to climate change.
n Improve transparency of international markets through collection and analysis of energy data.
n Support global collaboration on energy technology to secure future energy supplies and mitigate their environmental impact, including through improved energy
efficiency and development and deployment of low-carbon technologies.
n Find solutions to global energy challenges through engagement and dialogue with non-member countries, industry, international
organisations and other stakeholders. IEA member countries:
Australia Austria
Belgium Canada
Czech RepublicDenmark
Finland France
GermanyGreece
HungaryIreland
ItalyJapan
Korea (Republic of)LuxembourgNetherlandsNew Zealand NorwayPolandPortugalSlovak RepublicSpainSwedenSwitzerland
TurkeyUnited Kingdom
United States
The European Commission also participates in
the work of the IEA.
Please note that this publication is subject to specific restrictions that limit its use and distribution.
The terms and conditions are available online at www.iea.org/about/copyright.asp
© OECD/IEA, 2011International Energy Agency
9 rue de la Fédération 75739 Paris Cedex 15, France
www.iea.org
© OECD/IEA 2011 Renewable Energy: Policy Considerations for Deploying Renewables
Page | 3
Table of Contents Acknowledgements .......................................................................................................................... 5
Context .............................................................................................................................................. 7
Chapter 1: Introduction .................................................................................................................... 8
Chapter 2: Strategic Role of Renewables: Drivers and Benefits ....................................................... 9
Main drivers for deploying renewable energy .......................................................................... 9
Energy security .......................................................................................................................... 9
Energy availability .............................................................................................................. 9
Energy affordability .......................................................................................................... 12
Sustainability .................................................................................................................... 13
Economic development ........................................................................................................... 13
Green growth ................................................................................................................... 13
Innovation and industrial development .......................................................................... 15
Rural development .......................................................................................................... 16
CO2 impacts and environmental benefits ................................................................................ 17
Life‐cycle CO2 emissions ................................................................................................... 17
Reductions of CO2 emissions from power generation ..................................................... 19
Other environmental impacts .......................................................................................... 22
Mapping policy drivers: the energy security / GDP matrix ..................................................... 26
Chapter 3: Successful Deployment: Challenges and Policy Tools ................................................... 31
Overview .................................................................................................................................. 31
Scaling up renewables: challenges and policy tools ................................................................ 32
Economic barriers ............................................................................................................ 34
Non‐economic barriers .................................................................................................... 37
Dynamic aspects of deployment: the policy journey .............................................................. 47
Energy technology maturity and market diffusion .......................................................... 47
Deployment phases and policy responses ....................................................................... 50
Chapter 4: Topical Highlight: Accelerating Diffusion of Renewables in Developing Countries ...... 56
Introduction ............................................................................................................................. 56
Main barriers ........................................................................................................................... 57
Support mechanisms and financing for RETs in developing countries.................................... 58
Support mechanisms ....................................................................................................... 58
Financing sources ............................................................................................................. 60
Rural electrification ................................................................................................................. 61
Support mechanisms for decentralised energy projects ................................................. 61
Sources of finance for decentralised renewable energy projects ................................... 64
Conclusion ............................................................................................................................... 65
Acronyms, Abbreviations and Units of Measure ........................................................................... 66
References ...................................................................................................................................... 69
Renewable Energy: Policy Considerations for Deploying Renewables © OECD/IEA 2011
Page | 4
List of figures
Figure 2.1 Patent shares among the global total in selected OECD countries and the EU, 2002‐06 ...................................................................................................................... 17
Figure 2.2 Life‐cycle CO2 emissions of power‐generating technologies ..................................... 18 Figure 2.3 GHG emissions reduction potential for biofuels ....................................................... 19 Figure 2.4 Regional shares in attributed CO2 savings in 2008 .................................................... 21 Figure 2.5 Recent life‐cycle SO2 and NOx emissions of power‐generating technologies ............ 22 Figure 2.7 Land use requirements of power generation technologies ...................................... 25 Figure 2.8 Typology of country clusters by strategic policy drivers ........................................... 26 Figure 2.9 Changes shares of RE technologies in power generation, 1990‐2009 ...................... 27 Figure 2.10 Changes in biofuels share, 1990‐2009 ....................................................................... 28 Figure 3.1 Barriers to renewable energy development .............................................................. 33 Figure 3.2 Duration for developing small‐scale roof‐top PV projects in selected EU countries 40 Figure 3.3 Wind energy: Relative importance of renewable energy policy attributes,
project development stage segmentation ................................................................ 44 Figure 3.5 Wind power diffusion in Denmark and the world, 1980‐2008 .................................. 49 Figure 3.6 Issues to tackle as a function of deployment phase .................................................. 51 Figure 4.1 Main barriers for deployment of RE in developing countries ................................... 58 Figure 4.2 Possible financing and ownership structure for a village mini‐grid .......................... 62 Figure 4.3 Simplified financing structure of a RESCO project ..................................................... 63
List of tables
Table 2.1 Characteristics of conventional and renewable energy sources ............................... 10 Table 2.2 Estimated employment in the renewable energy sector, 2010 ................................ 15 Table 2.3 CO2 savings per focus region or country in 2008 ....................................................... 20 Table 2.4 Savings in CO2 emissions in 2030 ............................................................................... 21 Table 2.5 Dynamics of energy dependency and RET deployment ............................................ 29 Table 3.1 Maturity levels of different energy technologies ...................................................... 49 Table 3.2 Importance of deployment barriers relative to deployment progress ..................... 52
List of boxes
Box 2.1 Green growth in China’s 12th Five‐Year Plan ................................................................... 14 Box 3.1 Brief description of adaptive choice‐based conjoint (ACBC) methodology..................... 43 Box 3.2 Solar PV deployment in Germany .................................................................................... 53
© OECD/IEA 2011 Renewable Energy: Policy Considerations for Deploying Renewables
Page | 5
Acknowledgements Simon Müller, Adam Brown and Samantha Ölz from the Renewable Energy Division at the International Energy Agency are the lead authors of this publication. Samantha Ölz managed and coordinated the earlier stages of the work and the studies that have fed into the analysis; Simon Müller managed and coordinated the completion of this information paper.
This publication has benefitted from extensive contributions from colleagues in the Renewable Energy Division, led by Paolo Frankl, who supervised the project. Critical contributions were made by colleagues Milou Beerepoot, Hugo Chandler, Zuzana Dobrotková, Anselm Eisentraut, Carlos Gasco, Ada Marmion, Sara Moarif and Cédric Philibert.
Didier Houssin, Director of the IEA Energy and Markets and Security Directorate, provided valuable guidance and support throughout the project.
A number of consultants contributed to different parts of the project:
• Prof. Rolf Wüstenhagen, Sonja Lüthi, Nina Hampl (Institute for Economy and the Environment, University of St. Gallen, Switzerland) evaluated the price of renewable energy policy risk by using investor surveys with multiple choices of investment possibilities to help reveal investor preferences.
• Patrick Lamers, Carolin Capone, Lilian Gamba, Saskia Hagedoorn, Anne Palenberg and Gemma Reece, Jan Rordorf, Helena Stadtmüller, Vivian Schüler (all Ecofys): prepared case studies and through stakeholder surveys on non‐economic barriers for individual renewable energy technologies in selected Southeast Asian and Sub‐Saharan African countries
• Dr. Emi Mizuno (ex Judge Business School, University of Cambridge): analysed the risks and policy solutions for successful renewable energy technology innovation and commercialisation in a detailed report.
This work was guided by the IEA Working Party on Renewable Energy Technologies (REWP) which provided continuous support, especially from Hans Jorgen Koch (Chair, Denmark), Roberto Vigotti (former Chair, Italy), Martin Schöpe (Germany), Willem van der Heul (The Netherlands), Linda Silverman (United States) and Andreas Indinger (Austria). All renewable energy Implementing Agreements gave invaluable inputs with substantial technical advice and market data.
The IEA gratefully acknowledges the crucial financial support of the German Federal Ministry for the Environment, Nature Conservation and Nuclear Safety (BMU), the Japanese New Energy and Industrial Technology Development Organisation (NEDO) and Enel S.p.A., as well as the European Commission (through its long‐time support of the IEA Renewable Energy Policies and Measures Database) for this project.
The manuscript was skilfully edited by Jonas Weisel and Andrew Johnston.
Many thanks to the IEA colleagues in the Communications and Information Office, in particular Rebecca Gaghen, Muriel Custodio, Marilyn Smith, Jane Barbière, Angela Gosmann, Cheryl Haines and Corinne Hayworth who assisted in the production of this paper, added to the quality of the final product and ensured its swift completion.
We would also like to thank the many experts who provided helpful and very constructive guidance by commenting on the content of this paper. The final text has benefited hugely from these suggestions.
Renewable Energy: Policy Considerations for Deploying Renewables © OECD/IEA 2011
Page | 6
A number of trainees and interns provided helpful data and extensive analysis for this paper, including Lauren Culver (RE commercialisation and innovation), Charlotte Grosse Wiesmann (CO2 and life‐cycle emissions analysis, box on PV support in Germany, chapter on “Accelerating Diffusion of Renewables in Developing Countries”), Melisande Liu (RE commercialisation and innovation) and Asuka Sato (RE commercialisation and innovation), and we gratefully acknowledge their contributions.
© OECD/IEA 2011 Renewable Energy: Policy Considerations for Deploying Renewables
Page | 7
Context This information paper accompanies the IEA publication Deploying Renewables 2011: Best and Future Policy Practice (IEA, 2011a). It provides more detailed data and analysis on Policies for Deploying Renewables and is intended to complement the main publication. Two other information papers are also available. One focuses on the markets, policies and prospects of renewable energy (RE) by region (Müller, Marmion and Beerepoot, 2011), and the other explores the markets, policies and prospects technology (Brown, Müller and Dobrotková, 2011).
Renewable Energy: Policy Considerations for Deploying Renewables © OECD/IEA 2011
Page | 8
Introduction This information paper accompanies the IEA publication Deploying Renewables 2011: Best and Future Policy Practice (IEA, 2011a). It provides more detailed data and analysis on Policy Considerations for Deploying Renewables and is intended to complement the main publication.
In carrying out the analyses for the main publication, the IEA has formulated or extended new ideas that illuminate some of the recent developments, and also provide pointers to future policy evolution, both for countries with well‐established renewable energy sectors and for those still entering the field and putting new policies and measures in place. These new perspectives include:
• An analysis of the strategic reasons underpinning the pursuit of RET deployment by various countries. This analysis considers the pressure countries are under to improve energy security (as represented by their status as energy importers or exporters) and their ability to pay the higher costs currently often associated with renewables (as indicated by their gross domestic product [GDP]/person). This strategic context helps explain how vigorously countries have been pursuing renewables – or will need to in the future.
• A recognition of the changing challenges that countries face as they embark along a policy journey that supports the expansion of deployment: from market initiation, through a market take‐off phase with steadily increasing deployment, and then into a consolidation phase where integration issues begin to dominate.
This information paper reviews the strategic drivers for renewable energy and the barriers to deployment of RE technologies as well as the policy tools to overcome obstacles to deployment.
Chapter 2 reviews strategic drivers for renewable energy and maps countries according to their energy dependence and economic strength. The mapping serves as an analytical framework for a regional analysis, which can be found in the IEA Information paper Renewable Energy: Markets and Prospects by Region (Müller, Marmion and Dobrotková, 2011).
Chapter 3 identifies the general barriers that RE technologies face and provides concrete examples of the types of problems arising for different technologies. Building on this, the chapter discusses the policy tools available to mitigate or remove these barriers. The chapter also briefly outlines the basic concepts of the market diffusion of RE technologies and uses this approach in describing the concept of the policy journey. This section includes guidelines on what measures need to be taken at what phase of deployment in a national context.
The last chapter focuses on the specific barriers to the diffusion of RE technologies in developing countries and presents ways to overcome these. This is particularly important because RE technologies are already cost‐competitive for off‐grid applications in these regions, but specific barriers are holding back progress.
© OECD/IEA 2011 Renewable Energy: Policy Considerations for Deploying Renewables
Page | 9
Strategic Role of Renewables: Drivers and Benefits
Main drivers for deploying renewable energy
Governments and consumers take measures to increase the deployment of renewable energy technologies (RE technologies) for three principal reasons, which are interlinked:
• to improve energy security;
• to encourage economic development, particularly associated with rural and agricultural sectors, or with innovation and high‐tech manufacturing;
• to protect the climate and the wider environment from impacts of fossil fuels use.
In general, these motivations lead to similar measures designed to encourage technology development and deployment, but sometimes policy imperatives clash, requiring policy modification or compromise. US policies for deploying biofuels, for example, were originally strongly driven by the need to diversify energy supplies and support the agricultural sector. These policies have been subsequently modified to include specific quotas for fuels with better overall greenhouse gas (GHG) balances, in the light of evidence that GHG savings from some biofuels could be lower than expected, as well as due to broader sustainability issues.
For this reason, it is important to take a long‐term view when developing policy and to consider adequately the interactions between policies designed to improve energy security, support economic development and address climate change and environmental concerns.
Energy security
Energy security involves the provision of sufficient and reliable energy supplies to satisfy demand at all times and at affordable prices, while also avoiding environmental impacts. A conventional view of energy security emphasises availability and affordability; more recent definitions have a longer‐term perspective and recognise the need to take into account additional factors. In the long term, only energy sources that reconcile economic factors with sustainability will be able to guarantee secure energy supplies. Availability, affordability and sustainability of energy supply are interlinked facets of overall energy security. The importance that countries assign to each facet will vary depending on aspects such as natural resource endowment, stage of economic development and local environmental priorities.
Energy availability
Availability implies ensuring sufficient supply to provide energy for final use at all times. This requires a sufficient supply of primary resources (e.g. adequate production from fossil fuels, wind, solar energy, etc.) and the infrastructure needed to transport the primary resource to the final use, which implies uninterrupted function of the supply chain (solar panels, wind turbines, hydro plants, refineries, pipelines, conventional power stations, gas/heat grid, transmission network, etc.).
Because no energy source is immune from disruptions, a key aspect of energy availability is a diversity of energy sources. A strategically diversified energy portfolio includes different energy sources as well as different supply pathways for each energy source. The portfolio chosen must account for interactions among different energy sources and delivery pathways: having different
Renewable Energy: Policy Considerations for Deploying Renewables © OECD/IEA 2011
Page | 10
sources in the portfolio increases energy security only if their availability is not directly linked. Ideally, sources will be complementary, so that one hedges the risk of the other in a portfolio.
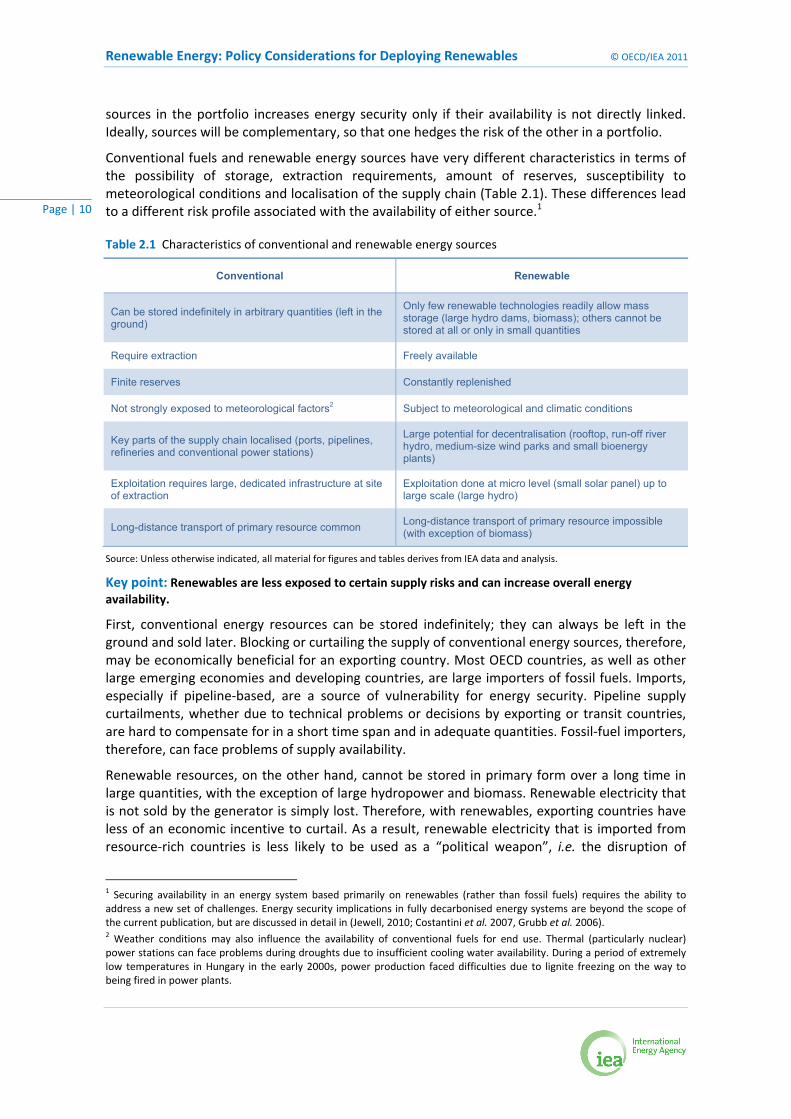
Conventional fuels and renewable energy sources have very different characteristics in terms of the possibility of storage, extraction requirements, amount of reserves, susceptibility to meteorological conditions and localisation of the supply chain (Table 2.1). These differences lead to a different risk profile associated with the availability of either source.1
Table 2.1 Characteristics of conventional and renewable energy sources
Conventional Renewable
Can be stored indefinitely in arbitrary quantities (left in the ground)
Only few renewable technologies readily allow mass storage (large hydro dams, biomass); others cannot be stored at all or only in small quantities
Require extraction Freely available
Finite reserves Constantly replenished
Not strongly exposed to meteorological factors2 Subject to meteorological and climatic conditions
Key parts of the supply chain localised (ports, pipelines, refineries and conventional power stations)
Large potential for decentralisation (rooftop, run-off river hydro, medium-size wind parks and small bioenergy plants)
Exploitation requires large, dedicated infrastructure at site of extraction
Exploitation done at micro level (small solar panel) up to large scale (large hydro)
Long-distance transport of primary resource common Long-distance transport of primary resource impossible (with exception of biomass)
Source: Unless otherwise indicated, all material for figures and tables derives from IEA data and analysis.
Key point: Renewables are less exposed to certain supply risks and can increase overall energy availability.
First, conventional energy resources can be stored indefinitely; they can always be left in the ground and sold later. Blocking or curtailing the supply of conventional energy sources, therefore, may be economically beneficial for an exporting country. Most OECD countries, as well as other large emerging economies and developing countries, are large importers of fossil fuels. Imports, especially if pipeline‐based, are a source of vulnerability for energy security. Pipeline supply curtailments, whether due to technical problems or decisions by exporting or transit countries, are hard to compensate for in a short time span and in adequate quantities. Fossil‐fuel importers, therefore, can face problems of supply availability.
Renewable resources, on the other hand, cannot be stored in primary form over a long time in large quantities, with the exception of large hydropower and biomass. Renewable electricity that is not sold by the generator is simply lost. Therefore, with renewables, exporting countries have less of an economic incentive to curtail. As a result, renewable electricity that is imported from resource‐rich countries is less likely to be used as a “political weapon”, i.e. the disruption of
1 Securing availability in an energy system based primarily on renewables (rather than fossil fuels) requires the ability to address a new set of challenges. Energy security implications in fully decarbonised energy systems are beyond the scope of the current publication, but are discussed in detail in (Jewell, 2010; Costantini et al. 2007, Grubb et al. 2006). 2 Weather conditions may also influence the availability of conventional fuels for end use. Thermal (particularly nuclear) power stations can face problems during droughts due to insufficient cooling water availability. During a period of extremely low temperatures in Hungary in the early 2000s, power production faced difficulties due to lignite freezing on the way to being fired in power plants.
© OECD/IEA 2011 Renewable Energy: Policy Considerations for Deploying Renewables
Page | 11
supply used to put pressure on importing countries. This is important to note when assessing the energy security implications of large‐scale exports of renewable electricity (Lacher and Kumetat, 2010).3
Second, conventional energy sources require extraction at dedicated, large‐scale facilities. Renewable sources of energy are freely available through natural processes. Third, conventional energy sources are not particularly susceptible to meteorological conditions. Renewables do present challenges in terms of availability. Sun, wind and rainfall follow seasonal patterns and fluctuate over the course of hours and even minutes. To harness their benefits, the energy system must be adapted to integrate variable renewables. This is particularly true for the power sector. However, managing variability and uncertainty are not new challenges in power system management. Large shares of relatively inflexible plants designed to operate round the clock (nuclear, many coal plants, geothermal) must be managed when demand falls lower than expected. Every power system already maintains flexible resources, which enable the balancing of supply and demand. Where valued appropriately, many of these resources also have the potential to balance generation from variable renewables (IEA, 2011b). In addition, the right portfolio of renewable energy technologies, combined with a geographical spread of installations, can significantly decrease the remaining variability of renewable energy sources.
Fourth, with conventional energy sources, the supply chain frequently includes some potential bottlenecks such as pipelines or seaports. An outage in one key infrastructure component can lead to severe supply cuts. For example, the Queensland floods in Australia in late 2010 hit the country’s coal mining sector, tightening supply globally. Similarly, Hurricane Katrina in the United States in 2005 put oil prices under upward pressure due to the loss of refining capacities. A terrorist attack targeting a key part of the supply chain could also have significant impacts. In the case of nuclear power, terrorist attacks could lead not only to supply disruptions but also to a large‐scale disaster with significant environmental and economic costs as well as harm to human health.
Renewables, with the exception of large hydro, can and should be deployed in a geographically diversified manner. As a result, a localised event, such as a natural disaster or terrorist attack, will have a much smaller impact on the overall system. This lessened impact may not be the case if renewables also use critical infrastructure. In the case of the DESERTEC Concept (DESERTEC, 2011), recent analysis found that Europe would not be exposed to significant risks associated with the import of approximately 15% of total electricity from Middle East and North Africa (MENA) countries by 2050 if only a single country cut its supplies. However, if all countries were to cut their supply in a co‐ordinated effort, the cost to Europe would be comparably large (Lilliestam and Ellenbeck, 2011). In addition, some renewable technologies are less susceptible to natural disasters. Wind turbines, for example, resumed power generation immediately after the Tōhoku earthquake in Japan (CNN, 2011).
In sum, it is increasingly clear that having a significant share of renewables in a country’s energy supply can increase energy availability by enhancing the overall diversification of the risk portfolio. Renewables are also less exposed to certain risk factors. A final aspect of energy availability provides an appropriate link to discussion of energy affordability. The need for a portfolio‐based approach makes it impossible to rely exclusively on the cheapest energy source. Such an approach would leave a country vulnerable to potential availability problems due to the imbalance in the portfolio.
3 A similar argument can be made for biofuels: it would not be economically viable for an exporter to install significant storage capacities to buffer times when exports are curtailed due to political reasons. Heat is highly unlikely to be traded internationally and, therefore, is not mentioned in this context.
Renewable Energy: Policy Considerations for Deploying Renewables © OECD/IEA 2011
Page | 12
Energy affordability
Renewables are often still perceived as an expensive energy option. In fact, the reality of their cost is rapidly changing, with technologies moving beyond the peak and prices coming down quickly. Solar photovoltaics (PV) is on the verge of reaching competitiveness with retail electricity prices in some markets (Breyer and Gerlach, 2010). Wind energy in New Zealand is being deployed without a dedicated support mechanism for renewables. In locations lacking access to modern energy services through grid‐connected electricity, stand‐alone renewable energy applications are often more economically viable than other technologies (such as diesel generators), while also providing an environmentally sustainable option for energy supply (IEA, 2010a). Finally, relying only on the one least‐cost option would create problems with securing availability, due to the absence of diversity in the energy portfolio.
From an energy security point of view, two closely related aspects of affordability are of key importance: price volatility and price uncertainty. Price volatility refers to the range in which market prices evolve over a given period of time. Two commodities may have the same long‐term average price but differ in their volatility. Price volatility measures the degree to which large deviations from the average price (up or down) tend to occur. Price uncertainty, on the other hand, refers to the average price: besides prices being volatile, the average price may also change. Fossil energy technologies require an input fuel and are thus fully exposed to price volatility of fuels and price uncertainty. Because they do not need a fuel, renewables (hydro, solar, wind) are not exposed to these aspects.
Price volatility
The volatility of fossil fuels has detrimental economic effects. Integrating several studies on the link between oil prices and GDP, Awerbuch and Sauter (2006) estimate a loss of 0.5% in GDP for a 10% oil price increase for the United States and the European Union. Over the past year, oil prices increased by approximately 45%, resulting in a 2.25% loss in GDP – roughly equivalent to USD 774 billion4 or the total GDP of the Netherlands.
Society incurs the costs of volatile fossil fuel prices because of the great reliance on fuels that are exposed to large price fluctuations. In 2009, total support payments for all renewables globally (USD 57 billion) amounted to merely 7.3% of the GDP loss mentioned above (IEA, 2010a). Renewables have a key role to play in shifting dependency away from volatile fuels. Depending on which RE technology (renewable energy technology) is deployed and how the generated energy is used, different fossil fuel sources are affected. Use of biofuels or the electrification of the transport sector helps to constrain oil demand. Renewable heat is most likely to displace natural gas, and to a lesser extent coal and oil consumption, while renewable electricity mainly affects the gas and coal markets.
Price uncertainty
Many explanations are given for the fluctuation of oil and gas prices5. However, recent IEA work has underlined the role that a more sustainable energy mix, including a high penetration of renewables, has in influencing the future evolution of fossil fuel prices (IEA, 2010b). Taking transport as an example, in the World Energy Outlook 2010 450 Scenario, in which overall energy demand is constrained and low‐carbon sources play important roles, the oil price stays below
4 Assuming a price of USD 78/bbl in May 2010 and USD 115/bbl in 2011, the International Monetary Fund (IMF) reports EU GDP in 2010 at USD 16 282 billion and US GDP in 2010 at USD 14 657 billion. 5 A full discussion of these explanations is beyond the scope of the present publication.
© OECD/IEA 2011 Renewable Energy: Policy Considerations for Deploying Renewables
Page | 13
USD 90 per barrel (in real 2009 dollars). This compares with USD 135/bbl in the Current Policies Scenario, which reflects a business‐as‐usual future marked by high growth in energy demand.
The outlook for fossil prices is worrisome; WEO 2010 summarises it in the phrase: “The era of cheap oil is over” (IEA, 2010a). Although some observers now proclaim the dawn of a golden age of gas (IEA, 2011c), it remains to be seen which markets will have access to these resources and at what price. With the growing energy hunger of developing Asia, markets are likely to be under pressure for all important fossil commodities (oil, gas and coal). Renewables are a strategic option to reduce dependence on these sources that are subject to price uncertainty and its economically detrimental effects.
Sustainability
Any perspective that views sustainability of energy supply as independent of energy security is very short term. An energy system that will deliver energy at a very low price while putting the future of entire nations at stake cannot be seen as secure. A more relevant definition of energy security appropriately demands that the long‐term consequences of a given energy strategy be taken into account, which allows for more informed decision making.
Current global patterns of energy production and consumption are unsustainable for two reasons. First, proceeding on a business‐as‐usual path will lead to unacceptable increases in global average temperature levels (IEA, 2010a). The consequences of higher levels of warming could be catastrophic, leading to mass migration away from the worst‐affected areas, and the potential for severe and prolonged regional conflicts. Second, the world will eventually run out of fossil resources. No one can predict with certainty when the resources will be exhausted, but it must happen at some point if demand remains high.
Renewables can play a key role in combating climate change; they already deliver important CO2 emission reductions. In fact, renewables will be the central element of any energy system that is secure in both the short and long term.
Economic development
Green growth
The deployment of RE technologies is frequently given high priority within a comprehensive strategy towards more sustainable economic growth, sometimes summarised by the term “green growth” (OECD [Organisation for Economic Co‐operation and Development], 2011). The technologies featured prominently in a number of economic recovery packages in 2008/09.
RE technologies are able to contribute to sustainable economic development by allowing exploitation of natural but replenishing resources, providing new sources of natural capital. The technologies allow countries with good solar or wind resources, for example, to exploit these resources as “new” assets to support their own energy needs. RE technologies may even allow countries to exploit RE resources with long‐term export potential, by producing biofuels sustainably, or by using high levels of solar radiation to generate exportable electricity via concentrating solar power, as proposed in the DESERTEC project.
The central feature of a green growth framework is recognition of “natural capital” as a factor of production and its role in enhancing societal well‐being. Natural capital refers to factors entering the production process that are provided by nature itself. These include resources – in particular fossil energy resources.
Renewable Energy: Policy Considerations for Deploying Renewables © OECD/IEA 2011
Page | 14
Existing production technology and consumer behaviour can be expected to produce positive outcomes only up to a point; beyond that point, depleting natural capital has negative consequences for overall growth. Precisely where this frontier lies is not known in all cases, but the ability of reproducible capital to substitute for (depleted) natural capital is limited in the absence of innovation. By pushing the frontier outward, innovation can help to decouple growth from natural capital depletion.
Economic policy decisions need to incorporate a longer time horizon. Patterns of growth and technological change build on one another, setting society off along certain paths and locking in commitments to particular technologies and institutions. Environmental impacts are also cumulative and sometimes irreversible. These factors can mean that today’s decisions have direct consequences for future economic opportunities and environmental implications (OECD, 2011).
In the context of green growth, policies that support renewables serve two objectives. First, they aim to create new markets that recognise the importance of natural capital and of reconciling limited natural resources with economic growth. Second, they provide an exit strategy from the fossil energy‐based development path to which the global economy is currently committed. Ultimately, renewables provide a sustainable pathway to increased prosperity.
The economic lock‐in effect, i.e. the way that past economic patterns determine future pathways, can be exemplified by looking at import bills for fossil energy and the cost of climate change.
The net cost of importing fossil fuels into the United States was about USD 410 billion in 2008 alone (EIA, 2010), representing more than 3% of the country’s GDP. The situation is similar in many other OECD countries. Developing countries without abundant domestic fuels resources spend even higher percentages of their GDP on net fossil imports. For these countries, their fossil fuel import bills pose a serious impediment to economic development. Yet IEA estimates show that investment in low‐carbon energy systems provides an extraordinary return: the USD 46 trillion investment required globally between 2010 and 2050 to deliver low‐carbon energy systems – a 17% increase over current spending – would yield cumulative fuel savings equal to USD 112 trillion (IEA, 2010b). These savings are in addition to the avoided negative impacts of climate change (all of which can also be calculated to have a monetary value/cost).
Box 2.1 Green growth in China’s 12th Five‐Year Plan
Source: OECD (2011).
The Green Development section of China's 12th Five‐Year Plan (FYP, 2011‐15) highlights the country's aspiration to move towards a greener economy. The Plan is a strategic national roadmap, setting priorities regarding China’s future socioeconomic development, and providing guidelines and targets for policy making at the sectoral and sub‐national level.
The Green Development theme identifies six strategic pillars: respond to climate change, strengthen resource saving and management, develop the “circular economy”, enhance environmental protection, promote ecosystem protection and recovery, and strengthen systems for water conservation and natural disaster prevention.
These pillars entail several new binding targets (e.g. carbon emission per unit of GDP to be reduced by 17% by 2015; nitrogen oxide [NOx] and nitrogen air emissions to be reduced by 10% by 2015), in addition to targets continued from the 11th FYP (e.g. energy intensity, sulphur dioxide [SO2] and chemical oxygen demand [COD] pollution). Detailed policy guidelines are also provided in the 12th FYP; for instance, energy‐efficiency technology demonstration and diffusion programmes are emphasised as the engine of both energy saving and new growth opportunities.

© OECD/IEA 2011 Renewable Energy: Policy Considerations for Deploying Renewables
Page | 15
Table 2.2 Estimated employment in the renewable energy sector, 2010
Technology Global Key regions
Biofuels > 1 500 000 Brazil 730 000 for sugarcane and ethanol production
Wind power ~ 630 000 China 150 000 / Germany 100 000 / United States 85 000 / Spain 40 000 / Italy 28 000 / Denmark 24 000 / Brazil 14 000 / India 10 000
Solar hot water ~ 300 000 China 250 000 / Spain 7 000
Solar PV ~ 350 000 China 120 000 / Germany 120 000 / Japan 26 000 / United States 17 000 / Spain 14 000
Biomass power - Germany 120 000 / United States 66 000 / Spain 5 000
Hydropower - Europe 20 000 / United States 8 000 / Spain 7 000
Geothermal - Germany 13 000 / United States 9 000
Biogas - Germany 20 000
Solar thermal power ~ 15 000 Spain 1 000 / United States 1 000
Total estimated > 3 500 000
Source: REN21 (2011).
China’s recent success in deploying renewables demonstrates that emerging economies can also use green growth strategies in the energy sector to promote more sustainable growth overall (Box 2.1).
Job creation is an important policy objective for all governments. Deploying renewables can lead to positive net employment effects. However, when benchmarking renewables support in terms of job creation, governments need to pay close attention to the comparative baseline. Job creation effects could be higher in other sectors of the economy if they received the same support; and the displacement of jobs in other sectors could outweigh the creation of new jobs in renewables.
In its 2008 Green Jobs report, the United Nations Environment Programme (UNEP) concludes that “Compared to fossil‐fuel power plants, renewable energy generates more jobs per unit of installed capacity, per unit of power generated and per dollar invested” (UNEP, 2008). Based on 2006 data, the report estimates the global number of jobs in the renewables sector at 2.3 million or more. Newer estimates (REN21, 2011) have further raised this number to 3.5 million. Broken down by sector, the REN21 estimate is as follows: 630 000 workers in the wind power sector, 350 000 in solar PV and more than 1.5 million in the biofuels sector (Table 2.2).
Due to the lack of widely accepted methodology of accounting for RE‐related jobs, this analysis does not attempt to estimate the future job‐creation potential of REs. Notwithstanding, RE markets can be expected to grow rapidly in the future due to climate change mitigation and energy security imperatives. Therefore, it is plausible to assume that jobs created in this sector have a sustainable long‐term perspective, a key element to consider when appraising the labour‐market effect of government support policies.
Innovation and industrial development
Several established RE market leaders (including Germany, Denmark and Japan) have long placed industrial and economic development objectives at the centre of their support for RE technologies (Jochem et al., 2008; Mizuno, 2010). These countries encouraged the creation of strong industrial clusters and developed vibrant domestic markets by putting in place stable, enabling policy frameworks along the innovation chain, along with favourable investment

Renewable Energy: Policy Considerations for Deploying Renewables © OECD/IEA 2011
Page | 16
conditions for innovative RE technologies, including solar PV and wind. They specialised at an early stage in the supply of novel RE technologies that were characterised by high knowledge intensity and learning potential, and thus the countries became front‐runners in terms of innovation. This strategy helped them establish a first‐mover advantage in exports as global trade and competition for RE technologies expanded (Jochem et al., 2008; Walz et al., 2009).
Certain factors improve a country’s ability to benefit from a first‐mover advantage in external trade, including:
• technology characteristics that form obstacles to international relocation;
• positive market conditions in the country, which strengthen learning‐by‐doing and ‐using;
• innovation‐friendly regulation in the country;
• technological capability of the country; and
• the competitiveness of related industry clusters in the country (Walz et al., 2009).
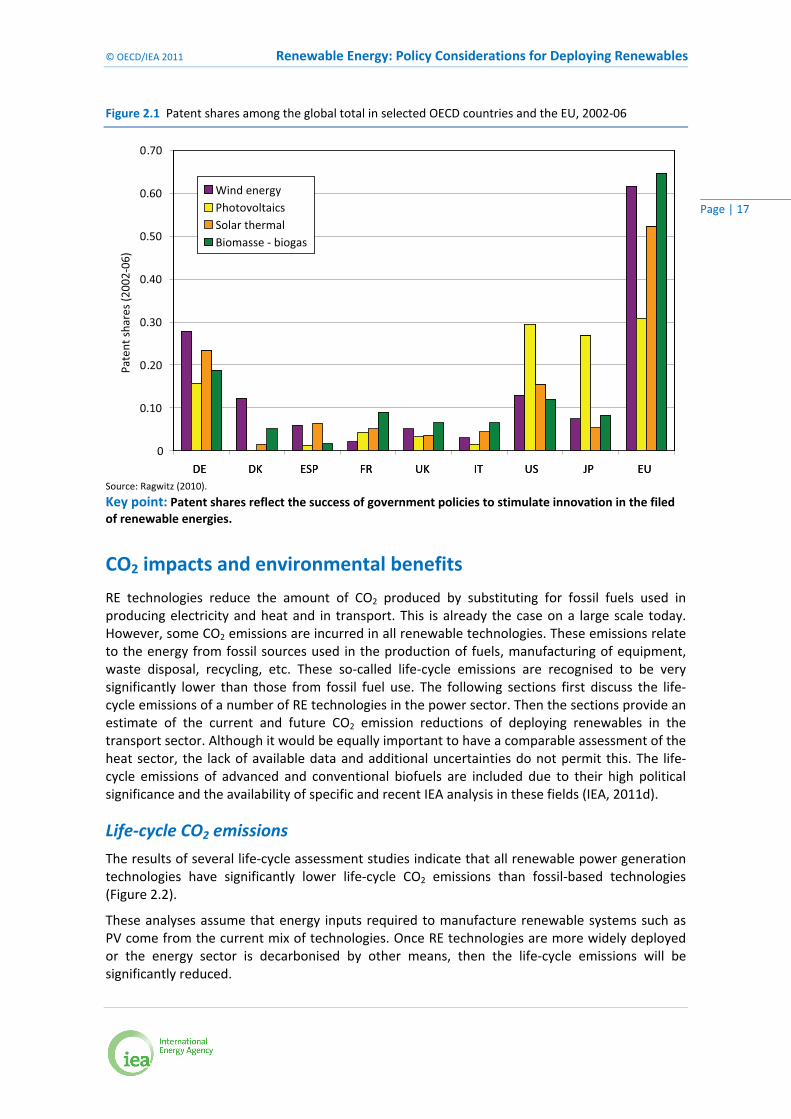
Technological capabilities and innovation success in renewables result from a broad range of beneficial factors influencing the innovation chain, not merely from effective research and development (R&D) efforts. However, patent activity is an important indicator of a country’s level of specialisation in certain technologies and a measure of future potential for market share growth. A comparison of patent activity indicates the relative strength of Germany and Denmark in generating patent‐worthy innovations in wind energy technologies, while the United States, Germany and Japan show the highest shares of patents for solar PV‐related innovations (Figure 2.1). The EU bloc as a whole, which also encompasses important RE technologies leaders such as Germany, Denmark and Spain, shows the largest patent shares for biomass and biogas, wind and solar thermal technologies.
The challenge now emerging is whether these lead countries can sustain their first‐mover advantage in the face of growing competition from emerging economies with lower production costs, i.e. so‐called “fast followers” (Jochem et al., 2008).
Rural development
In isolated rural areas with underdeveloped access to electricity, grid extensions are often not cost‐effective. Off‐grid renewable technologies provide a sustainable and cost‐effective alternative to the diesel generators that would be typically deployed in such areas. Renewable technologies can also help to displace other unsustainable energy sources such as kerosene lamps and traditional biomass.
Important benefits can be achieved by using renewable energies to provide cost‐effective access to modern energy services. Recent studies have also found a positive impact of the deployment of solar home systems with children’s study routines (Gustavsson, 2007). A more detailed account of possible deployment strategies in rural areas in developing countries is presented in the topical highlight Accelerating RE Diffusion in Developing Countries that is part of this information paper.
Strengthening the economy in rural areas has also been a rationale for using renewables in developed countries. By introducing support policies for the production and consumption of biofuels, the agricultural sector can diversify its activities and open access to new markets that are economically viable in the long term.
© OECD/IEA 2011 Renewable Energy: Policy Considerations for Deploying Renewables
Page | 17
Figure 2.1 Patent shares among the global total in selected OECD countries and the EU, 2002‐06
Source: Ragwitz (2010).
Key point: Patent shares reflect the success of government policies to stimulate innovation in the filed of renewable energies.
CO2 impacts and environmental benefits
RE technologies reduce the amount of CO2 produced by substituting for fossil fuels used in producing electricity and heat and in transport. This is already the case on a large scale today. However, some CO2 emissions are incurred in all renewable technologies. These emissions relate to the energy from fossil sources used in the production of fuels, manufacturing of equipment, waste disposal, recycling, etc. These so‐called life‐cycle emissions are recognised to be very significantly lower than those from fossil fuel use. The following sections first discuss the life‐cycle emissions of a number of RE technologies in the power sector. Then the sections provide an estimate of the current and future CO2 emission reductions of deploying renewables in the transport sector. Although it would be equally important to have a comparable assessment of the heat sector, the lack of available data and additional uncertainties do not permit this. The life‐cycle emissions of advanced and conventional biofuels are included due to their high political significance and the availability of specific and recent IEA analysis in these fields (IEA, 2011d).
Life‐cycle CO2 emissions
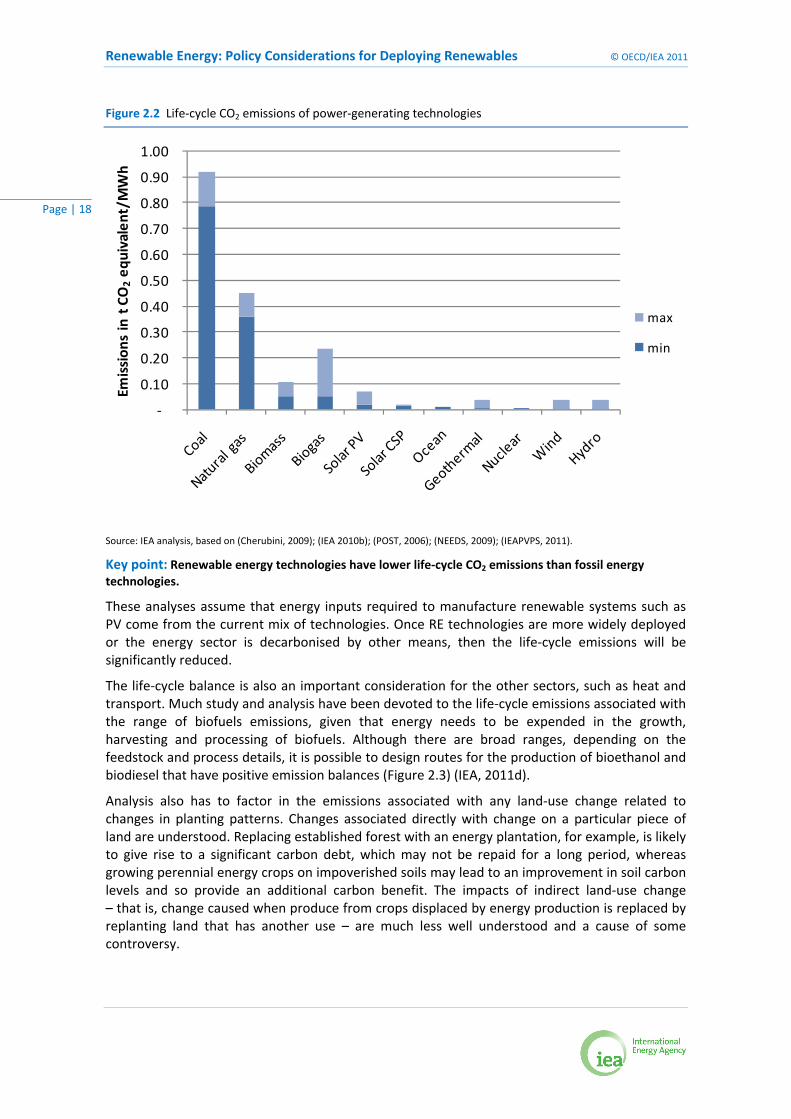
The results of several life‐cycle assessment studies indicate that all renewable power generation technologies have significantly lower life‐cycle CO2 emissions than fossil‐based technologies (Figure 2.2).
These analyses assume that energy inputs required to manufacture renewable systems such as PV come from the current mix of technologies. Once RE technologies are more widely deployed or the energy sector is decarbonised by other means, then the life‐cycle emissions will be significantly reduced.
0 70
0.60
.
0.50
0.40
0 20
0.30
0.10
.Pate
nt sh
ares
(200
2-06
)
0DE DK ESP FR UK IT US JP EUDE DK ESP FR UK IT US JP EU
Wind energyPhotovoltaicsSolar thermalBiomasse - biogas
Renewable Energy: Policy Considerations for Deploying Renewables © OECD/IEA 2011
Page | 18
Figure 2.2 Life‐cycle CO2 emissions of power‐generating technologies
Source: IEA analysis, based on (Cherubini, 2009); (IEA 2010b); (POST, 2006); (NEEDS, 2009); (IEAPVPS, 2011).
Key point: Renewable energy technologies have lower life‐cycle CO2 emissions than fossil energy technologies.
These analyses assume that energy inputs required to manufacture renewable systems such as PV come from the current mix of technologies. Once RE technologies are more widely deployed or the energy sector is decarbonised by other means, then the life‐cycle emissions will be significantly reduced.
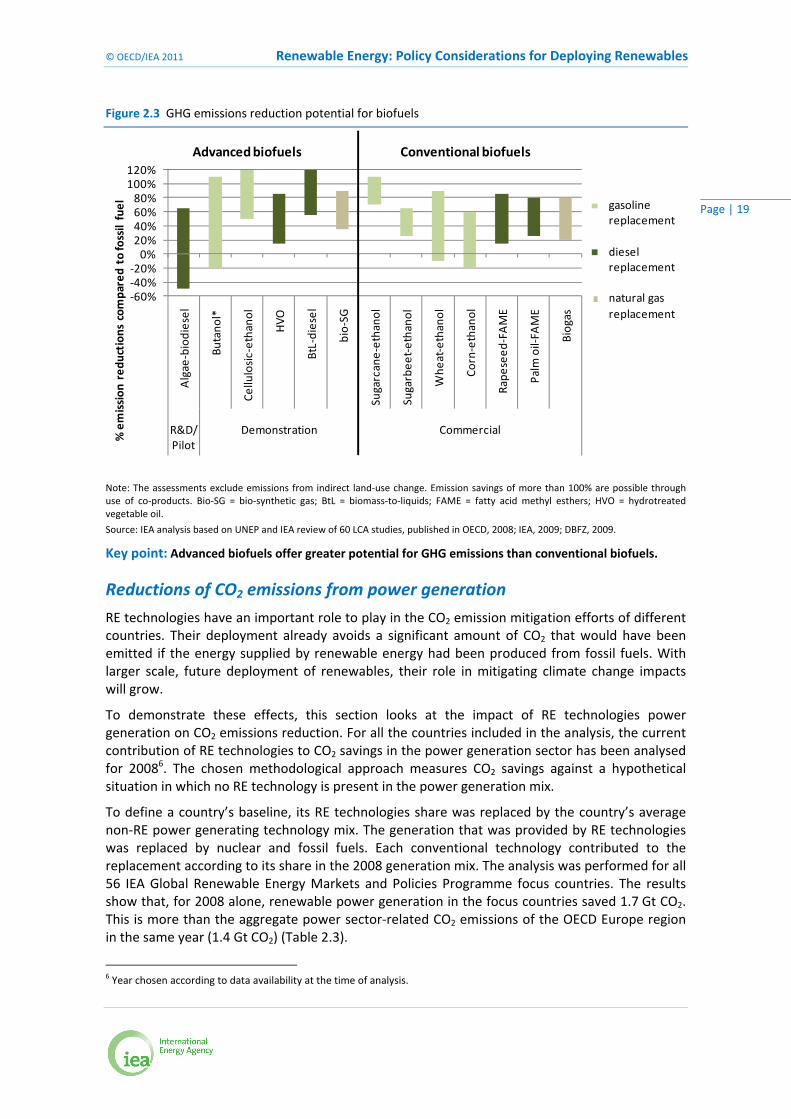
The life‐cycle balance is also an important consideration for the other sectors, such as heat and transport. Much study and analysis have been devoted to the life‐cycle emissions associated with the range of biofuels emissions, given that energy needs to be expended in the growth, harvesting and processing of biofuels. Although there are broad ranges, depending on the feedstock and process details, it is possible to design routes for the production of bioethanol and biodiesel that have positive emission balances (Figure 2.3) (IEA, 2011d).
Analysis also has to factor in the emissions associated with any land‐use change related to changes in planting patterns. Changes associated directly with change on a particular piece of land are understood. Replacing established forest with an energy plantation, for example, is likely to give rise to a significant carbon debt, which may not be repaid for a long period, whereas growing perennial energy crops on impoverished soils may lead to an improvement in soil carbon levels and so provide an additional carbon benefit. The impacts of indirect land‐use change – that is, change caused when produce from crops displaced by energy production is replaced by replanting land that has another use – are much less well understood and a cause of some controversy.
‐
0.10
0.20
0.30
0.40
0.50
0.60
0.70
0.80
0.90
1.00
Emission
s in t CO2eq
uivalent/M
Wh
max
min
© OECD/IEA 2011 Renewable Energy: Policy Considerations for Deploying Renewables
Page | 19
Figure 2.3 GHG emissions reduction potential for biofuels
Note: The assessments exclude emissions from indirect land‐use change. Emission savings of more than 100% are possible through use of co‐products. Bio‐SG = bio‐synthetic gas; BtL = biomass‐to‐liquids; FAME = fatty acid methyl esthers; HVO = hydrotreated vegetable oil.
Source: IEA analysis based on UNEP and IEA review of 60 LCA studies, published in OECD, 2008; IEA, 2009; DBFZ, 2009.
Key point: Advanced biofuels offer greater potential for GHG emissions than conventional biofuels.
Reductions of CO2 emissions from power generation
RE technologies have an important role to play in the CO2 emission mitigation efforts of different countries. Their deployment already avoids a significant amount of CO2 that would have been emitted if the energy supplied by renewable energy had been produced from fossil fuels. With larger scale, future deployment of renewables, their role in mitigating climate change impacts will grow.
To demonstrate these effects, this section looks at the impact of RE technologies power generation on CO2 emissions reduction. For all the countries included in the analysis, the current contribution of RE technologies to CO2 savings in the power generation sector has been analysed for 20086. The chosen methodological approach measures CO2 savings against a hypothetical situation in which no RE technology is present in the power generation mix.
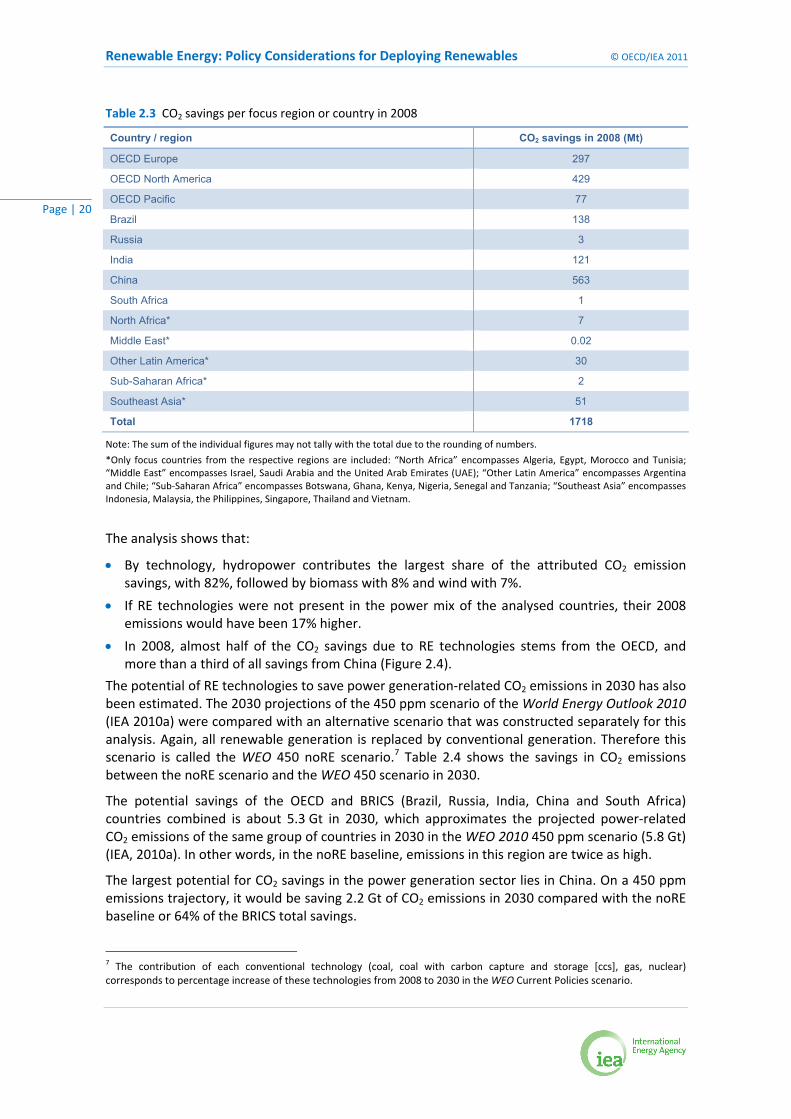
To define a country’s baseline, its RE technologies share was replaced by the country’s average non‐RE power generating technology mix. The generation that was provided by RE technologies was replaced by nuclear and fossil fuels. Each conventional technology contributed to the replacement according to its share in the 2008 generation mix. The analysis was performed for all 56 IEA Global Renewable Energy Markets and Policies Programme focus countries. The results show that, for 2008 alone, renewable power generation in the focus countries saved 1.7 Gt CO2. This is more than the aggregate power sector‐related CO2 emissions of the OECD Europe region in the same year (1.4 Gt CO2) (Table 2.3).
6 Year chosen according to data availability at the time of analysis.
‐60%‐40%‐20%0%20%40%60%80%
100%120%
Algae
‐biodiesel
Butano
l*
Cellulosic‐ethano
l
HVO
BtL‐diesel
bio‐SG
Sugarcane‐ethano
l
Sugarbee
t‐ethano
l
Whe
at‐ethanol
Corn‐ethanol
Rape
seed
‐FAME
Palm
oil‐FA
ME
Biogas
R&D/Pilot
Demonstration Commercial
% emission
red
uction
s compared to fossil fuel gasoline
replacement
dieselreplacement
natural gas replacement
Advanced biofuels Conventional biofuels
Renewable Energy: Policy Considerations for Deploying Renewables © OECD/IEA 2011
Page | 20
Table 2.3 CO2 savings per focus region or country in 2008
Country / region CO2 savings in 2008 (Mt)
OECD Europe 297
OECD North America 429
OECD Pacific 77
Brazil 138
Russia 3
India 121
China 563
South Africa 1
North Africa* 7
Middle East* 0.02
Other Latin America* 30
Sub-Saharan Africa* 2
Southeast Asia* 51
Total 1718
Note: The sum of the individual figures may not tally with the total due to the rounding of numbers.
*Only focus countries from the respective regions are included: “North Africa” encompasses Algeria, Egypt, Morocco and Tunisia; “Middle East” encompasses Israel, Saudi Arabia and the United Arab Emirates (UAE); “Other Latin America” encompasses Argentina and Chile; “Sub‐Saharan Africa” encompasses Botswana, Ghana, Kenya, Nigeria, Senegal and Tanzania; “Southeast Asia” encompasses Indonesia, Malaysia, the Philippines, Singapore, Thailand and Vietnam.
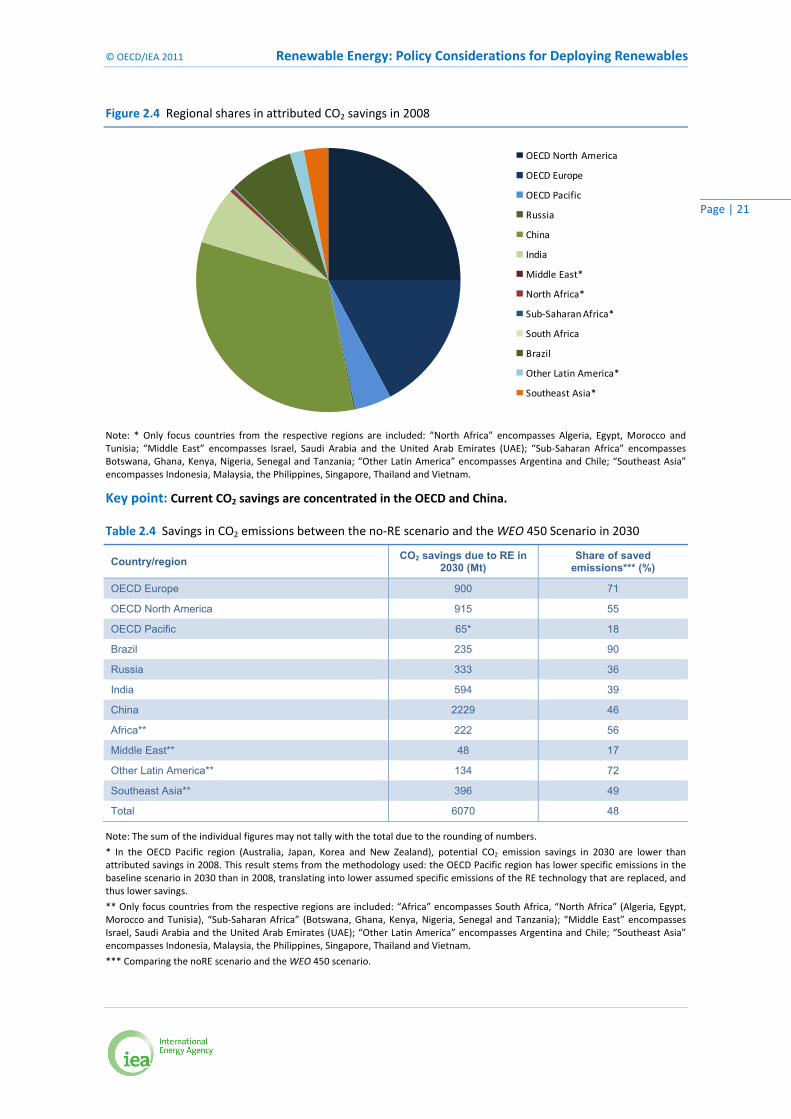
The analysis shows that:
• By technology, hydropower contributes the largest share of the attributed CO2 emission savings, with 82%, followed by biomass with 8% and wind with 7%.
• If RE technologies were not present in the power mix of the analysed countries, their 2008 emissions would have been 17% higher.
• In 2008, almost half of the CO2 savings due to RE technologies stems from the OECD, and more than a third of all savings from China (Figure 2.4).
The potential of RE technologies to save power generation‐related CO2 emissions in 2030 has also been estimated. The 2030 projections of the 450 ppm scenario of the World Energy Outlook 2010 (IEA 2010a) were compared with an alternative scenario that was constructed separately for this analysis. Again, all renewable generation is replaced by conventional generation. Therefore this scenario is called the WEO 450 noRE scenario.7 Table 2.4 shows the savings in CO2 emissions between the noRE scenario and the WEO 450 scenario in 2030.
The potential savings of the OECD and BRICS (Brazil, Russia, India, China and South Africa) countries combined is about 5.3 Gt in 2030, which approximates the projected power‐related CO2 emissions of the same group of countries in 2030 in the WEO 2010 450 ppm scenario (5.8 Gt) (IEA, 2010a). In other words, in the noRE baseline, emissions in this region are twice as high.
The largest potential for CO2 savings in the power generation sector lies in China. On a 450 ppm emissions trajectory, it would be saving 2.2 Gt of CO2 emissions in 2030 compared with the noRE baseline or 64% of the BRICS total savings.
7 The contribution of each conventional technology (coal, coal with carbon capture and storage [ccs], gas, nuclear) corresponds to percentage increase of these technologies from 2008 to 2030 in the WEO Current Policies scenario.
© OECD/IEA 2011 Renewable Energy: Policy Considerations for Deploying Renewables
Page | 21
Figure 2.4 Regional shares in attributed CO2 savings in 2008
Note: * Only focus countries from the respective regions are included: “North Africa” encompasses Algeria, Egypt, Morocco and Tunisia; “Middle East” encompasses Israel, Saudi Arabia and the United Arab Emirates (UAE); “Sub‐Saharan Africa” encompasses Botswana, Ghana, Kenya, Nigeria, Senegal and Tanzania; “Other Latin America” encompasses Argentina and Chile; “Southeast Asia” encompasses Indonesia, Malaysia, the Philippines, Singapore, Thailand and Vietnam.
Key point: Current CO2 savings are concentrated in the OECD and China.
Table 2.4 Savings in CO2 emissions between the no‐RE scenario and the WEO 450 Scenario in 2030
Country/region CO2 savings due to RE in 2030 (Mt)
Share of saved emissions*** (%)
OECD Europe 900 71
OECD North America 915 55
OECD Pacific 65* 18
Brazil 235 90
Russia 333 36
India 594 39
China 2229 46
Africa** 222 56
Middle East** 48 17
Other Latin America** 134 72
Southeast Asia** 396 49
Total 6070 48
Note: The sum of the individual figures may not tally with the total due to the rounding of numbers.
* In the OECD Pacific region (Australia, Japan, Korea and New Zealand), potential CO2 emission savings in 2030 are lower than attributed savings in 2008. This result stems from the methodology used: the OECD Pacific region has lower specific emissions in the baseline scenario in 2030 than in 2008, translating into lower assumed specific emissions of the RE technology that are replaced, and thus lower savings.
** Only focus countries from the respective regions are included: “Africa” encompasses South Africa, “North Africa” (Algeria, Egypt, Morocco and Tunisia), “Sub‐Saharan Africa” (Botswana, Ghana, Kenya, Nigeria, Senegal and Tanzania); “Middle East” encompasses Israel, Saudi Arabia and the United Arab Emirates (UAE); “Other Latin America” encompasses Argentina and Chile; “Southeast Asia” encompasses Indonesia, Malaysia, the Philippines, Singapore, Thailand and Vietnam.
*** Comparing the noRE scenario and the WEO 450 scenario.
OECD North America
OECD Europe
OECD Pacific
Russia
China
India
Middle East*
North Africa*
Sub‐Saharan Africa*
South Africa
Brazil
Other Latin America*
Southeast Asia*
Renewable Energy: Policy Considerations for Deploying Renewables © OECD/IEA 2011
Page | 22
Other environmental impacts
The deployment of renewables can also have other environmental impacts, both positive and potentially negative, and these impacts must be carefully considered when assessing the net benefits of RE technologies deployment. Impacts may be on air quality, water consumption and land use.
Air quality
Besides carbon dioxide, a number of other air pollutants, such as methane, carbon monoxide,
sulphur dioxide (SO2), nitrous oxides (NOx), particulate matter (PM), mercury, lead, arsenic and ammonia negatively affect human health and the environment. All these pollutants are emitted, for example, during the coal combustion process.
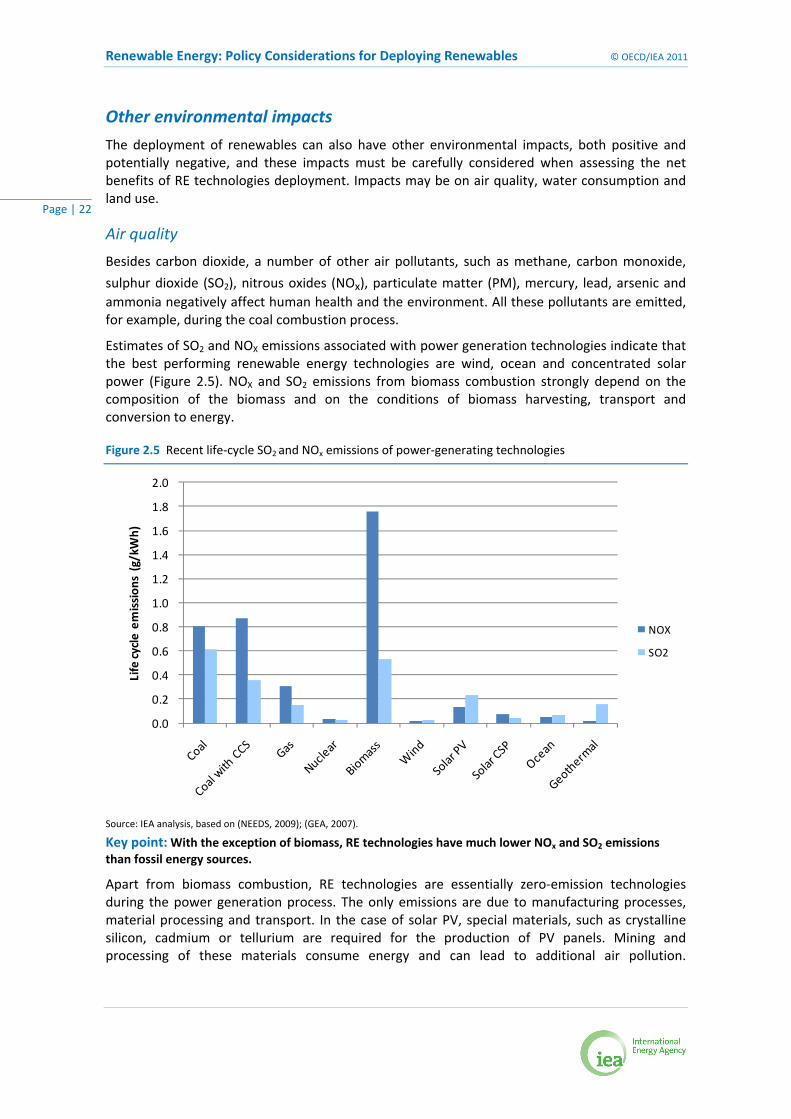
Estimates of SO2 and NOX emissions associated with power generation technologies indicate that the best performing renewable energy technologies are wind, ocean and concentrated solar power (Figure 2.5). NOX and SO2 emissions from biomass combustion strongly depend on the composition of the biomass and on the conditions of biomass harvesting, transport and conversion to energy.
Figure 2.5 Recent life‐cycle SO2 and NOx emissions of power‐generating technologies
Source: IEA analysis, based on (NEEDS, 2009); (GEA, 2007).
Key point: With the exception of biomass, RE technologies have much lower NOx and SO2 emissions than fossil energy sources.
Apart from biomass combustion, RE technologies are essentially zero‐emission technologies during the power generation process. The only emissions are due to manufacturing processes, material processing and transport. In the case of solar PV, special materials, such as crystalline silicon, cadmium or tellurium are required for the production of PV panels. Mining and processing of these materials consume energy and can lead to additional air pollution.
0.0
0.2
0.4
0.6
0.8
1.0
1.2
1.4
1.6
1.8
2.0
Life cycle em
ission
s (g/kWh)
NOX
SO2
© OECD/IEA 2011 Renewable Energy: Policy Considerations for Deploying Renewables
Page | 23
Nonetheless, solar PV emissions are stay far lower than those of coal with or without CCS.8 In addition, due to the steep learning curve of RE technologies (such as PV), emissions can be expected to decrease further.
Water consumption
Water can be required at the various stages of producing and converting fuels and in manufacturing the conversion plants. In particular, power generating technologies using turbine technologies need cooling, which is usually provided by water. When assessing the water consumption of an energy technology in detail, it is important to address what type of water is used. A plant running on treated wastewater has different environmental impacts than a plant extracting freshwater in a region that faces water scarcity. However, the type of water used is not a technologically intrinsic factor and may vary between similar generating facilities. Because the current analysis aims at providing a general overview of the water withdrawal and consumption of energy technologies, the type of water that is used is not discussed in detail.
Consumption refers to the amount of water that is evaporated, transpired, incorporated into products or crops, or otherwise removed from the immediate water environment. Energy technologies also withdraw water from the environment. Withdrawal is defined as the amount of water removed from the ground or diverted from a water source for use. Withdraw can be several times higher than consumption. For conventional power generation technologies, water withdrawal in “once‐through operation” can reach levels between 28 000 to 76 000 l/MWh (gas), 76 000 to 190 000 l/MWh (coal) and 95 000 to 230 000 l/MWh (nuclear) (NREL, 2011).
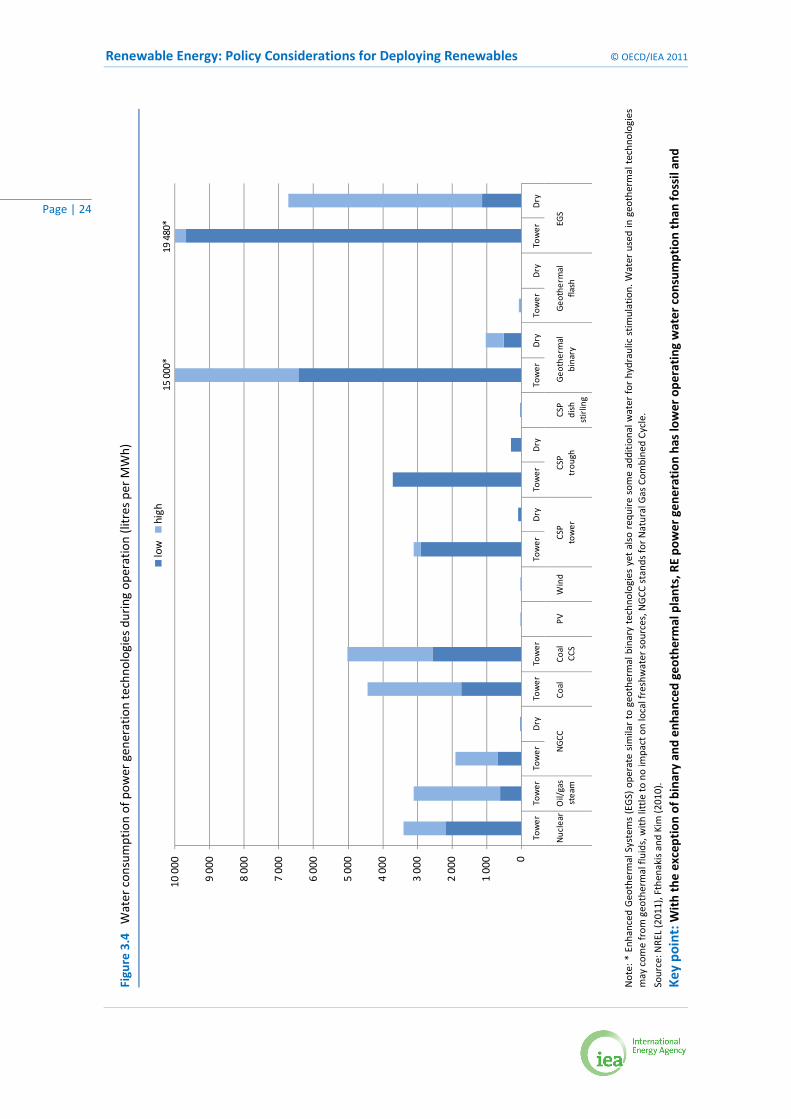
Most RE technologies have significantly lower water consumption profiles than fossil‐fuel and nuclear plants (Figure 2.6). This is especially the case for solar PV and wind. Concentrating solar power (CSP) using parabolic troughs or tower systems has significant water consumption; however, this level of consumption can be greatly reduced if dry cooling is used. Depending on technology, geothermal plants show large variations in their water consumption. Consumption of water by hydropower plants can be very diverse, depending on the site and type of plant. Large reservoirs may have high water losses due to evaporation. However, this is not the case for small run‐of‐river hydropower systems. Depending on technology, bioenergy plants have cooling requirements similar to steam or natural gas combined cycle (NGCC) plants.
Land use
Power generation technologies need land for plant operation, and fuel‐based technologies also need land for the extraction, processing and transport of the fuel (Figure 2.7).
Onshore wind has the highest land use per unit of produced electricity. However, depending on the wind availability, the turbines may occupy only 3% to 5% of the land, and the rest can be employed for other uses, such as agriculture or grazing. Solar technologies need significant land for their operation. However, sites attractive for CSP are often in desert areas with low population density and do not compete with agriculture or other human uses. When installed on buildings, solar PV does not use any land. When mining, processing and transport of coal are taken into account, the land use of coal‐fired generation is comparable with that of solar technologies.
8 CCS technologies reduce emissions of acid gases, such as SO2, during combustion, but emissions of other air pollutants, such as NOx, increase. Furthermore, additional coal per unit of electricity generation needed increases emissions related to mining and transport.
Renewable Energy: Policy Considerations for Deploying Renewables © OECD/IEA 2011
Page | 24
Figure 3.4 Water con
sumption of pow
er gen
eration techno
logies during op
eration (litres per M
Wh)
Note: * Enh
anced Geo
thermal Systems (EGS) ope
rate sim
ilar to geo
thermal binary techno
logies yet also requ
ire some additio
nal w
ater for hydraulic stim
ulation. W
ater used in geo
thermal techn
ologies
may com
e from
geo
thermal fluids, w
ith little to
no im
pact on local freshwater sou
rces, N
GCC
stand
s for N
atural Gas Com
bine
d Cycle.
Source: N
REL (201
1), Fthen
akis and
Kim
(201
0).
Key po
int: W
ith the exception of binary an
d en
hanced
geo
thermal plants, RE po
wer gen
eration ha
s lower ope
rating
water con
sumption than
fossil an
d
0
1 000
2 000
3 000
4 000
5 000
6 000
7 000
8 000
9 000
10 000
Tower
Tower
Tower
Dry
Tower
Tower
Tower
Dry
Tower
Dry
Tower
Dry
Tower
Dry
Tower
Dry
Nuclear
Oil/gas
steam
NGCC
Coal
Coal
CCS
PVWind
CSP
tower
CSP
trou
ghCSP
dish
stirling
Geo
thermal
binary
Geo
thermal
flash
EGS
low
high
15 000*
19 480*
© OECD/IEA 2011 Renewable Energy: Policy Considerations for Deploying Renewables
Page | 25
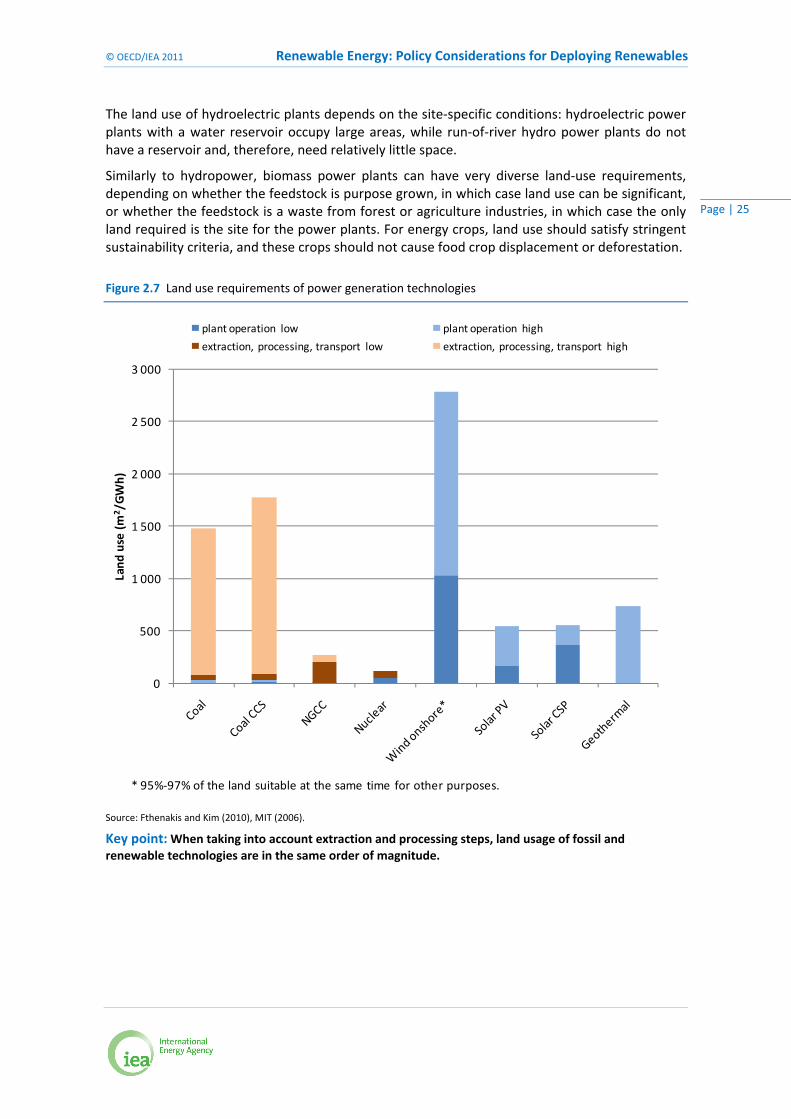
The land use of hydroelectric plants depends on the site‐specific conditions: hydroelectric power plants with a water reservoir occupy large areas, while run‐of‐river hydro power plants do not have a reservoir and, therefore, need relatively little space.
Similarly to hydropower, biomass power plants can have very diverse land‐use requirements, depending on whether the feedstock is purpose grown, in which case land use can be significant, or whether the feedstock is a waste from forest or agriculture industries, in which case the only land required is the site for the power plants. For energy crops, land use should satisfy stringent sustainability criteria, and these crops should not cause food crop displacement or deforestation.
Figure 2.7 Land use requirements of power generation technologies
Source: Fthenakis and Kim (2010), MIT (2006).
Key point: When taking into account extraction and processing steps, land usage of fossil and renewable technologies are in the same order of magnitude.
0
500
1 000
1 500
2 000
2 500
3 000
Land
use (m
2 /GWh)
plant operation low plant operation high
extraction, processing, transport low extraction, processing, transport high
* 95%‐97% of the land suitable at the same time for other purposes.
Renewable Energy: Policy Considerations for Deploying Renewables © OECD/IEA 2011
Page | 26
Mapping policy drivers: the energy security / GDP matrix
The previous sections have assessed the important contributions that renewables can make in improving energy security, stimulating industrial and economic development, mitigating climate change and protecting the environment. In a given policy context, these drivers are active to different extents and also interact with other policy objectives. This complex interaction gives rise to a country’s specific policy and market context for renewable energy technologies.
Change is often said to be driven either by desperation or inspiration. In the energy sphere, change can be driven by concerns about energy security and the negative impacts of unstable energy prices and long‐term energy access (desperation). Countries facing energy security concerns (that is, those that rely heavily on energy imports) could be expected to take measures to improve their energy independence or to diversify their energy portfolios though a number of initiatives, including developing renewables. Change can also be stimulated by a willingness to support actions to improve the global and local environment, or to provide stimulation for innovation and economic development (inspiration). To date, when some renewable technologies have been relatively expensive compared to fossil‐fuel alternatives, the countries that are most able to afford a package of measures necessary to promote renewables in order to stimulate the local and global benefits are likely to be the early adopters and developers.
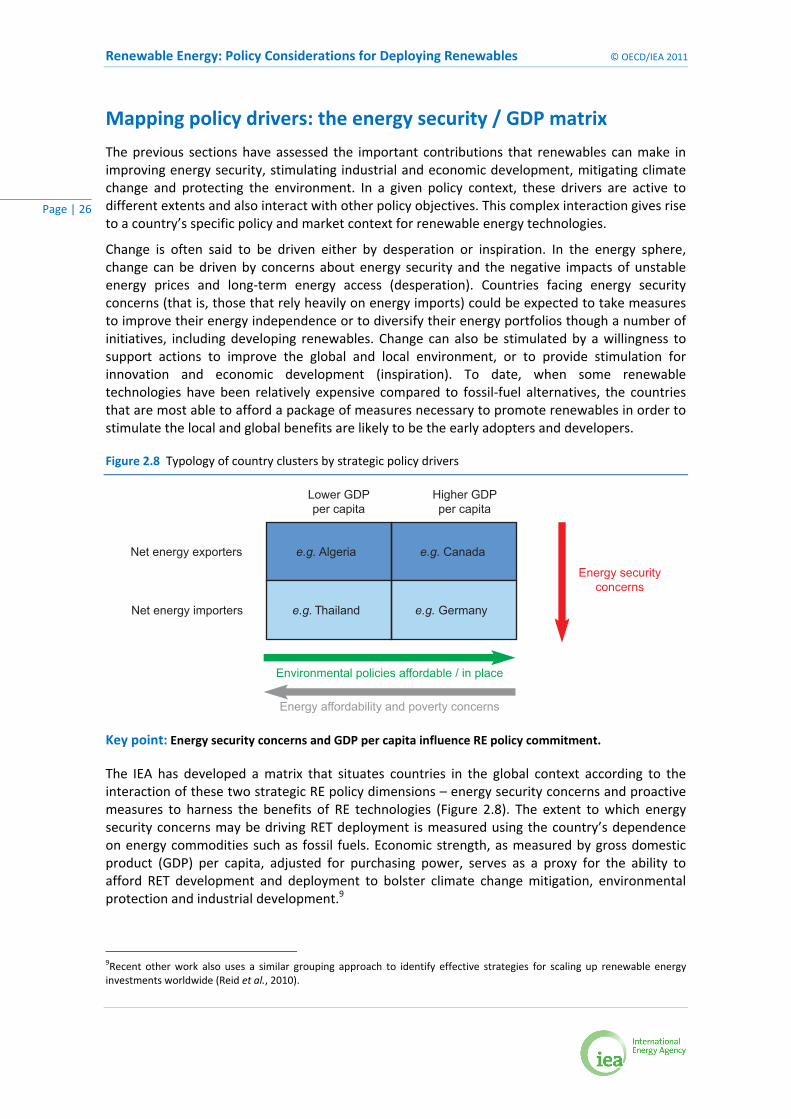
Figure 2.8 Typology of country clusters by strategic policy drivers
Key point: Energy security concerns and GDP per capita influence RE policy commitment.
The IEA has developed a matrix that situates countries in the global context according to the interaction of these two strategic RE policy dimensions – energy security concerns and proactive measures to harness the benefits of RE technologies (Figure 2.8). The extent to which energy security concerns may be driving RET deployment is measured using the country’s dependence on energy commodities such as fossil fuels. Economic strength, as measured by gross domestic product (GDP) per capita, adjusted for purchasing power, serves as a proxy for the ability to afford RET development and deployment to bolster climate change mitigation, environmental protection and industrial development.9
9Recent other work also uses a similar grouping approach to identify effective strategies for scaling up renewable energy investments worldwide (Reid et al., 2010).
Energy securityconcerns
Environmental policies affordable / in place
Energy affordability and poverty concerns
Lower GDPper capita
Higher GDPper capita
Net energy exporters
Net energy importers
e.g. Algeria e.g. Canada
e.g. Thailand e.g. Germany
© OECD/IEA 2011 Renewable Energy: Policy Considerations for Deploying Renewables
Page | 27
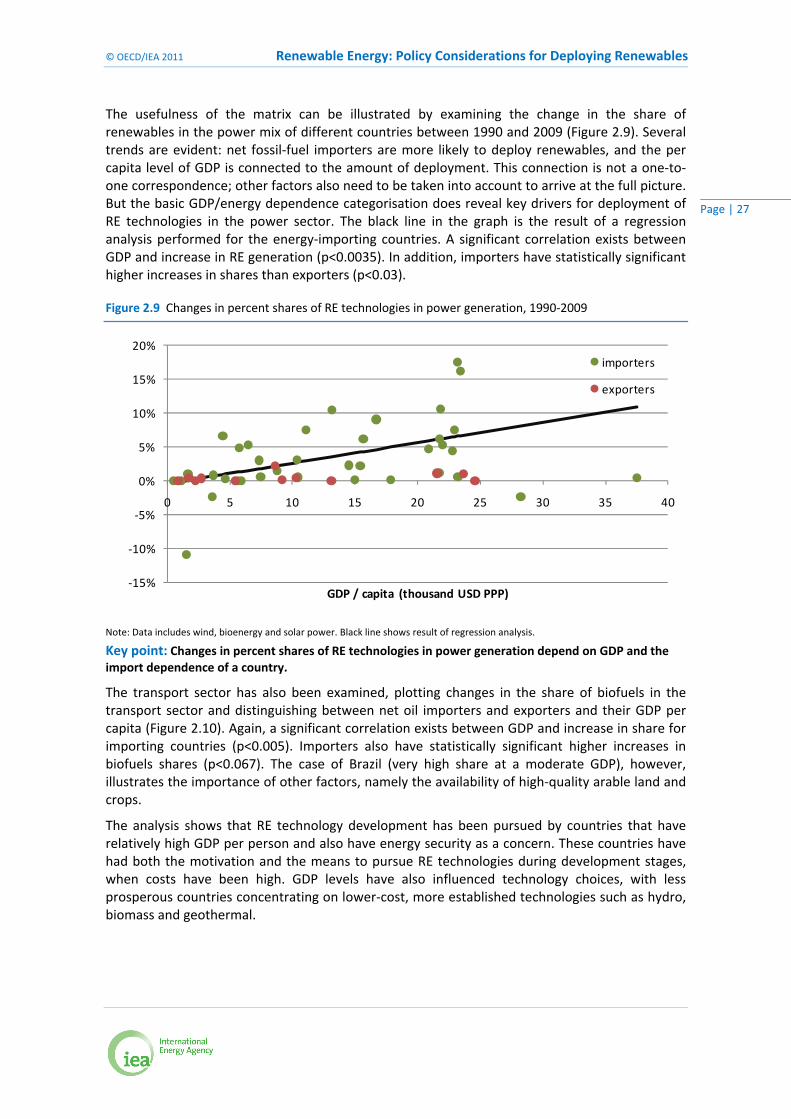
The usefulness of the matrix can be illustrated by examining the change in the share of renewables in the power mix of different countries between 1990 and 2009 (Figure 2.9). Several trends are evident: net fossil‐fuel importers are more likely to deploy renewables, and the per capita level of GDP is connected to the amount of deployment. This connection is not a one‐to‐one correspondence; other factors also need to be taken into account to arrive at the full picture. But the basic GDP/energy dependence categorisation does reveal key drivers for deployment of RE technologies in the power sector. The black line in the graph is the result of a regression analysis performed for the energy‐importing countries. A significant correlation exists between GDP and increase in RE generation (p<0.0035). In addition, importers have statistically significant higher increases in shares than exporters (p<0.03).
Figure 2.9 Changes in percent shares of RE technologies in power generation, 1990‐2009
Note: Data includes wind, bioenergy and solar power. Black line shows result of regression analysis.
Key point: Changes in percent shares of RE technologies in power generation depend on GDP and the import dependence of a country.
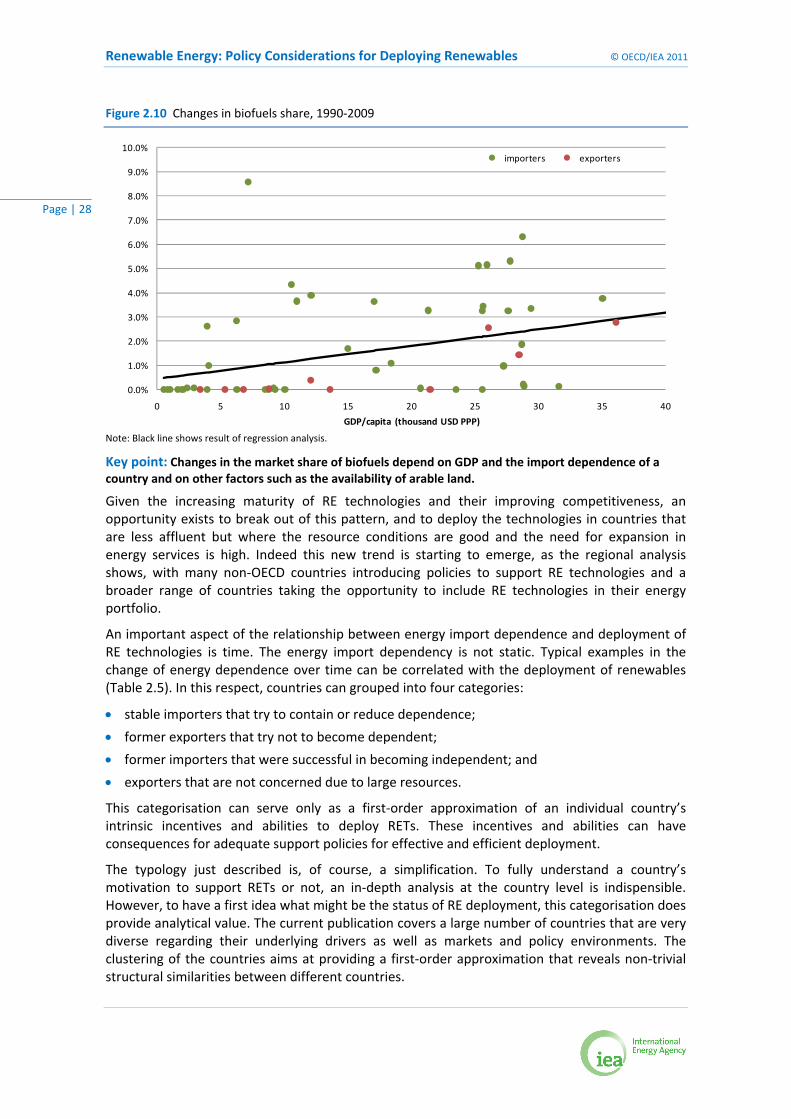
The transport sector has also been examined, plotting changes in the share of biofuels in the transport sector and distinguishing between net oil importers and exporters and their GDP per capita (Figure 2.10). Again, a significant correlation exists between GDP and increase in share for importing countries (p<0.005). Importers also have statistically significant higher increases in biofuels shares (p<0.067). The case of Brazil (very high share at a moderate GDP), however, illustrates the importance of other factors, namely the availability of high‐quality arable land and crops.
The analysis shows that RE technology development has been pursued by countries that have relatively high GDP per person and also have energy security as a concern. These countries have had both the motivation and the means to pursue RE technologies during development stages, when costs have been high. GDP levels have also influenced technology choices, with less prosperous countries concentrating on lower‐cost, more established technologies such as hydro, biomass and geothermal.
‐15%
‐10%
‐5%
0%
5%
10%
15%
20%
0 5 10 15 20 25 30 35 40
GDP / capita (thousand USD PPP)
importers
exporters
Renewable Energy: Policy Considerations for Deploying Renewables © OECD/IEA 2011
Page | 28
Figure 2.10 Changes in biofuels share, 1990‐2009
Note: Black line shows result of regression analysis.
Key point: Changes in the market share of biofuels depend on GDP and the import dependence of a country and on other factors such as the availability of arable land.
Given the increasing maturity of RE technologies and their improving competitiveness, an opportunity exists to break out of this pattern, and to deploy the technologies in countries that are less affluent but where the resource conditions are good and the need for expansion in energy services is high. Indeed this new trend is starting to emerge, as the regional analysis shows, with many non‐OECD countries introducing policies to support RE technologies and a broader range of countries taking the opportunity to include RE technologies in their energy portfolio.
An important aspect of the relationship between energy import dependence and deployment of RE technologies is time. The energy import dependency is not static. Typical examples in the change of energy dependence over time can be correlated with the deployment of renewables (Table 2.5). In this respect, countries can grouped into four categories:
• stable importers that try to contain or reduce dependence;
• former exporters that try not to become dependent;
• former importers that were successful in becoming independent; and
• exporters that are not concerned due to large resources.
This categorisation can serve only as a first‐order approximation of an individual country’s intrinsic incentives and abilities to deploy RETs. These incentives and abilities can have consequences for adequate support policies for effective and efficient deployment.
The typology just described is, of course, a simplification. To fully understand a country’s motivation to support RETs or not, an in‐depth analysis at the country level is indispensible. However, to have a first idea what might be the status of RE deployment, this categorisation does provide analytical value. The current publication covers a large number of countries that are very diverse regarding their underlying drivers as well as markets and policy environments. The clustering of the countries aims at providing a first‐order approximation that reveals non‐trivial structural similarities between different countries.
0.0%
1.0%
2.0%
3.0%
4.0%
5.0%
6.0%
7.0%
8.0%
9.0%
10.0%
0 5 10 15 20 25 30 35 40
GDP/capita (thousand USD PPP)
importers exporters
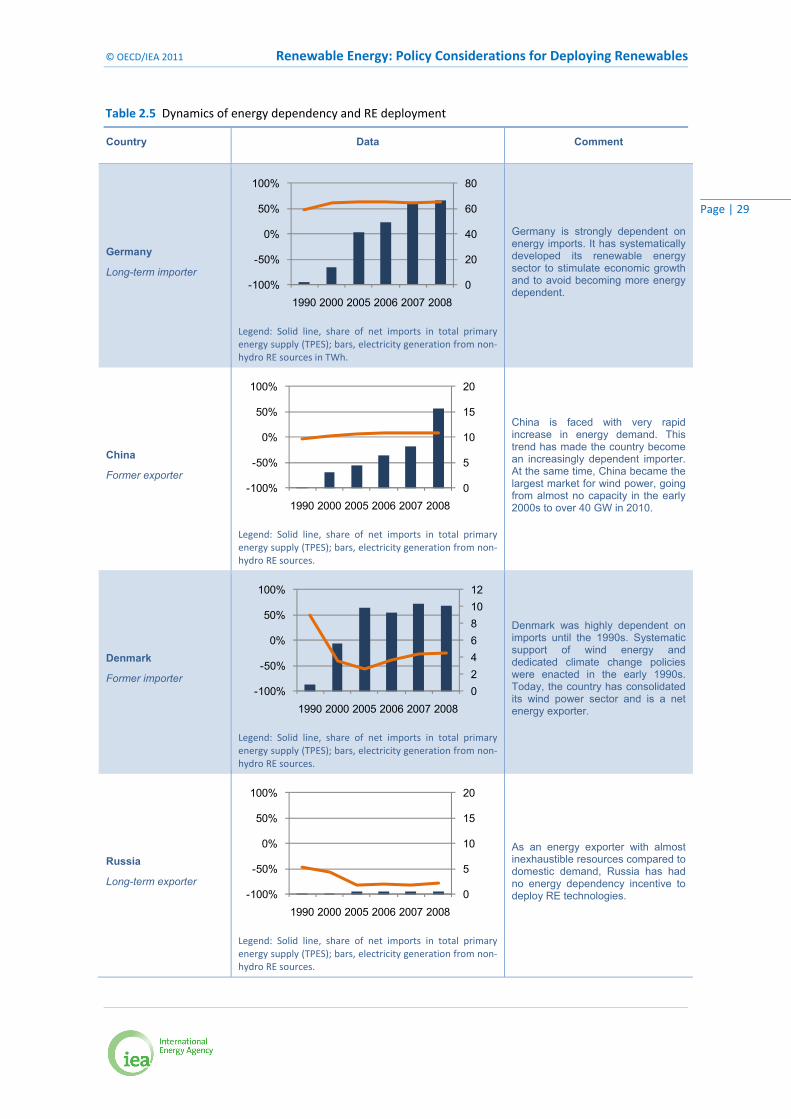
© OECD/IEA 2011 Renewable Energy: Policy Considerations for Deploying Renewables
Page | 29
Table 2.5 Dynamics of energy dependency and RE deployment
Country Data Comment
Germany
Long-term importer
Legend: Solid line, share of net imports in total primary energy supply (TPES); bars, electricity generation from non‐hydro RE sources in TWh.
Germany is strongly dependent on energy imports. It has systematically developed its renewable energy sector to stimulate economic growth and to avoid becoming more energy dependent.
China
Former exporter
Legend: Solid line, share of net imports in total primary energy supply (TPES); bars, electricity generation from non‐hydro RE sources.
China is faced with very rapid increase in energy demand. This trend has made the country become an increasingly dependent importer. At the same time, China became the largest market for wind power, going from almost no capacity in the early 2000s to over 40 GW in 2010.
Denmark
Former importer
Legend: Solid line, share of net imports in total primary energy supply (TPES); bars, electricity generation from non‐hydro RE sources.
Denmark was highly dependent on imports until the 1990s. Systematic support of wind energy and dedicated climate change policies were enacted in the early 1990s. Today, the country has consolidated its wind power sector and is a net energy exporter.
Russia
Long-term exporter
Legend: Solid line, share of net imports in total primary energy supply (TPES); bars, electricity generation from non‐hydro RE sources.
As an energy exporter with almost inexhaustible resources compared to domestic demand, Russia has had no energy dependency incentive to deploy RE technologies.
0
20
40
60
80
-100%
-50%
0%
50%
100%
1990 2000 2005 2006 2007 2008
0
5
10
15
20
-100%
-50%
0%
50%
100%
1990 2000 2005 2006 2007 2008
024681012
-100%
-50%
0%
50%
100%
1990 2000 2005 2006 2007 2008
0
5
10
15
20
-100%
-50%
0%
50%
100%
1990 2000 2005 2006 2007 2008
Renewable Energy: Policy Considerations for Deploying Renewables © OECD/IEA 2011
Page | 30
Some of the subtleties that are lost by the energy security/GDP classification include:
• Availability of cost‐effective, abundant renewable resources (large hydro, geothermal).
• Success in becoming energy independent by means of targeted policy action, including renewables deployment (Denmark).
• Total GDP levels: per capita GDP levels may be similar for small, low‐population economies (e.g. Tunisia) and large, populous emerging economies (e.g. China), although the latter’s overall economic clout and ability to support renewables are evidently much larger.
• The influence of energy market structure: competitive and liberalised compared with monopolistic and centralised/planned organisation.
© OECD/IEA 2011 Renewable Energy: Policy Considerations for Deploying Renewables
Page | 31
Successful Deployment: Challenges and Policy Tools
Overview
In 2009, two‐thirds of the world’s installed solar water heater capacity was in China, up from only 25% in 2000. This market share was achieved in the absence of direct economic support for the technology’s recent deployment. At the same time, in Greece, onshore wind power generators received the highest remuneration levels of all OECD and BRICS countries (IEA, 2011a).10 Deployment, however, has been almost absent until very recently. These are two examples, but they illustrate that it is not merely economic support that leads to successful deployment.
The challenges involved with deploying renewables can be summarised using two concepts that are well known in the financing community: risk and return. To attract investment, a given investment opportunity needs to provide the right balance between both. The higher the risk is that the project may fail, the higher the required return. Public debate and political discourse on deploying renewables tend to highlight only one side of the equation: the returns provided to investors. The risks that deployment faces tend to be less prominent in the discussion. However, the risk structure is a key element in determining how high returns must be to enable investment into renewables. Therefore, policies need to specifically target the risks associated with the deployment of renewables and find a smart way to remove or mitigate them. This approach leads to enhanced cost‐effectiveness and faster deployment.
In the terminology of this publication, the sources of risk are considered to be deployment barriers, while the tools to mitigate risks are called enablers. Although a broad literature exists on the basic challenges to RET deployment and the strategies to approach them, this chapter provides an overview to set the stage for a more detailed discussion of specific and/or emerging issues. Only if the barriers to deployment are sufficiently understood, can the right enablers be put into place. Therefore the first part of this chapter describes the different types of barriers and the options currently available to overcome them. To make the different barrier types more tangible, the discussion illustrates selected barriers and corresponding enablers with salient examples. This part of the chapter also presents the results of an IEA study of the relative importance of different barriers.
The second part of the chapter focuses on the dynamics of deployment. Barriers to deployment are not static. They vary from country to country and also depend on:
• the maturity of a given energy technology;
• the state of the domestic markets for this technology; and
• the state of the global markets for this technology.
An optimal policy package takes into account the current state of the national market and adapts to the changing barrier profile as deployment takes place. The policy needs to take into account the overall maturity of the technology and the state of its market on a global scale. To phrase it differently, a country that deploys renewables needs to continuously adapt its policy tools. It needs to go on a policy journey.
Putting in place the right package of measures at the right time is the key to successfully deploying renewables. Therefore the second part of this chapter discusses the dynamics of market development, technology diffusion and policy adaptation. 10 Due to the combination of a moderate FIT and direct investment support.
Renewable Energy: Policy Considerations for Deploying Renewables © OECD/IEA 2011
Page | 32
Scaling up renewables: challenges and policy tools
In recent years, the renewable energy sector has witnessed an investment boom. From 2004 to 2009, new investment in renewable energy grew fivefold, to reach USD 160 billion (UNEP/BNEF, 2011). No comprehensive figures are available for total global investment in energy, but rough estimates suggest that renewable energy technologies (RETs) now constitute between 15% and 20% of the total. This market expansion has helped push RETs down their respective learning curves11 as production costs decline and technology performance improves.
Depending on (i) their level of technology maturity and (ii) the extent to which external benefits and costs (such as those resulting from GHG emissions, pollution remediation and damage to health) are internalised, RETs differ in their competitiveness relative to conventional energy technologies. When these factors are lacking, the absence can constitute an economic barrier to the deployment of those technologies. Some RETs are close to becoming commercial and should be the first to be deployed on a massive scale. Other RETs, which have a large potential, are less mature and require a longer‐term perspective.
Because the deployment of modern renewable energy conversion technologies is relatively recent in many countries, past initiatives for the development of renewable energy sources (RES‐E) have largely focused on the economic factors, and the reduction of economic barriers has been the main focus of support measures undertaken. Past success stories for the development and deployment of RES (e.g. in certain European Union countries) support the point that barriers can be overcome by targeted policy action (see e.g. Ragwitz et al., 2007).
Risks associated with renewable energy projects stem both from underlying economic factors and barriers that are non‐economic in nature. An economic barrier is present if the cost of a given technology is above the cost of competing alternatives, even under optimal market conditions. Technological maturity and economic barriers are very directly connected. All other types of barriers are categorised as non‐economic. However, non‐economic barriers have just as an important role in shaping the cost of RETs. Findings from earlier analysis suggest that non‐economic barriers stand in the way of significantly scaling up the contribution of renewables to a future sustainable energy mix (IEA, 2008). Barriers to deployment can be classified as follows:
• Techno‐economic barriers relate to the direct costs of a certain technology in comparison to competing technologies, given the internalisation of all external costs and ideal framework conditions.
• Non‐economic barriers relate to factors that either prevent deployment altogether (no matter how high the willingness to pay) or lead to higher costs than necessary or distorted prices. These barriers can be differentiated further:
• Regulatory and policy uncertainty barriers, which relate to bad policy design, or discontinuity and/or insufficient transparency of policies and legislation.
• Institutional and administrative barriers, which include the lack of strong, dedicated institutions, lack of clear responsibilities, and complicated, slow or non‐transparent permitting procedures.
• Market barriers, such as inconsistent pricing structures that disadvantage renewables, asymmetrical information, market power, subsidies for fossil fuels, and the failure of costing methods to include social and environmental costs.
11 Energy Technology Perspectives 2010 (IEA, 2010b) gives a detailed assessment of the long‐term prospects for energy technologies, including RE technologies.
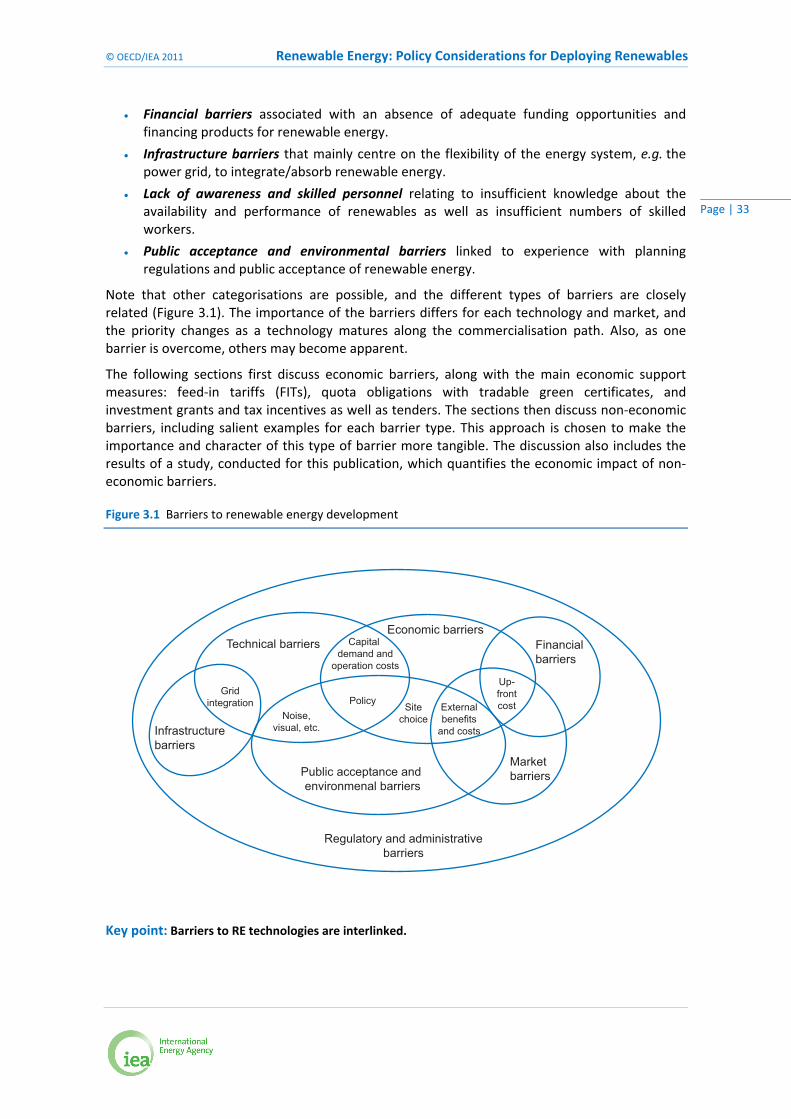
© OECD/IEA 2011 Renewable Energy: Policy Considerations for Deploying Renewables
Page | 33
• Financial barriers associated with an absence of adequate funding opportunities and financing products for renewable energy.
• Infrastructure barriers that mainly centre on the flexibility of the energy system, e.g. the power grid, to integrate/absorb renewable energy.
• Lack of awareness and skilled personnel relating to insufficient knowledge about the availability and performance of renewables as well as insufficient numbers of skilled workers.
• Public acceptance and environmental barriers linked to experience with planning regulations and public acceptance of renewable energy.
Note that other categorisations are possible, and the different types of barriers are closely related (Figure 3.1). The importance of the barriers differs for each technology and market, and the priority changes as a technology matures along the commercialisation path. Also, as one barrier is overcome, others may become apparent.
The following sections first discuss economic barriers, along with the main economic support measures: feed‐in tariffs (FITs), quota obligations with tradable green certificates, and investment grants and tax incentives as well as tenders. The sections then discuss non‐economic barriers, including salient examples for each barrier type. This approach is chosen to make the importance and character of this type of barrier more tangible. The discussion also includes the results of a study, conducted for this publication, which quantifies the economic impact of non‐economic barriers.
Figure 3.1 Barriers to renewable energy development
Key point: Barriers to RE technologies are interlinked.
Technical barriers
Infrastructurebarriers
Policy Sitechoice
Externalbenefits
and costs
Up-frontcost
Noise,visual, etc.
Gridintegration
Capital demand and
operation costs
Economic barriers
Regulatory and administrativebarriers
Financial barriers
Market barriersPublic acceptance and
environmenal barriers

Renewable Energy: Policy Considerations for Deploying Renewables © OECD/IEA 2011
Page | 34
Economic barriers
As introduced above, economic barriers are present if the cost of a given technology is above the cost of competing alternatives, even under the optimal market conditions. In the past, this situation has been true for the majority of RETs. Given the current market structure, the cost of RETs is also, in most cases, above the cost of conventional alternatives. Whether this is due to market distortions or if this reflects a true economic barrier cannot be said with certainty due to the uncertainties connected with the impacts of climate change, and because the true cost of CO2
emissions remains unknown.
Conventional energy technologies have undergone more than 150 years of systematic research and learning.12 This level of research is more than in the case of renewable energies. However, the cost of RETs has come down quickly recently as a result of learning. Unlocking the cost reduction potential of RETs by mass deployment is the key rationale for direct economic deployment support.
Direct economic support policies aim at directly altering the balance of supply and demand in a way that increases the total market volume. Economic support mechanisms share the characteristic that they create an additional revenue stream for renewable energy, or they force market participants to use certain technologies. Currently the most widely used mechanism for generating additional revenues is the feed‐in tariff. Tradable green certificates are used in a smaller number of countries. Certificate schemes are commonly linked to a quota obligation. The obligation enforces a technology choice while the certificate system provides the additional revenue streams. Note that certificate systems need a quota to function properly. But a quota system can be implemented without a certificate system.13
Tax incentives and direct investment subsidies complement the available tools for overcoming economic barriers by additional payments. Obligatory standards such as building codes or blending requirements are examples of schemes that rely on making the usage of renewable technologies obligatory, thereby creating demand even if these technologies are not yet cost competitive. Both types of policies can be combined: tradable green certificates gain a market value only by virtue of the introduction of a quota obligation that requires retailers of electricity to buy a certain number of certificates. Tendering schemes are also used for supporting RET deployment.
Renewable electricity
The three types of support mechanisms most commonly applied for deploying renewable electricity on a large scale are feed‐in tariffs (FITs), tradable green certificates (TGCs) in conjunction with quota obligations, and tenders. Less widely used policies for true mass deployment are tax incentives and cash grants. For all of the mechanisms to work properly, it is important that renewable electricity has guaranteed connection to the grid and preferential access. Otherwise, system operators may not connect or may curtail renewable generators.
Feed‐in tariffs
Feed‐in tariffs (FITs) guarantee the generator of renewable electricity a certain price per kWh at which electricity is bought. The tariff is set over a long period of time, commonly 20 years. Note 12 Some 70 years in the case of nuclear energy. 13 In the United States, utilities are mandated to purchase or generate certain quotas from renewable sources (Renewable Portfolio Standards). These are often satisfied by long‐term power purchasing agreements between RES generators and utilities.
© OECD/IEA 2011 Renewable Energy: Policy Considerations for Deploying Renewables
Page | 35
that the tariff is fixed during the entire period of support (sometimes an adjustment to inflation is included). Tariff adjustments are made only for new plants.
Although originally intended to be the only remuneration to generators, some later FITs provide a premium. Generators sell their electricity on the market and receive a premium on top. This premium is either fixed or varies according to the electricity market price; i.e. the sum of market revenues and premium is set in a certain interval. Some governments have put annual caps on the amount of capacity that can benefit from FIT support in a certain time period.
The most recent development regarding FITs is the so‐called breathing cap,14 which was introduced for solar PV in Germany. The programmed tariff degression is linked to the deployment in the year before: tariffs go down more quickly if installations are above a certain target.
Tradable green certificates
Certificate systems are based on the idea of separating the actual power and its “greenness”. The power is sold on the normal market. In addition, renewable generators can sell a certificate that represents a certain amount of renewable electricity that they generated. A separate market is established for these certificates. Certificates are sold to large consumers or retailers of electricity that are obliged to buy a certain number of these certificates. This number (cap) is an upper bound for the annual generation, because prices would drop sharply if there were an oversupply of certificates. TGC schemes usually include a fine that the entities under the obligation have to pay if they fail to buy enough certificates. This penalty rate determines an upper bound for the value of certificates in most cases.
In their original form, certificates did not differentiate by technology. Today some schemes issue more certificates for the same amount of electricity produced by more expensive, yet promising technologies to stimulate deployment of a portfolio of technologies.
Tendering schemes
Under a tendering scheme, a regulatory authority announces that it wishes to install a certain capacity of a given technology or suite of technologies. Project developers then apply to build the project and name the price at which they are willing to develop the project. Tenders commonly contain specific requirements (e.g. shares of local manufacturing, details of technological specifications, maximum price per unit of energy). The bidder with the lowest offer is selected and can go ahead with the project. Usually the parties sign a long‐term contract (power purchasing agreement). Tenders combine two enablers to overcoming economic barriers: they establish a guaranteed demand, and they ensure, at least in theory, that revenues recover costs.
Tax incentives
The United States (on the federal level) relies particularly on tax incentives to support renewables. An important prerequisite for this scheme to function is that tax credits can be traded in the United States. So if a wind farm operator generates USD 100 worth of tax deductions, the project owner can sell this deduction to companies that can then deduct this amount from their taxes.
14 The German feed‐in law couples tariff evolution to deployment. If deployment exceeds a certain amount, tariffs are cut more; if deployment lags behind, tariffs are cut less. This procedure, however, only takes domestic market data into account. Incorporating global data (module price index) may lead to some further refinement of the mechanism.
Renewable Energy: Policy Considerations for Deploying Renewables © OECD/IEA 2011
Page | 36
Direct cash grants and rebates
A direct support payment that buys down the price of a given technology is a very direct and easily implemented way of creating additional revenues for renewables. In the United States, the Section 1603 grant scheme works in this way: renewable energy project developers get back 30% of the investment costs in cash. This payment lowers the effective price that project developers see and, therefore, makes the technology more competitive. This measure was introduced after the market for tax credits (see above) had collapsed due to the economic and financial crisis in 2009.
Renewable heat
The policy design for renewable heat is different from renewable electricity due to a number of key differences between the delivery of heat and electricity (Connor et al., 2009). The heterogeneous nature of heating fuels means that a diverse group of companies supplies the market. The demand side is also is fragmented and difficult to target: heat is produced on site by millions of building owners and developers, district heating operators and industries. Moreover, installers, heating engineers and architects often act as crucial gatekeepers between supply and demand. To date, the most widely adopted financial mechanisms in the European Union for the support of renewable heat technologies are direct capital grants and tax credits for the purchase of a renewable heating system. Recently, a number of countries introduced more innovative renewable heat policies, designed as government budget‐neutral policies or based on the “polluter pays” principle.
Capital grants and subsidies
To date, direct capital cost subsidies for the purchase of a renewable heating system are the most widely adopted financial mechanism in the OECD for the support of renewable heat. The general idea is that consumers receive a financial incentive that lowers the effective price of the installation at the time of purchase. This incentive can be in the form of a direct cash rebate or a tax credit.
Renewable heat obligations
A number of countries have deviated from financial incentive schemes to introduce use obligations for a specific renewable heat technology or for renewable heat in general. Israel was the first country to introduce solar collector obligations, when it made solar collectors obligatory in new residential buildings in 1980. Due to the solar obligation, solar thermal systems are now a mainstream technology in the Israel water heater market without any financial support. The Spanish government developed a national solar obligation policy in 2006, with Portugal and cities in Italy, Brazil and India following soon after.
Renewable heat feed‐in tariff
On 10 March 2011, the government of the United Kingdom announced the details of the Renewable Heat Incentive policy, a first initiative for designing a feed‐in tariff policy for the heat market. It is similar to FITs used in the electricity sector. The Renewable Heat Incentive policy provides a different kind of support in the domestic sector as compared with the non‐domestic sector. The domestic sector will receive a grant upon installing a renewable heat technology in the first year of the scheme, with long‐term tariff support to be introduced in the second year. Renewable Heat Premium payments for the non‐domestic sector will be made quarterly over a 20‐year period.
© OECD/IEA 2011 Renewable Energy: Policy Considerations for Deploying Renewables
Page | 37
Renewable transport
The principal policy tools that have been used to stimulate demand for biofuels are blending mandates coupled with fuel duty rebates. A mandate legally requires fuel retailers to add a certain percentage of biofuels to the conventional fuel. Mandates are now in place in nearly 50 countries.
Non‐economic barriers
Persistent non‐economic barriers, such as government energy policies skewed against renewable energy and high administrative burdens, can have a significant financial impact, especially if they obstruct the early investment‐intensive project cycle phases (project development, financial closure, construction). This obstruction increases the required investment return, thereby raising levelised generation costs. If the right policies addressing these issues are put in place, most other barriers can be overcome. The following examples are just a selection of the types of difficulties that RET deployment tends to experience and the solutions that have been found so far. The selection does not seek to identify the “worst” cases. Rather it aims at giving more life to the otherwise very abstract notion of non‐economic barriers.
Concrete examples
Market barriers
Costs and benefits of investments in renewable heat are split between different stakeholders.
Persons renting an apartment (tenants) normally cover the operating costs of the apartment, including the cost of warm water and heating. Owners of real estate, on the other hand, are commonly in charge of covering the costs of investments, such as a new heating system. If a more efficient or environmentally friendly option has a higher up‐front cost, building owners are less likely to buy this option. This is true even if the total costs of the application are lower, i.e. the benefits outweigh the additional costs in the long term. This type of barrier has proven to be a major problem for the larger market penetration of solar heating systems and more efficient space heating systems.
The Dutch residential valuation system aims at resolving the problem of split incentives.
In general, two basic approaches may be taken to resolve this problem. The first approach is to create mandatory standards for the efficiency of new buildings or the technologies that need to be used. This type of policy has fostered the deployment of solar water heaters in Israel since the 1980s. Spain and Germany also have such obligations for new buildings.
A second, innovative approach to address the problem of split incentives in existing buildings has recently been conceived in the Netherlands. In the Netherlands, 32% of the housing stock consists of social housing, managed by housing associations. This sector is heavily regulated by the central government by means of a system that prescribes maximum rents relating to housing quality, the “residential valuation scheme”. Up to now, this system complicated energy conservation initiatives, because housing associations did not benefit from increasing the energy label of their stock: the split incentive. It is expected that, from 1 July 2011, the residential valuation scheme will attribute a valuation to the energy label of a property, which allows the housing association to raise the rent whenever the energy label is improved. The tenant is expected to benefit from the new scheme as well, because the scheme is designed in such a way that the rent increase will be less than the savings on the energy bill.
Renewable Energy: Policy Considerations for Deploying Renewables © OECD/IEA 2011
Page | 38
Financing barriers
Large‐scale demonstration plants for second‐generation biofuels have trouble finding investors.
Advanced biofuel production plants require large amounts of up‐front capital expenditure. Large‐scale demonstration projects are the key to prove the technical and economic feasibility of a novel technology such as second‐generation biofuels production. However, such projects are considered to be risky, because the technology has not been proven until such a demonstration is successful. This situation leads to the absence of large‐scale demonstrations, because developers are unable to secure the necessary financing. This phenomenon is more broadly known as the commercialisation “valley of death”. It is addressed as a topical highlight in this publication.
Morocco has established a dedicated institution to develop its solar resource.
Both the United States, through the US Department of Energy’s Biomass Program, and the European Union, through its Seventh Framework Programme and the European Industrial Bioenergy Initiative (EIBI), provide financial support to advanced biofuel production plants. The provided grants and loan guarantees are adequate measures to reduce investment risks and have led to a considerable number of pilot and demonstration plants operating or currently being constructed.
However, only a very few commercial‐scale advanced biofuel projects have yet been announced, and only a few are operating today. More government support, via grants and loan guarantees promoted through public‐private partnerships, coupled with revenue support for the novel products, may be needed to bring these technologies through to full‐scale operation.
15 The energy payback time refers to the time after which the energy that was required in the production of a RET system has been recovered from the generated electricity. The energy payback time of solar PV was estimated around 1.9 years in 2009 (this time depends highly on resource). According to data from the European Wind Energy Association (EWEA), a wind turbine has an energy payback period of 3‐5 months.
Awareness barriers
Public knowledge about the performance of modern RETs is insufficient.
Renewable energy technologies have seen significant technological advancements, but this progress is not always reflected in public perceptions. In the public debate, either information on current costs is absent, or outdated numbers are cited. Other examples include the energy payback time of wind turbines or solar cells,15 or the reliability of RETs. Insufficient or false information can impede public support for the deployment of renewables. This lack of public support, in turn, makes it less attractive for policy makers to adopt strong legislation to foster deployment. Especially in developing countries, past experiences with early models of solar and wind technology have led to a bias against these technologies.
Public competitions can raise awareness and present innovative solutions.
A wide range of public awareness activities have been put in place in many countries, although renewables are often a sideshow to energy efficiency improvements. These activities have taken many different forms, including advertising campaigns, providing information to media, establishing information centres, and websites. In some cases, raising public awareness is the crux of a policy, in particular when solutions are diverse and need significant tailoring. Public competitions that reward best building designs, and accompanying documentation, help publicise effective solutions and ways of conducting an analysis of needs and possibilities for various buildings under diverse climate conditions. For example, the competition “Solar housing – housing of today” run by the French NGO Observ’ER since 1989 now has 3 main categories (individual houses, collective dwellings and commercial buildings) and 13 distinct prices, rewarding recent achievements such as low‐consumption buildings, positive energy buildings, and refurbishments under metropolitan and overseas French climates.
© OECD/IEA 2011 Renewable Energy: Policy Considerations for Deploying Renewables
Page | 39
Environmental barriers
Environmental impacts of construction and operation of offshore wind parks are not well understood.
The construction of offshore wind turbines requires extensive works for building turbine foundations. Support structures for offshore turbines are very large (3 m to 7 m in diameter, Lozano‐Minguez, Kolios and Brennan, 2011), and noise levels during construction could have negative impacts, especially on marine mammals (Bailey et al., 2010). It is unclear what impacts on marine wildlife will be seen once massive offshore deployment takes place, especially in the North Sea.In addition, the operation of the turbines may also have negative impacts on marine wildlife, due to noise emissions and as an obstacle for bird populations. The uncertainty concerning the possible environmental impacts of offshore wind power is a barrier to its deployment and is likely to lead investors to demand risk premiums.
The German government funds research and development to assess and mitigate the environmental impact of offshore wind power.
Since 2002, the German Ministry for the Environment has funded the construction and maintenance of three research platforms in the North and Baltic Seas, one of them in proximity to Germany’s first offshore wind park. Among other things, the platforms were used for the scientific investigation of potential impacts of offshore wind turbines on marine mammals, seabirds, bird migration, the fauna of the seabed and fish populations.
Further research activities complemented the construction and operation of Germany’s first offshore wind park. Data on porpoises were collected before, during and after pile‐driving works by counting from ships in the area, from the air, as well as with underwater microphones. The test results will show the spatial and temporal effects that pile‐driving noise has on the animals. As part of the migratory bird projects, video cameras, thermal imaging equipment and radar devices are used to detect possible collisions with the rotor blades and to detect evasive movements.16
Administrative barriers
Renewable project developers need a large number of permits in Italy.
In Italy, the Autorizzazione Unica (AU) was conceived to provide a one‐stop‐shop agency that brings together all administrations involved in PV permitting. However, responsibilities still rested with separate administrations, and coordination between different bodies was required. A 2008 study found that no fewer than 50 different permits were required for renewable projects (Ecorys, 2008). In mid‐2010, the AU process was still seen as a major bottleneck in PV deployment, according to a study on barriers to PV deployment (PVLegal, 2010). Recently the Italian government has undertaken measures to resolve this problem, e.g. the Ministerial decree of 10 September 2010 and the decree DLgs. 28/2011.
Leaders in renewables deployment have streamlined permitting procedures (“one‐stop‐shop” approach).
In the case of small rooftop PV installations, waiting for permits can be a large part of the time required for project development. A study performed for the European Commission (Ecorys, 2008) obtained the results shown in Figure 3.2. At the time, Germany was the only country in the sample that had streamlined “one‐stop‐shop” permitting procedures. It is also the only country in the study where waiting for permits did not consume more than 50% of the total project development time.17
16 Further information is available online via www.alpha‐ventus.de. 17 Long waiting times may indicate an efficient system operating under a large number of requests, or an inefficient system under a normal load. However, given the very dynamic PV deployment in Germany in 2008, it is clear that mere pressure on administrations due to high deployment rates (as was the case in Spain) cannot explain long waiting times alone.
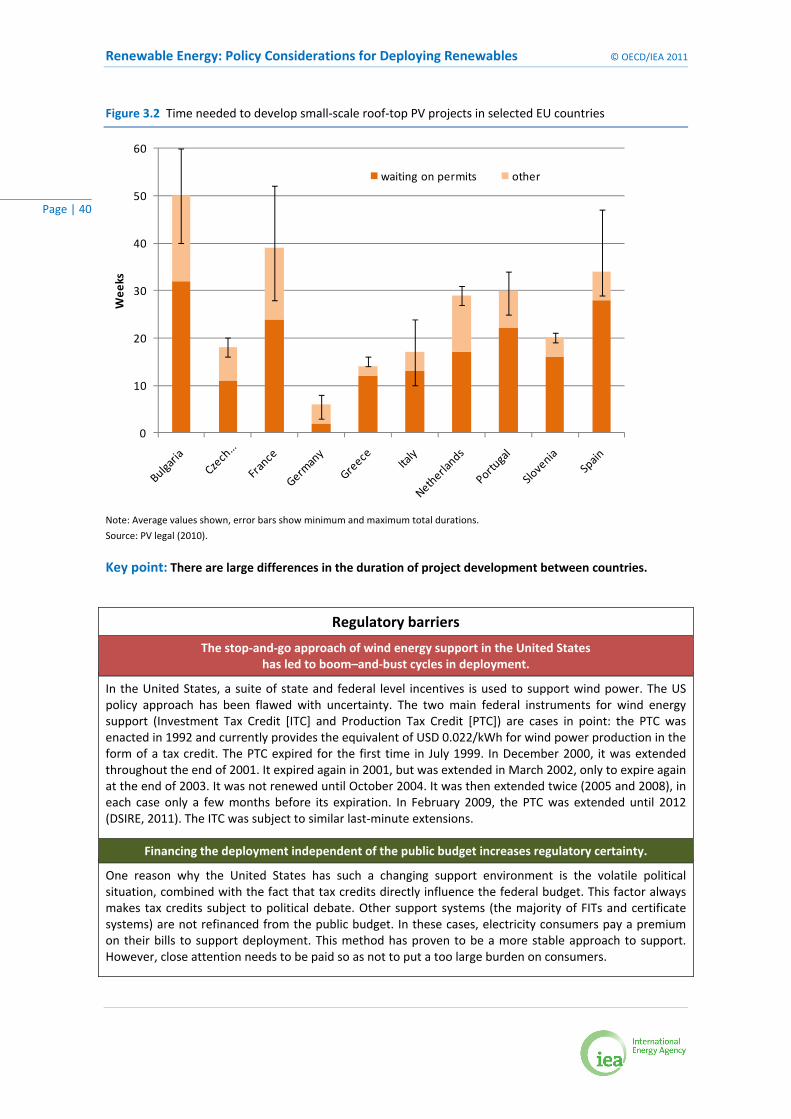
Renewable Energy: Policy Considerations for Deploying Renewables © OECD/IEA 2011
Page | 40
Figure 3.2 Time needed to develop small‐scale roof‐top PV projects in selected EU countries
Note: Average values shown, error bars show minimum and maximum total durations.
Source: PV legal (2010).
Key point: There are large differences in the duration of project development between countries.
Regulatory barriers
The stop‐and‐go approach of wind energy support in the United States has led to boom–and‐bust cycles in deployment.
In the United States, a suite of state and federal level incentives is used to support wind power. The US policy approach has been flawed with uncertainty. The two main federal instruments for wind energy support (Investment Tax Credit [ITC] and Production Tax Credit [PTC]) are cases in point: the PTC was enacted in 1992 and currently provides the equivalent of USD 0.022/kWh for wind power production in the form of a tax credit. The PTC expired for the first time in July 1999. In December 2000, it was extended throughout the end of 2001. It expired again in 2001, but was extended in March 2002, only to expire again at the end of 2003. It was not renewed until October 2004. It was then extended twice (2005 and 2008), in each case only a few months before its expiration. In February 2009, the PTC was extended until 2012 (DSIRE, 2011). The ITC was subject to similar last‐minute extensions.
Financing the deployment independent of the public budget increases regulatory certainty.
One reason why the United States has such a changing support environment is the volatile political situation, combined with the fact that tax credits directly influence the federal budget. This factor always makes tax credits subject to political debate. Other support systems (the majority of FITs and certificate systems) are not refinanced from the public budget. In these cases, electricity consumers pay a premium on their bills to support deployment. This method has proven to be a more stable approach to support. However, close attention needs to be paid so as not to put a too large burden on consumers.
0
10
20
30
40
50
60
Wee
ks
waiting on permits other

© OECD/IEA 2011 Renewable Energy: Policy Considerations for Deploying Renewables
Page | 41
Infrastructure barriers
Weak power grids are a bottleneck for Chinese wind power.
The government of China has put in place favourable policy and legislation that contribute to the fast growth of renewables. The Renewable Energy Law (National People‘s Congress, 2010) remains the most relevant to overall integration. Under this law, power grid operators are requested to “buy all the grid‐connected power produced with renewable energy within the coverage of their power grid, and provide grid connection service for the generation of power with renewable energy”. This should be achieved through grid connection agreements between grid operators and renewable power generation companies.
In reality, implementation of this specific clause has been inconsistent. When local grids are saturated, and cannot accommodate all the incoming electricity or easily transmit the electricity surplus through to adjacent grids, grid companies typically curtail electricity generated by wind farms. This practice reflects the fact that on‐grid prices for coal‐fired plants are lower than those for wind; as result, variable and more expensive wind power loses ground to the cheaper and more reliable electricity from coal plants. In addition to paying out more to bring wind power onto the grid, grid companies are forced to shoulder part of the costs of physically connecting the wind farms. Obviously, the grid companies have little incentive to integrate power sources that increase unpredictability and net variability of their power systems.
In Inner Mongolia, the speed and magnitude of mega wind farm construction leave little time for the grid to react to the sudden influx of variable electricity from one year to another. It is estimated that the total installed capacity doubled over the course of 2010 (pending release of official data). Insufficient interregional grid connection causes a substantial wind power bottleneck.
China has adapted legislation and made grid extension a priority.
In view of the above difficulties, a revised Renewable Energy Law took effect in April 2010. The revised law now obliges grid companies to guarantee the purchase of a minimum amount of electricity from renewable sources. The details of how this obligation can be achieved and what percentage of electricity from renewables is mandatory are still to be determined (January 2011).
In addition, the 12th Five‐Year Plan identifies grid expansion as a priority area of action. It aims to “accelerate the construction of outward power supply projects from large coal power, hydropower and wind power bases, and create some cross‐regional power transmission channels using advanced technologies. Complete 330 kV or above power transmission lines of 200 000 kilometres.”
Although China has started to tackle the issue as a priority, it remains to be seen whether curtailment and non‐connection of capacity will be eradicated.
Source: Cheung (2011) and National Development and Reform Commission (NDRC, 2011).
Public acceptance barriers
Wind power projects can face strong public opposition.
Although the public acceptance of RE technologies is generally very high, specific energy projects frequently experience local opposition, which is also known as the Not In My Backyard (NIMBY) phenomenon. Taking just two examples from a long list, the Canadian company TransCanada had to scale back plans to build a wind farm in Kibby Mountain, Maine, United States. The project faced significant public opposition, partially due to environmental concerns. In the Australian state of Victoria, concern over the threat that turbines could pose to the rare orange‐bellied parrot nearly defeated plans for a wind farm, the Bald Hills project, in 2006 (The Economist, 2010). Other reasons for public opposition are the aesthetic impacts of wind turbines and the resulting reduction in the value of neighbouring real estate.Strong public opposition can pose a significant threat to project success. Local governments are inclined to respond to public concerns, and this response can translate into delays for receiving permits or stop the project altogether.
Renewable Energy: Policy Considerations for Deploying Renewables © OECD/IEA 2011
Page | 42
Danish policies specifically target public acceptance of wind power.
Due to the massive deployment of wind energy in Denmark, public acceptance is an increasingly important issue. On 1 January 2009, the Promotion of Renewable Energy Act entered into force in Denmark. It contains four new schemes for the promotion of wind energy on land: compensation for lost value of property caused by new wind turbines, local citizens' option to purchase wind turbine shares, a green scheme to enhance local scenic and recreational value, and a guarantee fund to support financing of preliminary investigations.
The “loss of value scheme” clarifies what payments shall be made if real estate loses value due to the construction of a new wind turbine. It also requires offering at least 20% of the turbine’s ownership shares for sale to residents living 4.5 kilometres or less from the turbine. Under the legislation, the Minister for Climate and Energy also establishes a “green scheme”. Subsidies are granted to projects in the municipality that enhance the landscape and recreational opportunities, as well as to cultural and information activities. The more newly installed wind power capacity that a municipality has, the more funds it gets for such projects. Energinet.dk, which is responsible for operating the electricity grid in Denmark, is managing the scheme.
The price of policy risks: empirical evidence
The preceding paragraphs show how barriers and enablers can affect renewables deployment. The following section discusses a study that quantifies the cost of deployment barriers in selected emerging economies, where renewables are currently at the commercial deployment and mass deployment stages.
The non‐economic barriers discussed in the previous sections influence project developers and other stakeholders in their perceptions of the risks connected to developing and financing RES‐E installations (de Jager and Rathmann, 2008; Lamers, 2009).
The importance of non‐economic barriers to public and private renewable energy investment decisions, and of risk reductions through policy improvements, is highlighted in a study commissioned by the IEA and conducted by the Institute for Economy and the Environment (IEE, 2010),18 concentrating on wind and solar PV. Both RES‐E technologies have large future market potential in a large number of countries worldwide. As its geographical focus, the study investigated the policy frameworks for wind and solar PV investment in selected emerging economies (nearly all net fossil importers with low per capita GDP levels) with large market potential and high growth rates: Brazil, Chile, China, Egypt, India, Kenya, Morocco, Thailand, Tunisia and Vietnam. The countries are, with the exception of Egypt and Vietnam, net fossil‐fuel importers. The analysis shows that, in many emerging markets, legal issues and RE policy stability are the main barriers to the market penetration of renewables.
The study’s objective was to determine the cost of non‐economic and other market barriers and the resulting policy risk perception from an investor’s perspective. Such barriers include policy risks, including administrative hurdles, political instability and grid access.
The study was based on a country‐independent conception; i.e. the questions and choice tasks presented were not associated with any specific geography. The focus was rather on the general assessment of non‐economic barriers (e.g. grid access, administrative process, legal security) related to investments in wind energy and solar PV projects. In total, eight factors (or risk attributes), with four to six attribute levels, are included in the experimental design, based on the conducted expert interviews, analysis of relevant academic literature, and results of previous IEA 18 Using an online survey platform, choice experiments were performed with international wind and solar PV investors using conjoint analysis.
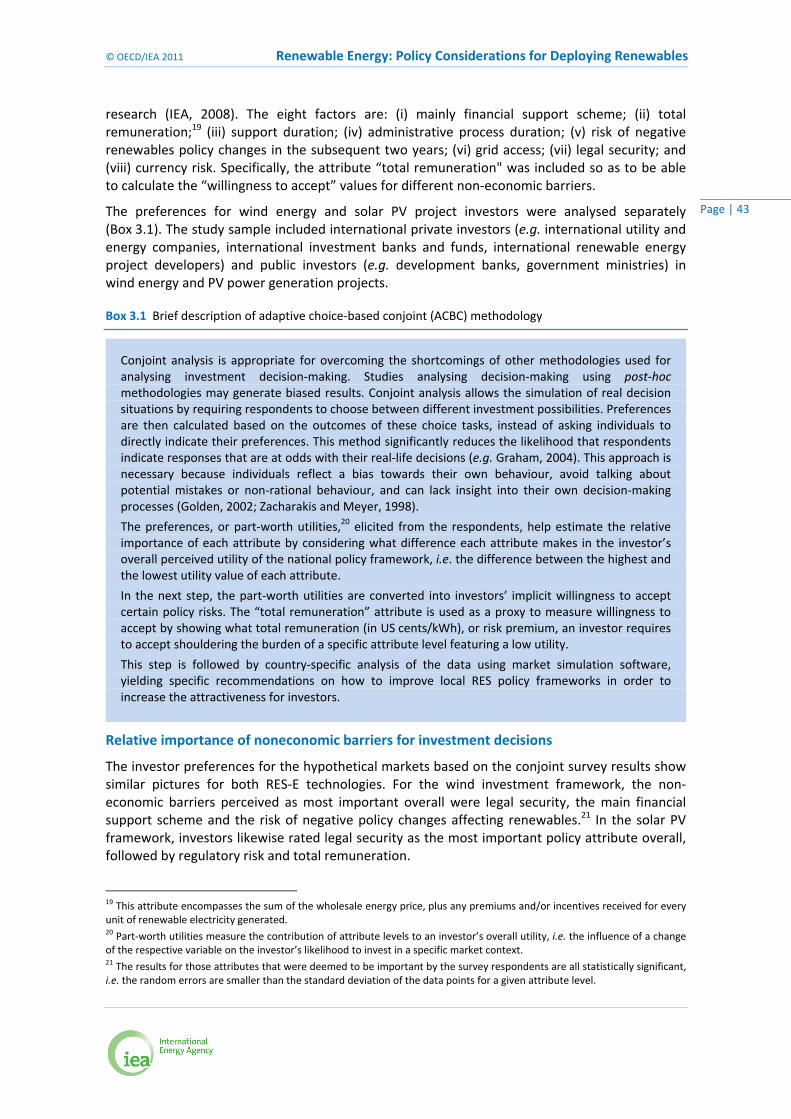
© OECD/IEA 2011 Renewable Energy: Policy Considerations for Deploying Renewables
Page | 43
research (IEA, 2008). The eight factors are: (i) mainly financial support scheme; (ii) total remuneration;19 (iii) support duration; (iv) administrative process duration; (v) risk of negative renewables policy changes in the subsequent two years; (vi) grid access; (vii) legal security; and (viii) currency risk. Specifically, the attribute “total remuneration" was included so as to be able to calculate the “willingness to accept” values for different non‐economic barriers.
The preferences for wind energy and solar PV project investors were analysed separately (Box 3.1). The study sample included international private investors (e.g. international utility and energy companies, international investment banks and funds, international renewable energy project developers) and public investors (e.g. development banks, government ministries) in wind energy and PV power generation projects.
Box 3.1 Brief description of adaptive choice‐based conjoint (ACBC) methodology
Relative importance of noneconomic barriers for investment decisions
The investor preferences for the hypothetical markets based on the conjoint survey results show similar pictures for both RES‐E technologies. For the wind investment framework, the non‐economic barriers perceived as most important overall were legal security, the main financial support scheme and the risk of negative policy changes affecting renewables.21 In the solar PV framework, investors likewise rated legal security as the most important policy attribute overall, followed by regulatory risk and total remuneration.
19 This attribute encompasses the sum of the wholesale energy price, plus any premiums and/or incentives received for every unit of renewable electricity generated. 20 Part‐worth utilities measure the contribution of attribute levels to an investor’s overall utility, i.e. the influence of a change of the respective variable on the investor’s likelihood to invest in a specific market context. 21 The results for those attributes that were deemed to be important by the survey respondents are all statistically significant, i.e. the random errors are smaller than the standard deviation of the data points for a given attribute level.
Conjoint analysis is appropriate for overcoming the shortcomings of other methodologies used for analysing investment decision‐making. Studies analysing decision‐making using post‐hoc methodologies may generate biased results. Conjoint analysis allows the simulation of real decision situations by requiring respondents to choose between different investment possibilities. Preferences are then calculated based on the outcomes of these choice tasks, instead of asking individuals to directly indicate their preferences. This method significantly reduces the likelihood that respondents indicate responses that are at odds with their real‐life decisions (e.g. Graham, 2004). This approach is necessary because individuals reflect a bias towards their own behaviour, avoid talking about potential mistakes or non‐rational behaviour, and can lack insight into their own decision‐making processes (Golden, 2002; Zacharakis and Meyer, 1998).
The preferences, or part‐worth utilities,20 elicited from the respondents, help estimate the relative importance of each attribute by considering what difference each attribute makes in the investor’s overall perceived utility of the national policy framework, i.e. the difference between the highest and the lowest utility value of each attribute.
In the next step, the part‐worth utilities are converted into investors’ implicit willingness to accept certain policy risks. The “total remuneration” attribute is used as a proxy to measure willingness to accept by showing what total remuneration (in US cents/kWh), or risk premium, an investor requires to accept shouldering the burden of a specific attribute level featuring a low utility.
This step is followed by country‐specific analysis of the data using market simulation software, yielding specific recommendations on how to improve local RES policy frameworks in order to increase the attractiveness for investors.
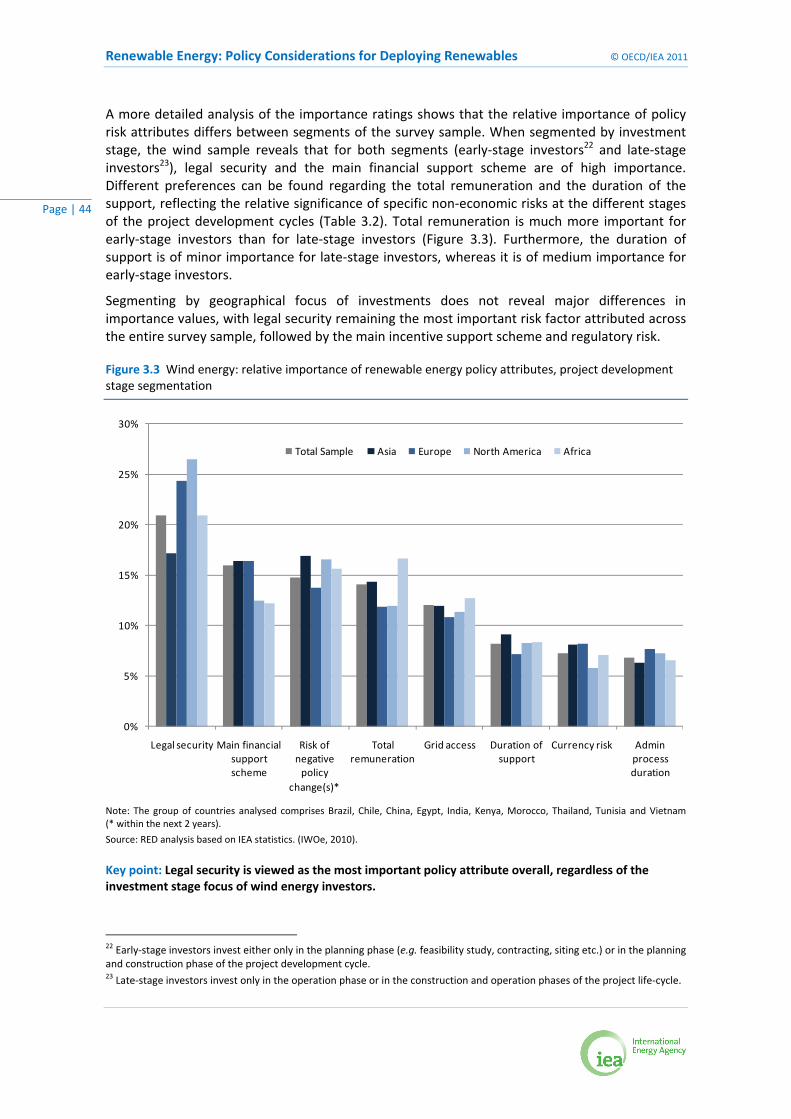
Renewable Energy: Policy Considerations for Deploying Renewables © OECD/IEA 2011
Page | 44
A more detailed analysis of the importance ratings shows that the relative importance of policy risk attributes differs between segments of the survey sample. When segmented by investment stage, the wind sample reveals that for both segments (early‐stage investors22 and late‐stage investors23), legal security and the main financial support scheme are of high importance. Different preferences can be found regarding the total remuneration and the duration of the support, reflecting the relative significance of specific non‐economic risks at the different stages of the project development cycles (Table 3.2). Total remuneration is much more important for early‐stage investors than for late‐stage investors (Figure 3.3). Furthermore, the duration of support is of minor importance for late‐stage investors, whereas it is of medium importance for early‐stage investors.
Segmenting by geographical focus of investments does not reveal major differences in importance values, with legal security remaining the most important risk factor attributed across the entire survey sample, followed by the main incentive support scheme and regulatory risk.
Figure 3.3 Wind energy: relative importance of renewable energy policy attributes, project development stage segmentation
Note: The group of countries analysed comprises Brazil, Chile, China, Egypt, India, Kenya, Morocco, Thailand, Tunisia and Vietnam (* within the next 2 years).
Source: RED analysis based on IEA statistics. (IWOe, 2010).
Key point: Legal security is viewed as the most important policy attribute overall, regardless of the investment stage focus of wind energy investors.
22 Early‐stage investors invest either only in the planning phase (e.g. feasibility study, contracting, siting etc.) or in the planning and construction phase of the project development cycle. 23 Late‐stage investors invest only in the operation phase or in the construction and operation phases of the project life‐cycle.
0%
5%
10%
15%
20%
25%
30%
Legal security Main financial support scheme
Risk of negative policy
change(s)*
Total remuneration
Grid access Duration of support
Currency risk Admin process duration
Total Sample Asia Europe North America Africa
© OECD/IEA 2011 Renewable Energy: Policy Considerations for Deploying Renewables
Page | 45
Investors’ willingness to accept non‐economic barriers
The measure of willingness to accept (WTA) shows what risk premium (in percentage terms) an individual investor requires or is “willing to accept” in return for shouldering the burden of a specific attribute level with a low utility. WTA is high for attribute levels that constitute high risk for investors and low for attribute levels that imply a lower risk. The highest WTA, or risk premium, is associated with the attribute or factor that is deemed to have the most significant impact.
For the interpretation of WTA, it is important to note that the relevant benchmarks are not the absolute percentage values but rather the differences between the percentage “risk premiums” for the attribute levels of the individual attributes or risk factors. The absolute percentage values do not reflect the risk premium for a specific country, because they derive from a range of attribute levels deemed to be realistic on average across the analysed group of countries rather than country‐specific value. More importantly, the percentage “risk premiums” of a change in attribute levels cannot be compared across attributes/risk factors due to the arbitrary origin of the scaling within each attribute.24
In the hypothetical wind energy market, the highest additional remuneration is required for very low legal security, followed by a high possibility of renewable energy policy risks (Figure 3.4). This reflects the fact that the attributes “legal security” and “risk of negative policy changes” are perceived as the most important of the attributes included in the IWOe study (Figure 3.3).
Country‐specific analyses were performed for all of the countries selected in the conjoint design study, whereby the information obtained from expert interviews was used to define and generate the national “base‐case scenarios”, i.e. the current state (as of mid‐2009) of the RES‐E policy frameworks for wind energy and solar PV within each country. The results of the sensitivity analysis performed for each of the selected countries corroborate the existence of deployment barriers.
24 As an example, a risk premium of 20 percentage points for one attribute is not equal to 20 of another attribute.
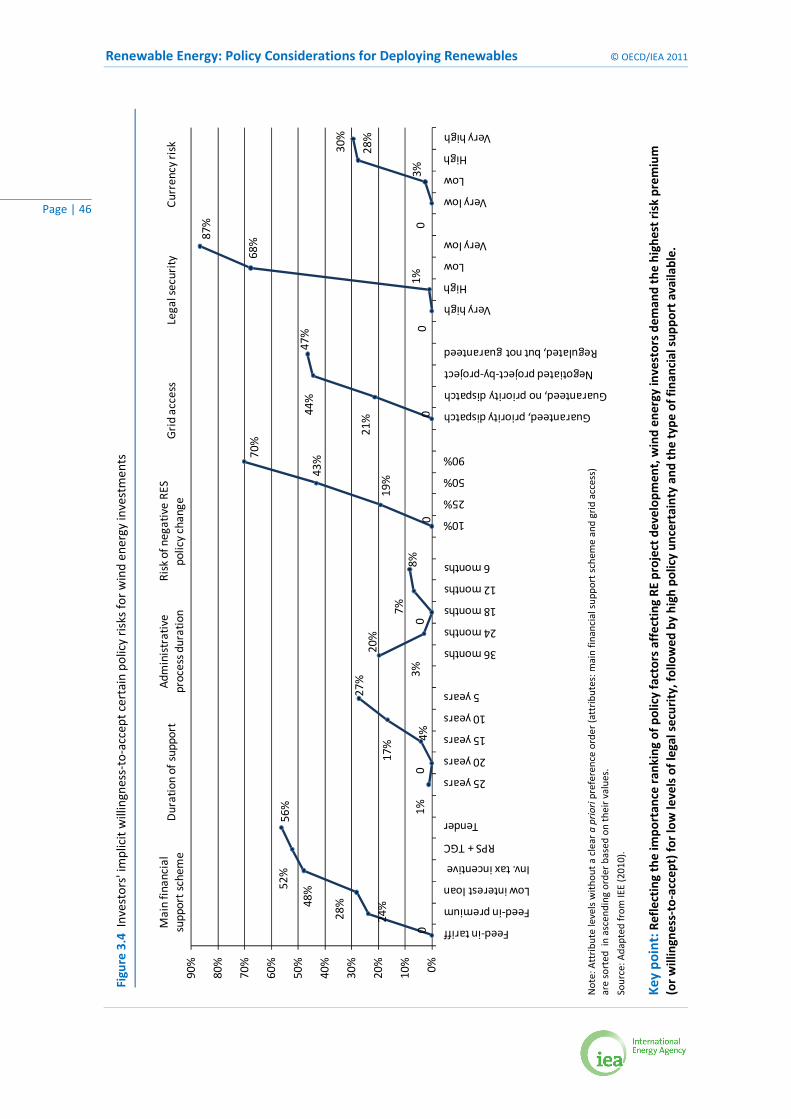
Renewable Energy: Policy Considerations for Deploying Renewables © OECD/IEA 2011
Page | 46
Figure 3.4 Investors' implicit willingness‐to‐accep
t certain policy risks for w
ind en
ergy investmen
ts
0
24%
28%48
%52%
56% 1%
04%
17%
27%
20%
3%0
7%8%
0
19%
43%70
%
0
21%
44%
47% 0
1%
68%87
% 03%
28%
30%
0%10%
20%
30%
40%
50%
60%
70%
80%
90%
Feed‐in tariff
Feed‐in premium
Low interest loan
Inv. tax incentive
RPS + TGC
Tender
25 years
20 years
15 years
10 years
5 years
36 months
24 months
18 months
12 months
6 months
10%
25%
50%
90%
Guaranteed, priority dispatch
Guaranteed, no priority dispatch
Negotiated project‐by‐project
Regulated, but not guaranteed
Very high
High
Low
Very low
Very low
Low
High
Very high
Main fin
ancial
support schem
e Duration of support
Administrative
process d
uration
Risk of negative RE
S policy change
Grid access
Legal security
Currency risk
Note: Attribu
te levels with
out a
clear a priori preference orde
r (attributes: m
ain fin
ancial sup
port schem
e and grid access)
are sorted
in ascend
ing orde
r based
on their v
alue
s.
Source: A
dapted
from
IEE (201
0).
Key po
int: Reflecting the im
portan
ce ran
king
of p
olicy factors affecting RE
project develop
men
t, wind en
ergy investors de
man
d the highest risk prem
ium
(or willingness‐to‐accep
t) fo
r low levels of legal security, fo
llowed
by high
policy un
certainty an
d the type
of finan
cial sup
port available.
© OECD/IEA 2011 Renewable Energy: Policy Considerations for Deploying Renewables
Page | 47
Dynamic aspects of deployment: the policy journey
The way in which deployment of renewables takes place over time has consequences for optimal policy interventions. Therefore, this section briefly presents and discusses the dynamics of technology deployment. As noted in the introduction to this chapter, the main aspects to consider when developing effective policies to promote RE deployment are:
• the maturity of a given energy technology;
• the maturity of the national market; and
• the state of the global market for the technology.
The two last issues are so closely connected that they are discussed together.
Energy technology maturity and market diffusion
Renewable energy technologies include a large number of different technical options, which are at very different stages of the development cycle. Hydropower and bioenergy are already major sources of energy worldwide. Many other options, although technically proven and available on commercial terms, still occupy only a fraction of their potential markets, and many opportunities remain to improve performance and reduce costs. Yet other technologies are only now reaching the demonstration stage.
Opening the way to deployment: the role of RD&D
Although the focus of this analysis is on effective strategies to overcome barriers to the widespread deployment of renewables, the combination of technology‐push and market‐pull support implemented in the earlier stages of the innovation chain also plays a crucial role in establishing the future deployment pathway. If hurdles encountered during the research and development (R&D) and demonstration phases are not overcome, the commercialisation of a RET (i.e. the transformation from technology development through product development to market development) is jeopardised and can, in certain circumstances, even fail.25
Significant challenges, mostly linked to a lack of joined‐up policies to reduce investor risk and the resulting funding gap, hamper the smooth and successful transition from demonstration to deployment for viable RETs. The absence of adequate financing means that the point at which innovative energy technologies might be deployed in the market and prove themselves on a large scale may be delayed or at worst fail, a phenomenon commonly termed the commercialisation “valley of death”. 26
Innovations in this phase bear high technology and market risks and costs, but lack sufficient funding due to the ambiguous juncture between clear technology‐push supports by governments and strong market‐pull forces from business. The public sector acts according to the common perception that it is responsible for early, high‐risk R&D after which the private sector will take over commercialisation. Unfortunately, as public funding decreases, the private sector is still
25 Ongoing IEA research on “accelerating energy technology innovation” analyses more broadly successful strategies to stimulate low‐carbon energy technology research, development and demonstration (RD&D). 26 Various technology transfer literatures point out the existence of another “valley of death” in earlier phases of innovation chain, namely between basic research (technology creation) and applied R&D and demonstration. In this case, funding dries up after the public sector has invested in R&D through public laboratories but before the technology concept has been demonstrated on a prototype scale and a corporate structure established. This lack of technology demonstration and corporate structure, in turn, hinders venture capital investors from engaging and playing their critical role in funding “early stage” or “growth stage” companies.

Renewable Energy: Policy Considerations for Deploying Renewables © OECD/IEA 2011
Page | 48
wary of investing its own capital (Murphy and Edwards, 2003) when technologies are at the early stage and technical and market risks are perceived to be high. Thus, neither public nor private finance mechanisms take the lead on necessary investments, leading to strong financial gaps, where many potential technology innovations are held up before reaching successful commercialisation. This lack of necessary funding or cash flow explains why this challenging phase is also termed the “cash flow valley of death”.
This issue is a particular problem for technologies that are not modular (such as solar photovoltaics or wind, where individual cells or turbines can be tested) but need to be developed at a large scale early on in the development cycle. In these cases, the commercial risk is seen as substantial, and the amount of funding needed to catalyse the projects exceeds that available within many national energy RD&D budgets. Examples include large‐scale demonstration of advanced biofuels production, and demonstration of offshore wind arrays and marine energy devices.
In these cases, innovative thinking is needed on how public and private funding mechanisms can be brought together to facilitate the necessary progress, perhaps via the development of risk loans.
Diffusion theory and three main deployment phases
The deployment of energy technologies can be understood in terms of market diffusion theory. This theory was originally applied to understand the dynamics with which a given market matures until it reaches its final market potential. Broadly speaking, this theory assumes that the market grows slowly initially, picks up speed with time and accelerates up to a certain peak, after which it starts slowing down again. Finally growth becomes slower and slower until the market eventually saturates. Plotting the total market size over time produces an S‐shaped curve (see e.g. UshaRao and Kishore, 2009).
Market diffusion theory has also been applied to the understanding of the deployment of energy technologies. If the evolution of wind power production for Denmark and for the world are plotted, the S‐shape of the evolution in Denmark can clearly be identified (Figure 3.5). The Danish market has reached most of its potential. On a global scale, the evolution is very different. Wind power has just entered the phase in which diffusion theory predicts the most rapid increase.
Deployment can be segmented into various phases. For the purpose of the current publication, we use the following categorisation of three phases:
• inception phase, when the first examples of a technology are deployed;
• take‐off phase, when the market grows rapidly, leading to widespread deployment; and
• market consolidation phase, where deployment grows towards the maximum practicable level.
Taking the Danish example, the inception phase can be observed up to 1995, the take‐off up to 2003, and the following years can be considered to belong to the consolidation phase. On a global level, wind power recently entered the take‐off phase. These two isolated observations can be generalised, and more broadly, the market status of selected energy technologies can be summarised (Table 3.1).
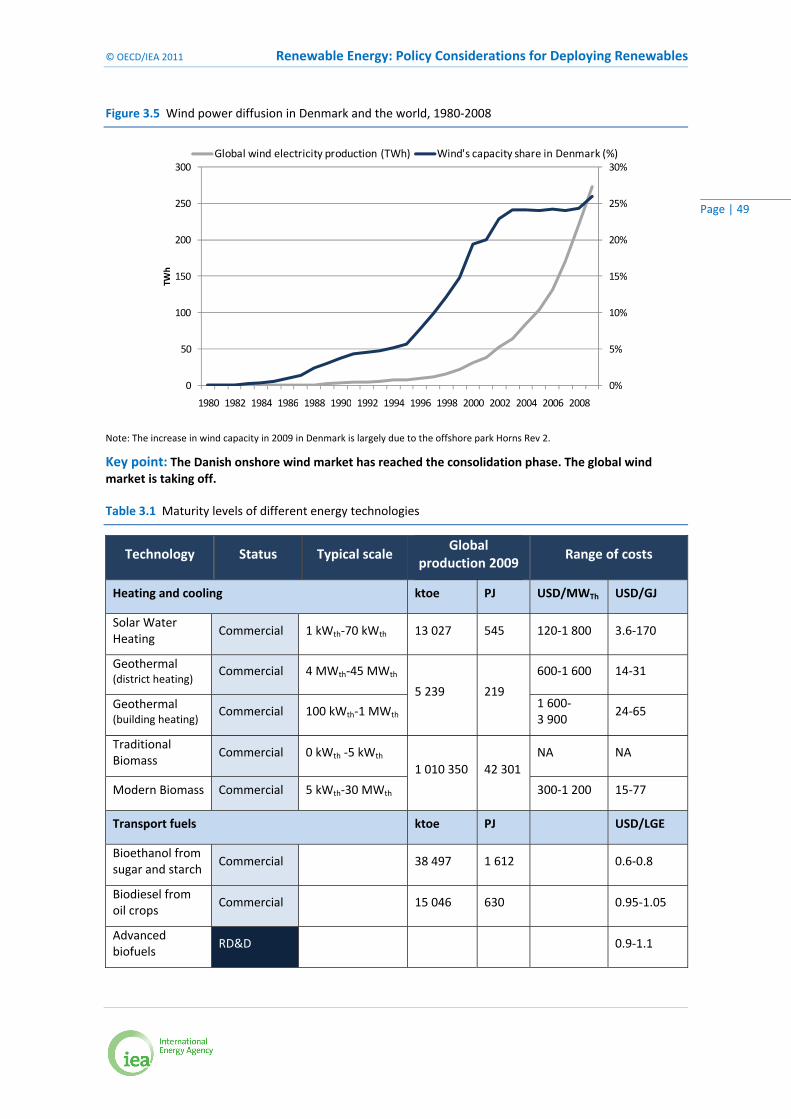
© OECD/IEA 2011 Renewable Energy: Policy Considerations for Deploying Renewables
Page | 49
Figure 3.5 Wind power diffusion in Denmark and the world, 1980‐2008
Note: The increase in wind capacity in 2009 in Denmark is largely due to the offshore park Horns Rev 2.
Key point: The Danish onshore wind market has reached the consolidation phase. The global wind market is taking off.
Table 3.1 Maturity levels of different energy technologies
0%
5%
10%
15%
20%
25%
30%
0
50
100
150
200
250
300
1980 1982 1984 1986 1988 1990 1992 1994 1996 1998 2000 2002 2004 2006 2008
TWh
Global wind electricity production (TWh) Wind's capacity share in Denmark (%)
Technology Status Typical scale Global
production 2009 Range of costs
Heating and cooling ktoe PJ USD/MWTh USD/GJ
Solar Water Heating
Commercial 1 kWth‐70 kWth 13 027 545 120‐1 800 3.6‐170
Geothermal (district heating)
Commercial 4 MWth‐45 MWth
5 239 219
600‐1 600 14‐31
Geothermal (building heating)
Commercial 100 kWth‐1 MWth 1 600‐3 900
24‐65
Traditional Biomass
Commercial 0 kWth ‐5 kWth 1 010 350 42 301
NA NA
Modern Biomass Commercial 5 kWth‐30 MWth 300‐1 200 15‐77
Transport fuels ktoe PJ USD/LGE
Bioethanol from sugar and starch
Commercial 38 497 1 612 0.6‐0.8
Biodiesel from oil crops
Commercial 15 046 630 0.95‐1.05
Advanced biofuels
RD&D 0.9‐1.1
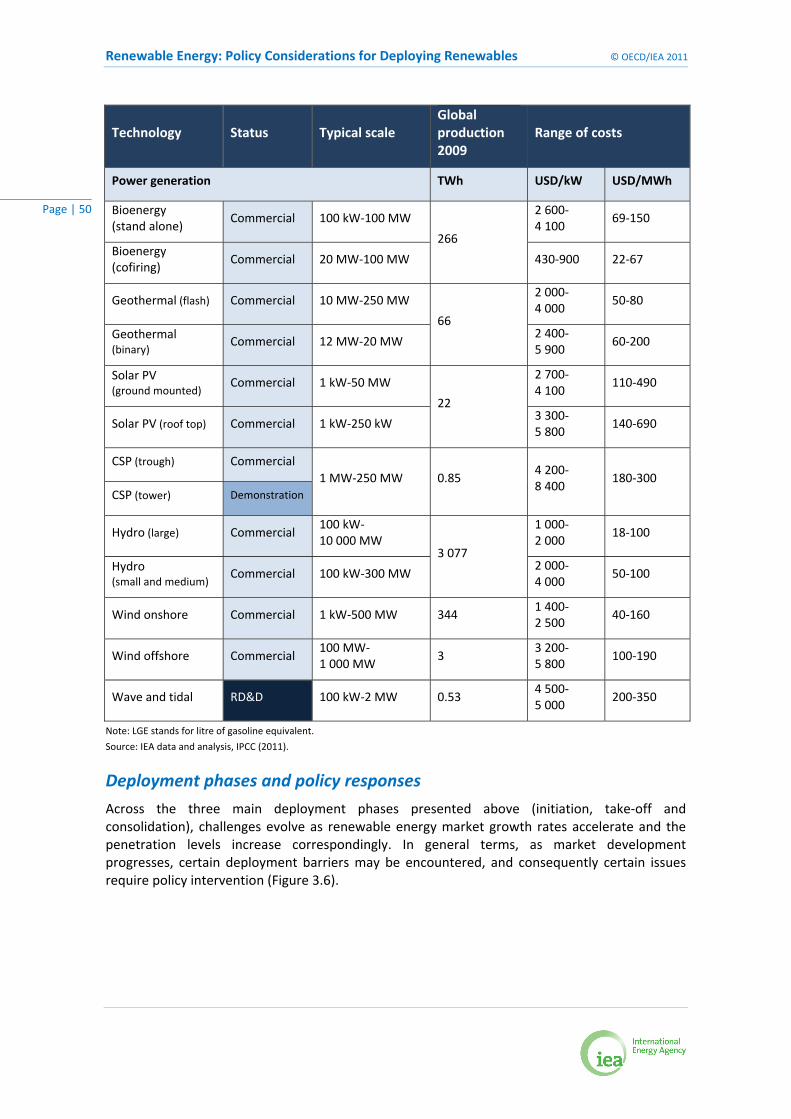
Renewable Energy: Policy Considerations for Deploying Renewables © OECD/IEA 2011
Page | 50
Technology Status Typical scale Global production 2009
Range of costs
Power generation TWh USD/kW USD/MWh
Bioenergy (stand alone)
Commercial 100 kW‐100 MW
266
2 600‐4 100
69‐150
Bioenergy (cofiring)
Commercial 20 MW‐100 MW 430‐900 22‐67
Geothermal (flash) Commercial 10 MW‐250 MW
66
2 000‐4 000
50‐80
Geothermal (binary)
Commercial 12 MW‐20 MW 2 400‐5 900
60‐200
Solar PV (ground mounted)
Commercial 1 kW‐50 MW
22
2 700‐4 100
110‐490
Solar PV (roof top) Commercial 1 kW‐250 kW 3 300‐5 800
140‐690
CSP (trough) Commercial 1 MW‐250 MW 0.85
4 200‐ 8 400
180‐300 CSP (tower) Demonstration
Hydro (large) Commercial 100 kW‐10 000 MW
3 077
1 000‐ 2 000
18‐100
Hydro (small and medium)
Commercial 100 kW‐300 MW 2 000‐ 4 000
50‐100
Wind onshore Commercial 1 kW‐500 MW 344 1 400‐ 2 500
40‐160
Wind offshore Commercial 100 MW‐1 000 MW
3 3 200‐5 800
100‐190
Wave and tidal RD&D 100 kW‐2 MW 0.53 4 500‐ 5 000
200‐350
Note: LGE stands for litre of gasoline equivalent.
Source: IEA data and analysis, IPCC (2011).
Deployment phases and policy responses
Across the three main deployment phases presented above (initiation, take‐off and consolidation), challenges evolve as renewable energy market growth rates accelerate and the penetration levels increase correspondingly. In general terms, as market development progresses, certain deployment barriers may be encountered, and consequently certain issues require policy intervention (Figure 3.6).

© OECD/IEA 2011 Renewable Energy: Policy Considerations for Deploying Renewables
Page | 51
Figure 3.6 Issues to tackle as a function of deployment phase
Note: The cell shading reflects the relative significance of individual issue along the deployment path. Light shading suggests that intervention is required but not with the highest possible priority. Dark shading indicates high significance of the respective intervention.
Key point: Policy priorities change as deployment levels increase.
During the inception phase, challenges that can have a significant impact include:
• establishing the costs and potential of the technology so as to be able to set targets in an informed way;
• establishing the feasibility and credibility of deploying the technology via pilot or demonstration plants;
• ensuring that grid or market access can be achieved;
• developing the institutional capacity required to manage and monitor deployment (e.g. permitting issues);
• establishing a supply chain capability (including local installers, maintenance contractors, etc.); and
• identifying and tackling other institutional barriers to initial deployment.
Market and operating regulation adaptation
Inception Take-off Consolidation
Supporting technologies (e.g. power grids)
Manage growth and policy cost
Public acceptance
Economic deployment support for mass market
Priority market access
Supply chain development
Financing
Targets
Initial plants / large-scaledemonstration Institutional and human capacity buildingResource/cost, technologyportfolio assessment
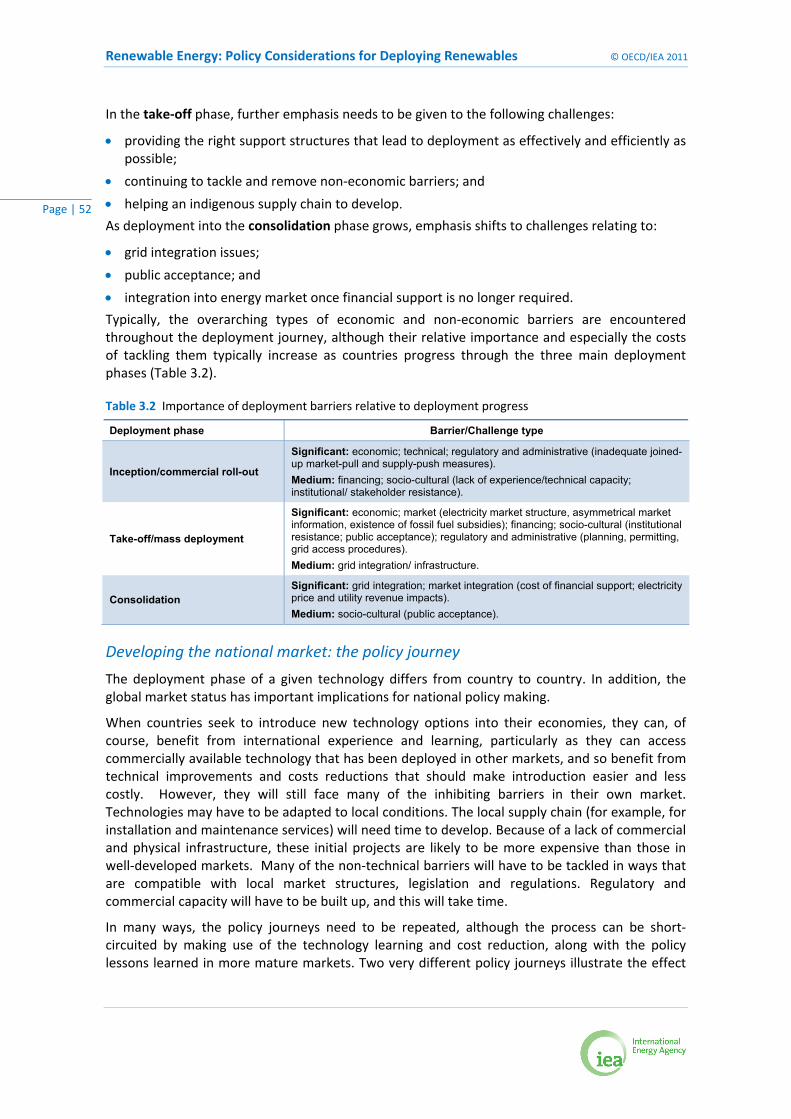
Renewable Energy: Policy Considerations for Deploying Renewables © OECD/IEA 2011
Page | 52
In the take‐off phase, further emphasis needs to be given to the following challenges:
• providing the right support structures that lead to deployment as effectively and efficiently as possible;
• continuing to tackle and remove non‐economic barriers; and
• helping an indigenous supply chain to develop. As deployment into the consolidation phase grows, emphasis shifts to challenges relating to:
• grid integration issues;
• public acceptance; and
• integration into energy market once financial support is no longer required.
Typically, the overarching types of economic and non‐economic barriers are encountered throughout the deployment journey, although their relative importance and especially the costs of tackling them typically increase as countries progress through the three main deployment phases (Table 3.2).
Table 3.2 Importance of deployment barriers relative to deployment progress
Deployment phase Barrier/Challenge type
Inception/commercial roll-out
Significant: economic; technical; regulatory and administrative (inadequate joined-up market-pull and supply-push measures). Medium: financing; socio-cultural (lack of experience/technical capacity; institutional/ stakeholder resistance).
Take-off/mass deployment
Significant: economic; market (electricity market structure, asymmetrical market information, existence of fossil fuel subsidies); financing; socio-cultural (institutional resistance; public acceptance); regulatory and administrative (planning, permitting, grid access procedures). Medium: grid integration/ infrastructure.
Consolidation Significant: grid integration; market integration (cost of financial support; electricity price and utility revenue impacts). Medium: socio-cultural (public acceptance).
Developing the national market: the policy journey
The deployment phase of a given technology differs from country to country. In addition, the global market status has important implications for national policy making.
When countries seek to introduce new technology options into their economies, they can, of course, benefit from international experience and learning, particularly as they can access commercially available technology that has been deployed in other markets, and so benefit from technical improvements and costs reductions that should make introduction easier and less costly. However, they will still face many of the inhibiting barriers in their own market. Technologies may have to be adapted to local conditions. The local supply chain (for example, for installation and maintenance services) will need time to develop. Because of a lack of commercial and physical infrastructure, these initial projects are likely to be more expensive than those in well‐developed markets. Many of the non‐technical barriers will have to be tackled in ways that are compatible with local market structures, legislation and regulations. Regulatory and commercial capacity will have to be built up, and this will take time.
In many ways, the policy journeys need to be repeated, although the process can be short‐circuited by making use of the technology learning and cost reduction, along with the policy lessons learned in more mature markets. Two very different policy journeys illustrate the effect
© OECD/IEA 2011 Renewable Energy: Policy Considerations for Deploying Renewables
Page | 53
of the global market status: onshore wind in China and solar PV support in Germany. In China, existing experience led to accelerated deployment and a different policy approach. In Germany, the technology had to be developed, because no large global market was present yet (Box 3.2). One important difference between the two approaches is the speed at which large deployment volumes became possible. This point may seem obvious, but one can speculate that it took Chinese regulators by surprise. One hint that this may be true is the fact that the grid extension to connect all the new wind turbines was not realised at a sufficient speed.27
Box 3.2 Solar PV deployment in Germany: developing a technology from demonstration to mass market
Solar PV in Germany has experienced an enormous boost in the past two decades, the annually installed capacity having increased from less than 1 MW in 1990 to 7.4 MW in 2010,28 i.e. a total capacity of about 17.3 GW by the end of 2010. It can be very instructive, therefore, to have a look at the key policy mechanisms and programmes that led to the boost in solar PV deployment in Germany.
The 1 MW of solar PV installed in 1990 were mainly relatively large R&D plants. Before 1990, few small grid‐connected PV facilities on private buildings existed (Hoffmann, 2008; BMU, 2009). An important demonstration step to bring forward the small‐scale concept was the 1 000 Roofs Programme (1 000‐Dächer‐Programm) started in 1990, which provided investment subsidies for grid‐integrated PV installations on roofs of detached or semidetached houses. The programme was introduced to evaluate the state of the technology at that time and to determine the further needs of development. Within the 1 000 Roofs Programme, up to 70% of a solar PV builder’s costs were refunded by the state. However, by then, the average costs were about EUR 12 400/kWp, and the operators made an average contribution of about EUR 10 000 to the costs. Nevertheless, almost 2 000 solar PV installations were built between 1991 and 1995 until the 1 000 Roofs Programme expired in 1995. Programme participants had to send quarterly statistics on the electricity generation from their installations to the Fraunhofer Institute for Solar Energy Systems (ISE). What was crucial about the 1 000 Roofs Programme was that it was closely related to a research programme that was intended to evaluate the experience gained on the operating behaviour of small grid‐connected solar PV systems and to optimise the technology. Besides its benefits for R&D, the 1 000 Roofs Programme paved the way for larger‐scale deployment. The programme was gradually scaled up with a follow‐up programme, aimed at mass demonstration: the 100 000 Roofs Programme, and further market growth was then ensured with cost‐covering remuneration (see below).
However, although German PV support may look like a continuous success story, it also experienced intervals of regression. After the 1 000 Roofs Programme expired in 1995, the only national support measure for solar PV was contained in the Electricity Feed‐in Law (StrEG), enacted in 1991, which had been designed for hydro and wind power. The remuneration guaranteed by the law for solar PV stood at EUR 0.085/kWh, which was insignificant compared with solar PV generation costs of about EUR 0.90/kWh. In the absence of any federal investment or financing support at the time, these incentives were insufficient to drive deployment of solar PV.
Nevertheless, by guaranteeing grid connection and feed‐in, the introduction of the feed‐in system was a major milestone and provided support for PV. Only a few German towns, among them Aachen, had already introduced cost‐covering feed‐in tariffs for solar electricity on the municipal level in the beginning of the 1990s. This remuneration system, referred to as the Aachen model, already contained the key issues that later led to the success of the German Renewable Energy Act (Erneuerbare‐Energien‐Gesetz, or EEG). On one side, the Aachen model addressed non‐economic issues by ensuring grid access to the operators and guaranteeing priority dispatching. On the other
27 One may argue that the main goal of the Chinese policy was to develop the domestic manufacturing industry. Although this is certainly one main motivation of the Chinese policy approach, the country’s great need for power makes it seem unlikely that policy makers would deliberately leave turbines unconnected. 28 According to the Bundesnetzagentur, BMU.
Renewable Energy: Policy Considerations for Deploying Renewables © OECD/IEA 2011
Page | 54
side, it offered reliable cost‐covering economic support by guaranteeing a fixed feed‐in tariff for a defined period of time, sharing extra costs among all electricity customers. This municipal model also had an important pioneer role, because it showed that a larger share of the public was prepared to install PV systems under proper economic conditions.
On a national level, however, it was only in 1999, after a political power change in 1998, that a new and more appropriate financing and support scheme for solar PV was introduced: The 100 000 Roofs Programme provided low‐interest loans from the German state bank Kreditanstalt für Wiederaufbau (KfW) and an investment grant of 10%, which in total amounted in an allowance of about 35% of the investment costs. However, it was only in combination with the EEG, which was enacted in 2000, with a guaranteed feed‐in tariff of EUR 0.506/kWh for small rooftop PV systems, that the remuneration for solar electricity nearly covered costs and the breakthrough succeeded
An important intermediate step preceding the introduction of the EEG had been the liberalisation of the electricity market and the Energy Industry Law (EnWG) of 1998 that guaranteed grid access to individual power producers (IPPs).
This support led to a considerable growth of annually installed capacity, so that the total cap of 300 MW fixed in the EEG of 2000 was reached in less than three years and was thus augmented to 1 GW in 2002. In 2003, however, the 100 000 Roofs Programme ended, and the EEG had to be revised to prevent a rapid market decline. This revision led to the first federal law with cost‐covering feed‐in tariffs for solar PV in 2004. Additionally, the KfW offered a soft loan programme for small‐scale solar PV installations to ensure financing possibilities beyond the 100 000 Roofs Programme. This loan programme induced an even more significant market boost.
In 2008, the EEG was revised in the normal schedule. The tariffs were reduced moderately. In 2009, the solar industry experienced production overcapacities. One reason was the abrupt cut of the feed‐in tariff system in Spain beginning of 2009. This was followed by a price drop of 30% in the first six months of 2009. The resulting market explosion of solar PV in 2009 and 2010, as well as falling electricity prices, was the main driver for the rise in the contribution to the cost sharing among the electricity consumer, the EEG Apportionment (EEG Umlage), by almost 75% to EUR 0.0353/kWh (SRU, 2011). Unscheduled yearly cuts have, therefore, become necessary in the past year. The tariffs were reduced from 2008 to 2011 by 40%. The drastic increase of solar PV capacity is a challenge for grid integration, requiring technical standards to be adjusted and local grids to be enlarged. The EEG of 2011 is tackling these issues. Research programmes on grid integration of PV exist, e.g. at the Fraunhofer Institute IWES (Braun, 2010).
In 2007, it was decided that large electricity consumers would be exempt from the cost sharing. They pay only EUR 0.0005/kWh for the EEG cost sharing. However, this exception does not sufficiently take into account the lowering of the average market price for electricity due to the priority feed‐in of renewables and the merit‐order effect. In the end, therefore, according to market analyses, large electricity consumers pay less than they would without the EEG (Sensfuß et al., 2007). Besides the wealth transfer effects from utilities to large electricity consumers (merit‐order effect), the implementation of FITs may also lead to a redistribution from poorer parts of the society to the middle class. A large number of solar PV installations are on rooftops. These systems generate returns for the house owners. However, all consumers pay the EEG surcharge per kWh. Because less wealthy parts of society spend a larger share of their income on electricity, they are, in effect, subsidising the revenues of small PV plant owners.
On a societal level, this arrangement may still be more efficient than having utilities install PV plants, because homeowners generally have much lower revenue expectations.
From the point of view of institutional responsibility, in 2000, the Federal Clearing Centre was founded for the clearing of technical and economical differences concerning EEG. In 2004, in the context of the EEG revision, it was succeeded by the EEG Clearing Centre, which had a much wider mandate, including all issues concerning the EEG. Moreover, in 2009, all KfW soft loan programmes for different renewable energy technologies were bundled to form a single Renewable Energy Programme (KfW, 2011), significantly simplifying financing procedures.
© OECD/IEA 2011 Renewable Energy: Policy Considerations for Deploying Renewables
Page | 55
Nevertheless, despite the several issues that need to be revised, the German solar PV support is a story of success. It led to a 4 000‐fold growth of installed capacity within two decades, which was the main driver for the fall of the costs of solar PV installations worldwide. What were the crucial steps that led to this success?
The 1 000 Roofs Programme was very important for demonstration purposes and was closely related to a research programme in order to monitor the state of technology and to evaluate the experience gained on the operating behaviour of small grid‐connected solar PV systems. This pilot project already involved individual households and provided some economic support, establishing the basis for the future step to widespread deployment. This step was succeeded by the investment supports and financing within the 100 000 Roofs Programme. A crucial step to ensure further market growth then was to introduce, with the EEG, a transparent, reliable and cost‐covering feed‐in law with guaranteed grid access and priority dispatching. It was crucial to guarantee cost‐covering tariffs at a fixed level and for a determined period of time, as was the idea of cost‐sharing among all electricity consumers. The EEG thus combined economic with non‐economic support, while setting clear deployment targets and creating well‐defined institutional responsibilities with the EEG Clearing Centre.
It was also important that the financing offered by the 100 000 Roofs Programme was steadily continued with loan‐softening programs by the KfW after the programme had expired. Moreover, the bundling of all financing programmes for renewable energy was a considerable procedural facilitation.
Furthermore, it was crucial that the support programmes had clearly defined and understandable targets (already due to the catchy naming), contributing to public acceptance and to adequate capacity building. The stepwise scaling up of support programs and the targets at which they aimed allowed gradually building up a sufficient amount of skilled labour and institutional capacity.
It should also be mentioned that Germany encountered positive pre‐conditions concerning different issues that have to be taken into account during the different phases of market deployment. With a recently established Federal Ministry for the Environment (founded in 1986), staffed by young officials and a strong administration, the institutional capacity could be built up relatively easily. Germany might also face fewer public acceptance problems, because nuclear energy encounters relatively strong public opposition.
The high costs that have arisen due to the high remuneration and the subsequent market explosion, however, threaten public acceptance and need to be brought under control. In principle, a feed‐in tariff, as offered by the EEG, can be very adequate to guide transition to an economically sustainable system, when tariffs are adapted quickly enough to follow the cost development. This is the most important challenge to date, and must be met if solar PV in Germany is to remain a success story.

Renewable Energy: Policy Considerations for Deploying Renewables © OECD/IEA 2011
Page | 56
Topical Highlight: Accelerating Diffusion of Renewables in Developing Countries
Introduction
The global challenge of stabilising greenhouse gas (GHG) concentration on a level that prevents dangerous climate change demands that non‐OECD countries address this issue, because the economies of those countries will rapidly grow within the next decades. They will, therefore, need to deploy a large amount of low‐carbon technologies. This is true not only for the largest emerging economies, such as China, where trade and foreign direct investment (FDI) or even domestic capital are sufficient to drive substantial deployment of renewable energy technologies (RETs). RET diffusion also needs to be facilitated and expanded in less advanced developing countries.29
RETs in developing countries have the potential to help achieve the most important energy challenges in these countries: extending access to affordable, reliable and clean energy to the 1.5 billion people in rural areas who do not have grid access; enabling energy independence and security; and reducing specific CO2 emissions. While developing countries are aiming for economic growth and social progress, they are also highly exposed to climate change risks. RET deployment in these countries has the potential to enhance economic and social development and, at the same time, reduce the effects of climate change. Domestic financial and technological resources and capacity, however, are generally lacking, and, even where RETs might be cost‐competitive with conventional alternatives, significant economic and non‐economic barriers to deployment and investment are present. Well‐designed and coordinated support is, therefore, needed to address the non‐economic barriers, strengthen local technological capabilities and capacity‐building, and boost the interplay of official development assistance (ODA) and FDI to create enabling conditions for deployment and to allow the poorest developing countries to exploit their RET potential.
This topical highlight describes the main types of barriers encountered in developing countries and identifies appropriate options for support mechanisms and finance sources for the deployment of RETs. Because RETs are cost‐competitive for off‐ and mini‐grid applications, they offer an enormous potential for reducing poverty by providing remote areas with clean energy access and, concurrently, reducing carbon emissions with relatively low additional or even negative costs. Thus, this topical highlight places special focus on support mechanisms and financing options for decentralised renewable energy applications.
29 Although no internationally recognised definition of “developing countries” exists, the term is generally used to describe countries with material well‐being levels lower than those of developed countries and countries in transition. But levels of development vary widely within the group of “developing countries”, which are, therefore, sometimes differentiated further into smaller groupings, e.g. the least developed countries (LDCs) and the “emerging economies” (BRICS and others). In this section, we focus on less advanced developing countries with low FDI levels, not on the emerging economies, where the deployment of renewable energy technologies may not have progressed very far but technology diffusion is significantly enhanced by FDI and trade.
© OECD/IEA 2011 Renewable Energy: Policy Considerations for Deploying Renewables
Page | 57
Main barriers
Although RETs have an enormous potential to reduce the CO2 emissions of developing countries and to alleviate poverty by extending energy access to remote areas, their deployment in the developing world faces severe economic as well as non‐economic barriers. Most obviously, these countries face a lack of capital to finance deployment locally and a lack of trade and FDI to accelerate diffusion with foreign capital. In contrast, ODA levels for the financing of low‐carbon technologies in developing countries are considerable, exceeding USD 5 billion per year (IEA, 2010b). A number of non‐economic barriers, however, can prevent project makers, as well as investors, from spending their efforts on projects in poorly developed countries. These barriers are very different depending on the country context, the specific technology and the application, e.g. whether grid‐connected or decentralised.
In terms of project development, barriers can include a deficient regulatory structure, a lack of clear legal framework in the country or region, and a lack of experience with incentivising policies such as feed‐in tariffs (FITs). Technical concerns can also be a significant barrier for project developers, such as grid integration constraints, the lack of local technological expertise to install or maintain facilities, and a deficient assessment of available renewable resources (GTZ, 2009a, 2009b). Obtaining financing is, of course, decisive for a project developer. This raises the question whether the technology is cost‐competitive in the context of the project, and if not, whether adequate, transparent and certain incentives are in place and how these incentives are financed. In many countries, subsidies for fossil fuels distort the market and undermine the cost‐competitiveness of RETs. Existing fossil fuel subsidies, therefore, need to be redirected in favour of support for renewables and energy efficiency.
But even if cost‐competitiveness or adequate incentives allowed a project to be profitable in principle, significant barriers and investor risk perceptions generally remain. These barriers can include a lack of policy and technology expertise on the part of governments, local authorities and local banks or the level of technical assistance to support them, the creditworthiness of the project partners (project developers, utilities or sources of incentive payments), and political or currency risks due to possible government or system instability and corruption. In this way, non‐economic barriers can also translate into economic barriers, as certain perceived risks can cause investors to request higher returns. Programmes should, therefore, try to mitigate risks, e.g. by covering the different kinds of risks present in the country and the project context.
The availability of financing will, of course, also depend on the existence of well‐developed projects, which would have needed funding earlier for the development phase. In this way, the project developers’ demand for finance and the finance supply side are interdependent. Programmes that aim at accelerating the diffusion of RETs in developing countries should target both the supply and demand sides of financing (DB Climate Change Advisors, 2010) (Figure 4.1).
It is important, therefore, not only to find the means to make RET projects in developing countries profitable, where they are not already cost‐competitive, through incentives carried by ODA or other sources. Programmes should also aim at reducing non‐economic barriers to foster enabling conditions for both investors and project developers.
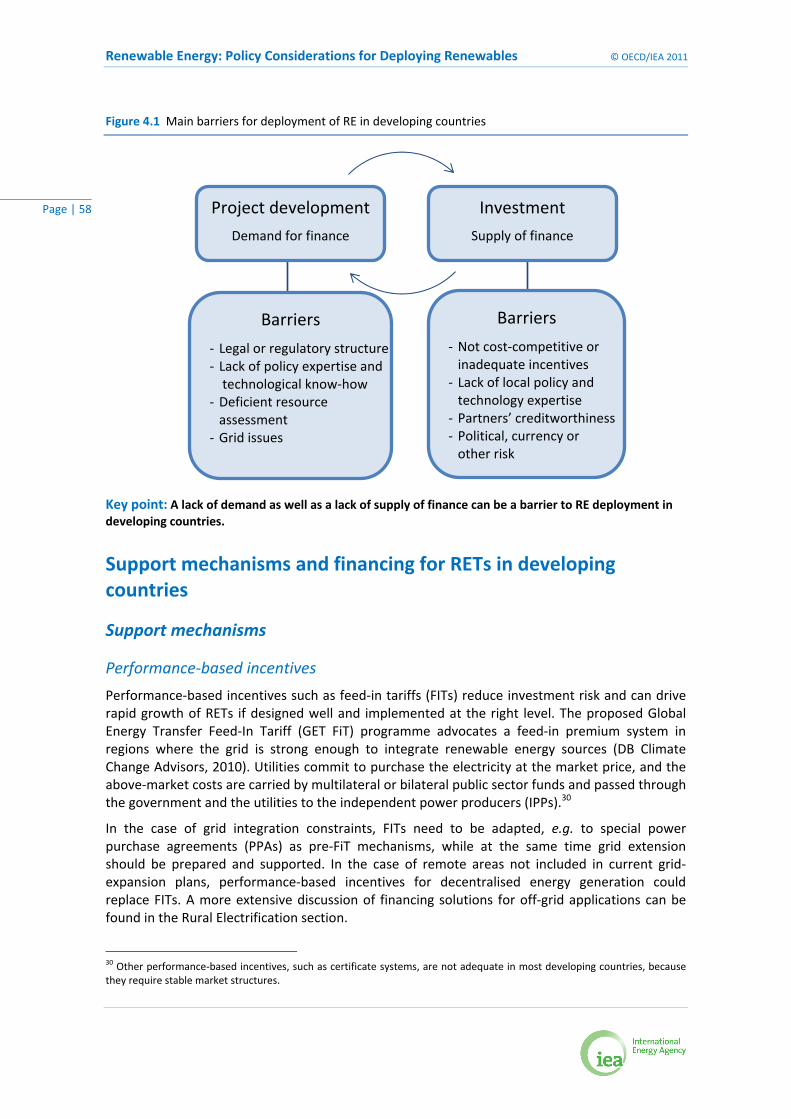
Renewable Energy: Policy Considerations for Deploying Renewables © OECD/IEA 2011
Page | 58
Figure 4.1 Main barriers for deployment of RE in developing countries
Key point: A lack of demand as well as a lack of supply of finance can be a barrier to RE deployment in developing countries.
Support mechanisms and financing for RETs in developing countries
Support mechanisms
Performance‐based incentives
Performance‐based incentives such as feed‐in tariffs (FITs) reduce investment risk and can drive rapid growth of RETs if designed well and implemented at the right level. The proposed Global Energy Transfer Feed‐In Tariff (GET FiT) programme advocates a feed‐in premium system in regions where the grid is strong enough to integrate renewable energy sources (DB Climate Change Advisors, 2010). Utilities commit to purchase the electricity at the market price, and the above‐market costs are carried by multilateral or bilateral public sector funds and passed through the government and the utilities to the independent power producers (IPPs).30
In the case of grid integration constraints, FITs need to be adapted, e.g. to special power purchase agreements (PPAs) as pre‐FiT mechanisms, while at the same time grid extension should be prepared and supported. In the case of remote areas not included in current grid‐expansion plans, performance‐based incentives for decentralised energy generation could replace FITs. A more extensive discussion of financing solutions for off‐grid applications can be found in the Rural Electrification section.
30 Other performance‐based incentives, such as certificate systems, are not adequate in most developing countries, because they require stable market structures.
Barriers
‐ Legal or regulatory structure‐ Lack of policy expertise and technological know‐how
‐ Deficient resource assessment
‐ Grid issues
Barriers
‐ Not cost‐competitive or inadequate incentives
‐ Lack of local policy and technology expertise
‐ Partners’ creditworthiness ‐ Political, currency or other risk
Project development
Demand for finance
Investment
Supply of finance
© OECD/IEA 2011 Renewable Energy: Policy Considerations for Deploying Renewables
Page | 59
Risk insurance
Most developing countries run a relatively high risk for political, economic or currency system instability; creditworthiness of project partners is also often doubtful. Therefore, in addition to direct financial support, policy makers need to reduce the various risks of renewable energy projects in these countries through international private and public insurances in order to improve credit conditions and attract private investment.
Loan softening and guarantees
Similarly, loan‐softening programmes and loan guarantees, or reassuring of guarantees given by the local governments, reduce the costs of private lending and thus improve the project economics.
Incubators
Over 160 so called incubators are working worldwide. They focus on commercialising clean energy technologies (WEF 2010), providing know‐how, business development consulting and capital for start‐ups. Although, in the past, incubators mainly appeared in developed countries, they have recently also evolved rapidly in many emerging countries, such as CIIE in India and CIETEC in Brazil. Not‐for‐profit incubators funded by multilateral or bilateral donor organisations could be an interesting support mechanism to facilitate R&D and technology learning in more advanced developing countries.
Technical assistance and capacity building
A number of technical, administrative, legal or political barriers cannot be addressed by policy design only, but require technical assistance and local private and public capacity building to strengthen demand for finance and to create a clear and reliable framework for investment and deployment. Any support programme should try to maximise the involvement of local institutions to foster technology and policy learning in the developing countries and thus to foster expertise and capacity building. The governments and utilities of the countries should be involved to allow them to gain experience with renewable energy projects and policies. In addition, structures for local private‐sector actors such as local companies and banks should be created to allow them to gather experience with financing and operation of renewable energy projects. Technical assistance and capacity building should focus on:
• policy design for policy makers: e.g. feed‐in tariff design, price and rate setting, as well as policy review and transitional decreasing of financial support over time;
• development, resource assessment and feasibility studies for governments and local partners;
• construction, operation and maintenance for local companies;
• grid expansion, management and integration strategies for utilities; and
• financing and risk mitigation strategies for local financiers.
Technology transfer
Widespread transfer of sustainable energy technologies that match a country’s needs and priorities is required to sufficiently reduce CO2 emissions in the developing world and at the same time allow sustainable paths for development. To enable technology transfer on a larger scale, incentives have to be created for technology developers to cooperate and share technology knowledge.
Renewable Energy: Policy Considerations for Deploying Renewables © OECD/IEA 2011
Page | 60
Besides developed economies, many emerging economies, such as China and Brazil, have become leaders in RD&D of RETs in the past years. A higher level of south‐south cooperation on these technologies, therefore, can also be an important component of technology transfer. As an example, Brazil has implemented technology exchange on biofuel and bioenergy technology with several African countries. In 2008, Brazil established a branch of the Brazilian Agricultural Research Corporation Embrapa in Accra, Ghana, to promote south‐south exchanges of expertise and technology transfer to enhance deployment of bioenergy and biofuel technologies in Africa (Biopact, 2007).
Financing sources
Carbon credits
The Clean Development Mechanism (CDM) allows projects that reduce carbon emissions in developing countries to sell carbon credits into cap‐and‐trade schemes in developed countries with binding greenhouse gas emission reduction targets under the Kyoto Protocol. The CDM is thus a source of financing. As of early 2011, about 1 750 renewable energy projects were registered within the framework of the CDM, with a total investment volume of about USD 37 billion. Only about 20% of these projects, however, are located in the developing countries, excluding the BRICS, and about 50% of the renewable energy projects are located in China alone (UNEP Risoe, 2011).
Risk insurance
As an example, the Multilateral Investment Guarantee Agency provides insurance to private investors against political risk.
Loan‐softening programmes or loan guarantees
Many governments of more advanced developing countries, such as India, China and Thailand and multilateral lenders (e.g. WB, KfW, EIB, IFC, EBDR, ADB) in developing countries offer loan‐softening programmes or loan guarantees.
Technical assistance funds
A variety of bilateral or multilateral grant funds are available to developing countries for technical assistance for renewable energy technology systems and policy design. The Global Energy Efficiency and Renewable Energy Fund (GEEREF), for example, offers technical assistance. E&Co also provides technical assistance, and the Energy Sector Management Assistance Program (ESMAP) is a global technical assistance programme sponsored by UNDP, the World Bank and bilateral donors.
Technology transfer funds
Technology transfer funds are currently lacking for purchasing intellectual property rights for a free distribution of clean energy technologies in the developing world, in the way that such funds exist for the pharmaceutical sector, such as the Global Fund for AIDS. Technology transfer would be a great chance for the developing countries to accelerate diffusion of renewable energy technologies; such funds, therefore, would be very valuable.
© OECD/IEA 2011 Renewable Energy: Policy Considerations for Deploying Renewables
Page | 61
Rural electrification
To enhance the diffusion of renewables in developing countries, a promising approach is to support access to clean and efficient energy technologies in remote areas and, for this purpose, to exploit cost‐competitiveness of RETs for off‐ or mini‐grid applications.
Energy in rural areas not connected to a national or regional grid, e.g. from small‐scale diesel generators, costs between USD 0.35/kWh and USD 1.50/kWh (DB Climate Change Advisors, 2010) and is thus relatively expensive compared with large nationally or regionally grid‐connected energy. In these cases, RETs are often cost‐competitive. The situation is different, however, if decentralised renewable energy systems are to be installed in areas with no electricity supply at all, where potential consumers cannot afford to buy electricity. Then funds need to be found to carry the costs, for instance, from ODA.
Even where renewable energy systems replace more expensive fossil‐fuel generators, financing needs to be found for the high up‐front costs. Financing can be difficult to obtain from financial institutions or private investors due to small project size, considerable risks, administrative barriers, poor subsidy structures and lack of local expertise for technical maintenance, policy and market issues. This situation is less problematic for grid‐connected projects, because they generally need more financing, and loans can be made directly with electricity companies. Programmes should, therefore, provide structures for small‐scale projects, find financing solutions for subsidy structures where needed, and enhance technical assistance to create enabling conditions for investment.
Different concepts for the support of off‐grid and mini‐grid renewable energy projects have evolved in the past decade, and are described below.
Support mechanisms for decentralised energy projects
Microfinance
One of the most common financing concepts for small‐scale decentralised renewable energy projects has been different types of microfinance services, i.e. provision of debt to fund low‐cost, clean energy equipment. Households do not receive financing directly. Instead private companies, non‐governmental organisations or microfinance groups have to apply for a rural electrification project. Sustainable projects should not only imply investments into technology devices but also the implementation of an efficient service infrastructure.
Most experience in microfinance has probably been gained with solar PV home systems for household electrification, in particular lighting (MEI, 2010). The size and modular character of solar PV are well suited for individual small‐scale applications and easily adaptable to microfinance solutions. Mini‐grids incorporating e.g. mini‐hydro power plants are suitable for microfinancing in regions with higher population density. Such projects have a lot of potential for growth and even future integration into grid‐expansion plans. However, the households might not have the means to pay back even small debt, because, unless electricity is used for business purposes such as irrigation, electrification does not create more income for the households. As a result, household electrification puts a huge burden on the credit user. Microfinance is, therefore, most suitable for productive use of electricity, such as solar water pumps for irrigation, not for basic off‐grid electricity needs such as lighting or cooking. Reasonable financing and ownership structures have been developed for village mini‐grids (Figure 4.2).
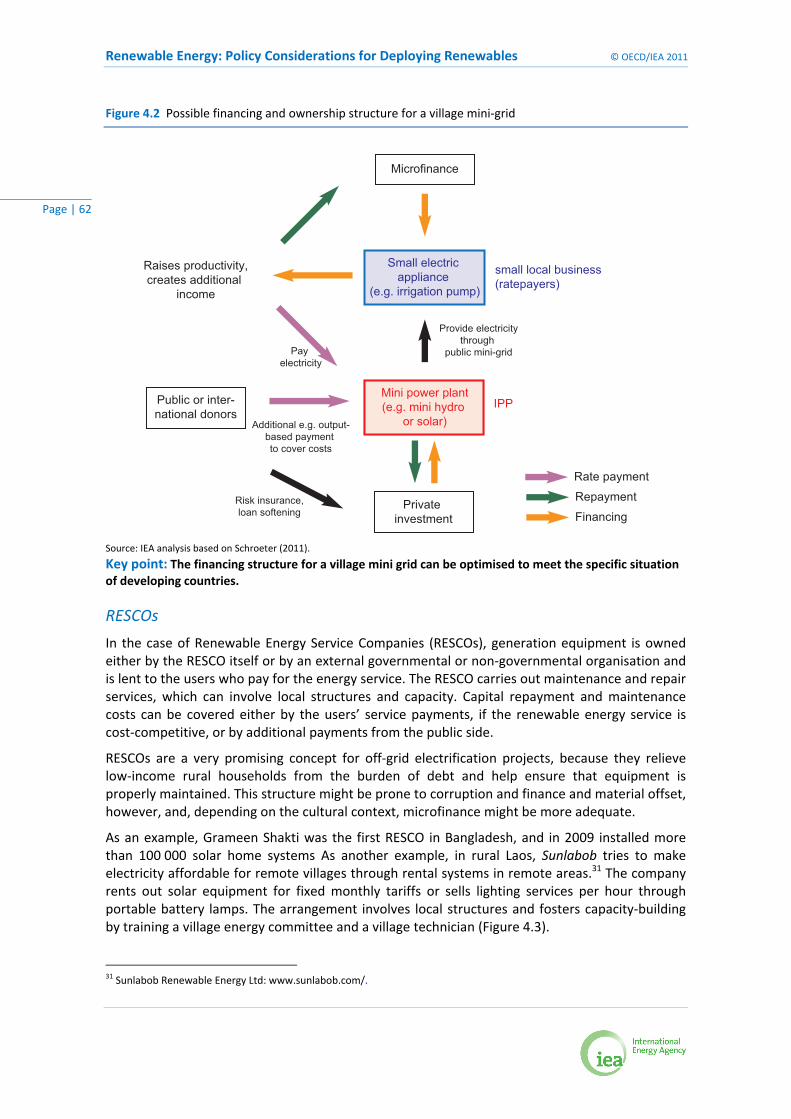
Renewable Energy: Policy Considerations for Deploying Renewables © OECD/IEA 2011
Page | 62
Figure 4.2 Possible financing and ownership structure for a village mini‐grid
Source: IEA analysis based on Schroeter (2011).
Key point: The financing structure for a village mini grid can be optimised to meet the specific situation of developing countries.
RESCOs
In the case of Renewable Energy Service Companies (RESCOs), generation equipment is owned either by the RESCO itself or by an external governmental or non‐governmental organisation and is lent to the users who pay for the energy service. The RESCO carries out maintenance and repair services, which can involve local structures and capacity. Capital repayment and maintenance costs can be covered either by the users’ service payments, if the renewable energy service is cost‐competitive, or by additional payments from the public side.
RESCOs are a very promising concept for off‐grid electrification projects, because they relieve low‐income rural households from the burden of debt and help ensure that equipment is properly maintained. This structure might be prone to corruption and finance and material offset, however, and, depending on the cultural context, microfinance might be more adequate.
As an example, Grameen Shakti was the first RESCO in Bangladesh, and in 2009 installed more than 100 000 solar home systems As another example, in rural Laos, Sunlabob tries to make electricity affordable for remote villages through rental systems in remote areas.31 The company rents out solar equipment for fixed monthly tariffs or sells lighting services per hour through portable battery lamps. The arrangement involves local structures and fosters capacity‐building by training a village energy committee and a village technician (Figure 4.3).
31 Sunlabob Renewable Energy Ltd: www.sunlabob.com/.
Microfinance
Private investment
Rate payment
Repayment
Financing
Public or inter-national donors
Risk insurance,loan softening
Raises productivity,creates additional
income
Pay electricity
Additional e.g. output-based payment to cover costs
Provide electricitythrough
public mini-grid
Small electric appliance
(e.g. irrigation pump)
Mini power plant(e.g. mini hydro
or solar)
small local business(ratepayers)
IPP
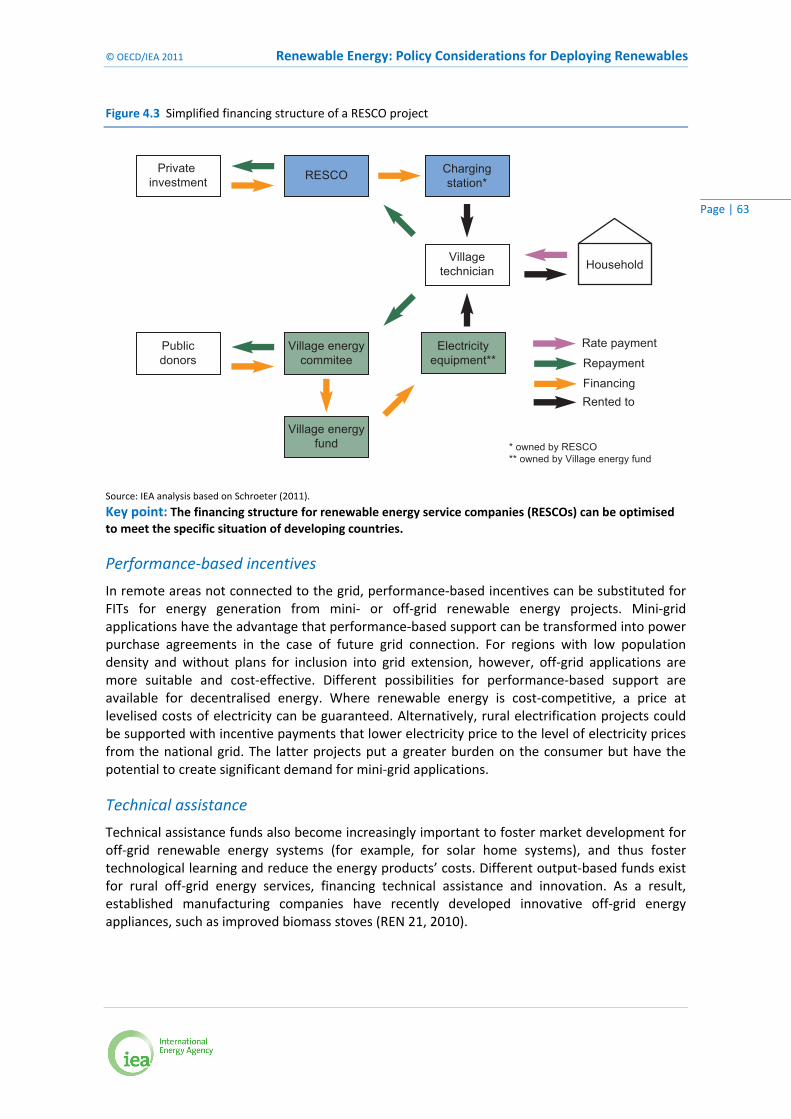
© OECD/IEA 2011 Renewable Energy: Policy Considerations for Deploying Renewables
Page | 63
Figure 4.3 Simplified financing structure of a RESCO project
Source: IEA analysis based on Schroeter (2011).
Key point: The financing structure for renewable energy service companies (RESCOs) can be optimised to meet the specific situation of developing countries.
Performance‐based incentives
In remote areas not connected to the grid, performance‐based incentives can be substituted for FITs for energy generation from mini‐ or off‐grid renewable energy projects. Mini‐grid applications have the advantage that performance‐based support can be transformed into power purchase agreements in the case of future grid connection. For regions with low population density and without plans for inclusion into grid extension, however, off‐grid applications are more suitable and cost‐effective. Different possibilities for performance‐based support are available for decentralised energy. Where renewable energy is cost‐competitive, a price at levelised costs of electricity can be guaranteed. Alternatively, rural electrification projects could be supported with incentive payments that lower electricity price to the level of electricity prices from the national grid. The latter projects put a greater burden on the consumer but have the potential to create significant demand for mini‐grid applications.
Technical assistance
Technical assistance funds also become increasingly important to foster market development for off‐grid renewable energy systems (for example, for solar home systems), and thus foster technological learning and reduce the energy products’ costs. Different output‐based funds exist for rural off‐grid energy services, financing technical assistance and innovation. As a result, established manufacturing companies have recently developed innovative off‐grid energy appliances, such as improved biomass stoves (REN 21, 2010).
Private investment RESCO Charging
station*
HouseholdVillagetechnician
Electricityequipment**
* owned by RESCO** owned by Village energy fund
Village energycommitee
Village energyfund
Publicdonors
Rate payment
Repayment
FinancingRented to
Renewable Energy: Policy Considerations for Deploying Renewables © OECD/IEA 2011
Page | 64
Technology transfer
Some emerging economies and developing countries, such as India and China, have succeeded in developing R&D infrastructure for decentralised energy applications. Even more countries, such as South Africa, Bangladesh, Sri Lanka, Mali, Kenya and Senegal, have accumulated a significant amount of experience with off‐ and mini‐grid renewable energy technologies. Consequently, south‐south cooperation on renewable technologies for rural electrification could help to disseminate these technologies in the developing world.
Sources of finance for decentralised renewable energy projects
Microfinance funds
Many microfinance funds were initially specialised for one technology, such as solar PV home systems. They are increasingly expanding, however, to other renewable energy systems, so that a single financing agency may provide finance for a number of different RETs, including renewable household systems, improved biomass cooking stoves as well as community small‐grid systems. Examples are the microfinance programmes of Grameen Shakti and Selco India. E&Co funds a number of microfinance providers.
RESCO funds
Where renewable energy applications are cost‐, the energy equipment owned by the RESCOs can be repaid from the payments that the RESCOs obtain for the energy service. The consumers’ costs, however, should not exceed the avoided costs for conventional energy applications, or in the case of mini‐grids, the costs for grid‐connected electricity. Otherwise public donors for a trust fund need to be found to finance part of the costs, e.g. the World Bank or other multi‐ or bilateral organisations. Some RESCOs, such as Sunlabob, have bundled their emission reductions over a period of time to participate in the carbon market.
Output‐based aid funds
A variety of output‐based aid funds exist, such as the Global Partnership for Output‐Based Aid (GPOBA) (DFID, 2007) and funds envisioned in the GET FiT Programme of the DB (DB Climate Change Advisors, 2010), where public finance is provided as subsidies under performance‐based contracts.
Community block grant funds
In Latin America, renewable energy options are also included in community block grant programmes. In Guatemala, for example, improved biomass stoves were financed by the World Bank (REN21, 2010).
Carbon credits
A number of private carbon funds or international agencies involved in the Clean Development Mechanism (CDM) provide carbon credits for off‐grid energy projects. The World Bank’s Community Development Carbon Fund, for instance, supports solar home systems, biogas and micro‐hydro systems, improved biomass cooking stoves and other technologies. Although carbon funding is difficult to obtain for small projects, efforts are under way to bundle small off‐grid projects into larger programmes.
© OECD/IEA 2011 Renewable Energy: Policy Considerations for Deploying Renewables
Page | 65
Conclusion
RETs in developing countries have lower CO2 reduction costs than in developed countries due to the cost‐competitiveness of RETs in decentralised energy applications. Furthermore, RETs in developing countries have the potential for a wide range of additional social, economic and environmental benefits, most importantly helping to extend affordable, reliable and clean energy access to the 1.5 billion people in rural areas of the developing world without grid access. Well‐designed support programmes must be developed, therefore, to tackle the barriers and challenges described in this topical highlight.
A necessary first step is to cut fossil‐fuel subsidies where they exist so as not to distort the market to the disadvantage of the renewable energies, while respecting the social dimension of energy pricing. Furthermore, non‐economic barriers need to be addressed, e.g. by mitigating non‐economic risks and using technical assistance to create enabling conditions for deployment, attract a significant amount of private financing and allow sustainable development in the regions. A very promising approach is to exploit the cost‐competitiveness of renewables for off‐ and mini‐grid applications by pushing forward programmes that provide structures for financing of small‐scale off‐grid projects. Another very important, but still underdeveloped, approach to accelerating diffusion of RETs is technology information sharing. Funds need to be created for technology transfer, and appropriate incentives need to be designed for technology developers.
Renewable Energy: Policy Considerations for Deploying Renewables © OECD/IEA 2011
Page | 66
Acronyms, Abbreviations and Units of Measure
Region definitions and focus countries
ASEAN‐6 Indonesia, Malaysia, Philippines, Singapore, Thailand, Vietnam. BRICS Brazil, Russia, India, China (People’s Republic of China and Hong Kong), South
Africa. MENA‐7 Algeria, Egypt, Israel, Morocco, Saudi Arabia, Tunisia, United Arab Emirates. OECD‐30 Australia, Austria, Belgium, Canada, Czech Republic, Denmark, Finland, France,
Germany, Greece, Hungary, Iceland, Ireland, Italy, Japan, Korea, Luxembourg, Mexico, Netherlands, New Zealand, Norway, Poland, Portugal, Slovak Republic, Spain, Sweden, Switzerland, Turkey, United Kingdom, United States.
LA‐2 Argentina, Chile. SSA‐6 Botswana, Ghana, Kenya, Nigeria, Senegal, Tanzania.
International bodies and fora
EU‐27 member countries Austria, Belgium, Bulgaria, Cyprus, Czech Republic, Denmark, Estonia, Finland, France, Germany, Greece, Hungary, Ireland, Italy, Latvia, Lithuania, Luxembourg, Malta, Netherlands, Poland, Portugal, Romania, Slovak Republic, Slovenia, Spain, Sweden, United Kingdom. Clean Energy Ministerial (CEM) countries Australia, Brazil, Canada, China, Denmark, Finland, France, Germany, India, Indonesia, Italy, Japan, Republic of Korea, Mexico, Norway, Russia, South Africa, Spain, United Arab Emirates, United Kingdom, United States.
Group of Twenty (G20) Argentina, Australia, Brazil, Canada, China, France, Germany, India, Indonesia, Italy, Japan, Mexico, Republic of Korea, Russia, Saudi Arabia, South Africa, Spain, Turkey, United Arab Emirates, United Kingdom, United States, European Union. IEA member countries Australia, Austria, Belgium, Canada, Czech Republic, Denmark, Finland, France, Germany, Greece, Hungary, Ireland, Italy, Japan, Republic of Korea, Luxembourg, The Netherlands, New Zealand, Norway, Poland, Portugal, Slovak Republic, Spain, Sweden, Switzerland, Turkey, United Kingdom, United States.
© OECD/IEA 2011 Renewable Energy: Policy Considerations for Deploying Renewables
Page | 67
OECD member countries Australia, Austria, Belgium, Canada, Chile, Czech Republic, Denmark, Estonia, Finland, France, Germany, Greece, Hungary, Iceland, Ireland, Israel, Italy, Japan, Korea, Luxembourg, Mexico, Netherlands, New Zealand, Norway, Poland, Portugal, Slovak Republic, Slovenia, Spain, Sweden, Switzerland, Turkey, United Kingdom, United States.
Acronyms
CAGR compound average growth rate CCS carbon capture and storage CEM Clean Energy Ministerial CHP combined heat and power CSP concentrating solar power DNI direct normal irradiance DDGS dried distillers grains with solubles DSG direct steam generation EIA Energy Information Administration EU European Union EU ETS European Union Greenhouse Gas Emission Trading Scheme EU‐OECD OECD member countries which are also European Union member states FIP feed‐in premium FIT feed‐in tariff FLH full load hours GDP gross domestic product GWEC Global Wind Energy Council IEA International Energy Agency IPP independent power producer ITC investment tax credit IEAPVPS International Energy Agency Photovoltaic Power Systems Programme IEABCC International Energy Agency Biomass Combustion and Cofiring IEASHC International Energy Agency Solar Heating and Cooling Programme LCA life‐cycle analysis LCOE levelised cost of electricity LR learning rate MoU Memorandum of Understanding NPV net present value n/a not applicable OECD Organisation for Economic Co‐operation and Development PII Policy Impact Indicator PPA power purchase agreement PTC production tax credit PV photovoltaics RAI Remuneration Adequacy Indicator R&D research and development RD&D research, development and demonstration RE renewable energy RES renewable energy sources RES‐E electricity generated from renewable energy sources RES‐H heat produced from renewable energy sources
Renewable Energy: Policy Considerations for Deploying Renewables © OECD/IEA 2011
Page | 68
RES‐T transport fuels produced from renewable energy sources RFS renewable fuels standard RPS renewable portfolio standard ROC renewable obligation certificate TCI Total Cost Indicator TFC total final consumption TGC tradable green certificate TPES total primary energy supply UNEP United Nations Environment Programme WACC weighted average cost of capital WEO World Energy Outlook
Units of measure
GWh gigawatt‐hour, 1 kilowatt‐hour equals 109 watt‐hours ha hectare Gt giga tonnes J joule kb kilobarrel kWh kilowatt‐hour, 1 kilowatt‐hour equals 103 watt‐hours kWp kilowatt peak kWth kilowatt thermal l litre m³ cubic metre Ml million litres Mtoe million tonnes of oil equivalent MWh megawatt hour, 1 megawatt‐hour equals 106 watt‐hours PJ petajoule, 1 petajoule equals 1015 joules Ppm parts per million TJ terajoule, 1 terajoule equals 1012 joules toe tonne of oil equivalent TWh terawatt‐hour, 1 terawatt‐hour equals 101
© OECD/IEA 2011 Renewable Energy: Policy Considerations for Deploying Renewables
Page | 69
References Awerbuch, S. and R. Sauter (2006), “Exploiting the Oil–GDP Effect to Support Renewables
Deployment”, Energy Policy, Vol. 34, Elsevier, Amsterdam, pp. 2805–2819.
Bailey, H., et al. (2010), “Assessing Underwater Noise Levels During Pile‐Driving at an Offshore Windfarm and its Potential Effects on Marine Mammals”, Marine Pollution Bulletin, Vol. 60, Elsevier, Amsterdam, pp. 888‐897.
Biopact (2007), “Brazil in Africa: South‐South cooperation on bioenergy speeding up”, http://news.mongabay.com/bioenergy/2007/03/brazil‐in‐africa‐south‐south.html .
BMU (Bundesministerium für Umwelt, Naturschutz und Reaktorsicherheit) (2007), “Renewable Energy and the Clean Development Mechanism“, www.umweltdaten.de/ publikationen/fpdf‐l/3340.pdf .
Breyer, C. and A. Gerlach (2010), “Global Overview on Grid‐Parity Event Dynamics”, paper for the 25th EU PVSEC/WPEC‐5, Valencia, 6‐10 September.
Brown, A., S.G. Müller and Z. Dobrotková (2011), “Renewable Energy: Markets and Prospects by Technology”, IEA Information Paper, OECD/IEA, Paris.
CNN (2011), “Japan and energy: What’s the alternative?”, http://edition.cnn.com/ 2011/BUSINESS/03/24/japan.alternatives/index.html.
Costantini, V. et al. (2007), “Security of Energy Supply: Comparing Scenarios from a European Perspective”, Energy Policy, Vol. 35, Elsevier, Amsterdam, pp. 210‐226.
Cherubini, F., et al. (2009), “Energy‐ and greenhouse gas‐based LCA of biofuel and bioenergy systems: Key issues, ranges and recommendations”, Resources, Conservation and Recycling, Vol. 53, Elsevier, Amsterdam, pp. 434–447.
Cheung, K. (2011), “Integration of Renewables: Status and Challenges in China”, IEA Information Paper, IEA/OECD, Paris.
Connor, P., et al. (2009), “Overview of RES‐H/RES‐C Support Options”, D4 of WP2 report of the EU project RES‐H Policy, www.res‐h‐policy.eu/downloads/RES‐H_Policy‐Options_(D4)_final.pdf.
DESERTEC (2011), “The DESERTEC Concept”, www.desertec.org/en/concept/.
DB Climate Change Advisors (2010), GET FiT Program: Global Energy Transfer Feed‐in Tariffs for Developing Countries, Deutsche Bank (DB) Climate Change Advisors, Deutsche Bank Group, New York.
DBFZ (Deutsches Biomasse Forschungszentrum) (2009), “Bio‐SNG – Demonstration of the Production and Utilization of Synthetic Natural Gas (SNG) from Solid Biofuels”, Final Project Report, DBFZ, Leipzig.
DFID (UK Department for International Development) (2007), “Private Sector Infrastructure Investment”, www.dfid.gov.uk/Documents/publications1/evaluation/Literature‐review.pdf .
DSIRE (Database of State Incentives for Renewables and Efficiency) (2011), “Renewable Electricity Production Tax Credit (PTC)”, www.dsireusa.org/incentives/incentive.cfm?Incentive_Code =US13F&re=1&ee=1.
Ecorys (2008), “Assessment of Non‐Cost Barriers to Renewable Energy Growth in EU Member States”, AEON DG TREN No. TREN/D1/48 – 2008 Final report, Ecorys, Rotterdam.
Renewable Energy: Policy Considerations for Deploying Renewables © OECD/IEA 2011
Page | 70
EIA (Energy Information Agency) (2010), Annual Energy Review 2010, EIA, Washington, D.C.
Fthenakis, V. and H. C. Kim (2010), “Life‐cycle uses of water in U.S. electricity generation”, Renewable and Sustainable Energy Reviews, Vol. 14, Elsevier, Amsterdam, pp. 2039‐2048.
GEA (2007), “A Guide to Geothermal Energy and the Environment”, Geothermal Energy Association, www.geo‐energy.org/reports/Environmental%20Guide.pdf .
Grubb, M., L. Butler and P. Twomey (2006), “Diversity and Security in UK Electricity Generation: The Influence of Low‐Carbon Objectives”, Energy Policy, Vol. 34, Elsevier, Amsterdam, pp. 4050‐4062.
GTZ (2009a), Renewable Energies in West Africa, Regional Report on Potentials and Markets, GTZ, Frankfurt/Eschborn.
GTZ (2009b), Renewable Energies in East Africa, Regional Report on Potentials and Markets, GTZ, Frankfurt/Eschborn.
Gustavsson, M. (2007), “Educational Benefits from Solar Technology: Access to Solar Electric Services and Changes in Children's Study Routines, Experiences from Eastern Province Zambia”, Energy Policy, Vol. 35, Elsevier, Amsterdam, pp. 1292‐1299.
IEE (Institute for Economy and the Environment) (2010), “The Price of Renewable Energy Policy Risk: An Empirical Analysis Based on Choice Experiments with International Wind and Solar Energy Investors”, Confidential report prepared for the IEA, IEE, University of St. Gallen, St. Gallen.
IEA (International Energy Agency) (2008), Deploying Renewables: Principles for Effective Policies, OECD/IEA, Paris.
IEA (2009), Transport, Energy and CO2. Moving Towards Mobility, OECD/IEA, Paris.
IEA (2010a), World Energy Outlook 2010, OECD/IEA, Paris.
IEA (2010b), Energy Technology Perspectives 2010, OECD/IEA, Paris.
IEA (2011a), Deploying Renewables 2011: Best and Future Policy Practice, OECD/IEA, Paris.
IEA (2011b), Harnessing Variable Renewables, OECD/IEA, Paris.
IEA (2011c), World Energy Outlook 2011: Are We Entering a Golden Age of Gas?, Special Report, OECD/IEA, Paris.
IEA (2011d), Technology Roadmap: Biofuels for Transport, OECD/IEA, Paris.
IEAPVPS (IEA Photovoltaic Power Systems Programme) (2011), “Life Cycle Inventories and Life Cycle Assessments of Photovoltaic Systems”, IEA PVPS Task 12, Subtask 20, LCA Report, www.iea‐pvps.org/fileadmin/dam/public/report/technical/rep12_10.pdf.
Jager, D. de and M. Rathmann (2008), “Policy Instrument Design to Reduce Financing Costs in Renewable Energy Technology Projects”, Report prepared for the IEA Implementing Agreement on Renewable Energy Technology Deployment (RETD), Ecofys International BV, Utrecht.
Jewell, J. (2010), “Sustainable Energy Pathways: Are They Secure?”, YSSP report working paper, Laxenburg: IIASA.
Jochem, E., et al. (2008), “Investitionen für ein klimafreundliches Deutschland” (Investments for a Climate‐Friendly Germany), Synthesis report of study commissioned by the German Federal
© OECD/IEA 2011 Renewable Energy: Policy Considerations for Deploying Renewables
Page | 71
Ministry for the Environment, Nature Protection and Nuclear Safety (BMU), authored by: Potsdam Institute for Climate Impact Research (PIK), European Climate Forum (ECF), Fraunhofer Institute for Systems and Innovation Research (Fh‐ISI), BSR‐Sustainability, Öko‐Zentrum NRW, Potsdam.
Lacher, W. and D. Kumetat (2010), “The Security of Energy Infrastructure and Supply in North Africa: Hydrocarbons and Renewable Energies in comparative Perspective”, Energy Policy, Vol. 39, Elsevier, Amsterdam, pp. 4466‐4478.
Lamers, P. (2009), “Assessment of Non‐Economic Barriers to the Development of Renewable Electricity: Global Recommendations”, Confidential report prepared for the IEA, Ecofys Germany GmbH, Berlin.
Lilliestam, J. and S. Ellenbeck (2011), “Energy Security and Renewable Electricity Trade: Will Desertec make Europe vulnerable to the ‘Energy Weapon’?”, Energy Policy, Vol. 39, Elsevier, Amsterdam, pp. 3380‐3391.
Lozano‐Minguez, E., A.J. Kolios, and F.P. Brennan (2011), “Multi‐Criteria Assessment of Offshore Wind Turbine Support Structures”, Renewable Energy, Vol. 36, Elsevier, Amsterdam, pp. 2831‐2837.
Lund, H. (2010), “The implementation of renewable energy systems: Lessons learned from the Danish case”, Energy, Vol. 35, Elsevier, Amsterdam, pp. 4003‐4009.
MEI (Micro Energy International) (2010), The African Electrification Initiative: The Role of Microfinance, MEI, Berlin.
MIT (Massachusetts Institute of Technology) (2006), “The Future of Geothermal Energy”, An assessment by an MIT‐led interdisciplinary panel, http://geothermal.inel.gov/publications /future_of_geothermal_energy.pdf.
Mizuno, E. (2010), “Renewable Energy Technology Innovation and Commercialisation Analysis”, Report prepared for the IEA Renewable Energy Division, Cambridge Centre for Energy Studies (CCES), Judge Business School, University of Cambridge, Cambridge.
Müller, S.G., A. Marmion and M. Beerepoot (2011), “Renewable Energy: Markets and Prospects by Region”, IEA Information Paper, OECD/IEA, Paris.
Murphy, L. M. and P. L. Edwards (2003), “Bridging the Valley of Death: Transitioning from Public to Private Sector Financing“, National Renewable Energy Laboratory (NREL) Report No. MP‐720‐34036, NREL, Golden, Colorado.
National People‘s Congress (2010), “The Renewable Energy Law of the People’s Republic of China (Amended)”, www.npc.gov.cn/huiyi/cwh/1112/2009‐12/26/content_1533216.htm.
NDRC (National Development and Reform Commission) (2011), The Twelfth Five‐Year Plan for National Economic and Social Development of The People’s Republic of China, Beijing.
NEEDS (2009), “New Energy Externalities Developments for Sustainability Project”, www.needs‐project.org/ .
NREL (National Renewable Energy Laboratory) (2011), “A Review of Operational Water Consumption and Withdrawal Factors for Electricity Generating Technologies”, Technical Report, NREL, www.nrel.gov/docs/fy11osti/50900.pdf .
OECD (Organisation for Economic Co‐Operation and Development) (2008), Biofuel Support Policies: An Economic Assessment, OECD, Paris.
Renewable Energy: Policy Considerations for Deploying Renewables © OECD/IEA 2011
Page | 72
OECD (2011), Towards Green Growth, OECD, Paris, www.oecd.org/dataoecd/37/34/ 48224539.pdf.
POST (Parliamentary Office of Science and Technology) (2006), "Carbon Footprint of Electricity Generation", Postnote N. 268, www.parliament.uk/documents/post/postpn268.pdf.
PV Legal (2010), "First PV Legal Status Report", www.pvlegal.eu/results/status‐reports.html.
Ragwitz, M. (2010), “Effective and efficient long‐term oriented RE support policies”, International Energy Agency (IEA) Renewable Energy Working Party Workshop on “Renewables, from Cinderella options to mainstream energy solutions”, 15 March 2010, Paris.
Ragwitz, M., et al. (2007), “OPTRES: Assessment and Optimisation of Renewable Energy Support Measures in the European Electricity Market”, Final Report of the project as conducted by a consortium led by Fraunhofer Institute Systems and Innovation Research for the European Commission, DGTREN, Intelligent Energy for Europe Programme (Contract No. EIE/04/073/S07.38567), Fraunhofer Institute Systems and Innovation Research, Karlsruhe.
Reid, G., et al. (2010), A Global Renewables Investment Plan: Scaling up investments in renewable energy technologies, report by Jeffereis, Potsdam Institute for Climate Impact Research (PIK), International Institute for Applied Systems Analysis (IIASA), PricewaterhouseCoopers Ltd (PwC), University of Exeter, Smart Energy for Europe Platform (SEFEP), supported and edited by the Indo‐German Energy‐Forum; the Government of India, Ministry of New and Renewable Energy (NMRE); Government of Germany, Federal Ministry for the Environment, Nature Conservation and Nuclear Safety (BMU); Deutsche Gesellschaft für Technische Zusammenarbeit (GTZ) GmbH; Permanent Office of the Indo‐German Energy Forum, New Delhi.
REN21 (Renewable Energy Policy Network for the 21st Century) (2010), Renewables 2010 Global Status Report 2011, REN21 Secretariat, Paris.
REN21 (2011), Renewables 2011 Global Status Report 2011, REN21 Secretariat, Paris.
Schroeter, A. (2011), “Extending modern energy to rural households in Asia and Africa”, Sunlabob Renewable Energy Ltd, Lao PDR, presentation given on 4 February 2011 at the IEA Secretariat, Paris.
The Economist (2010), “Not on my beach, please”, www.economist.com/node/16846774.
UNEP/BNEF (United Nations Environment Programme / Bloomberg New Energy Finance) (2011), “Global Trends in Renewable Energy Investment 2011”, UNEP and BNEF, www. fs‐unep‐centre.org.
UNEP Risoe (2011), “UNEP Risoe CDM Pipeline Overview, February 1st 2010”, http://cdmpipeline.org/.
Usha Rao K. and V.V.N. Kishore (2009), “A Review of Technology Diffusion Models with Special Reference to Renewable Energy Technologies”, Renewable and Sustainable Energy Reviews, Vol. 14, Elsevier, Amsterdam, pp. 1070–1078.
Walz, R., N. Helfrich, and A. Enzmann (2009), “A System Dynamics Approach for Modelling a Lead‐Market‐Based Export Potential”, Fraunhofer Institute for Systems and Innovation Research (Fh‐ISI) Working Paper Sustainability and Innovation, No. S 3/2009, Karlsruhe, http://isi.fraunhofer.de/isi‐de/e/publikationen/workingpapers_sustainability_innovation.php.
WEF (World Economic Forum) (2010), Green Investing 2010: Policy Mechanisms to Bridge the Financing Gap, New York.


9 rue de la Fédération 75739 Paris Cedex 15
www.iea.org