A Digitally Modulated Polar CMOS Power Amplifier With a 20-MHz

1
Investor Presentation
All photos in this document are from actual sites / applications with Polar Power, Inc. products installed. Polar does not providethe platforms, radios, antennas or towers. © 2018 Polar Power, Inc. All Rights Reserved.
Providing Low Cost Reliable Power For Telecommunications
March 2018NASDAQ: POLA
2
The following discussion, in addition to the other information contained in this presentation, should be considered carefully inevaluating our prospects. This presentation (including without limitation the following factors that may affect operating results)contains forward-looking statements regarding us and our business, financial condition, results of operations and prospects. Wordssuch as "expects," "anticipates," "intends," "plans," "believes," "seeks," "estimates" and similar expressions or variations of suchwords are intended to identify forward-looking statements, but are not the exclusive means of identifying forward-lookingstatements in this presentation. Additionally, statements concerning future matters such as revenue projections, projectedprofitability, growth strategies, and other statements regarding matters that are not historical are forward-looking statements.
Forward-looking statements in this presentation reflect the good faith judgment of our management and the statements are basedon facts and factors as we currently know them. Forward-looking statements are subject to risks and uncertainties and actualresults and outcomes may differ materially from the results and outcomes discussed in the forward-looking statements. Factorsthat could cause or contribute to such differences in results and outcomes include, but are not limited to, those discussed in thispresentation. Readers are urged not to place undue reliance on these forward-looking statements which speak only as of the dateof this presentation. We undertake no obligation to revise or update any forward-looking statements in order to reflect any eventor circumstance that may arise after the date of this presentation.
This presentation shall not constitute an offer to sell or the solicitation of an offer to sell or the solicitation of an offer to buy anysecurities of the Company nor shall there be any sale of securities in any jurisdiction in which such offer, solicitation or sale wouldbe unlawful prior to registration or qualification under the securities laws of any such jurisdiction.
© 2018 Polar Power, Inc. All Rights Reserved.
2
SAFE HARBOR
3
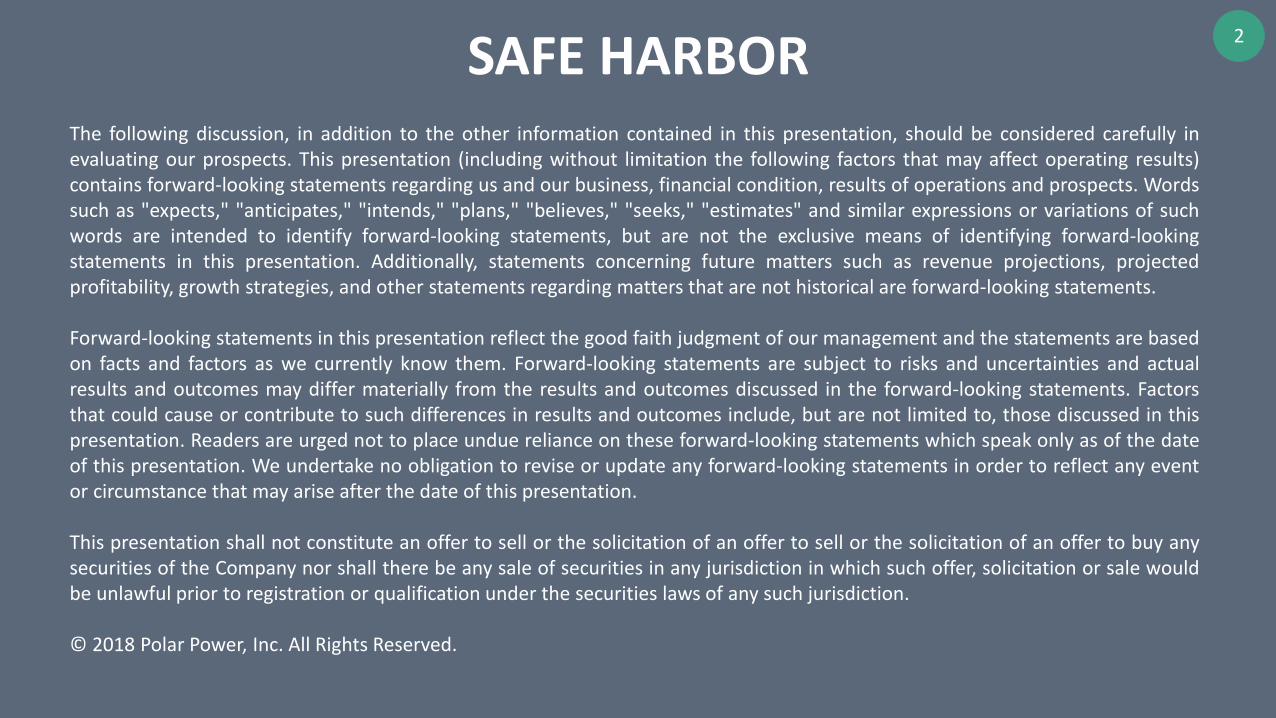
Corporate Overview
Founded in 1979, we design, manufacture and sell direct current, or DC, power systems for applications in:
• Telecommunications• Military• Electric vehicle charging
Our core technologies include: • Energy conversion• Digital control systems• Cooling systems
Within the telecommunications market, our DC power systems provide reliable and low-cost DC power to service applications in:
• Prime power applications - do not have access to the utility grid
• Back-up power applications - have critical power needs and cannot be without power in the event of utility grid failure
Customers can rely on Polar to deliver a turn-key solution as opposed to ‘reinventing the wheel’ using their internal engineers or consultants
• Cogeneration• Distributed power• Uninterruptable power supply (UPS)
• System integration• Manufacturing

4
Investment Highlights
We are a Global Provider of Prime and Backup DC Power Solutions
• Multi-billion dollar opportunity with multiple applications within multiple markets
• Top-tier customer base including Verizon, AT&T, T-Mobile, Oshkosh Defense and more
• Direct sales / relationships with Fortune 500 customers
Strong Technology History & Brand Recognition With Proprietary DC Power System Technologies
Always Staying Ahead of the Competition
• Leadership in energy conversion, power generation, energy storage and digital controls
• We are a solutions provider, not a commodity product provider
• Our DC power systems are smaller, lighter, and more efficient than many AC power systems
• Integrated controls with remote monitoring and control
• Manufacturing expertise enables us to provide a turnkey, fully integrated system
Track Record of Growth and Profitability
• Funded a decade of growth with free cash flow generated by operations
• Proceeds from recent public offering will support greater penetration of existing customers and broader outreach to new customers and end markets
5
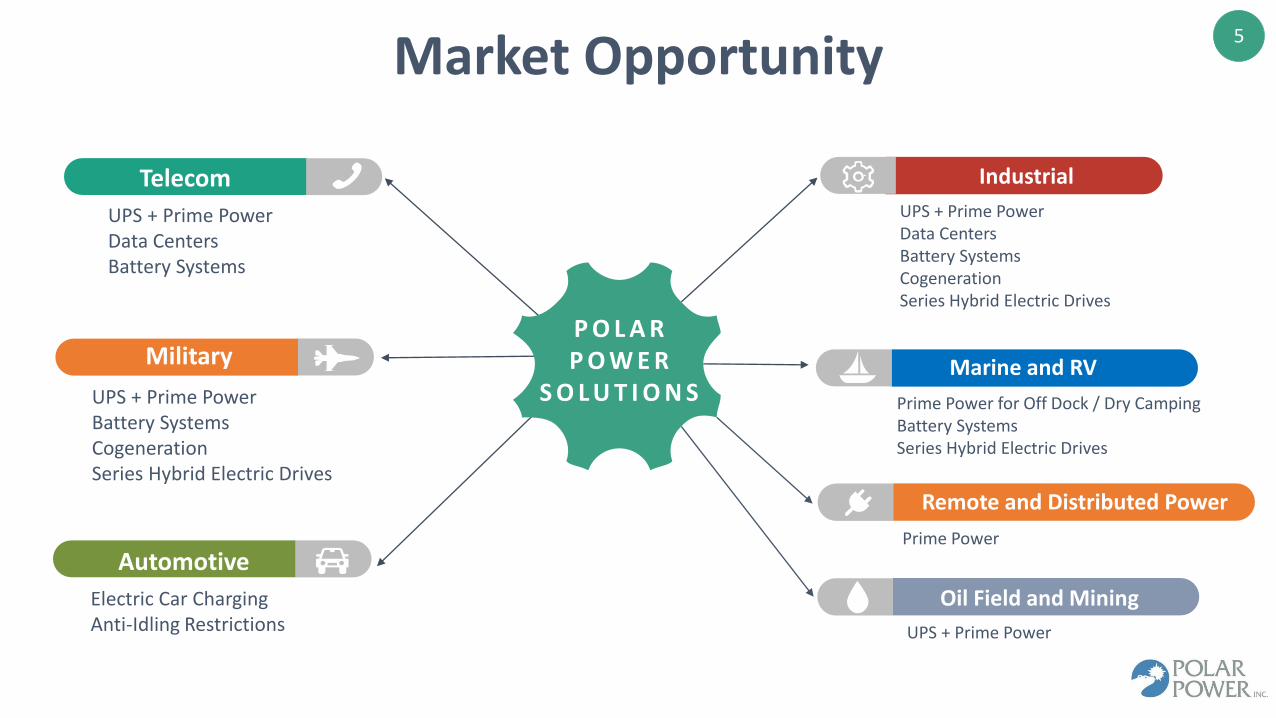
Market Opportunity
.Telecom
Military
Automotive
Industrial
Marine and RV
Remote and Distributed Power
P O L A RP O W E R
S O L U T I O N S
Oil Field and Mining
UPS + Prime PowerData CentersBattery Systems
UPS + Prime PowerBattery SystemsCogenerationSeries Hybrid Electric Drives
UPS + Prime PowerData CentersBattery SystemsCogenerationSeries Hybrid Electric Drives
Electric Car ChargingAnti-Idling Restrictions
Prime Power for Off Dock / Dry CampingBattery SystemsSeries Hybrid Electric Drives
Prime Power
UPS + Prime Power
6
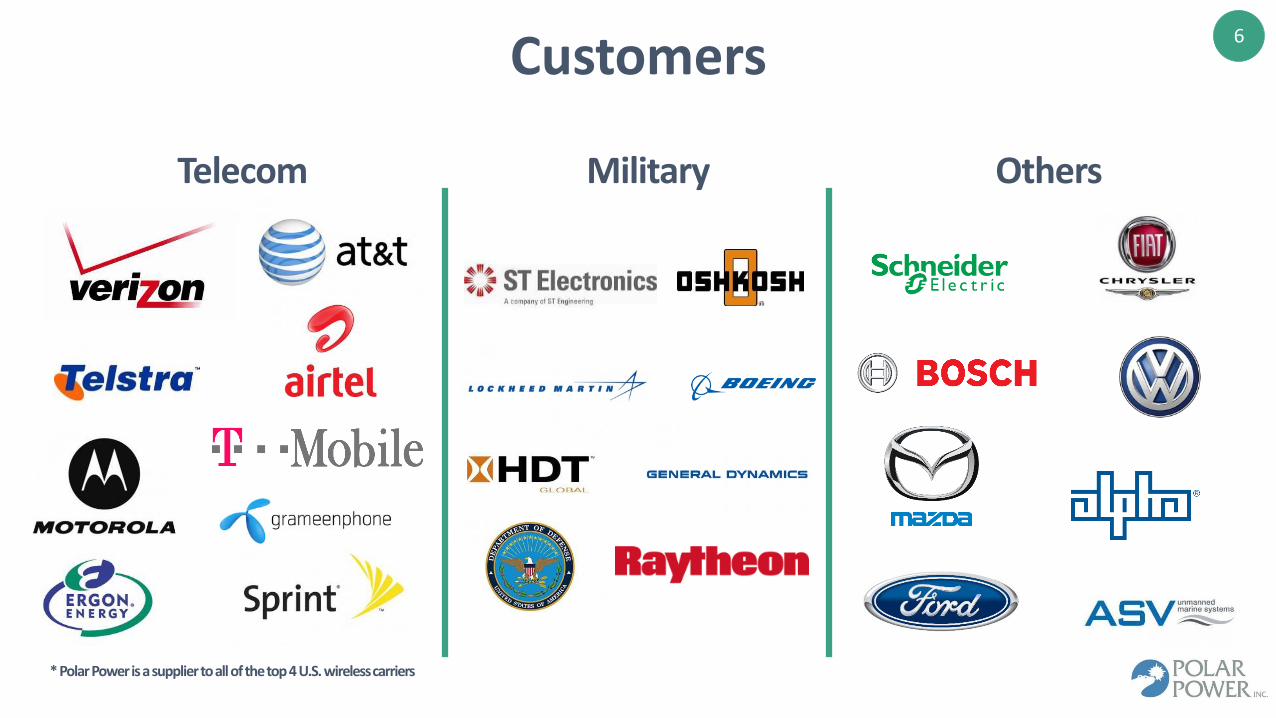
Customers
Telecom Military Others
* Polar Power is a supplier to all of the top 4 U.S. wireless carriers

7

8
Why a Telecommunications Focus?
Presently 4.7 billion unique mobile subscribers and 5.7 billion projected by 2020 (1)
Telecommunications companies worldwide will invest over $1.4 trillion in the construction of new cell towers and equipment upgrades by 2020 (2)
Reducing energy cost presents a major opportunity to increase profit or lower subscriber fees
It is estimated there are more than 1,000 small and medium telecom companies in the U.S. alone
Currently, it is estimated that there are more than 300,000 cell sites in the U.S. (3)
New 5G rollout requires large tower and power expansion
(1) Source - GSMA 2016 Report(2) Source – Mobile Economy 2015 – GSMA report(3) Source – CTIA.org

9Growth StrategyFurther Develop U.S. Mobile Telecommunications Market
• During the last three years, we achieved significant success in selling our DC power systems to large wireless companies
• Achieved vendor approval from the 4 largest wireless carriers in the USA
• Further expand our sales, manufacturing and service infrastructure through strategic allocation of capital in operations and plant and equipment
Expand DC Power Systems Sales Into New Geographic Markets
• Currently, our sales of DC power systems are mostly to U.S. customers, which represents only 4.7% of the total global telecommunications market
• A significant opportunity exists for sales of our DC power systems to customers located in developing nations
Expand Renewable Solar Energy Product Offerings
• Increased environmental regulations and reduction in cost of solar and advanced storage batteries has accelerated tower operators’ focus on solar hybrid systems in off-grid and bad-grid regions
• In 2013, we developed our proprietary Lithium Battery Management System and Solar Control System
Offer OPEX Model (Energy Rental for Telecoms)
• Trend of wireless carriers divesting tower assets to tower operators and tower operators further divesting power infrastructure to energy companies
• Introduced pilot rental program in Southern California in 2014 to evaluate business model
Develop Products For Telecom Data Centers
• Industry transitioning towards distributed data centers favoring our DC power systems
• In process of developing higher power DC systems for applications in data centers
Expand our Global Sales and Increase Product Line Offerings
Build OPEX Program
Increase our Commissioning and
Maintenance Service Areas
Increase the Battery Systems Polar Offers
Expand Into the Telco Data Centers
10
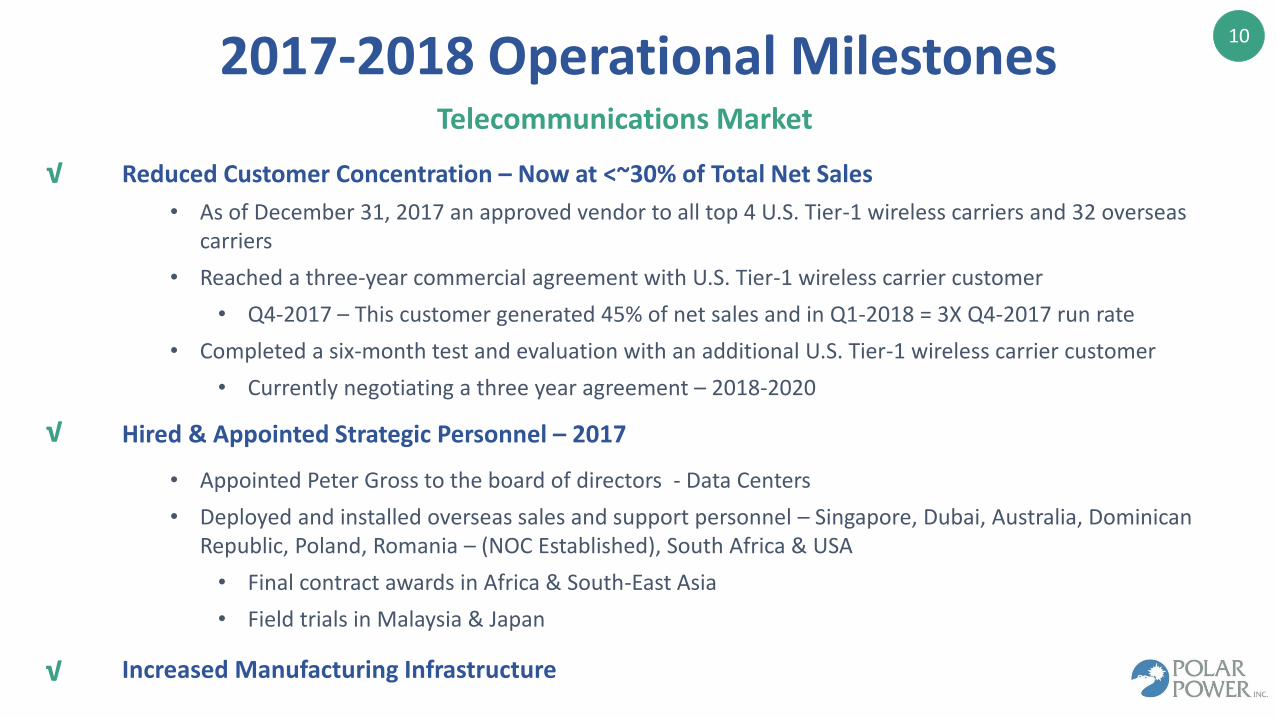
2017-2018 Operational Milestones
Reduced Customer Concentration – Now at <~30% of Total Net Sales
• As of December 31, 2017 an approved vendor to all top 4 U.S. Tier-1 wireless carriers and 32 overseas carriers
• Reached a three-year commercial agreement with U.S. Tier-1 wireless carrier customer
• Q4-2017 – This customer generated 45% of net sales and in Q1-2018 = 3X Q4-2017 run rate
• Completed a six-month test and evaluation with an additional U.S. Tier-1 wireless carrier customer
• Currently negotiating a three year agreement – 2018-2020
Hired & Appointed Strategic Personnel – 2017
• Appointed Peter Gross to the board of directors - Data Centers
• Deployed and installed overseas sales and support personnel – Singapore, Dubai, Australia, Dominican Republic, Poland, Romania – (NOC Established), South Africa & USA
• Final contract awards in Africa & South-East Asia
• Field trials in Malaysia & Japan
Increased Manufacturing Infrastructure
√
√
√
Telecommunications Market
11
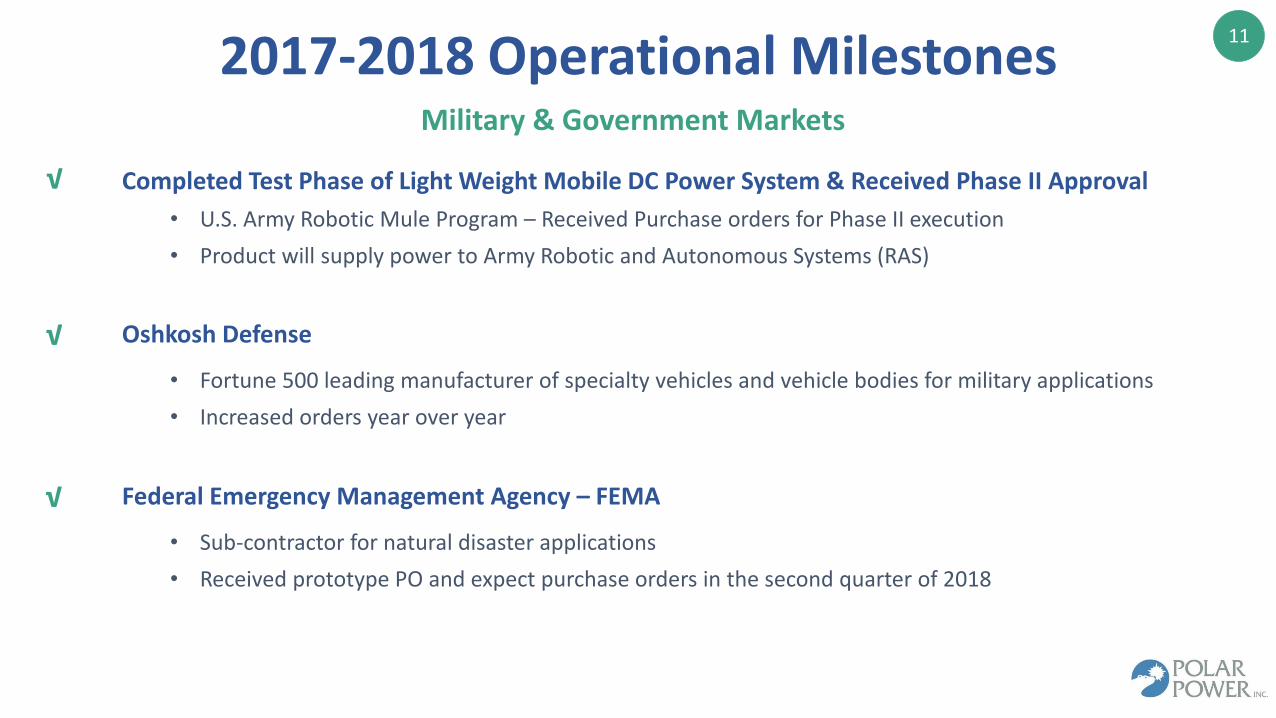
2017-2018 Operational Milestones
Completed Test Phase of Light Weight Mobile DC Power System & Received Phase II Approval
• U.S. Army Robotic Mule Program – Received Purchase orders for Phase II execution
• Product will supply power to Army Robotic and Autonomous Systems (RAS)
Oshkosh Defense
• Fortune 500 leading manufacturer of specialty vehicles and vehicle bodies for military applications
• Increased orders year over year
Federal Emergency Management Agency – FEMA
• Sub-contractor for natural disaster applications
• Received prototype PO and expect purchase orders in the second quarter of 2018
√
√
√
Military & Government Markets
12
2017-2018 Operational Milestones
Developing 200kW DC Generator
• Currently setting up engineering and marketing teams
• First prototypes target to be ready by third quarter 2018
Introduced Summit Series DC Power System for International Telecom Markets
Introduced Economical, Compact 15kW Horizontal DC Generator
• Compete with AC generator in telecom replacement market
Introduced a Mobile Trailer Mounted 10 kW DC Generator
• Off-grid applications in military, telecom and oil and gas sectors
Introduced New Technologies in Lithium Ion Battery Management
Marketing
• Exhibit actively at tradeshows: TowerXchange, Communicasia, etc.
• Truck demo
• Building sales support staff
Product Development – R&D
√
√
√
√
√
√
13
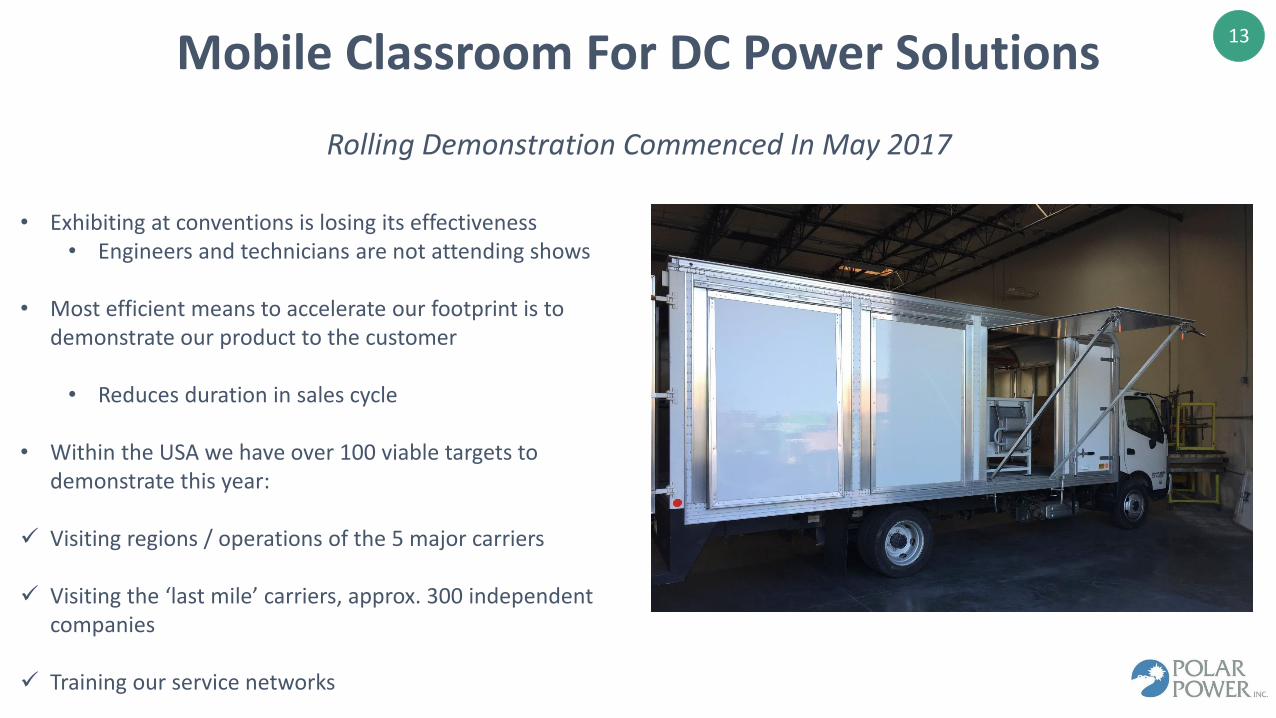
Mobile Classroom For DC Power Solutions
• Exhibiting at conventions is losing its effectiveness• Engineers and technicians are not attending shows
• Most efficient means to accelerate our footprint is to demonstrate our product to the customer
• Reduces duration in sales cycle
• Within the USA we have over 100 viable targets to demonstrate this year:
✓ Visiting regions / operations of the 5 major carriers
✓ Visiting the ‘last mile’ carriers, approx. 300 independent companies
✓ Training our service networks
Rolling Demonstration Commenced In May 2017
14
2017-2018 Operational Milestones
OPEX Model
• Procured customers’ requirements and interest levels in 2017
• Deploying new financial models in 2018
Research & Development
• Building a 200 kW DC Generator for data centers and microgrids
• Configure products as per customers’ local requirements and meet their price goals
• Expanding our engineering team with new hires
Supply Chain
• Build to stock finished assemblies and stock sub-assemblies
• Source from manufacturers directly to reduce material cost
• Bring more processes in house by investing in production infrastructure
• Quick to react to field trial requests with immediate deployments
15
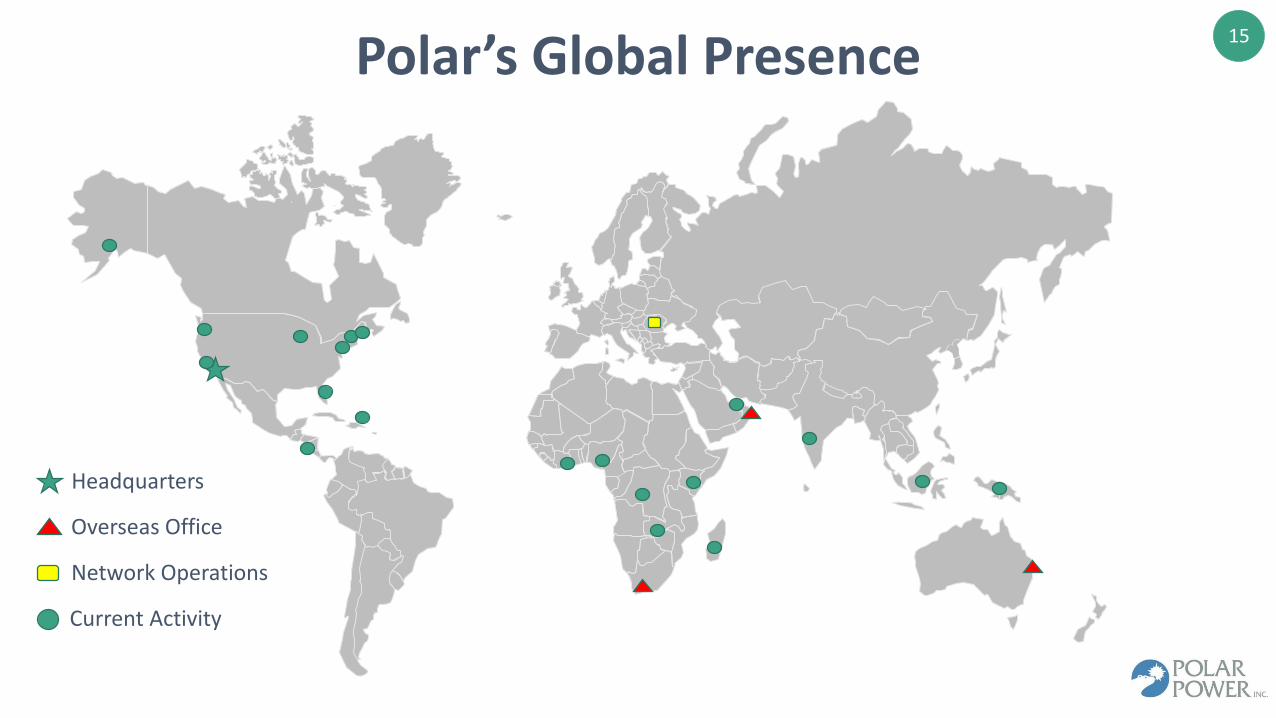
Polar’s Global Presence
Headquarters
Overseas Office
Network Operations
Current Activity
16
Financials
17
(37%) $2,500
$12,500
$22,500
$32,500
Jan. to Dec.2016
Jan. to Dec.2017
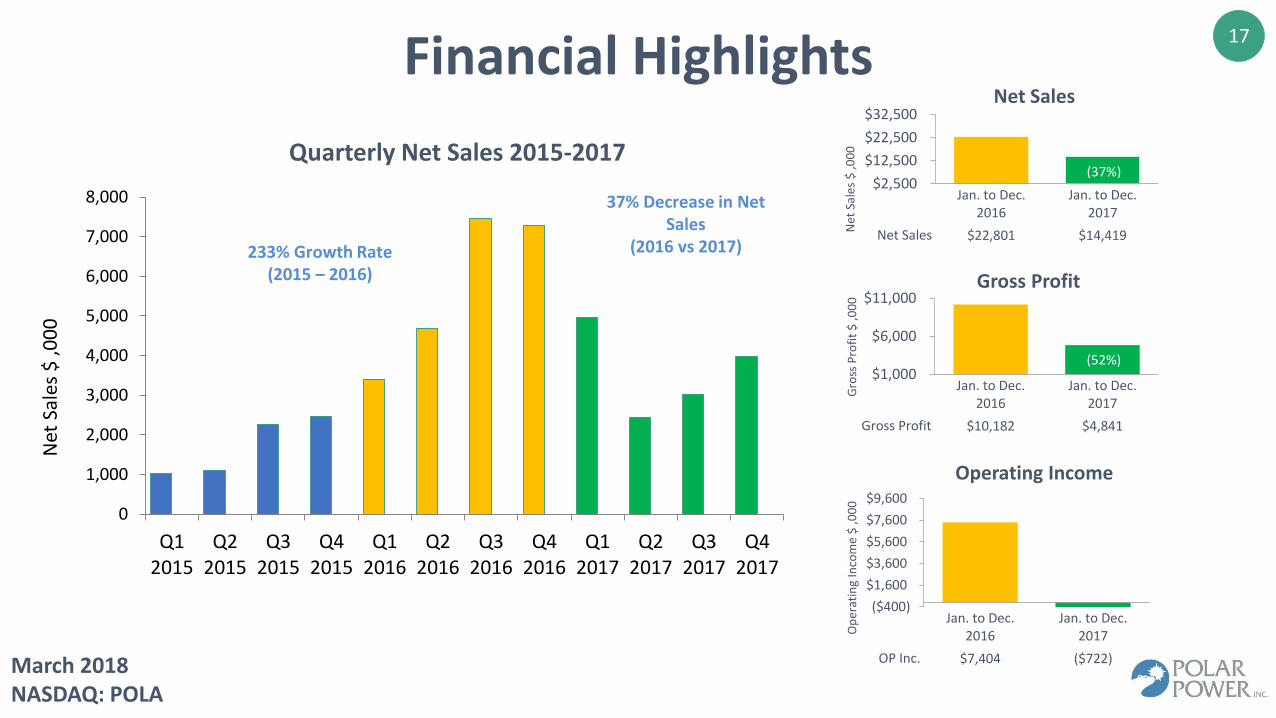
Net Sales $22,801 $14,419
(52%)$1,000
$6,000
$11,000
Jan. to Dec.2016
Jan. to Dec.2017
Gross Profit $10,182 $4,841
($400)
$1,600
$3,600
$5,600
$7,600
$9,600
Jan. to Dec.2016
Jan. to Dec.2017
OP Inc. $7,404 ($722)
Net
Sal
es $
,00
0G
ross
Pro
fit
$ ,0
00
Op
erat
ing
Inco
me
$ ,0
00
Financial HighlightsNet Sales
Operating Income
Gross Profit
March 2018NASDAQ: POLA
0
1,000
2,000
3,000
4,000
5,000
6,000
7,000
8,000
Q12015
Q22015
Q32015
Q42015
Q12016
Q22016
Q32016
Q42016
Q12017
Q22017
Q32017
Q42017
Net
Sal
es $
,00
0
37% Decrease in Net Sales
(2016 vs 2017)233% Growth Rate (2015 – 2016)
Quarterly Net Sales 2015-2017
18
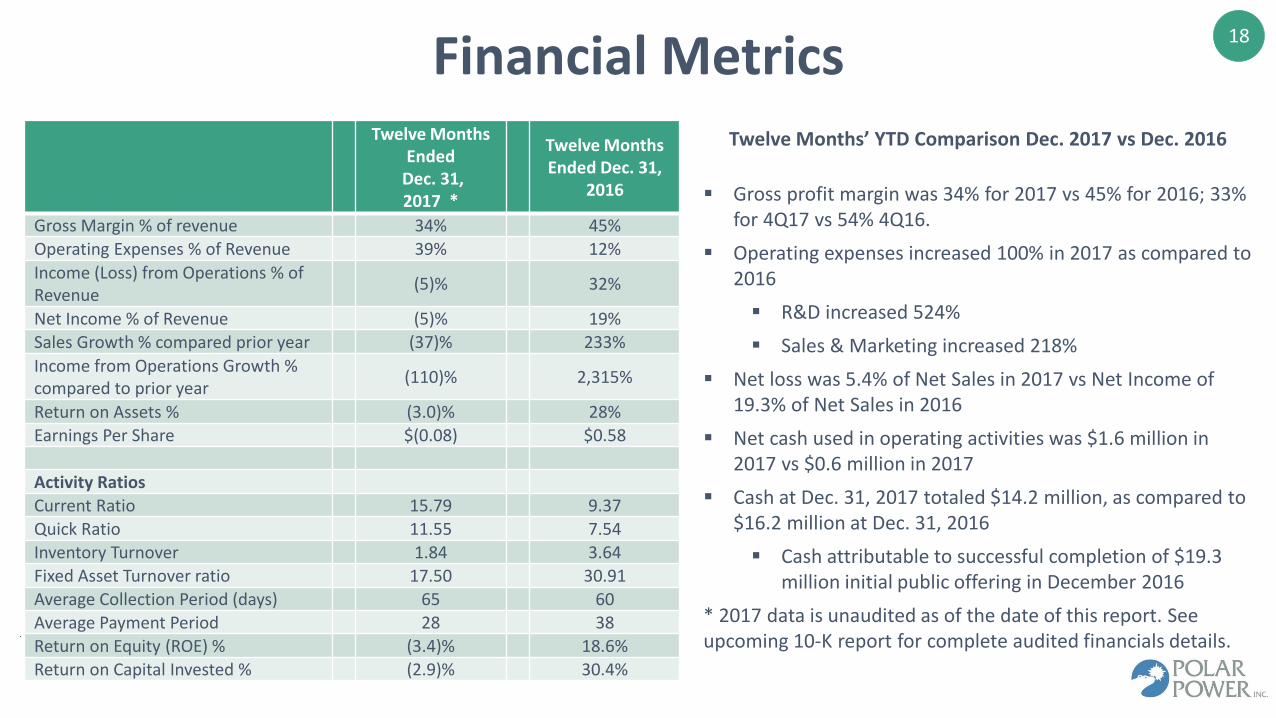
Twelve Months’ YTD Comparison Dec. 2017 vs Dec. 2016
▪ Gross profit margin was 34% for 2017 vs 45% for 2016; 33% for 4Q17 vs 54% 4Q16.
▪ Operating expenses increased 100% in 2017 as compared to 2016
▪ R&D increased 524%
▪ Sales & Marketing increased 218%
▪ Net loss was 5.4% of Net Sales in 2017 vs Net Income of 19.3% of Net Sales in 2016
▪ Net cash used in operating activities was $1.6 million in 2017 vs $0.6 million in 2017
▪ Cash at Dec. 31, 2017 totaled $14.2 million, as compared to $16.2 million at Dec. 31, 2016
▪ Cash attributable to successful completion of $19.3 million initial public offering in December 2016
* 2017 data is unaudited as of the date of this report. See upcoming 10-K report for complete audited financials details. .
Financial MetricsTwelve Months
EndedDec. 31,2017 *
Twelve Months Ended Dec. 31,
2016
Gross Margin % of revenue 34% 45%
Operating Expenses % of Revenue 39% 12%
Income (Loss) from Operations % of Revenue
(5)% 32%
Net Income % of Revenue (5)% 19%
Sales Growth % compared prior year (37)% 233%
Income from Operations Growth % compared to prior year
(110)% 2,315%
Return on Assets % (3.0)% 28%
Earnings Per Share $(0.08) $0.58
Activity Ratios
Current Ratio 15.79 9.37
Quick Ratio 11.55 7.54
Inventory Turnover 1.84 3.64
Fixed Asset Turnover ratio 17.50 30.91
Average Collection Period (days) 65 60
Average Payment Period 28 38
Return on Equity (ROE) % (3.4)% 18.6%
Return on Capital Invested % (2.9)% 30.4%
19
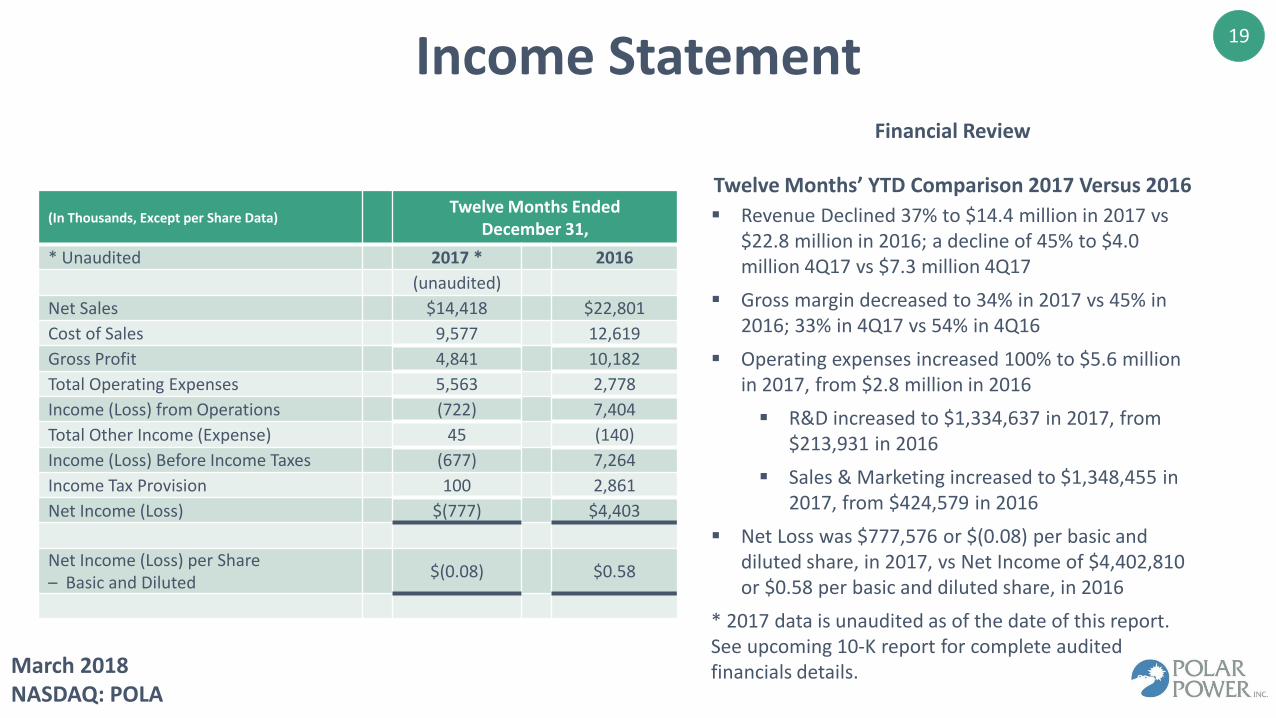
Financial Review
Twelve Months’ YTD Comparison 2017 Versus 2016
▪ Revenue Declined 37% to $14.4 million in 2017 vs $22.8 million in 2016; a decline of 45% to $4.0 million 4Q17 vs $7.3 million 4Q17
▪ Gross margin decreased to 34% in 2017 vs 45% in 2016; 33% in 4Q17 vs 54% in 4Q16
▪ Operating expenses increased 100% to $5.6 million in 2017, from $2.8 million in 2016
▪ R&D increased to $1,334,637 in 2017, from $213,931 in 2016
▪ Sales & Marketing increased to $1,348,455 in 2017, from $424,579 in 2016
▪ Net Loss was $777,576 or $(0.08) per basic and diluted share, in 2017, vs Net Income of $4,402,810 or $0.58 per basic and diluted share, in 2016
* 2017 data is unaudited as of the date of this report. See upcoming 10-K report for complete audited financials details.
Income Statement
(In Thousands, Except per Share Data)Twelve Months Ended
December 31,
* Unaudited 2017 * 2016
(unaudited)
Net Sales $14,418 $22,801
Cost of Sales 9,577 12,619
Gross Profit 4,841 10,182
Total Operating Expenses 5,563 2,778
Income (Loss) from Operations (722) 7,404
Total Other Income (Expense) 45 (140)
Income (Loss) Before Income Taxes (677) 7,264
Income Tax Provision 100 2,861
Net Income (Loss) $(777) $4,403
Net Income (Loss) per Share – Basic and Diluted
$(0.08) $0.58
March 2018NASDAQ: POLA
20
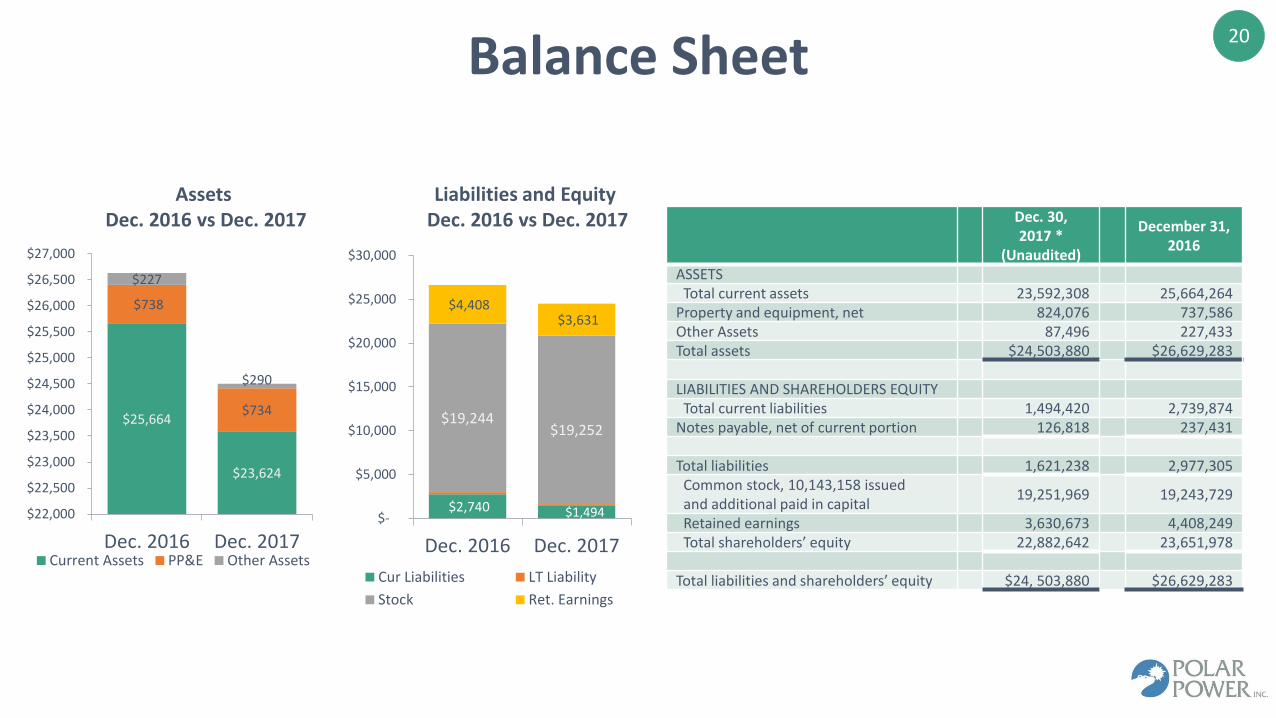
Balance Sheet
$25,664
$23,624
$738
$734
$227
$290
$22,000
$22,500
$23,000
$23,500
$24,000
$24,500
$25,000
$25,500
$26,000
$26,500
$27,000
Dec. 2016 Dec. 2017Current Assets PP&E Other Assets
$2,740 $1,494
$19,244 $19,252
$4,408 $3,631
$-
$5,000
$10,000
$15,000
$20,000
$25,000
$30,000
Dec. 2016 Dec. 2017
Cur Liabilities LT Liability
Stock Ret. Earnings
Assets Dec. 2016 vs Dec. 2017
Liabilities and Equity Dec. 2016 vs Dec. 2017 Dec. 30,
2017 * (Unaudited)
December 31,2016
ASSETSTotal current assets 23,592,308 25,664,264
Property and equipment, net 824,076 737,586Other Assets 87,496 227,433Total assets $24,503,880 $26,629,283
LIABILITIES AND SHAREHOLDERS EQUITYTotal current liabilities 1,494,420 2,739,874
Notes payable, net of current portion 126,818 237,431
Total liabilities 1,621,238 2,977,305Common stock, 10,143,158 issuedand additional paid in capital
19,251,969 19,243,729
Retained earnings 3,630,673 4,408,249Total shareholders’ equity 22,882,642 23,651,978
Total liabilities and shareholders’ equity $24, 503,880 $26,629,283
21
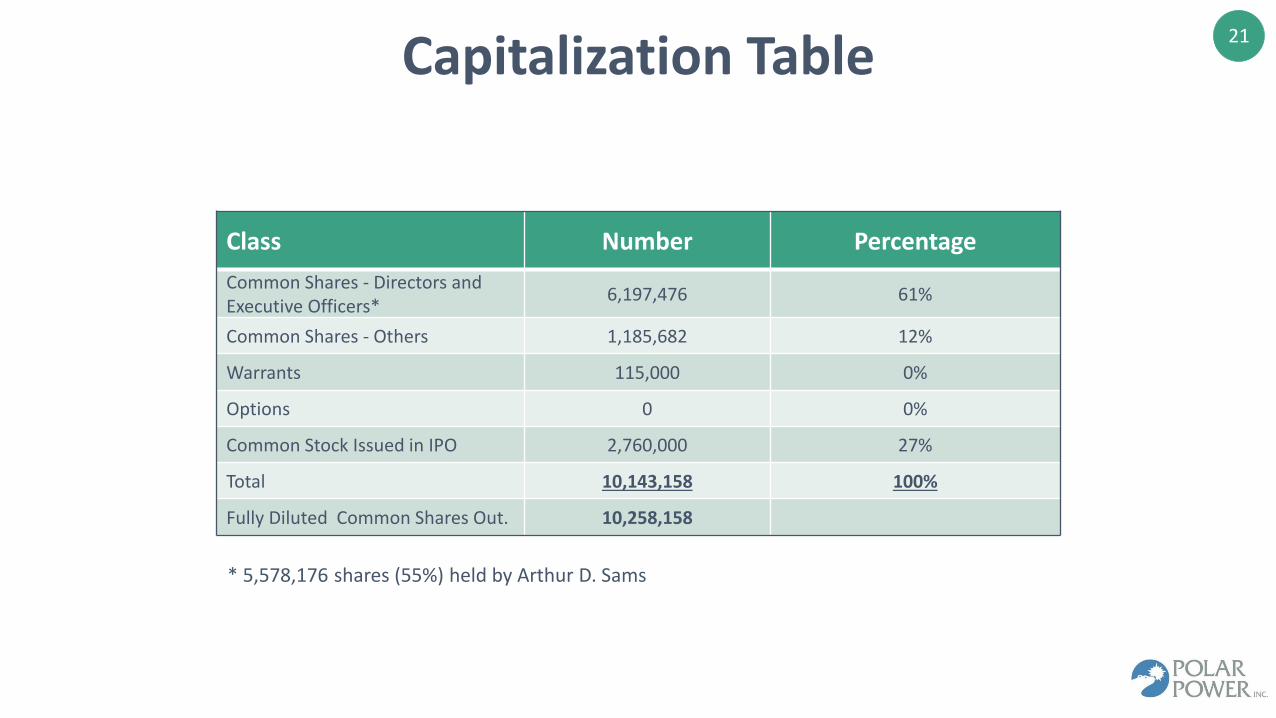
Capitalization Table
Class Number Percentage
Common Shares - Directors and Executive Officers*
6,197,476 61%
Common Shares - Others 1,185,682 12%
Warrants 115,000 0%
Options 0 0%
Common Stock Issued in IPO 2,760,000 27%
Total 10,143,158 100%
Fully Diluted Common Shares Out. 10,258,158
* 5,578,176 shares (55%) held by Arthur D. Sams

22
Key Management
ARTHUR D. SAMS LUIS ZAVALA RAJ MASINA
CEO and President CFO COO
• Since 1991, has served as our President, Chief Executive Officer and Chairman of our board of directors.
• In his career, has worked as a consultant to numerous Fortune 500 companies, the U.S. Department of Defense and U.S. Department of Energy
• 45 years experience in engineering, machinery, sales, marketing, project manager & CTO and President roles
• 2016 – Chief Financial Officer of Polar Power
• 2009 – 2016 - Vice President of Finance – Polar Power
• 2006 – 2009 - President of Sky Limited Enterprises (General Contractor)
• 2001 – 2006 - Director of Finance for Legacy Long Distance International
• 20 years experience in managing accounting and finance departments
• 2017 – Chief Operations Officer of Polar Power
• 2009 – 2017 – Vice President of Operations of Polar Power
• 2008 – 2009 – Supply chain consultant to International Game Technology
• 2006 – 2008 – Assistant manager for Applied Photonics Worldwide
• 15 years experience in engineering, business analytics, supply chain management and strategic planning
23
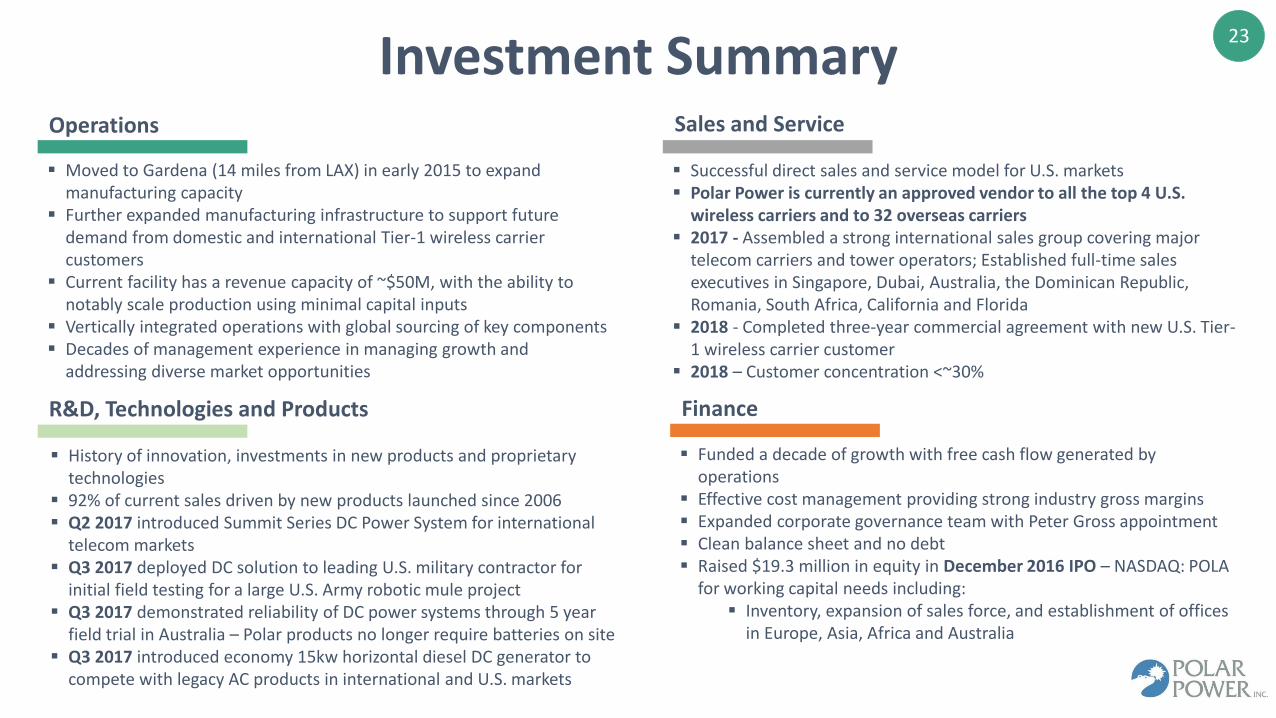
▪ History of innovation, investments in new products and proprietary technologies
▪ 92% of current sales driven by new products launched since 2006▪ Q2 2017 introduced Summit Series DC Power System for international
telecom markets▪ Q3 2017 deployed DC solution to leading U.S. military contractor for
initial field testing for a large U.S. Army robotic mule project▪ Q3 2017 demonstrated reliability of DC power systems through 5 year
field trial in Australia – Polar products no longer require batteries on site▪ Q3 2017 introduced economy 15kw horizontal diesel DC generator to
compete with legacy AC products in international and U.S. markets
▪ Moved to Gardena (14 miles from LAX) in early 2015 to expand manufacturing capacity
▪ Further expanded manufacturing infrastructure to support future demand from domestic and international Tier-1 wireless carrier customers
▪ Current facility has a revenue capacity of ~$50M, with the ability to notably scale production using minimal capital inputs
▪ Vertically integrated operations with global sourcing of key components▪ Decades of management experience in managing growth and
addressing diverse market opportunities
▪ Successful direct sales and service model for U.S. markets▪ Polar Power is currently an approved vendor to all the top 4 U.S.
wireless carriers and to 32 overseas carriers▪ 2017 - Assembled a strong international sales group covering major
telecom carriers and tower operators; Established full-time sales executives in Singapore, Dubai, Australia, the Dominican Republic, Romania, South Africa, California and Florida
▪ 2018 - Completed three-year commercial agreement with new U.S. Tier-1 wireless carrier customer
▪ 2018 – Customer concentration <~30%
▪ Funded a decade of growth with free cash flow generated by operations
▪ Effective cost management providing strong industry gross margins ▪ Expanded corporate governance team with Peter Gross appointment ▪ Clean balance sheet and no debt▪ Raised $19.3 million in equity in December 2016 IPO – NASDAQ: POLA
for working capital needs including: ▪ Inventory, expansion of sales force, and establishment of offices
in Europe, Asia, Africa and Australia
Operations
Finance
Sales and Service
R&D, Technologies and Products
Investment Summary
24
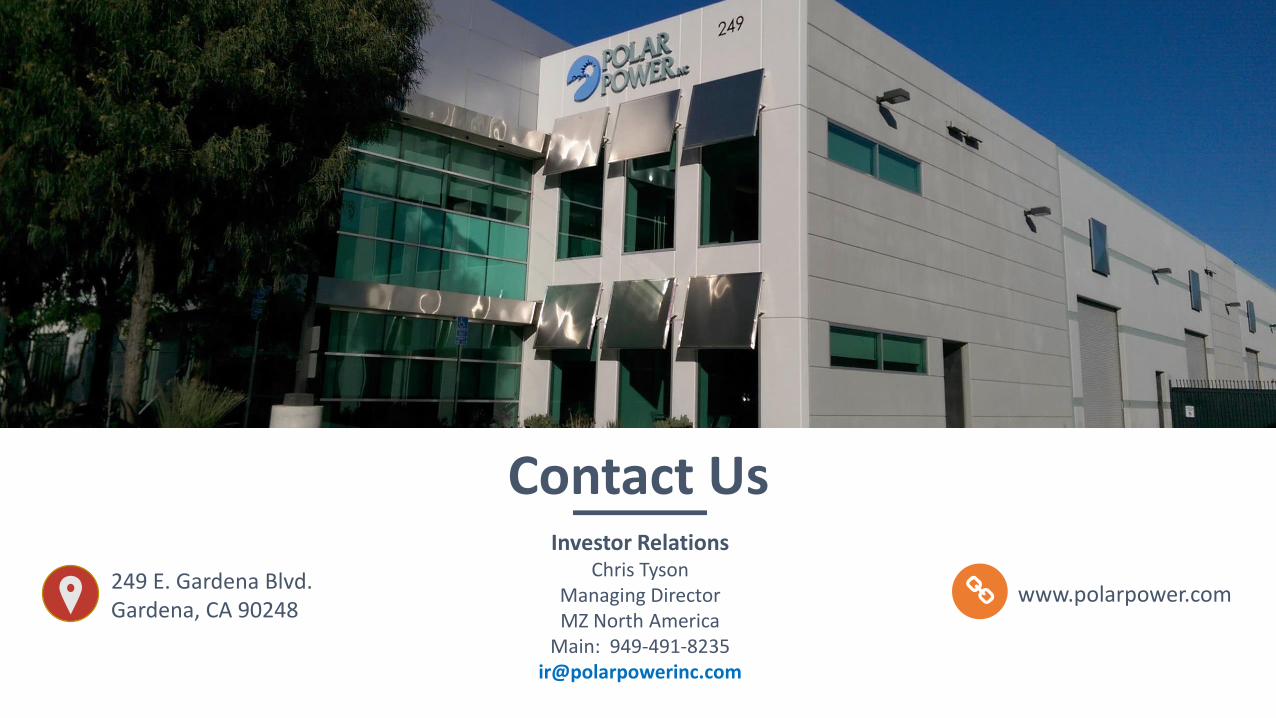
Contact Us
www.polarpower.com249 E. Gardena Blvd.Gardena, CA 90248
Investor RelationsChris Tyson
Managing Director MZ North America
Main: [email protected]
25
Thank You
26
Other Projects Reflecting Market Opportunities and Polar Capabilities
Appendix
27
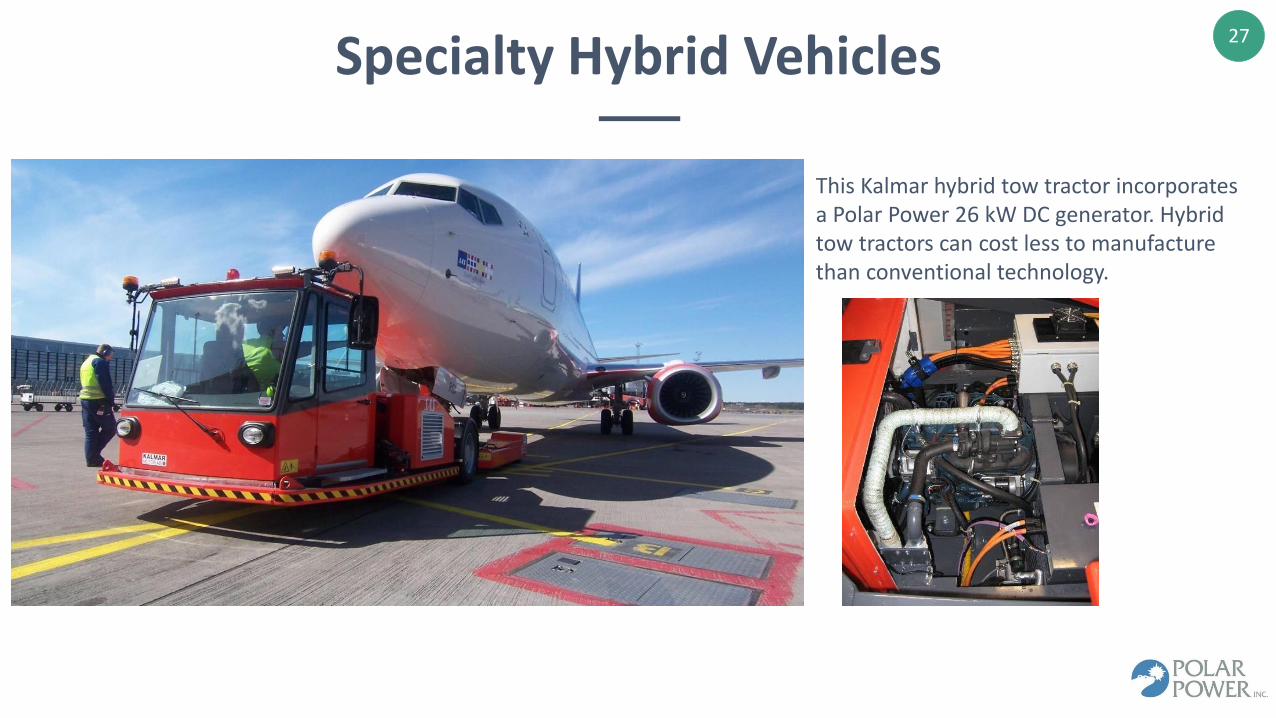
Specialty Hybrid Vehicles
This Kalmar hybrid tow tractor incorporates a Polar Power 26 kW DC generator. Hybrid tow tractors can cost less to manufacture than conventional technology.

28
Mobile Solar Hybrid SUSS Trailer
Small Unit Sustainment System, or SUSS, provides temporary power for shelters, communications, oil and mining work camps, and military expeditions.
Enables emergency service teams and first responders to quickly set up a command center or emergency shelter in time-critical situations.
This SUSS is powered by Polar 10kW diesel generator with solar array assembled and presented to the military by HDT Global.
Currently under US Army field trails in Hawaii. For more info see: https://www.army.mil/article/179906.
29
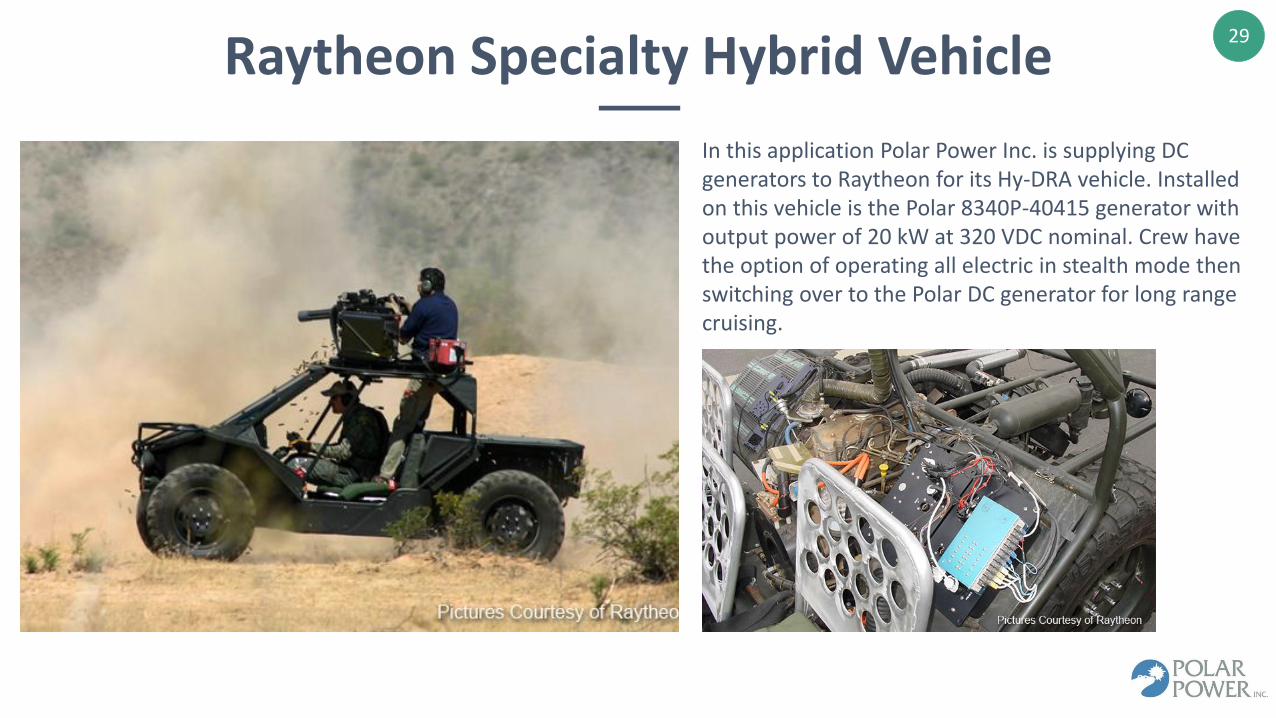
Raytheon Specialty Hybrid Vehicle
In this application Polar Power Inc. is supplying DC generators to Raytheon for its Hy-DRA vehicle. Installed on this vehicle is the Polar 8340P-40415 generator with output power of 20 kW at 320 VDC nominal. Crew have the option of operating all electric in stealth mode then switching over to the Polar DC generator for long range cruising.
30
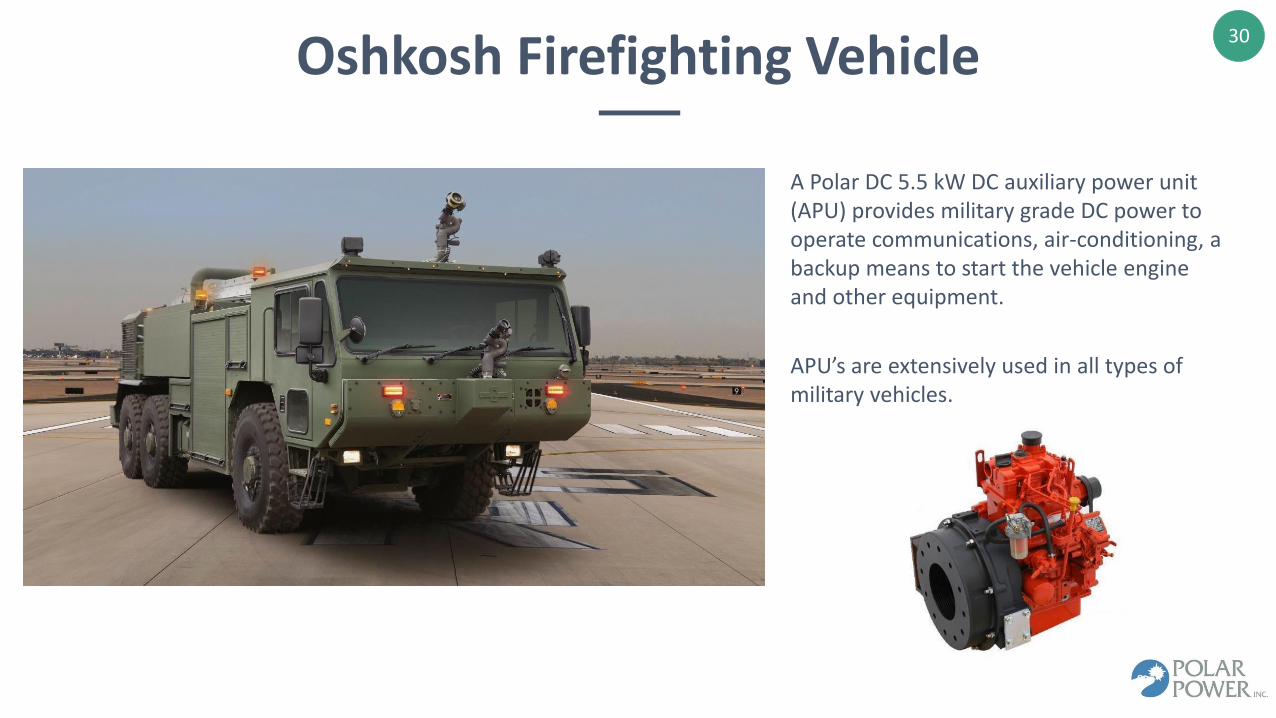
Oshkosh Firefighting Vehicle
A Polar DC 5.5 kW DC auxiliary power unit (APU) provides military grade DC power to operate communications, air-conditioning, a backup means to start the vehicle engine and other equipment.
APU’s are extensively used in all types of military vehicles.
31
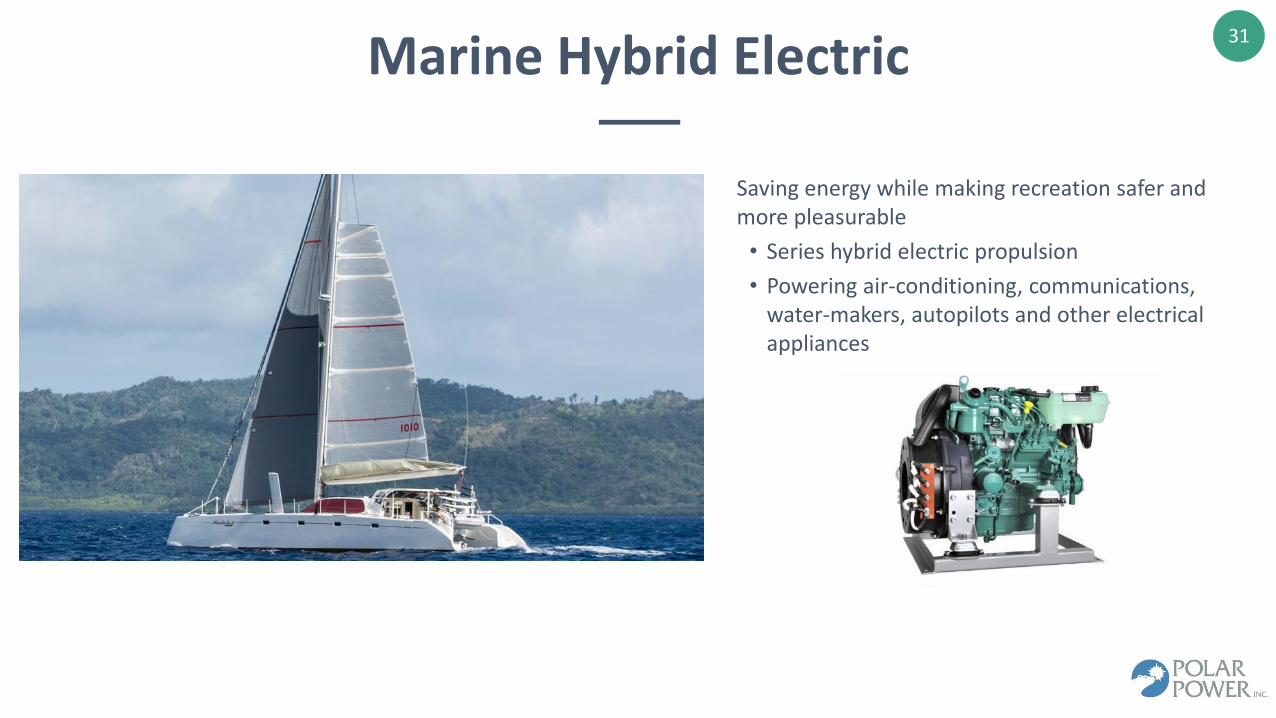
Marine Hybrid Electric
Saving energy while making recreation safer and more pleasurable
• Series hybrid electric propulsion
• Powering air-conditioning, communications, water-makers, autopilots and other electrical appliances
32
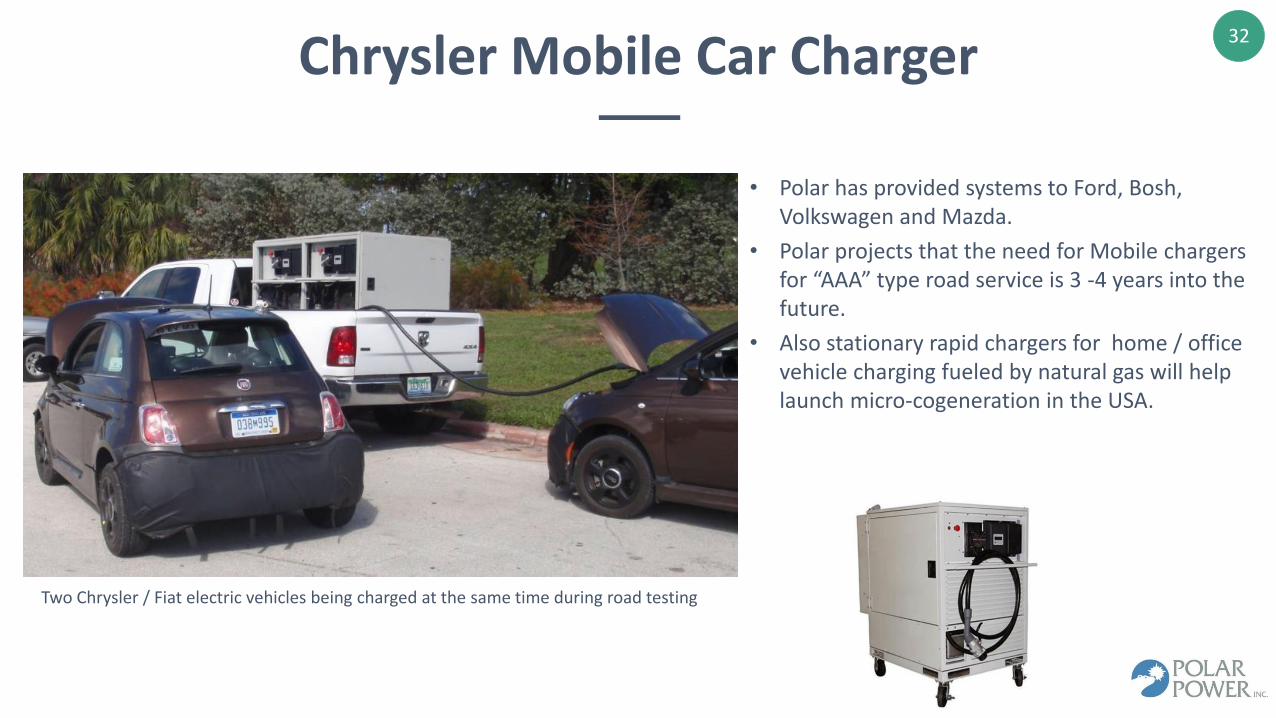
Chrysler Mobile Car Charger
• Polar has provided systems to Ford, Bosh, Volkswagen and Mazda.
• Polar projects that the need for Mobile chargers for “AAA” type road service is 3 -4 years into the future.
• Also stationary rapid chargers for home / office vehicle charging fueled by natural gas will help launch micro-cogeneration in the USA.
Two Chrysler / Fiat electric vehicles being charged at the same time during road testing

33
DC Product Portfolio
Appendix

34
Competitor’s Product:Leroy SomerAC Model 42.2Power: 16kWWeight: 246 LBSLength: 18 IN
Polar Power AlternatorDC Model 8220Power: 22kW Weight: 49 LBSLength: 5.5 IN
SIMPLICITY = RELIABILITY
Polar Power Alternator Vs AC Alternator
3X Larger
35
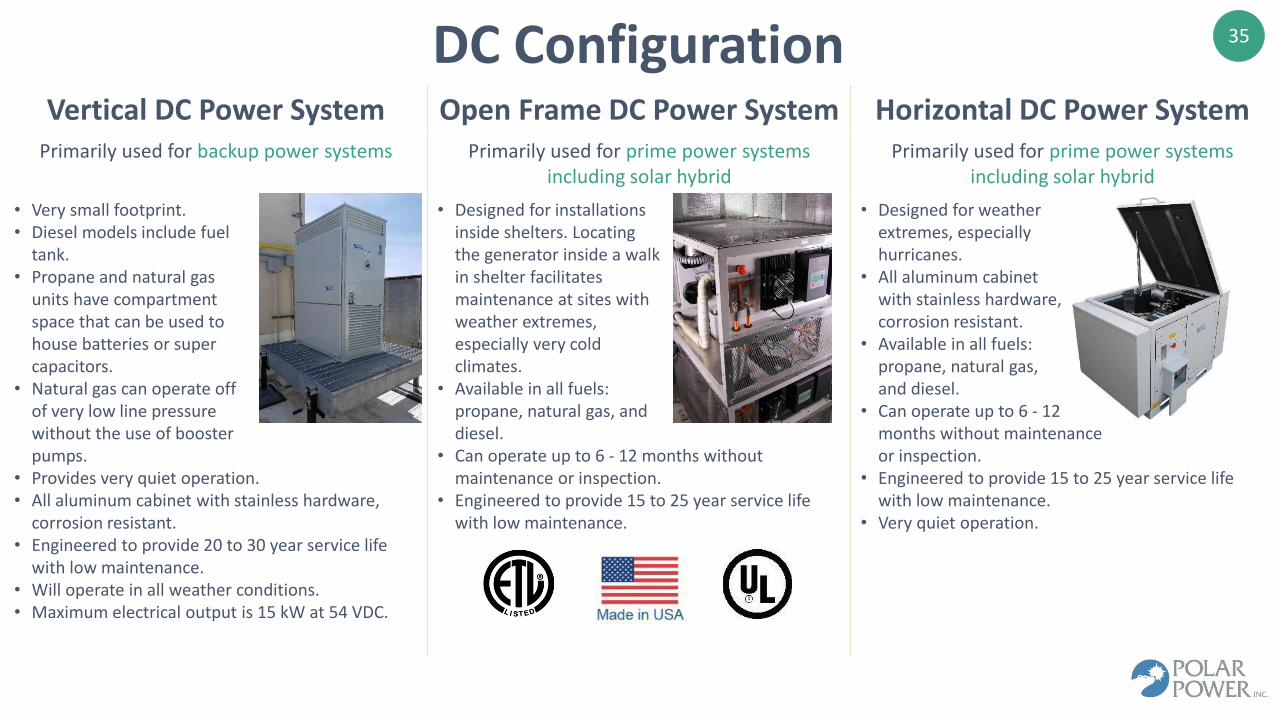
Vertical DC Power System Open Frame DC Power System Horizontal DC Power SystemPrimarily used for backup power systems Primarily used for prime power systems
including solar hybridPrimarily used for prime power systems
including solar hybrid
• Very small footprint.• Diesel models include fuel
tank.• Propane and natural gas
units have compartment space that can be used to house batteries or super capacitors.
• Natural gas can operate off of very low line pressure without the use of booster pumps.
• Provides very quiet operation.• All aluminum cabinet with stainless hardware,
corrosion resistant.• Engineered to provide 20 to 30 year service life
with low maintenance.• Will operate in all weather conditions.• Maximum electrical output is 15 kW at 54 VDC.
• Designed for installations inside shelters. Locating the generator inside a walk in shelter facilitates maintenance at sites with weather extremes, especially very cold climates.
• Available in all fuels: propane, natural gas, and diesel.
• Can operate up to 6 - 12 months without maintenance or inspection.
• Engineered to provide 15 to 25 year service life with low maintenance.
• Designed for weather extremes, especially hurricanes.
• All aluminum cabinet with stainless hardware, corrosion resistant.
• Available in all fuels: propane, natural gas, and diesel.
• Can operate up to 6 - 12 months without maintenance or inspection.
• Engineered to provide 15 to 25 year service life with low maintenance.
• Very quiet operation.
DC Configuration
36
0
50
100
150
200
250
300
350
400
450
1 2 3 4
GA
LLO
NS
PER
WEE
K
Average Fuel Consumption a Week
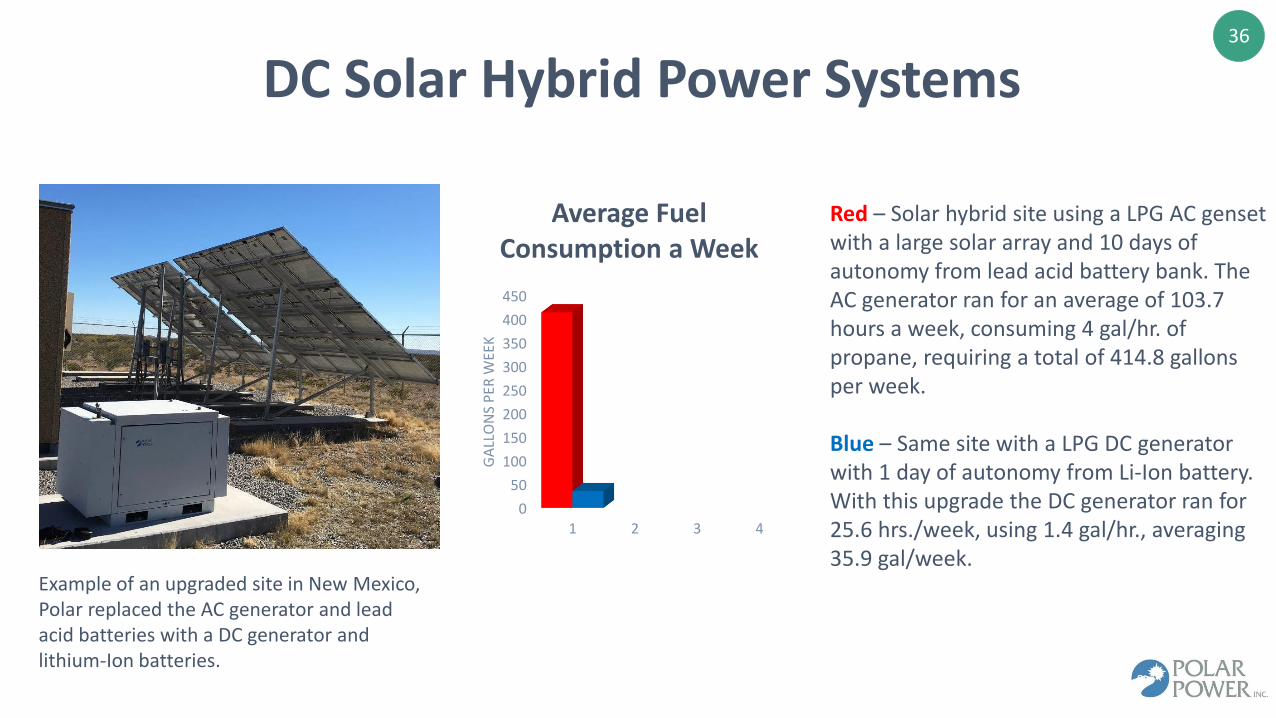
Red – Solar hybrid site using a LPG AC genset with a large solar array and 10 days of autonomy from lead acid battery bank. The AC generator ran for an average of 103.7 hours a week, consuming 4 gal/hr. of propane, requiring a total of 414.8 gallons per week.
Blue – Same site with a LPG DC generator with 1 day of autonomy from Li-Ion battery. With this upgrade the DC generator ran for 25.6 hrs./week, using 1.4 gal/hr., averaging 35.9 gal/week.
Example of an upgraded site in New Mexico, Polar replaced the AC generator and lead acid batteries with a DC generator and lithium-Ion batteries.
DC Solar Hybrid Power Systems

37
Supra Digital Control System Remote Control and Monitoring Improves Reliability and Lowers Maintenance Cost
PROPRIETARY DIGITAL CONTROL SYSTEM
Supra Control System Integrates:
▪ Proprietary technology developed and manufactured in house
▪ Remote monitoring & control
▪ Complete alternator & engine control
▪ Controls battery charging frommultiple power sources
▪ Plug and Play troubleshooting and repair

38
• Remote monitoring and control of sites from anywhere in the world
• Reduces maintenance costs
• Improves reliability
• Foundation for Rental / Micro-Utility / OPEX
• Designed to support 99.9% network up-time
• Polar’s Hybrid system reduces fuel costs
• Combines a low CAPEX fuel energy source with a low OPEX renewable energy for low cost sustainable power
Polar Remote Control and Monitoring Improves Reliability
Lowers Maintenance Cost
Global Network
Polar Supra Control System
Polar DC Generator High Efficiency
Low Capital Cost
Polar Li-Ion Battery Energy
Storage
Solar and Wind Power Renewable Energy Low Operating Cost
Cell Tower
DC Microgrid Low Cost Sustainable Power Over 3.3 Million
Cell Sites Worldwide (1)
Diagram of a Polar Power System
March 2018NASDAQ: POLA
(1) Source – CTIA.org