PÖYRY POINT OF VIEW - MAY 2018 Fully … · 2 PÖYR POINT F VIEW PÖYR POINT F VIE 3 Decarbonising...
9
Fully decarbonising Europe’s energy system by 2050 PÖYRY POINT OF VIEW - MAY 2018
-
Upload
vuongkhanh -
Category
Documents
-
view
214 -
download
0
Transcript of PÖYRY POINT OF VIEW - MAY 2018 Fully … · 2 PÖYR POINT F VIEW PÖYR POINT F VIE 3 Decarbonising...
Fully decarbonising Europe’s energy system by 2050
PÖYRY POINT OF VIEW - MAY 2018
3 2 | PÖYRY POINT OF VIEW PÖYRY POINT OF VIEW |
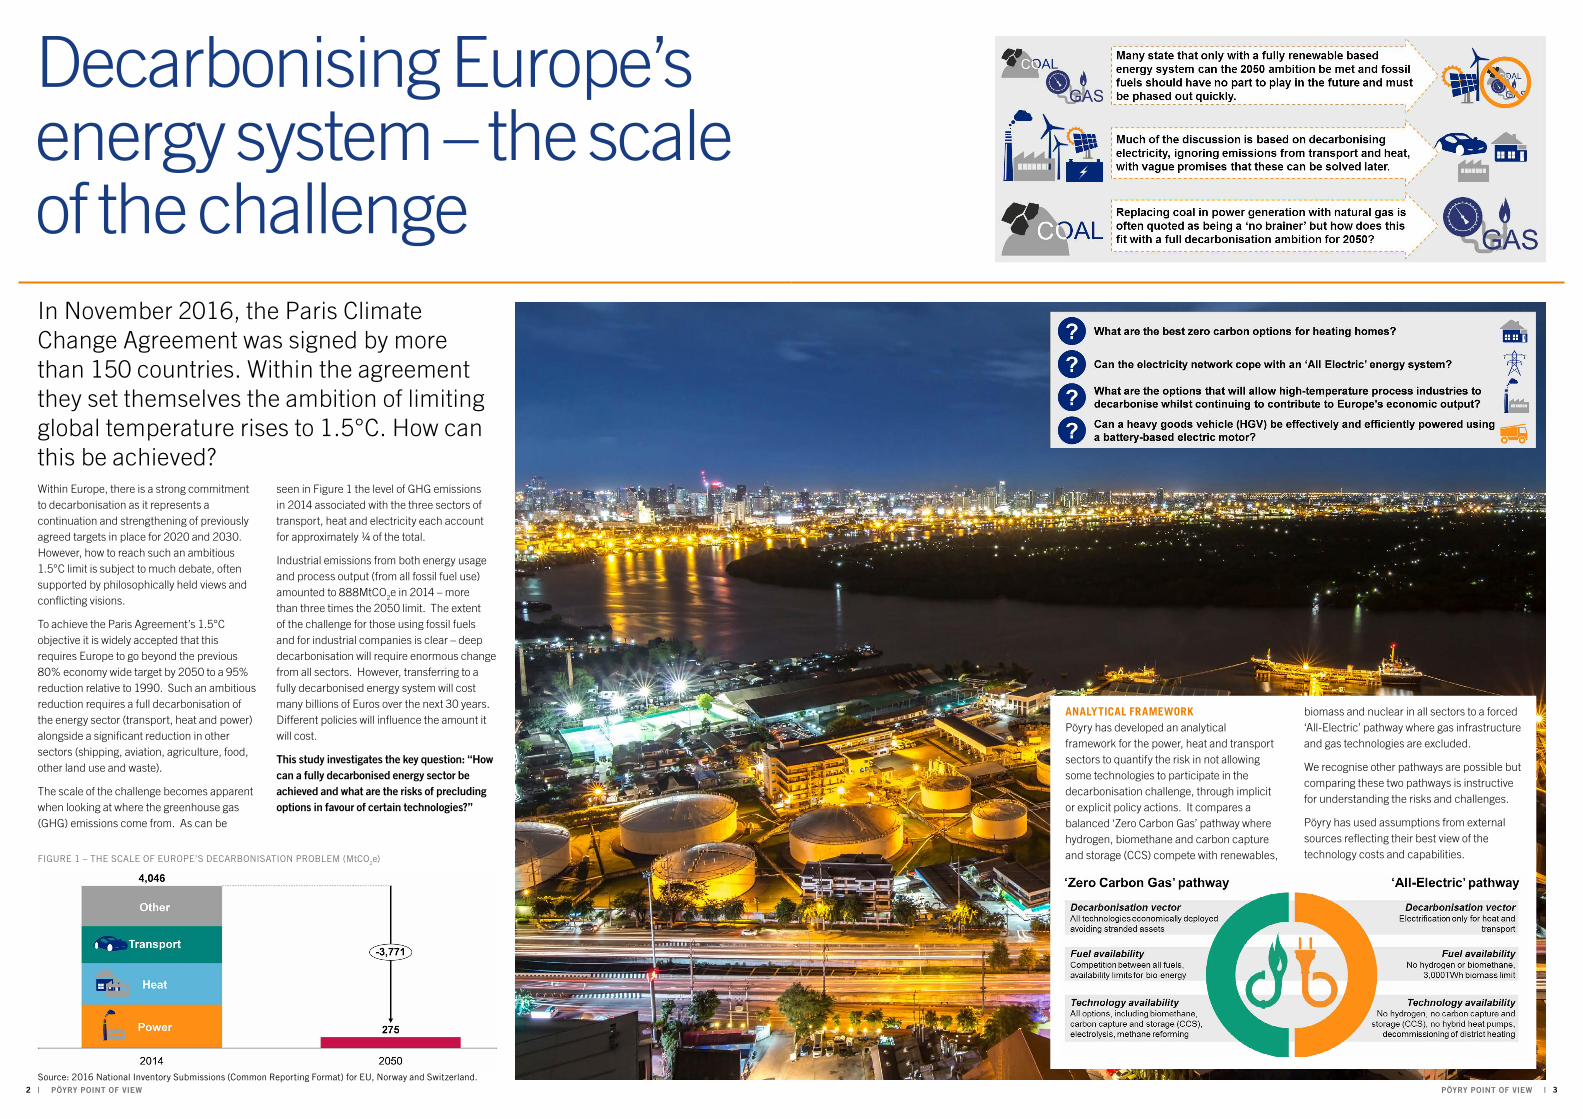
Decarbonising Europe’s energy system – the scale of the challengeIn November 2016, the Paris Climate Change Agreement was signed by more than 150 countries. Within the agreement they set themselves the ambition of limiting global temperature rises to 1.5°C. How can this be achieved?Within Europe, there is a strong commitment to decarbonisation as it represents a continuation and strengthening of previously agreed targets in place for 2020 and 2030. However, how to reach such an ambitious 1.5°C limit is subject to much debate, often supported by philosophically held views and conflicting visions.
To achieve the Paris Agreement’s 1.5°C objective it is widely accepted that this requires Europe to go beyond the previous 80% economy wide target by 2050 to a 95% reduction relative to 1990. Such an ambitious reduction requires a full decarbonisation of the energy sector (transport, heat and power) alongside a significant reduction in other sectors (shipping, aviation, agriculture, food, other land use and waste).
The scale of the challenge becomes apparent when looking at where the greenhouse gas (GHG) emissions come from. As can be
seen in Figure 1 the level of GHG emissions in 2014 associated with the three sectors of transport, heat and electricity each account for approximately ¼ of the total.
Industrial emissions from both energy usage and process output (from all fossil fuel use) amounted to 888MtCO2e in 2014 – more than three times the 2050 limit. The extent of the challenge for those using fossil fuels and for industrial companies is clear – deep decarbonisation will require enormous change from all sectors. However, transferring to a fully decarbonised energy system will cost many billions of Euros over the next 30 years. Different policies will influence the amount it will cost.
This study investigates the key question: “How can a fully decarbonised energy sector be achieved and what are the risks of precluding options in favour of certain technologies?”
FIGURE 1 – THE SCALE OF EUROPE’S DECARBONISATION PROBLEM (MtCO2e)
Source: 2016 National Inventory Submissions (Common Reporting Format) for EU, Norway and Switzerland.
ANALYTICAL FRAMEWORKPöyry has developed an analytical framework for the power, heat and transport sectors to quantify the risk in not allowing some technologies to participate in the decarbonisation challenge, through implicit or explicit policy actions. It compares a balanced ‘Zero Carbon Gas’ pathway where hydrogen, biomethane and carbon capture and storage (CCS) compete with renewables,
biomass and nuclear in all sectors to a forced ‘All-Electric’ pathway where gas infrastructure and gas technologies are excluded.
We recognise other pathways are possible but comparing these two pathways is instructive for understanding the risks and challenges.
Pöyry has used assumptions from external sources reflecting their best view of the technology costs and capabilities.
5 4 | PÖYRY POINT OF VIEW PÖYRY POINT OF VIEW |
‘Zero Carbon Gas’ pathway
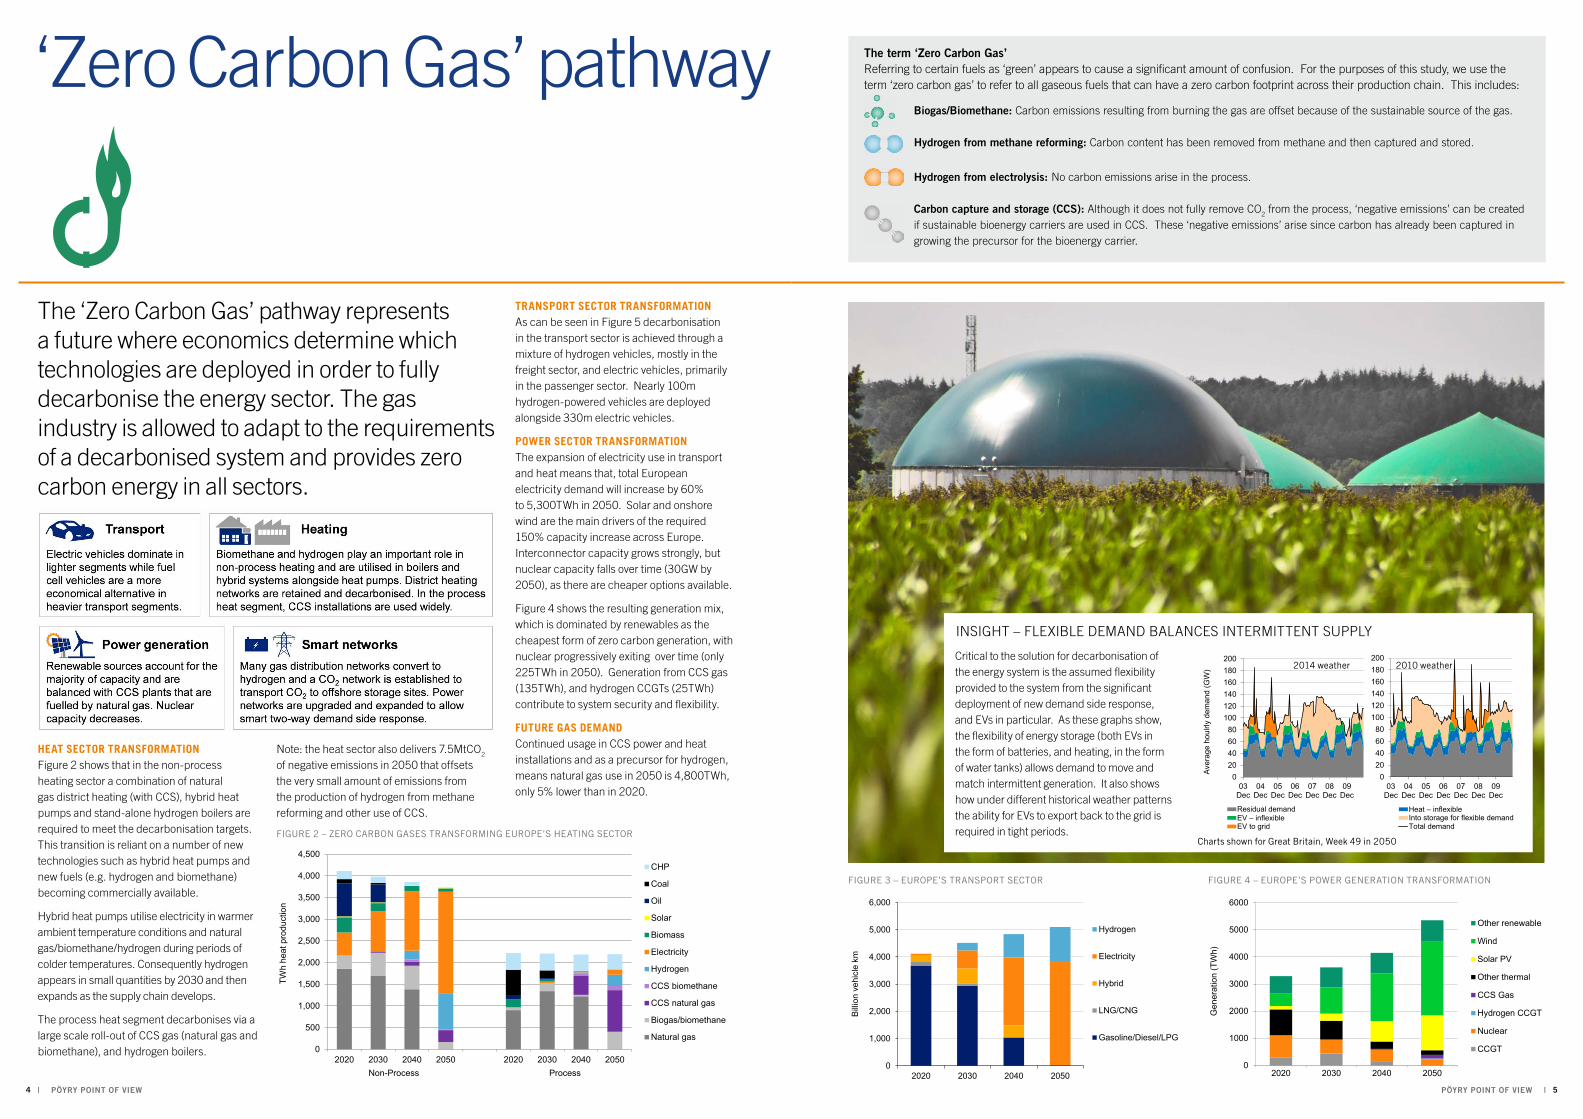
The ‘Zero Carbon Gas’ pathway represents a future where economics determine which technologies are deployed in order to fully decarbonise the energy sector. The gas industry is allowed to adapt to the requirements of a decarbonised system and provides zero carbon energy in all sectors.
HEAT SECTOR TRANSFORMATION Figure 2 shows that in the non-process heating sector a combination of natural gas district heating (with CCS), hybrid heat pumps and stand-alone hydrogen boilers are required to meet the decarbonisation targets. This transition is reliant on a number of new technologies such as hybrid heat pumps and new fuels (e.g. hydrogen and biomethane) becoming commercially available.
Hybrid heat pumps utilise electricity in warmer ambient temperature conditions and natural gas/biomethane/hydrogen during periods of colder temperatures. Consequently hydrogen appears in small quantities by 2030 and then expands as the supply chain develops.
The process heat segment decarbonises via a large scale roll-out of CCS gas (natural gas and biomethane), and hydrogen boilers.
Note: the heat sector also delivers 7.5MtCO2 of negative emissions in 2050 that offsets the very small amount of emissions from the production of hydrogen from methane reforming and other use of CCS.
The term ‘Zero Carbon Gas’Referring to certain fuels as ‘green’ appears to cause a significant amount of confusion. For the purposes of this study, we use the term ‘zero carbon gas’ to refer to all gaseous fuels that can have a zero carbon footprint across their production chain. This includes:
Biogas/Biomethane: Carbon emissions resulting from burning the gas are offset because of the sustainable source of the gas.
Hydrogen from methane reforming: Carbon content has been removed from methane and then captured and stored.
Hydrogen from electrolysis: No carbon emissions arise in the process.
Carbon capture and storage (CCS): Although it does not fully remove CO2 from the process, ‘negative emissions’ can be created if sustainable bioenergy carriers are used in CCS. These ‘negative emissions’ arise since carbon has already been captured in growing the precursor for the bioenergy carrier.
0
1,000
2,000
3,000
4,000
5,000
6,000
2020 2030 2040 2050
Bill
ion
vehi
cle
km
Hydrogen
Electricity
Hybrid
LNG/CNG
Gasoline/Diesel/LPG
0
1000
2000
3000
4000
5000
6000
2020 2030 2040 2050
Gen
erat
ion
(TW
h)
Other renewable
Wind
Solar PV
Other thermal
CCS Gas
Hydrogen CCGT
Nuclear
CCGT
TRANSPORT SECTOR TRANSFORMATIONAs can be seen in Figure 5 decarbonisation in the transport sector is achieved through a mixture of hydrogen vehicles, mostly in the freight sector, and electric vehicles, primarily in the passenger sector. Nearly 100m hydrogen-powered vehicles are deployed alongside 330m electric vehicles.
POWER SECTOR TRANSFORMATIONThe expansion of electricity use in transport and heat means that, total European electricity demand will increase by 60% to 5,300TWh in 2050. Solar and onshore wind are the main drivers of the required 150% capacity increase across Europe. Interconnector capacity grows strongly, but nuclear capacity falls over time (30GW by 2050), as there are cheaper options available.
Figure 4 shows the resulting generation mix, which is dominated by renewables as the cheapest form of zero carbon generation, with nuclear progressively exiting over time (only 225TWh in 2050). Generation from CCS gas (135TWh), and hydrogen CCGTs (25TWh) contribute to system security and flexibility.
FUTURE GAS DEMANDContinued usage in CCS power and heat installations and as a precursor for hydrogen, means natural gas use in 2050 is 4,800TWh, only 5% lower than in 2020.
FIGURE 3 – EUROPE’S TRANSPORT SECTOR
FIGURE 2 – ZERO CARBON GASES TRANSFORMING EUROPE’S HEATING SECTOR
FIGURE 4 – EUROPE’S POWER GENERATION TRANSFORMATION
INSIGHT – FLEXIBLE DEMAND BALANCES INTERMITTENT SUPPLY
Critical to the solution for decarbonisation of the energy system is the assumed flexibility provided to the system from the significant deployment of new demand side response, and EVs in particular. As these graphs show, the flexibility of energy storage (both EVs in the form of batteries, and heating, in the form of water tanks) allows demand to move and match intermittent generation. It also shows how under different historical weather patterns the ability for EVs to export back to the grid is required in tight periods.
020406080
100120140160180200
03Dec
04Dec
05Dec
06Dec
07Dec
08Dec
09Dec
Aver
age
houl
rly d
eman
d (G
W)
Residual demand Heat ‒ inflexibleEV ‒ inflexible Into storage for flexible demandEV to grid Total demand
020406080
100120140160180200
03Dec
04Dec
05Dec
06Dec
07Dec
08Dec
09Dec
Residual demand Heat - inflexibleEV - inflexible Into storage for flexible demandEV to grid Total demand
020406080
100120140160180200
03Dec
04Dec
05Dec
06Dec
07Dec
08Dec
09Dec
Aver
age
houl
rly d
eman
d (G
W)
Residual demand Heat ‒ inflexibleEV ‒ inflexible Into storage for flexible demandEV to grid Total demand
Charts shown for Great Britain, Week 49 in 2050
2014 weather 2010 weather
0
500
1,000
1,500
2,000
2,500
3,000
3,500
4,000
4,500
2020 2030 2040 2050 2020 2030 2040 2050
TWh
heat
pro
duct
ion
CHP
Coal
Oil
Solar
Biomass
Electricity
Hydrogen
CCS biomethane
CCS natural gas
Biogas/biomethane
Natural gas
Non-Process Process

7 6 | PÖYRY POINT OF VIEW PÖYRY POINT OF VIEW |
‘All-Electric’ pathway
This pathway builds upon the assumption that only electrification can achieve decarbonisation and policies are put in place to prevent the development of ‘Zero Carbon Gas’ alternatives, resulting in new nuclear and biomass build.
HEAT SECTOR TRANSFORMATION Figure 5 shows that heat pumps become the dominant technology in non-process heating, with air-source heat pumps in urban environments and ground-source heat pumps in rural areas. In many Northern European countries, air-source heat pumps are deployed alongside an electric resistive back-up system to cover time periods when the ambient outside temperature falls below working limits for stand-alone heat pumps (assumed to be -15°C).
The options in process heat are more limited, as electric heating can only play a limited role. The remaining demand – currently met with coal, oil and gas – switches to biomass as the only allowed zero carbon alternative that can support high temperature load needs. This leads to large biomass requirements in this pathway which are assumed to be sustainable. Heat from combined heat and power, which converts from fossil fuels to biomass, is also used.
TRANSPORT SECTOR TRANSFORMATIONAs can be seen in Figure 6 decarbonisation is achieved in the transport sector by fully electrifying all road vehicles and all trains as other options are not allowed in this pathway. This includes heavy goods vehicles, which assumes that there is successful development of very large battery systems and super-
charging facilities to ensure range requirements are met. This pathway estimates that 432m electric vehicles will be on the road in 2050 across Europe.
POWER SECTOR TRANSFORMATIONThe electrification of transport and heat means total European electricity demand increases to around 6,300TWh in 2050 (1,000TWh more than in the ‘Zero Carbon Gas’ pathway), and peak demand increases on average across Europe by approximately 180% from 2020 to 2050. Figure 7 shows the generation output, which is dominated by renewables. Total renewable generation in 2050 is around 80% at 5,000TWh. Significant amounts of nuclear generation (1,160GWh in 2050, more than five times the amount required in the ‘Zero Carbon Gas’ pathway) helps balance intermittency alongside smart demand side response.
New capacity is dominated by more than 1,100GW of onshore wind and 600GW of solar over the timeframe. Since many countries do not allow nuclear power, those countries that do, especially France, GB, Poland and Czech Republic, are expected to build the bulk of the new 190GW.
European-wide electricity interconnection approximately doubles to more than 300GW by 2050 to enable sharing of all generation sources.
0
500
1,000
1,500
2,000
2,500
3,000
3,500
4,000
4,500
2020 2030 2040 2050 2020 2030 2040 2050
TWh
heat
pro
duct
ion
CHP
Coal
Oil
Solar
Biomass
Electricity
Natural gas
Non-Process Process 0
1,000
2,000
3,000
4,000
5,000
6,000
2020 2030 2040 2050
Bill
ion
vehi
cle
km
Electricity
Hybrid
LNG/CNG
Gasoline/Diesel/LPG
0
1000
2000
3000
4000
5000
6000
7000
2020 2030 2040 2050
Gen
erat
ion
(TW
h)
Other renewable
Wind
Solar
Other thermal
Nuclear
CCGT
FIGURE 5 – ELECTRIFICATION TRANSFORMING EUROPE’S HEATING SECTOR
INSIGHT – INTERCONNECTION ESSENTIAL FOR MOVING POWER AROUND EUROPE
The generation mix also requires even more flexibility, especially from interconnectors. These graphs illustrate for GB and Germany in a week in November that significant flows take place in both import and export across interconnectors. It also shows that when there is very high renewable generation then even the nuclear fleet that is deployed in the ‘All-electric’ pathway has to react, in this case turning off in GB for 5 days before starting to return to service. We have assumed that nuclear flexibility across all the nuclear fleet is equivalent to the capabilities of currently operating French nuclear plants.
0
50
100
150
200
Wed Thu Fri Sat Sun Mon Tue
Nuclear Battery Other Non-Res Other RES Onshore wind
Solar PV Import Export Series16
Germany
0
50
100
150
200
Wed Thu Fri Sat Sun Mon Tue
Aver
age
hour
ly g
ener
atio
n/de
man
d (G
W)
Nuclear Battery Other Non-Res Other RES Wind
Solar Import Export Demand
Great Britain
FIGURE 6 – ELECTRIFICATION OF EUROPE’S TRANSPORT SECTOR FIGURE 7 – EUROPE’S POWER GENERATION TRANSFORMATION
9 8 | PÖYRY POINT OF VIEW PÖYRY POINT OF VIEW |
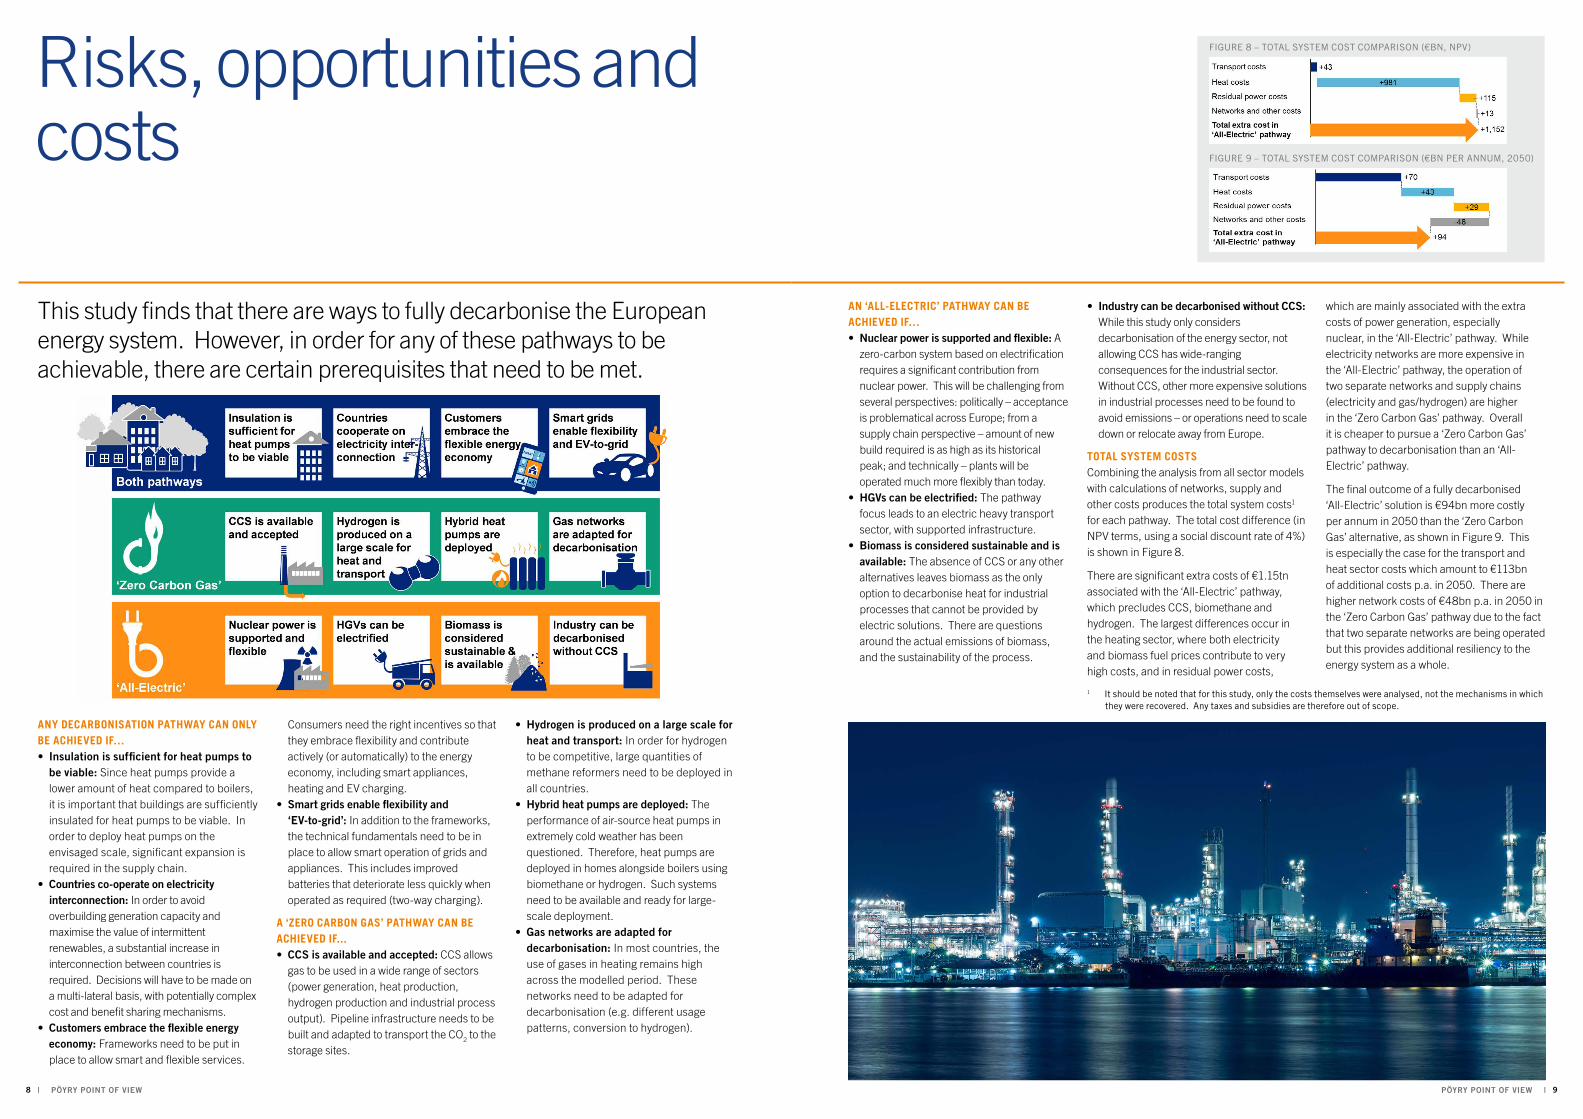
Risks, opportunities and costs
This study finds that there are ways to fully decarbonise the European energy system. However, in order for any of these pathways to be achievable, there are certain prerequisites that need to be met.
ANY DECARBONISATION PATHWAY CAN ONLY BE ACHIEVED IF…• Insulation is sufficient for heat pumps to
be viable: Since heat pumps provide a lower amount of heat compared to boilers, it is important that buildings are sufficiently insulated for heat pumps to be viable. In order to deploy heat pumps on the envisaged scale, significant expansion is required in the supply chain.
• Countries co-operate on electricity interconnection: In order to avoid overbuilding generation capacity and maximise the value of intermittent renewables, a substantial increase in interconnection between countries is required. Decisions will have to be made on a multi-lateral basis, with potentially complex cost and benefit sharing mechanisms.
• Customers embrace the flexible energy economy: Frameworks need to be put in place to allow smart and flexible services.
Consumers need the right incentives so that they embrace flexibility and contribute actively (or automatically) to the energy economy, including smart appliances, heating and EV charging.
• Smart grids enable flexibility and ‘EV-to-grid’: In addition to the frameworks, the technical fundamentals need to be in place to allow smart operation of grids and appliances. This includes improved batteries that deteriorate less quickly when operated as required (two-way charging).
A ‘ZERO CARBON GAS’ PATHWAY CAN BE ACHIEVED IF...• CCS is available and accepted: CCS allows
gas to be used in a wide range of sectors (power generation, heat production, hydrogen production and industrial process output). Pipeline infrastructure needs to be built and adapted to transport the CO2 to the storage sites.
• Hydrogen is produced on a large scale for heat and transport: In order for hydrogen to be competitive, large quantities of methane reformers need to be deployed in all countries.
• Hybrid heat pumps are deployed: The performance of air-source heat pumps in extremely cold weather has been questioned. Therefore, heat pumps are deployed in homes alongside boilers using biomethane or hydrogen. Such systems need to be available and ready for large-scale deployment.
• Gas networks are adapted for decarbonisation: In most countries, the use of gases in heating remains high across the modelled period. These networks need to be adapted for decarbonisation (e.g. different usage patterns, conversion to hydrogen).
1 It should be noted that for this study, only the costs themselves were analysed, not the mechanisms in which they were recovered. Any taxes and subsidies are therefore out of scope.
AN ‘ALL-ELECTRIC’ PATHWAY CAN BE ACHIEVED IF…• Nuclear power is supported and flexible: A
zero-carbon system based on electrification requires a significant contribution from nuclear power. This will be challenging from several perspectives: politically – acceptance is problematical across Europe; from a supply chain perspective – amount of new build required is as high as its historical peak; and technically – plants will be operated much more flexibly than today.
• HGVs can be electrified: The pathway focus leads to an electric heavy transport sector, with supported infrastructure.
• Biomass is considered sustainable and is available: The absence of CCS or any other alternatives leaves biomass as the only option to decarbonise heat for industrial processes that cannot be provided by electric solutions. There are questions around the actual emissions of biomass, and the sustainability of the process.
• Industry can be decarbonised without CCS: While this study only considers decarbonisation of the energy sector, not allowing CCS has wide-ranging consequences for the industrial sector. Without CCS, other more expensive solutions in industrial processes need to be found to avoid emissions – or operations need to scale down or relocate away from Europe.
TOTAL SYSTEM COSTSCombining the analysis from all sector models with calculations of networks, supply and other costs produces the total system costs1 for each pathway. The total cost difference (in NPV terms, using a social discount rate of 4%) is shown in Figure 8.
There are significant extra costs of €1.15tn associated with the ‘All-Electric’ pathway, which precludes CCS, biomethane and hydrogen. The largest differences occur in the heating sector, where both electricity and biomass fuel prices contribute to very high costs, and in residual power costs,
which are mainly associated with the extra costs of power generation, especially nuclear, in the ‘All-Electric’ pathway. While electricity networks are more expensive in the ‘All-Electric’ pathway, the operation of two separate networks and supply chains (electricity and gas/hydrogen) are higher in the ‘Zero Carbon Gas’ pathway. Overall it is cheaper to pursue a ‘Zero Carbon Gas’ pathway to decarbonisation than an ‘All-Electric’ pathway.
The final outcome of a fully decarbonised ‘All-Electric’ solution is €94bn more costly per annum in 2050 than the ‘Zero Carbon Gas’ alternative, as shown in Figure 9. This is especially the case for the transport and heat sector costs which amount to €113bn of additional costs p.a. in 2050. There are higher network costs of €48bn p.a. in 2050 in the ‘Zero Carbon Gas’ pathway due to the fact that two separate networks are being operated but this provides additional resiliency to the energy system as a whole.
FIGURE 8 – TOTAL SYSTEM COST COMPARISON (€BN, NPV)
FIGURE 9 – TOTAL SYSTEM COST COMPARISON (€BN PER ANNUM, 2050)

11 10 | PÖYRY POINT OF VIEW PÖYRY POINT OF VIEW |
Key messages and recommendations
The good news is that this study has shown that it is feasible to fully decarbonise Europe’s transport, heat and electricity sectors by 2050.
However, achieving this will require significant investments and requires major transformation across all three sectors regardless of which particular pathways stakeholders chose to follow. That said there are some key messages and risk mitigation factors that all stakeholders should consider based on the analysis in this study. The three key messages from this study can be summarised as follows.
Additional important findings of the study include the following:• In both pathways investigated the future for
smaller vehicles is electric. However, for larger vehicles hydrogen is a better alternative.
• Major growth in renewable power, especially solar PV and onshore wind, is critical to decarbonising the power system regardless of the actual level of future demand. It makes economic sense to deploy these where the natural resource is most prevalent. Whilst intermittency has to date caused some balancing challenges, analysis shows that the growth of smart networks, appliances and flexible EVs can significantly reduce the impact in the future.
Delivering decarbonisation will require significant investment (almost €1 trillion in new power generation alone) and delivering zero carbon solutions is not without risk. A pathway that precludes options, e.g. CCS, could lead to higher investment costs than necessary (e.g. in power generation or networks) and increased risks. Accordingly, it is prudent to keep as much flexibility in the technology options available.
Allowing competition between all energy sources leads to a more integrated and lower cost solution. A more restricted pathway, such as the ‘All-Electric’, prohibits this competition and leads to a world with much higher costs. In transport, fuel cells appear to be more efficient than batteries in heavy duty vehicles; in heat, hydrogen offers a cost-effective solution; in power, the resulting system is more flexible and relies significantly less on nuclear generation.
The large-scale electrification of heat and transport across both pathways leads to a significant increase in power demand. In order to keep the system operation costs at a manageable level, consumers need access to smart grids and to willingly change their behaviour in order to unleash demand flexibility. In a future with significant intermittent generation this flexible demand will be able to meet supply, which is contrary to the current typical mechanism of supply meeting demand.
In the fully decarbonised future of 2050, unabated natural gas does not have a role. For the gas industry it is therefore vital to develop and demonstrate the benefits of zero carbon gas options, such as biomethane, CCS and hydrogen. It is crucial that policies are put in place to support these adaptations, especially where regulated industries are concerned.
Hydrogen can contribute across transport, heat and power sectors. The assumed capabilities of EVs in providing system flexibility significantly reduce the potential of electrolysis in power-to-gas so the industry must develop a hydrogen supply system using methane reforming.
CCS is the key enabling technology for a ‘Zero Carbon Gas’ pathway as a cheaper and more resilient route towards decarbonisation. It is the most economic option for abating emissions from industrial heat and facilitates large scale hydrogen production. If alternative carbon usage technologies are developed during this time then this will assist with limiting the volumes that need to be stored.
POLICY RECOMMENDATIONSWhilst it is good news that Europe could technically realise full decarbonisation of its energy system by 2050 all stakeholders should recognise the scale of the challenge and the risks associated with delivering it: • Transparency around costs and risks: A
systems-wide approach will allow for the exploitation of synergies across sectors and energy sources. All stakeholders should recognise it is not possible to decarbonise the energy sector with renewables alone. Setting emissions limitation policies, in transport for example, will ensure the transformation happens at the pace required and will assist in providing the certainty needed to allow the new technology supply chains to be forthcoming in the most efficient manner.
• Avoidance of artificial barriers: Policy makers should not preclude (“no nuclear here”) and put in place artificial barriers (“don’t want to store CCS there”) that hinder the development of zero carbon technologies
that can deliver at scale and lower costs. Decarbonisation is very costly, but, as shown by the results of this study, if competition between a large number of options is inhibited by artificial barriers, then the risks and costs will be higher than necessary.
• Need for market design changes, to enable fair market competition: In an energy system undergoing fundamental changes, many markets will be in need of a redesign, while others will need to be established:
- Current carbon pricing will become less effective so new generation and technology transformations will need to be funded through other mechanisms.
- Some technologies will need support (e.g. grants for research & development, incentives for heat appliance replacement, stricter vehicle emissions standards and regulation), as they currently lack commercial viability.
WHAT DOES DECARBONISATION MEAN FOR THE GAS INDUSTRY?In order for Europe to fully decarbonise its energy sector in an efficient manner, the gas industry must be able and allowed to adapt and deliver zero carbon gas technologies.
Current discussions mainly focus on electrification as the path towards decarbonisation, and assume that gas can only play a role during the transition. This study finds that new gas vectors can be at the centre of decarbonisation in the long-term, by providing zero carbon gas solutions: biomethane, CCS and hydrogen.
The necessary adaptations can be summarised as follows:

13 12 | PÖYRY POINT OF VIEW PÖYRY POINT OF VIEW |
Study approach and methodology
This study investigates the decarbonisation of the energy sector, including power generation; residential, commercial, industrial and district heating; and land passenger and freight transport sectors. It does not include the non-combustion use of energy carriers such as gas or oil products used as feedstocks in industrial processes. ELEMENTS OF BOTH PATHWAYSWhile the aim of the pathways is to create, analyse and compare divergent versions of a decarbonised future, there needs to be some underlying common elements that allow for a consistent and useful comparison. In this study, these common elements are: • Carbon emissions: All pathways share
common limits for carbon emissions, with net emissions across all sectors reaching zero by 2050.
• Existing technologies: Only technologies that are currently either being deployed or at least under development are considered in all pathways.
MODELLING FRAMEWORKIn order to estimate future capacity, output, and system costs, we use optimisation models for each sector. These models determine the optimal capacity mix and operation given the specific assumptions and constraints set for a particular pathway. Existing supply, scrapping rates and future demand are entered as inputs. The model then selects the optimal mix of new technologies, based on the need for new capacity, the cost and capabilities of the new capacities, including emissions, and deployment constraints, e.g. maximum amount commissioned in any year.
• Energy demand: End use demand for transport (km), heating (TWh) and electricity (TWh, excluding demand from transport and heating) is the same across pathways.
• Consumer behaviour: It is assumed that flexibility will be available from the development of smart technologies, e.g. smart appliances, two-way EV batteries. However, no major shifts in driving, e.g. car sharing or pooling, heating behaviour or appliance availability are assumed.
Modelling all elements of system costs in an integrated manner ensures consistency between the three sectors as some constraints extend across sectors (emissions, fuel source availability) or outputs from one model are inputs in other models (e.g. electricity and hydrogen demand from transport and heat feed in to the power model).
TRANSITIONING HEAT AND TRANSPORTFor this study we have developed two new models, one for transport (‘move’) and one for heat (‘Hestia’). These are capable of determining the future stock and output for transport and heat across Europe.
The transport and heat models are organised in similar ways, as they both provide outputs on an annual basis for future vehicle and heating
stock numbers, heat generation or km output, as well as costs, fuel use and emissions. The transition towards a zero carbon system is modelled on the basis of the capabilities and costs of new technologies, as well as their availability, which is determined by supply chain constraints and political factors.
POWER MODEL – BID3In the power sector modelling, we use our existing market model, BID3. This model already includes key characteristics such as:• Plant parameters: Efficiencies/availability, risk
of unexpected outages, time taken to ramp to full capacity, reduced efficiencies when ramping up and down more frequently.
• Historical weather patterns: Application of historical weather patterns with hourly wind speeds, solar irradiation and temperatures
being applied to future years to ensure an internally consistent temperature variance outcome on demand alongside actual levels of generation from wind and solar.
• Security standards: Ensures that the power generation mix provides sufficient back-up for times when intermittent generation is very low and demand is very high.
For the purposes of this study we have further enhanced BID3 with two major features:• Flexibility of demand: With the increase of
smart meters and appliances, electric heating and electric vehicles, electricity demand is expected to become much more flexible. New flexible hourly demand profiles have been developed for end use of electricity for heat and transport, including variations from the temperature dependence of heat pump efficiencies and electric vehicle ranges.
• Hydrogen production: The mix between the two alternatives of electrolysis and natural gas reforming are optimised both in the long-term (investment decisions) and short-term (dispatch). Electrolysis competes with the flexibility offered by electric vehicles and heating.
GRANULAR MODELLING OF ELECTRICITY DEMAND AND SUPPLYIn order to understand how future electricity supply and demand will interact it is critical to understand the flexibility of these demands, i.e. ability to shift demand away from peak periods or across a day, a week or a season. For all demand segments, transport, heat and residual, hourly demand profiles have been defined. A certain share of demand is defined as flexible, which means that BID3 can dynamically optimise the shifting of demand within this segment, within certain limits.
Hourly analysis of flexible demand is critical to calculating the total system costs for any specific scenario; otherwise the peak electricity may be over-estimated, extra peaking generation built, and alternative storage options developed when they would not actually have been required.
INSIGHT – ELECTROLYSIS HAS A MINOR SHARE IN HYDROGEN PRODUCTION
A flexible demand side and high levels of interconnection mean that there is generally an absence of many very low priced periods which otherwise would support hydrogen production from electrolysis at lower cost than from methane reforming. Subsequently methane reforming is the dominant source of hydrogen production. However, production from electrolysis has a higher share in some regions in Europe with very high renewable penetrations and less system flexibility (e.g. Iberia/Italy).
0
500
1,000
1,500
2,000
2,500
2020 2030 2040 2050
Hyd
roge
n de
man
d (T
Wh)
Non-Power Power
0
500
1,000
1,500
2,000
2,500
2020 2030 2040 2050
Hyd
roge
n pr
oduc
tion
(TW
h)
ATR/SMR Electrolysis
Note: ATR/SMR = Autothermal reforming / Steam methane reforming

15 14 | PÖYRY POINT OF VIEW PÖYRY POINT OF VIEW |
Key assumptions
DEMAND PROJECTIONSMacro assumptions have been taken from the EU Reference Scenario 20162 , reflecting the critical aim of delivering full decarbonisation without major behavioural changes and introducing inconsistencies between demand assumptions. Population grows slowly, and GDP grows moderately with sector contributions to GDP remaining largely flat, including industrial output.
Demand for heat was adapted from Fraunhofer’s ‘Mapping EU heat supply’3 study from 2016. In the non-process heat sectors, space and water heating and cooling in buildings, demand declines over time, as energy efficiency increases due to better building standards and insulation of existing buildings. In the process heat segment, output grows moderately, in line with GDP growth assumed in the EU reference case.
Residual power demand, which excludes demand from heat and transport, covers provision of lighting, and electric appliances (TVs, washing machines, fridges, etc.). This share of demand is projected to increase despite some improvement in appliance energy efficiency, as the number of electric appliances is expected to grow, especially in newer Member States, and digitalisation in businesses and homes is anticipated to rise.
Figure 10 provides an overview of the underlying demand assumptions.
A new technology type included in the ‘Zero Carbon Gas’ pathway is the hybrid heat pump. This provides a core level of heat via an air-source heat pump with additional heat from a boiler that uses natural gas, biomethane or hydrogen. When the ambient temperature drops below -10°C all heat demand is met by the boiler.
POWER TECHNOLOGY CHARACTERISTICS AND COSTSPower generation cost assumptions to 2050 have been derived from external studies, with renewables reduced by a further 10% to reflect rapid reductions seen in auctions during 20174. We have ensured all technology build rates are within reasonable limits from a construction and supply chain perspective. Decisions to prohibit nuclear build in 12 countries have been respected.
OTHER COSTSPrices for commodities that are being phased out in both pathways, such as coal, lignite or oil, are assumed to be flat at current levels (taken from the 2016 EU Reference Scenario). Gas prices are assumed to grow by 30%-40% until 2030, and then to remain flat in real terms, aligning with the IEA’s 450 Scenario from the WEO 2016 for consistency with significant levels of global decarbonisation. Biomass prices also follow the same trajectory as gas.
Carbon prices have been initially set using values from the EU Reference Scenario. BID3
then produces the additional shadow price of carbon required to provide the price support necessary to meet not only the emissions limit but also investment hurdle rates.
Hydrogen production costs are based on a report produced for the Committee on Climate Change in the UK5 with electrolysis costs decreasing by >35%, whereas methane reforming decreases more slowly. Our electricity modelling accounts for the production of hydrogen, using either electrolysis from power to gas (P2G) or reforming natural gas (which includes costs for the carbon capture and storage) using
TRANSPORT TECHNOLOGY CHARACTERISTICS AND COSTSIn the transport sector, the existing road vehicle fleet data was obtained from Greek consultancy Emisia. Based on this data, our ‘move’ model splits the transport sector into segments based on fuel, size and use. For the rail sector it looks at the distances travelled for both passenger and freight transport.
The level of flexibility from EVs is a crucially important factor and for this study we assume private passenger EVs are only required to be fully charged on Mondays at 8am (equivalent to a weekly tank re-fuelling) whilst freight and public transport are required to be fully charged at 7am every morning.
HEAT TECHNOLOGY CHARACTERISTICS AND COSTSThe future deployment of heat technologies will depend on the relative efficiency, heat rate, capex, opex, appliance lifetimes and conversion costs, e.g. ‘behind-the-meter’ costs to allow air-source heat pumps to work in a wet heating environment or converting gas equipment to use hydrogen. Figure 11 illustrates how the assumptions come together in the levelised costs for various heating technologies.
Additionally, deployment restrictions are applied in the modelling to reflect the time required to build supply chains for new technologies, e.g. limitations on number of heat pumps that can be deployed in each future decade.
either steam reforming (SMR) or autothermal reforming (ATR).
The level of hydrogen produced from power-to-gas depends on the amount of renewable production that makes economic sense to convert using electrolysis. The value that electrolysis can capture and its load factors will be influenced by the levels of demand side flexibility and other forms of flexibility (e.g. battery storage) that effectively competes with any excess renewable generation in both intra-day and longer timeframes.
Network costs, including both transmission and distribution, for electricity and natural gas are captured as new and replacement capex plus opex, are based on GB data and then adjusted to reflect individual countries’ labour costs. For hydrogen networks we assume a 20% increase compared to gas for new build6, or conversion capex if gas networks are converted to hydrogen7.
Carbon capture and storage cost assumptions have been taken from the ‘Electricity Generation Cost Report’8, which includes both the cost of the plant, e.g. boiler or turbine, and the costs associated with CCS (capture, transport and storage).
BIOENERGY SUSTAINABILITYBioenergy solutions will need to account for sustainability constraints. From our perspective, the limitations reflect overall availability of feedstocks, constraints on imports and competition for resource from other sectors, e.g. aviation and shipping.
Accordingly we have limited biomass pellets to 3,000TWh and biomethane to 860TWh, the latter sourced from 10% of Europe’s arable land, 35% of waste manure and imports from Russia and Ukraine.
FIGURE 10 – COMMON DEMAND ASSUMPTIONS
Sources: European Commission (transport and power) and Fraunhofer (heat).
2 European Commission. “EU Reference Scenario 2016. Energy, Transport and GHG Emissions Trends to 2050.” 2016. 3 Fraunhofer Institute for Systems and Innovation Research (ISI). “Mapping and analyses of the current and future (2020-2030) heating/cooling fuel deployment.” 2016. 4 BEIS, NERA, Arup, Leigh Fisher and Jacobs, Energy Storage Update, BWE and VDMA.
5 E4tech, UCL Energy Institute, and Kiwa Gastec.“Scenarios for deployment of hydrogen in contributing to meeting carbon budgets and the 2050 target.” 2015. 6 Dodds, Paul E., and Will McDowall. “A review of hydrogen delivery technologies for energy system models.” 2012. 7 Northern Gas Networks, Kiwa Gastec, Amec Foster Wheeler, and Mike Haines. “H21 Leeds City Gate.” 2018. 8 Leigh Fisher and Jacobs. “Electricity Generation Costs and Hurdle Rates.” 2016.
FIGURE 11 – HEAT MODELLING – LEVELISED COSTS (RESIDENTIAL SEGMENT, UK, 2050)
82.7 83.192.3 92.8 98.1
107.5 110.7
131.6148.6
166.6
0
20
40
60
80
100
120
140
160
180
Gas
hyb
rid H
Pbi
omet
hane
Air-
sour
cehe
at p
ump
Gas
boi
ler
biom
etha
ne
Hyd
roge
n hy
brid
heat
pum
p
Gro
und-
sour
cehe
at p
ump
Hyd
roge
nbo
iler
Gas
hyb
rid H
PS
NG
Gas
boi
ler
SN
G
Bio
mas
sbo
iler
Res
ista
nce
heat
ing
Leve
lised
cos
t (€/
MW
h)
Fuel Appliance Fuel price (end user price):- Biomethane: ~€70/MWh- Hydrogen: ~€78/MWh- SNG: ~€125/MWh- Electricity: ~€145/MWh
Pho
tos:
col
ourb
ox.c
om
R
/PoyryPLC @PoyryPLC #PoyryPOV
Disclaimer Pöyry reserves all rights to this publication. No part of this publication may be reproduced or used in any form without the prior written consent of Pöyry. This publication is partly based on information that is not within Pöyry’s control. Pöyry does not make any representation or warranty, expressed or implied, as to the accuracy or completeness of the information contained in this publication. Pöyry expressly disclaims any and all liability arising out of or relating to the use of this publication.
This publication may contain projections which are based on assumptions subjected to uncertainties and contingencies. Because of the subjective judgments and inherent uncertainties of projections, and because events frequently do not occur as expected, there can be no assurance that the projections contained herein will be realized and actual results may be different from projected results. Hence the projections supplied are not to be regarded as firm predictions of the future, but rather as illustrations of what might happen.
Consulting. Engineering. Projects. Operations.We serve clients across power generation, transmission & distribution, forest industry, biorefining & chemicals, mining & metals, infrastructure and water & environment. Together, we deliver smart solutions and work with the latest digital innovations.5500 experts. 40 countries. 115 offices.
Staying on top of your game means keeping up with the latest thinking, trends and developments. We know that this can sometimes be tough as the pace of change continues... It is now possible to purchase the full report on which this summary is based. It provides further details on the assumptions, methodology and key insights, as well as country/regional inputs and results. To find out more, or if you wish to discuss with Pöyry how we can support you in undertaking your own decarbonisation pathway analysis, please contact Richard Sarsfield-Hall, Benedikt Unger or your usual Pöyry contact.
future role of gas
PN
00
48
20
18
/05
V1
Contact Information
Richard Sarsfield-HallDirectorTel. +44 7800 737 [email protected]
Benedikt UngerSenior ConsultantTel. +44 7887 [email protected]
www.poyry.com