Decarbonising UK energy - Royal Society/media/events/2017/10/decarbonising-uk...Decarbonising UK...
17
Decarbonising UK energy Decarbonising UK energy: A view of energy security Professor John Loughhead OBE FREng FTSE Chief Scientific Adviser
Transcript of Decarbonising UK energy - Royal Society/media/events/2017/10/decarbonising-uk...Decarbonising UK...
Decarbonising UK energy
Decarbonising UK energy: A view of energy security
Professor John Loughhead OBE FREng FTSE
Chief Scientific Adviser
Decarbonising UK energy
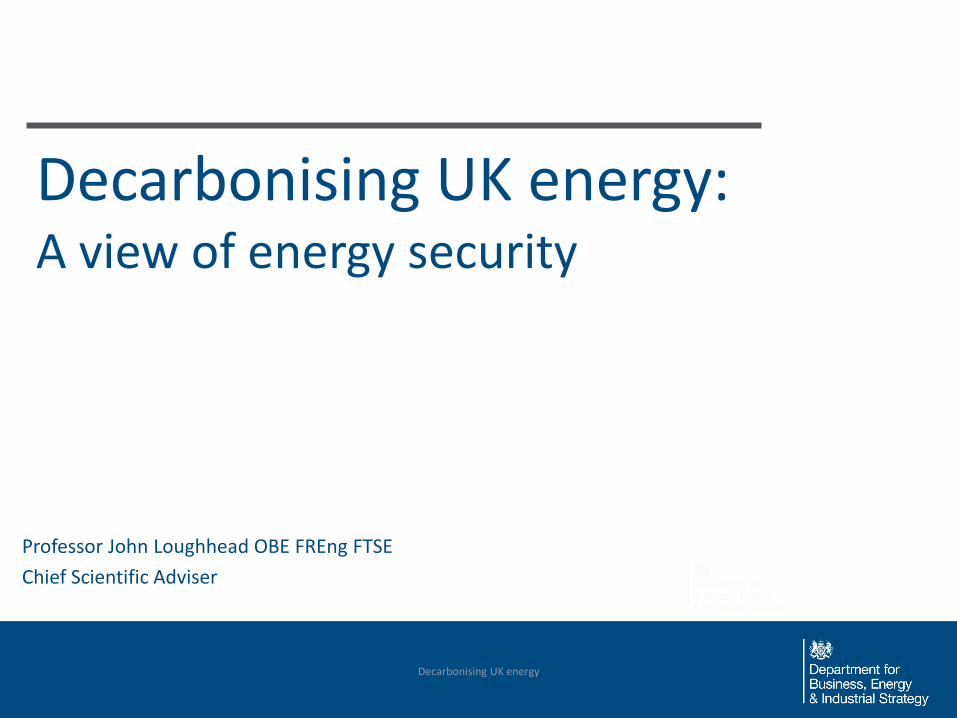
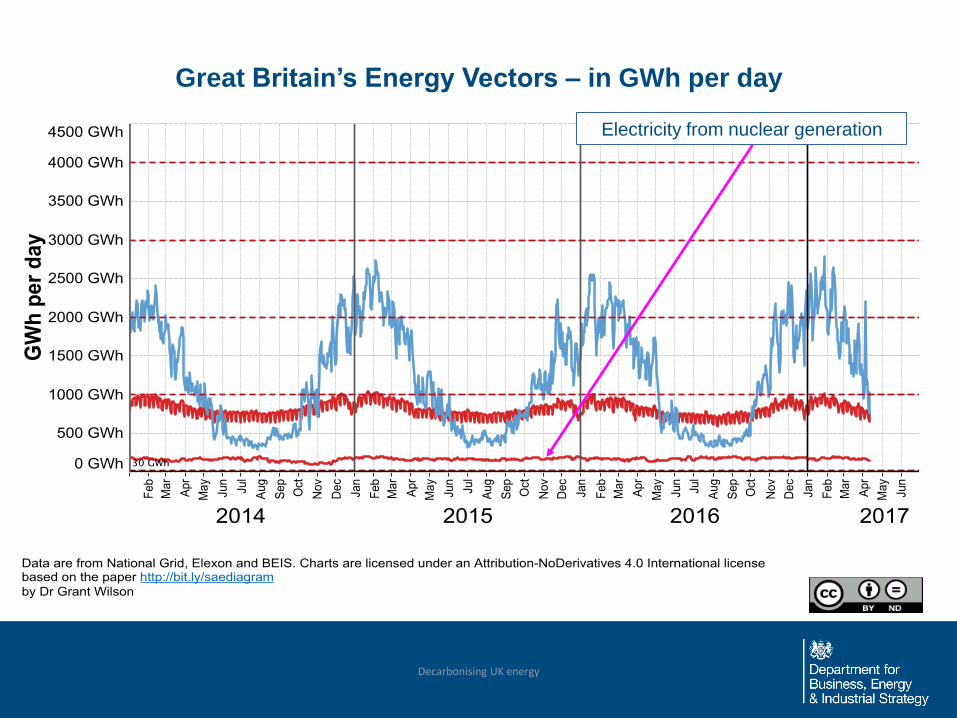
Great Britain’s Energy Vectors – in GWh per day

Decarbonising UK energy
Great Britain’s Energy Vectors – in GWh per day
Decarbonising UK energy
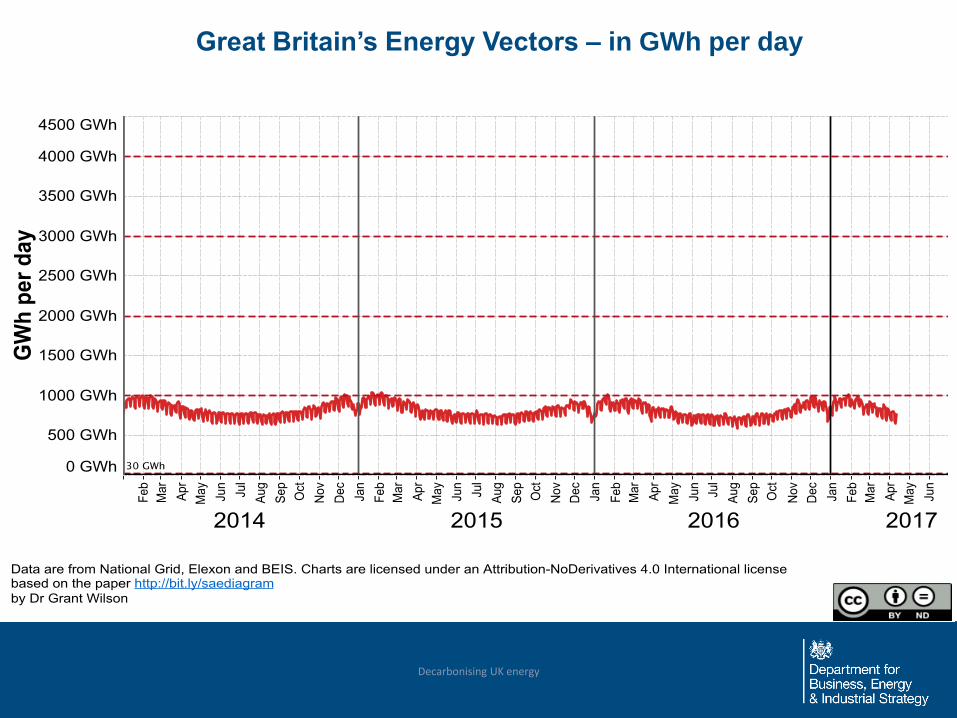
Great Britain’s Energy Vectors – in GWh per day
Transport fuels = Aviation Fuels + DERV (Diesel) + Motor Spirit (Petrol)
Great Britain’s Energy Vectors – in GWh per day
Decarbonising UK energy
Electricity from nuclear generation
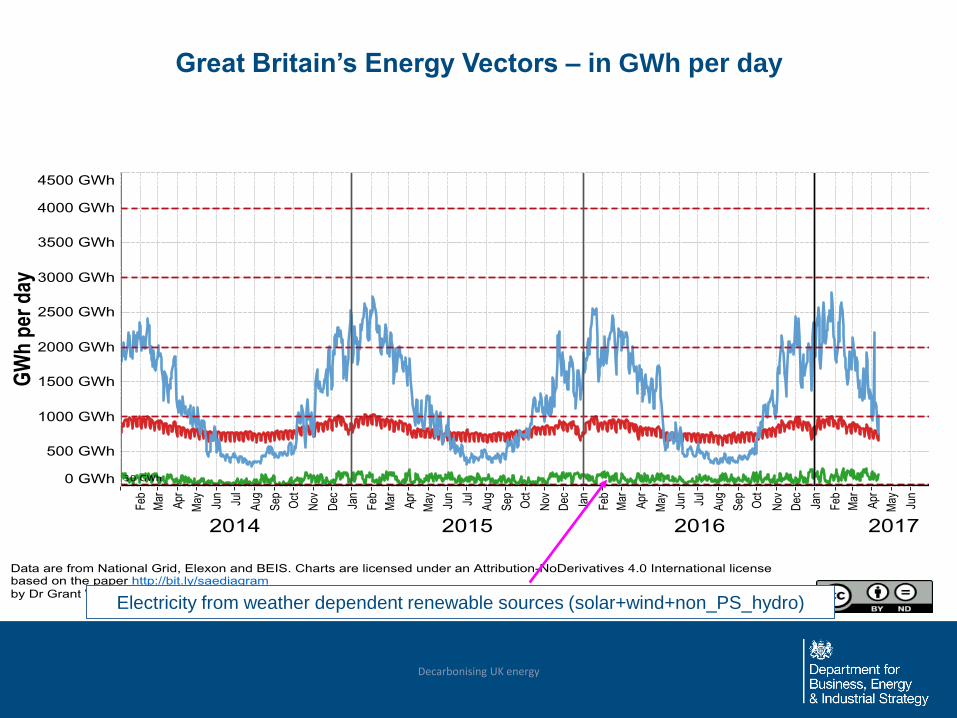
Great Britain’s Energy Vectors – in GWh per day
Decarbonising UK energy
Electricity from weather dependent renewable sources (solar+wind+non_PS_hydro)

Great Britain’s Energy Vectors – in GWh per day
Decarbonising UK energy
Electricity from coal generation
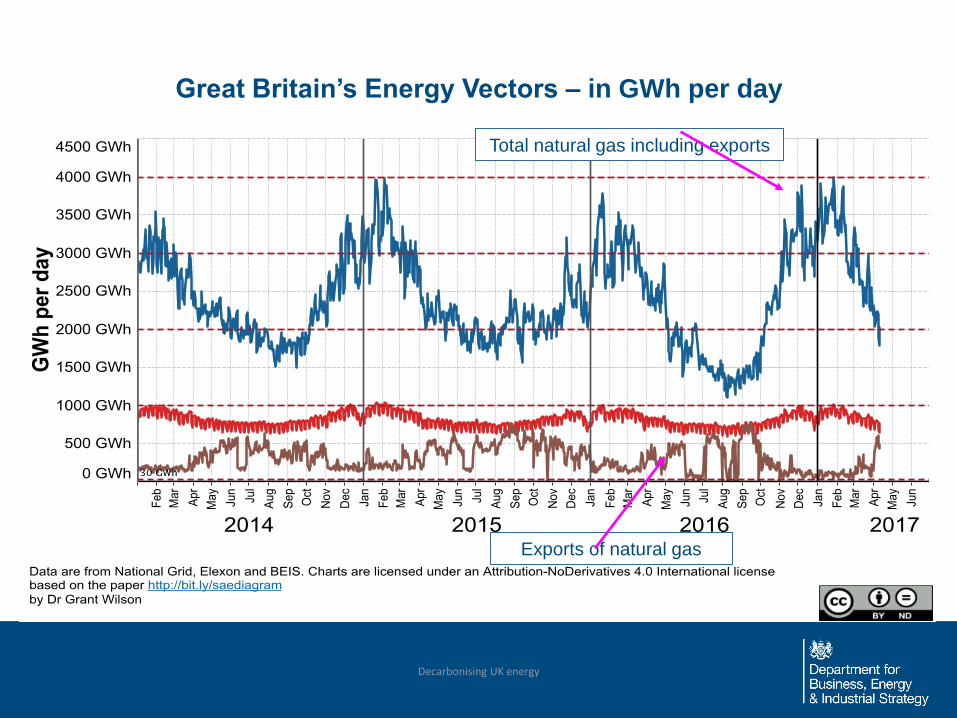
Great Britain’s Energy Vectors – in GWh per day
Decarbonising UK energy
Total natural gas including exports
Exports of natural gas
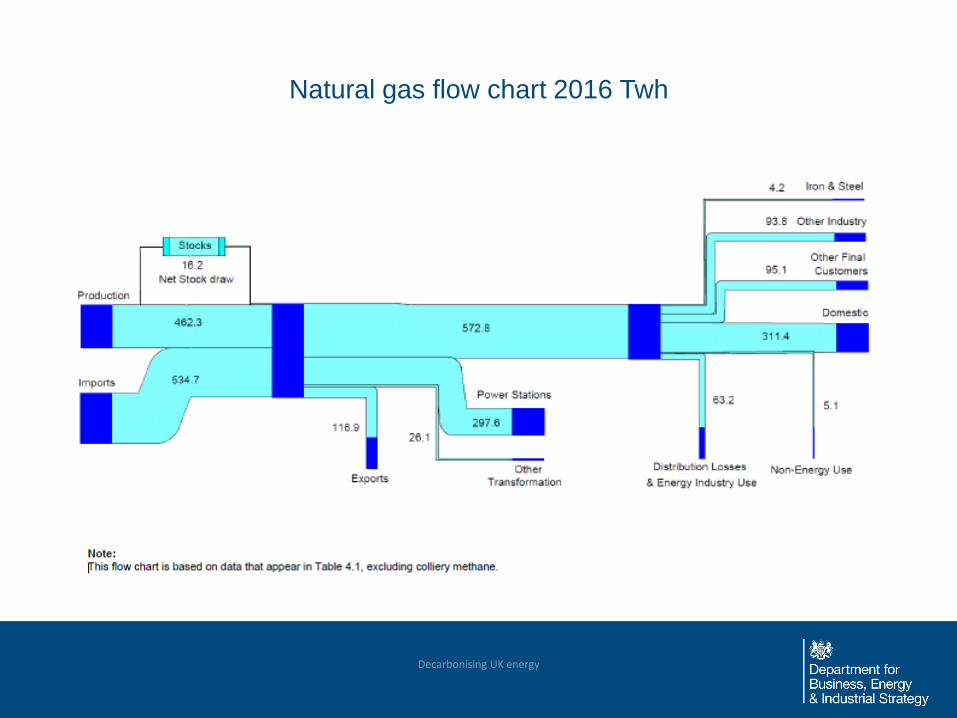
Natural gas flow chart 2016 Twh
Decarbonising UK energy

Peak electricity demand scenarios – National Grid
Source: National Grid, Future Energy Scenarios, July 2016 (http://fes.nationalgrid.com/ )
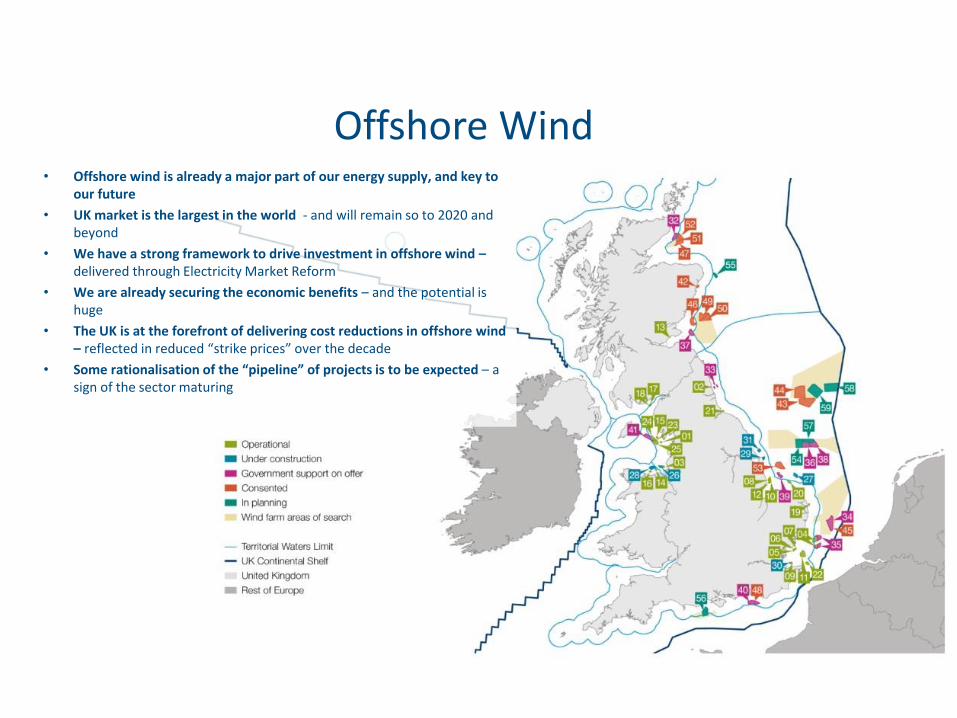
Offshore Wind • Offshore wind is already a major part of our energy supply, and key to
our future
• UK market is the largest in the world - and will remain so to 2020 and beyond
• We have a strong framework to drive investment in offshore wind – delivered through Electricity Market Reform
• We are already securing the economic benefits – and the potential is huge
• The UK is at the forefront of delivering cost reductions in offshore wind – reflected in reduced “strike prices” over the decade
• Some rationalisation of the “pipeline” of projects is to be expected – a sign of the sector maturing
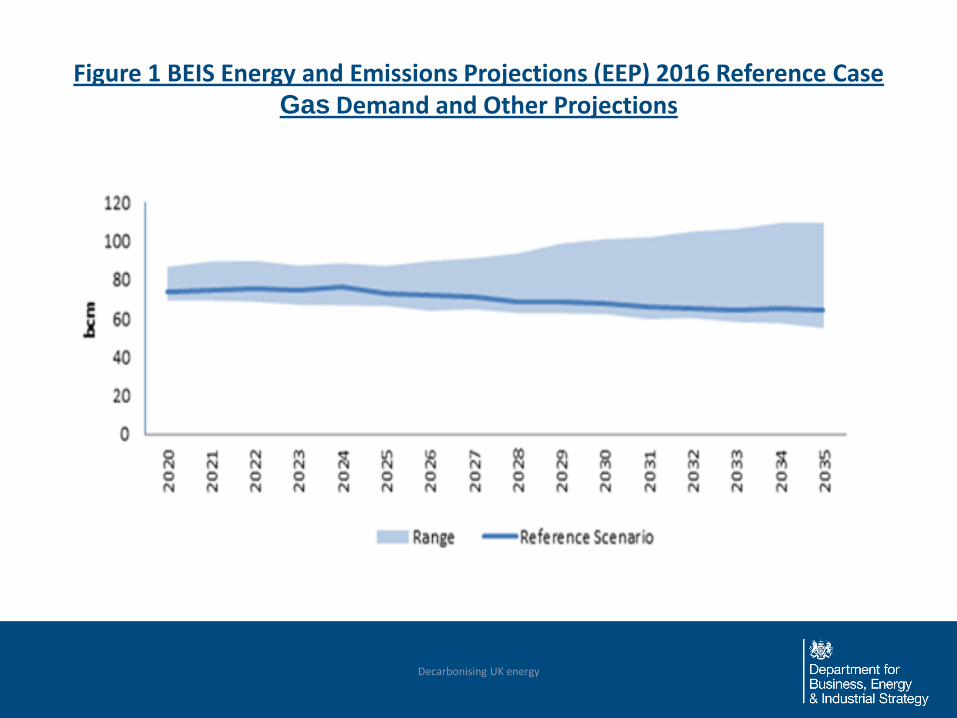
Figure 1 BEIS Energy and Emissions Projections (EEP) 2016 Reference Case Gas Demand and Other Projections
Decarbonising UK energy
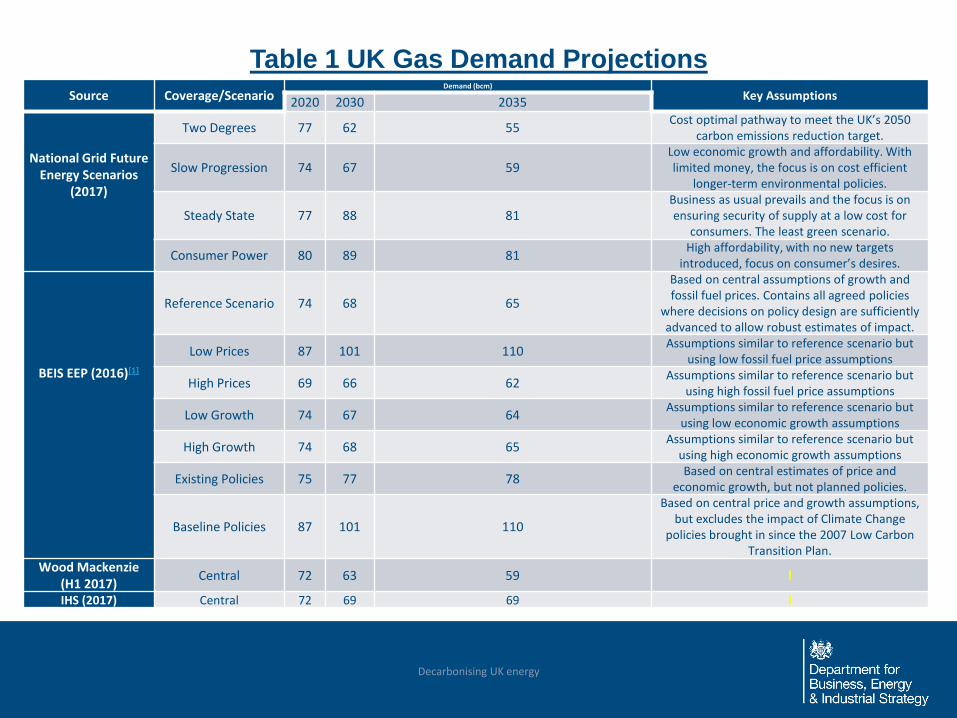
Table 1 UK Gas Demand Projections
Source Coverage/Scenario Demand (bcm)
Key Assumptions 2020 2030 2035
National Grid Future Energy Scenarios
(2017)
Two Degrees 77 62 55 Cost optimal pathway to meet the UK’s 2050
carbon emissions reduction target.
Slow Progression 74 67 59 Low economic growth and affordability. With limited money, the focus is on cost efficient
longer-term environmental policies.
Steady State 77 88 81 Business as usual prevails and the focus is on ensuring security of supply at a low cost for
consumers. The least green scenario.
Consumer Power 80 89 81 High affordability, with no new targets
introduced, focus on consumer’s desires.
BEIS EEP (2016)[1]
Reference Scenario 74 68 65
Based on central assumptions of growth and fossil fuel prices. Contains all agreed policies
where decisions on policy design are sufficiently advanced to allow robust estimates of impact.
Low Prices 87 101 110 Assumptions similar to reference scenario but
using low fossil fuel price assumptions
High Prices 69 66 62 Assumptions similar to reference scenario but
using high fossil fuel price assumptions
Low Growth 74 67 64 Assumptions similar to reference scenario but
using low economic growth assumptions
High Growth 74 68 65 Assumptions similar to reference scenario but
using high economic growth assumptions
Existing Policies 75 77 78 Based on central estimates of price and
economic growth, but not planned policies.
Baseline Policies 87 101 110
Based on central price and growth assumptions, but excludes the impact of Climate Change
policies brought in since the 2007 Low Carbon Transition Plan.
Wood Mackenzie (H1 2017)
Central 72 63 59
IHS (2017) Central 72 69 69
Decarbonising UK energy
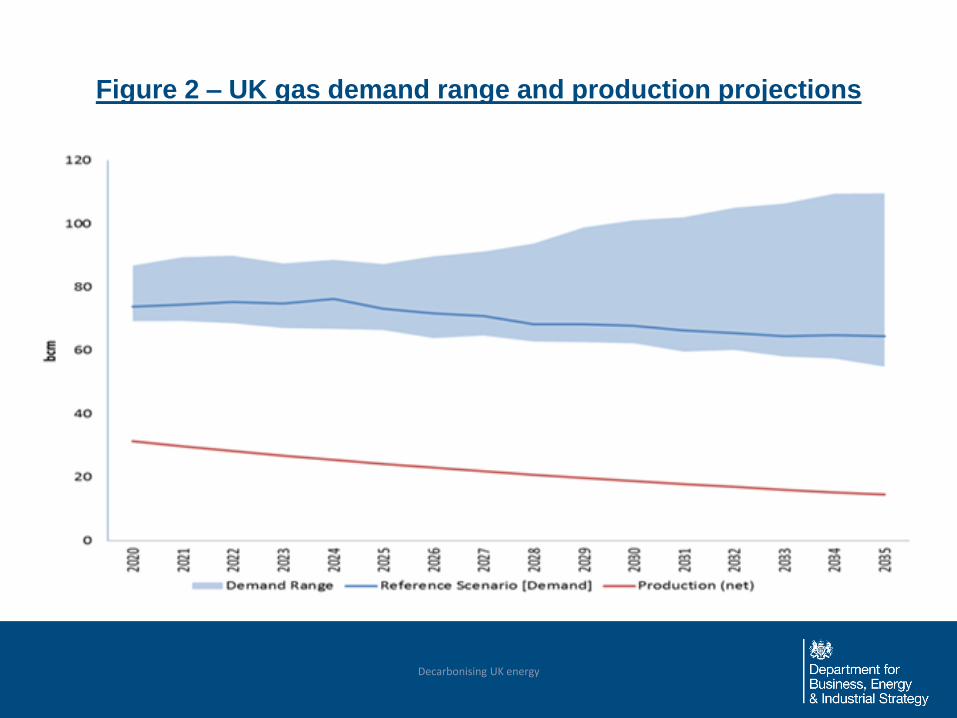
Figure 2 – UK gas demand range and production projections
Decarbonising UK energy
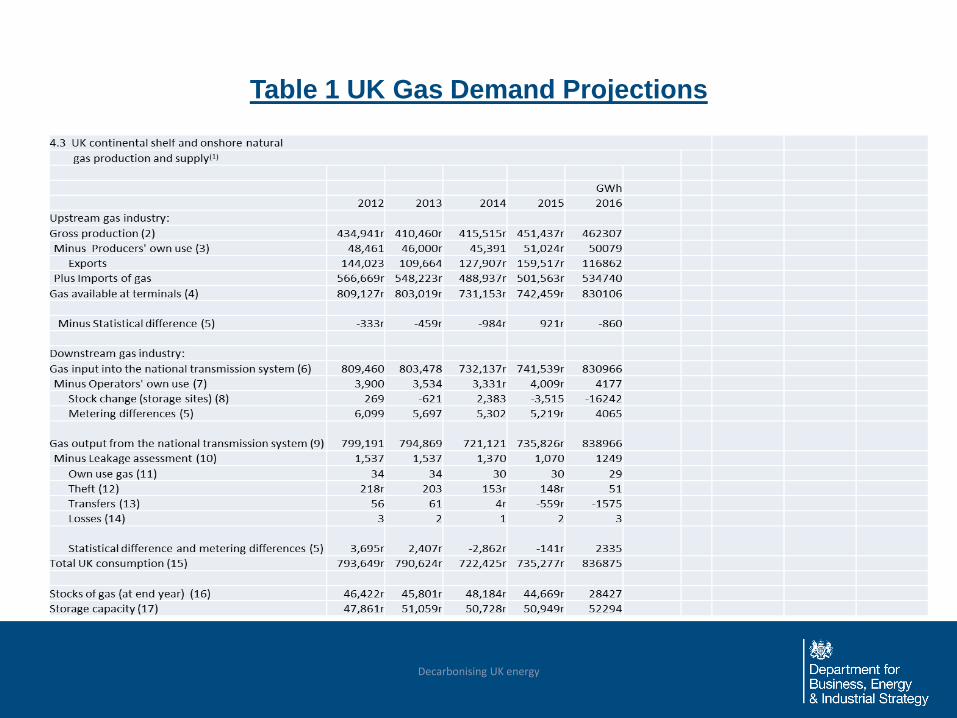
Table 1 UK Gas Demand Projections
Decarbonising UK energy

Final Energy Consumption
(including international aviation)
Decarbonising UK energy
0
20,000
40,000
60,000
80,000
100,000
120,000
140,000
160,000
180,000
1 2 3 4 5 6 7 8 9 10 11 12 13 14 15 16 17 18 19 20 21 22 23 24 25 26 27 28 29 30 31 32 33 34 35 36
Electricity
Natural gas
Petroleum products
Renewables
Solid / manufactured fuels3
Total energy consumption4
Years from 2000
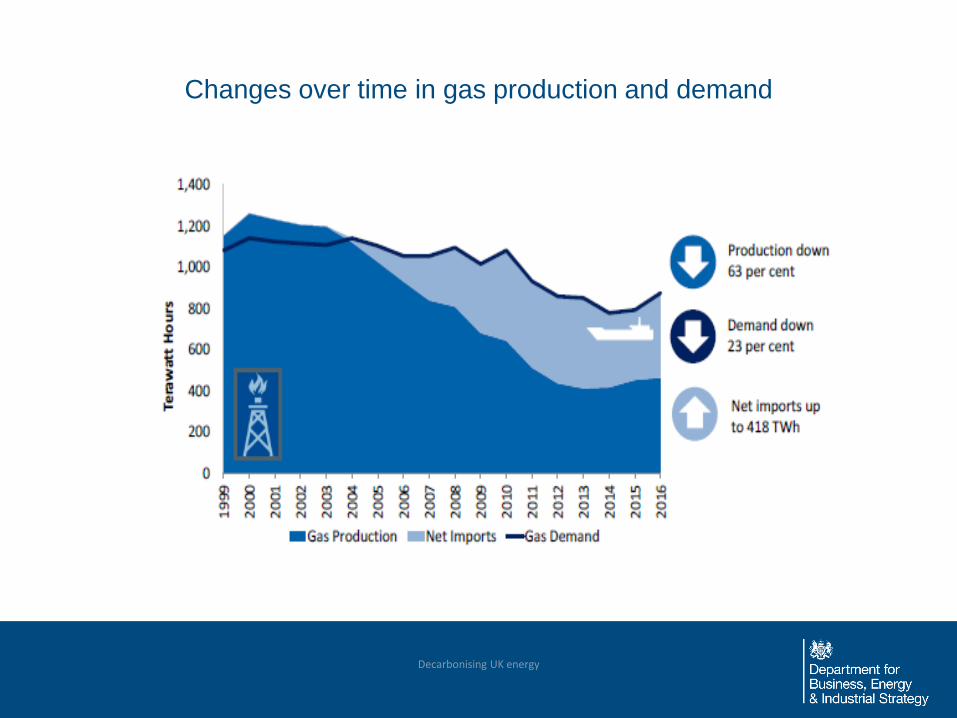
Changes over time in gas production and demand
Decarbonising UK energy