POD/Geoid Splinter Summary OSTS Meeting, Hobart 2007.
26
POD/Geoid Splinter Summary OSTS Meeting, Hobart 2007
-
Upload
barnard-griffith -
Category
Documents
-
view
218 -
download
0
Transcript of POD/Geoid Splinter Summary OSTS Meeting, Hobart 2007.

POD/Geoid Splinter Summary
OSTS Meeting, Hobart 2007
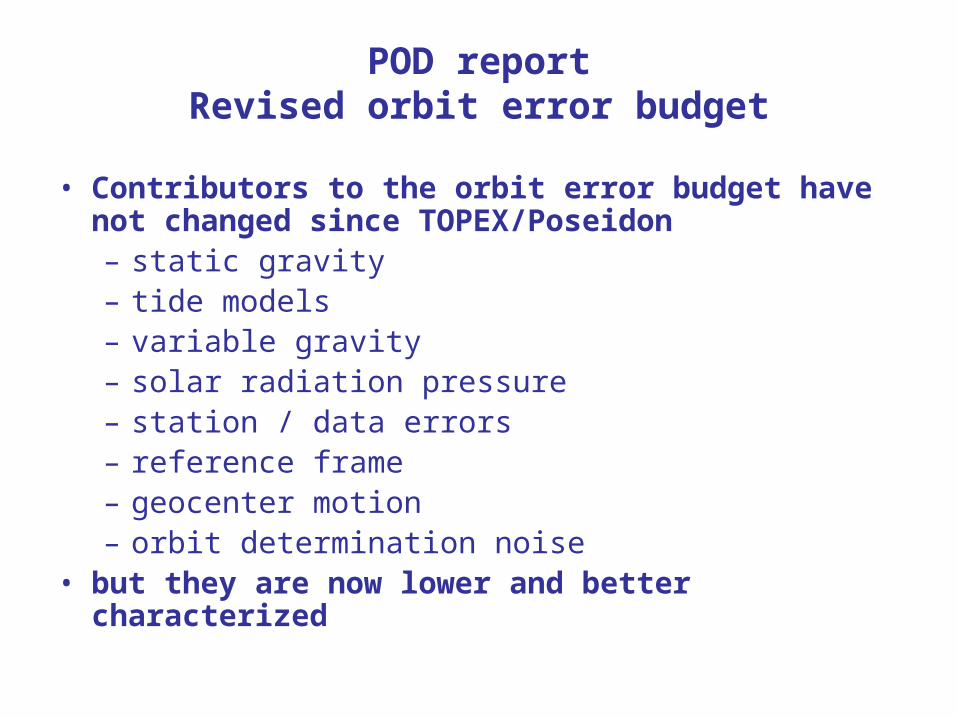
POD reportRevised orbit error budget
• Contributors to the orbit error budget have not changed since TOPEX/Poseidon– static gravity– tide models– variable gravity– solar radiation pressure– station / data errors– reference frame– geocenter motion– orbit determination noise
• but they are now lower and better characterized

Static Gravity
• Differences between newer GRACE models are small• order 1 harmonics contribute largest GCEs

Tide models

Variable gravity

Time-Varying Atmospheric Gravity
• SLR residuals RMS globally reduced by ~1 mm when adding atmospheric gravity

Impact on GCEs
Mean Radial Difference relative to JPL06b in mm(averaged over cycles 22 to 99 = Aug 02 to Sep 04)
GDR-B SHDP AOD1B
• Atmospheric gravity reduces geographically correlated differences with JPL06b reduced dynamics orbits

Grace-derived time-variable gravity to 20x20 (annual terms only)
• Monthly solutions from KBRR data only• Fit mean, trend, & annual harmonic• 2 solutions: 1-yr & 3-yr data span
Jason SLR/DORIS orbit summary (cycles 1-176)TVG model
average RMS residuals
DORIS(mm/s)
SLR(cm)
Crossovers(cm)
atmosphere gravity + (no annual) 0.3699 1.482 5.580
atmosphere gravity + tvg1 (1-year annual) 0.3698 1.462 5.577
atmosphere gravity + tvg3 (3-year annual) 0.3698 1.461 5.577
Reference: ‘Monthly spherical harmonics gravity field solutions determined from GRACE inter-satellite data alone,’ Luthcke et al., Geophyscal Research Letters, 2006.
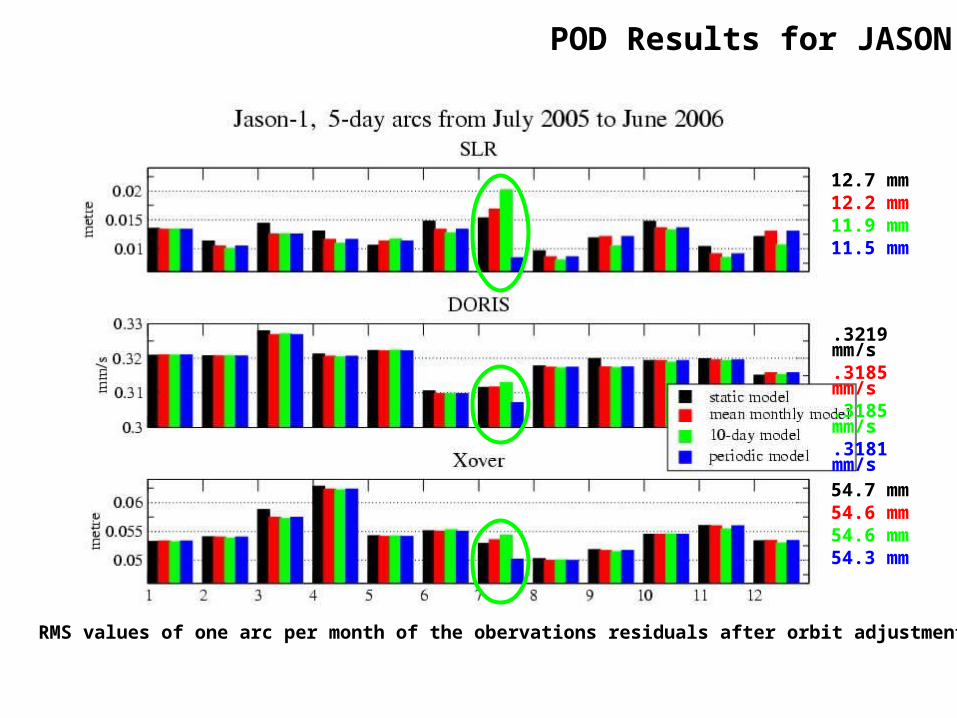
POD Results for JASON
54.7 mm54.6 mm54.6 mm54.3 mm
.3219 mm/s
.3185 mm/s
.3185 mm/s
.3181 mm/s
12.7 mm12.2 mm11.9 mm11.5 mm
RMS values of one arc per month of the obervations residuals after orbit adjustment

Solar radiation pressure
• There is evidence of small residual errors in both the scaled box-wing (GDR-B) and the UCL (JPL) model
from L. Cerri
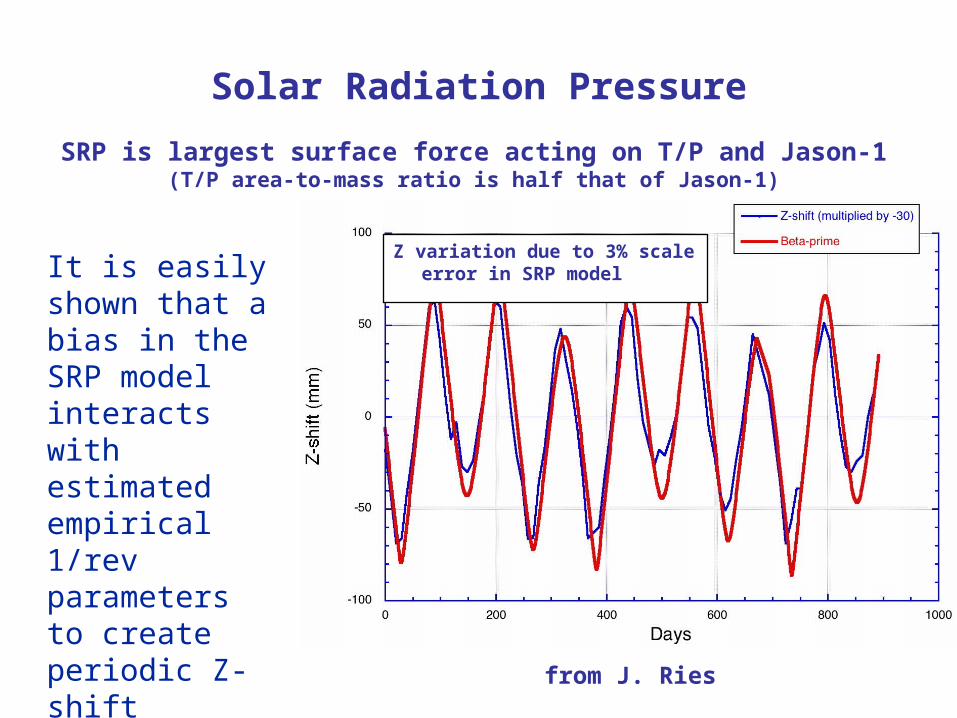
Solar Radiation Pressure
SRP is largest surface force acting on T/P and Jason-1(T/P area-to-mass ratio is half that of Jason-1)
It is easily shown that a bias in the SRP model interacts with estimated empirical 1/rev parameters to create periodic Z-shift correlated with beta-prime
Z variation due to 3% scale error in SRP model
from J. Ries

Solar radiation pressure
Jason SRP model performancecycles 1-180
average RMS residuals
DORIS(mm/s)
SLR(cm)
Crossovers(cm)
nominal (CR =1.000) 0.3688 1.460 5.577
nominal (CR =0.914) 0.3688 1.433 5.585
UCL (untuned) 0.3632* 1.445* ----
* fewer points used (dynamic editing)
• GSFC’s attempt to rescale model at GSFC leads to mixed results
from F. Lemoine

Solar radiation pressure
Jason SLR/DORIS nominal SRP - JPL GPS6b orbit differences
-2.5
-2
-1.5
-1
-0.5
0
0.5
1
1.5
2
0 20 40 60 80 100 120 140
cycle
Mea
n Z
(c
m)
Cr=1.000
Cr=0.914
Z-shift induced by rescaling of SRP model not sufficient to explainZ offset between DORIS/SLR and GPS orbits

Station / Data errors

Jason DORIS SAA correction
Jason Doris residuals: SLR/DORIS ITRF2000 orbits
0.28
0.33
0.38
0.43
0.48
0 20 40 60 80 100 120 140 160 180
cycle
rms
re
sid
ua
ls (
mm
/s)
GSFC
GSFC w SAA correction
GDR-A
Jason SLR/DORIS
ITRF2000 orbitscycles 1-177
average RMS residuals
DORIS(mm/s)
SLR (cm)
Crossover (cm)
GSFC 0.40781.48
25.585
GSFC w SAA corr.
0.36951.46
15.577

Jason DORIS SAA correction: Comparison of SLR/DORIS & SLR/Crossover Orbits
Jason (SLR/DORIS - SLR/Crossover) mean radial orbit differences over water
slope = -0.20 mm/yr
slope = -0.08 mm/yr
-3.5
-3
-2.5
-2
-1.5
-1
-0.5
0
0.5
1
1.5
2
2.5
3
3.5
0 20 40 60 80 100 120 140 160 180
cycle
Mea
n r
adia
l (m
m)
saa corrected cycles 1-90
saa corrected cycles 92-177
cycle 91
saa not-corrected cycles 1-90
saa not-corrected cycles 92-177
Linear (saa corrected cycles 1-90)
Linear (saa corrected cycles 92-177)Linear (saa not-corrected cycles 1-90)Linear (saa not-corrected cycles92-177)
~ 0.9 mm oscillator jump at cycle 91

Jason DORIS SAA correction
Jason SLR/DORIS (SAA uncorrected-corrected) orbit differences and DORIS points
-2
-1.5
-1
-0.5
0
0.5
1
1.5
0 20 40 60 80 100 120 140 160 180
Jason cycle
cm
65000
75000
85000
95000
105000
115000
125000
nu
mb
er D
OR
IS p
oin
ts
radial rms
mean Z
cycle 91
doris points

Reference frame
• ITRF2005– results indicate that ITRF2005 corrects a drift in the
centering of ITRF2000– Z drifts between the various orbits are significantly
reduced with ITRF2005– transition from ITRF2000 to ITRF2005 will induce a
shift in Z

Evaluation of new Jason orbits based on ITRF2005
Jason Orbits
SLR/DORIS
Cycles 1-177
DORIS RMS
(mm/s)
SLR RMS
(cm)
SLR mean
(cm)
Altimeter
Crossover
RMS (cm)
ITRF2000 0.3740 1.440 -0.058 5.578
ITRF2005 0.3734 1.423 0.257 5.573
ITRF2005
SLR-Rescaled w. scale-rate
0.3734 1.365 -0.030 5.576

Evaluation of new TOPEX orbits based on ITRF2005
TOPEX
SLR/DORIS Orbits
Cycles 1-364
DORIS RMS
(mm/s)
SLR
RMS
(cm)
SLR
mean
(cm)
Altimeter
Crossover
RMS (cm)
GDR 0.5348 2.210 0.323 ---
ITRF2000 0.5104 1.815 0.161 ---
ITRF2005 0.5104 1.870 0.323 ---
ITRF2005 SLR-rescaled w. scale-rate
0.5102 1.771 0.195 ---
Subset Analysis:
21 TOPEX Cycles (344-364)
ITRF2000 0.4678 1.629 0.001 5.493
ITRF2005 0.4878 1.670 0.264 5.501
ITRF2005 SLR-rescaled
w. scale-rate
0.4676 1.572 0.099 5.494
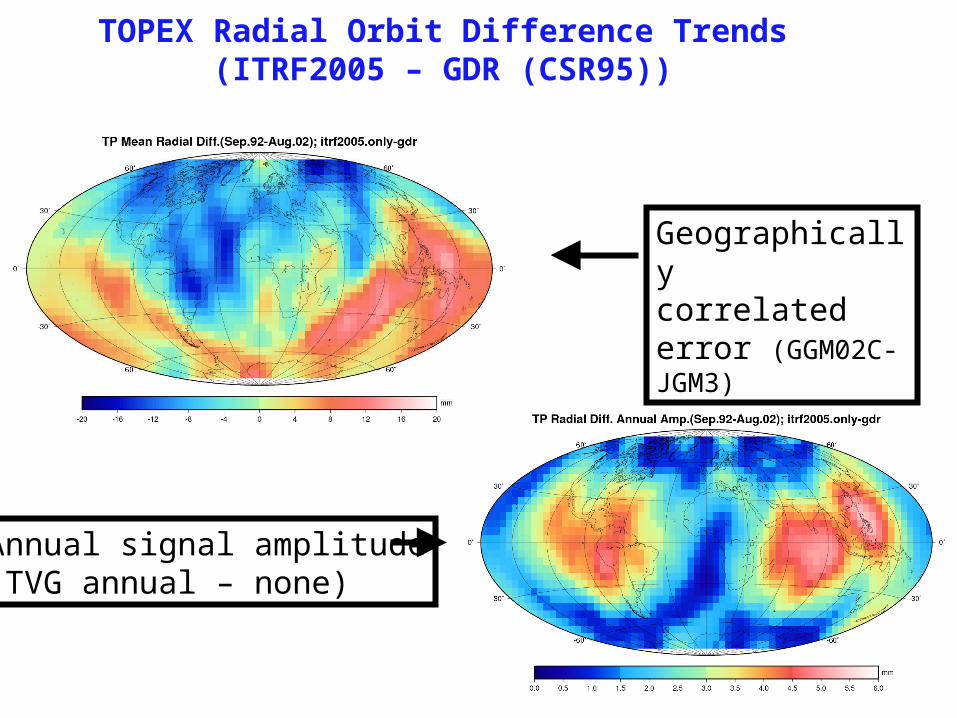
Annual signal amplitude(TVG annual – none)
Geographically correlated error (GGM02C-JGM3)
TOPEX Radial Orbit Difference Trends(ITRF2005 – GDR (CSR95))

Jason (and TOPEX) radial orbit differences are driven by the difference in Z
Long-term Orbit Error and the Terrestrial Reference Frame (TRF)
Jason ITRF2005-ITRF2000 mean orbit differences (Jan '02 - Oct '06)
Z slope = +1.44 mm/yr
slope = -0.31 mm/year
-4
-3.5
-3
-2.5
-2
-1.5
-1
-0.5
0
0.5
0 20 40 60 80 100 120 140 160 180 200
cycle
rad
ial
ov
er
wa
ter
(mm
)
0
2
4
6
8
10
12
14
16
18
Z (
mm
)
radialZLinear (Z)Linear (radial)

TOPEX Radial Orbit Difference TrendITRF2005 – GDR (CSR95)
Consequent error in estimated regional and global
MSL trends
TOPEX ITRF2005-GDR(CSR95) mean orbit differences (Jan '93 - Dec '01)
slope = -0.28 mm/yr
-5
-4
-3
-2
-1
0
1
2
3
4
5
0 50 100 150 200 250 300 350
cycle
rad
ial
(mm
)
radial (over water)
Linear (radial (over water))

Jason GSFC TRF orbit trends
Jason GSFC SLR/DORIS ITRF2005 - ITRF2000 orbit differences
slope = +1.44 mm/yr
slope = +1.27 mm/yr
0
0.2
0.4
0.6
0.8
1
1.2
1.4
1.6
1.8
2
0 20 40 60 80 100 120 140 160 180 200
cycle
Mea
n Z
(c
m)
itrf2005-itrf2000
itrf2005s-itrf2000
Linear (itrf2005-itrf2000)
Linear (itrf2005s-itrf2000)

Jason TRF orbit trends – JPL GPS
Jason ITRF2005 / ITRF2000 differences with ITRF2000 JPL GPS-only orbits
slope = +2.24 mm/yr
slope = +0.20 mm/yr
slope = +2.38 mm/yr
-2
-1.5
-1
-0.5
0
0.5
1
1.5
2
2.5
3
0 20 40 60 80 100 120 140 160
cycle
Mea
n Z
(c
m)
jpl_gps6b - slr/xover itrf2000slr/xover itrf2005 - jpl_gps6bslr/xover (itrf2005-itrf2000)Linear (jpl_gps6b - slr/xover itrf2000)Linear (slr/xover itrf2005 - jpl_gps6b)Linear (slr/xover (itrf2005-itrf2000))

Geocenter motion