Pocket ion chambers for beta radiation dose
105
UNCLASSIFIED MARTINMARIETTAENERGYSYSTEMS LIBRARIES 3 14M5L D3SDETD 2 MWRAL RESEARCH L1BRAKT CEdScumekt COLLECTION ORNL-2158 Instruments TIP 4500 (13th ed.)e»J.¥ POCKET ION CHAMBERS FOR BETA RADIATION DOSE Harry H. Hubbell, Jre Robert D, Bsrkhoff Raymond M„ Johnson OAK RIDGE NATIONAL LABORATORY OPERATED BY UNION CARBIDE NUCLEAR COMPANY A Division of Union Carbide and Carbon Corporation POST OFFICE BOX X• OAK RIDGE, TENNESSEE UNCLASSIFIED
Transcript of Pocket ion chambers for beta radiation dose

UNCLASSIFIED
MARTINMARIETTAENERGYSYSTEMS LIBRARIES
3 14M5L D3SDETD 2
MWRAL RESEARCH L1BRAKTCEdScumekt COLLECTION
ORNL-2158Instruments
TIP 4500 (13th ed.)e»J.¥
POCKET ION CHAMBERS FOR
BETA RADIATION DOSE
Harry H. Hubbell, JreRobert D, BsrkhoffRaymond M„ Johnson
OAK RIDGE NATIONAL LABORATORYOPERATED BY
UNION CARBIDE NUCLEAR COMPANYA Division of Union Carbide and Carbon Corporation
POST OFFICE BOX X • OAK RIDGE, TENNESSEE
UNCLASSIFIED
55Printed in USA. Price cents. Available from the
Office of Technical Services
U. S. Department of Commerce
Washington 25, D. C.
LEGAL NOTICE
This report was prepared as an account of Government sponsored work. Neither the United States,
nor the Commission, nor any person acting on behalf of the Commission:
A. Makes any warranty or representation, express or implied, with respect to the accuracy,
completeness, or usefulness of the information contained in this report, or that the use of
any information, apparatus, method, or process disclosed in this report may not infringe
privately owned rights; or
B. Assumes any liabilities with respect to the use of, or for damages resulting from the use of
ony information, apparatus, method, or process disclosed in this report.
As used in the above, "person acting on behalf of the Commission" includes any employee or
contractor of the Commission to the extent that such employee or contractor prepares, hondles
or distributes, or provides access to, any information pursuant to his amployment or contract
with the Commission.

Unclassified ORNL-2158
Contract No. W-7405-eng-26
HEALTH PHYSICS DIVISION
POCKET ION CHAMBERS FOR BETA RADIATION DOSE
Harry H. Hubbell, Jr.Robert D. Birkhoff
Raymond M. Johnson
Date Issued
APR 261957
Oak Ridge National laboratoryOperated by
Union Carbide Nuclear CompanyA Division of Union Carbide and Carbon Corporation
Post Office Box X
Oak Ridge, Tennessee
Unclassified
MARTINMARIETTA ENERGY SYSTEMS LIBRARIES
3 im5b D3SD5TD 2
4k
1.
2.
3.4-6.
7.
8-2*4-.
25-26.
27.28.
29.30.
31.32.
33.34.35.36.37.38.39-1+0.4i.42.
43.1+4.
45-46.
1+7-W.49-50.
51.52.
53.54.55.56.57-58.59-
60-109.110.
ill.
112.
113.
sifiec1 ii
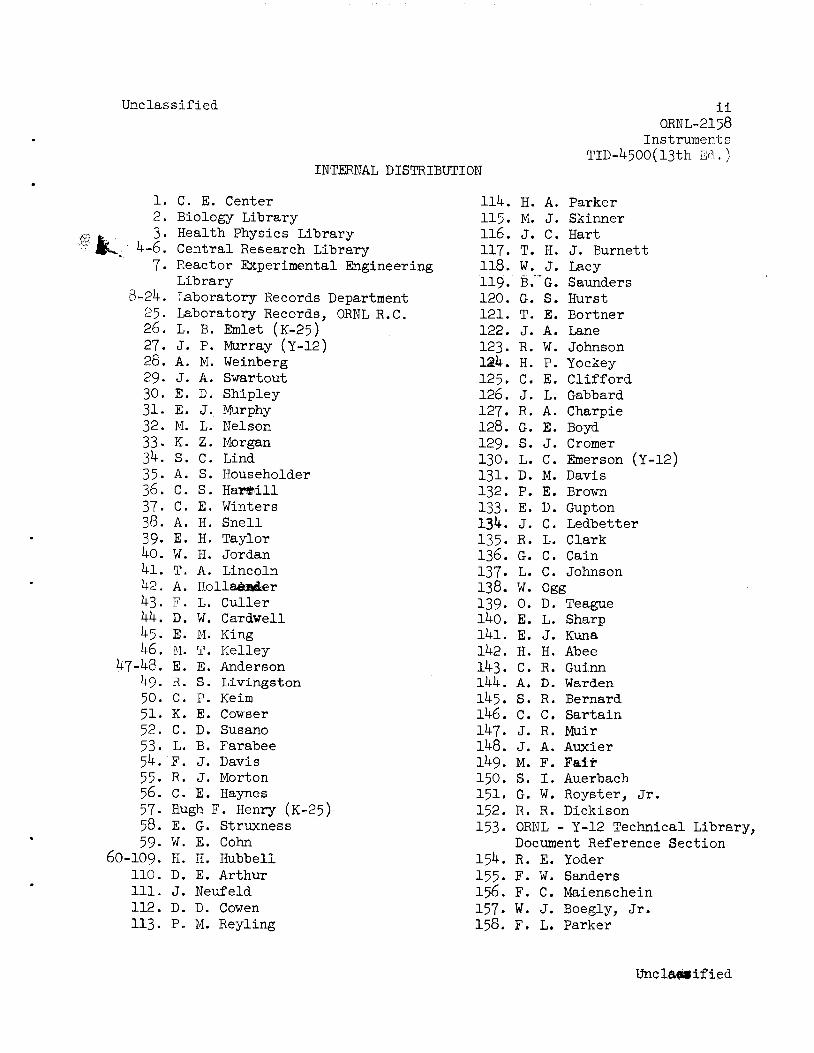
ORNL-2158Instruments
TID-4500(l3th Eel.)INTERNAL DISTRIBUTION
C. E. Center 114. H. A. Parker
Biology Library 115. M. J. Skinner
Health Physics Library 116. J. C. Hart
Central Research Library 117- T. H. J. Burnett
React;or Experimental Engineering 118. W. J. LacyLibrary 119. B."G. Saunders
Laboratory Records Department 120. G. S. Hurst
Laboratory Records, ORNL R.C. 121. T. E. Bortner
L. B. Emlet (K-25) 122. J. A. Lane
J. P. Murray (Y-12) 123. R. W. Johnson
A. M. Weinberg 124. H. P. YockeyJ. A. Swartout 125. C. E. Clifford
E. D. Shipley 126. J. L. Gabbard
E. J., Murphy 127. R. A. CharpieM. L. Nelson 128. G. E. BoydK. Z. Morgan 129. S. J. Cromer
S. C. Lind 130. L. C. Emerson (Y-12)A. S. Householder 131. D. M. Davis
C. S. HarSill 132. P. E. Brown
C. E. Winters 133- E. D. GuptonA. H. Snell 134. J. C. Ledbetter
E. H. Taylor 135. R. L. Clark
W. H. Jordan 136. G. C. Cain
T. A. Lincoln 137. L. C. Johnson
A. Eollatoier 138. W. OggF. L. Culler 139. 0. D. TeagueD. W. Cardwell 140. E. L. SharpE. M. King 141. E. J. Kuna
M. T. Kelley 142. H. H. Abee
E. E. Anderson 143. C. R. Guinn
R. S. Livingston 144. A. D. Warden
C. P. Keini 145. S. R. Bernard
K. E. Cowser 146. C. C. Sartain
C. D. Susano 147. J. R. Muir
L. B. Farabee 148. J. A. Auxier
F. J. Davis 149. M. F. Fair
R. J. Morton 150. S. I. Auerbach
C. E. Haynes 151. G. W. Royster, Jr.Hugh F. Henry (K-25) 152. R. R. Dickison
E. G. Struxness 153. ORNL •- Y-12 Technical Library,W. E. Cohn Document Reference Section
H. H. Hubbell 154. R. E. Yoder
D. E. Arthur 155. F. W. Sanders
J. Neufeld 156. F. C. Maienschein
D. D. Cowen 157. w. J. Boegly, Jr.P. M. Reyling 158. F. L. Parker
Uncl&aaiified

Unclassified
159. W. E. Lotz160. B. Fish161. M. B. Edwards
162. F. M. Empson163. G. G. Robeck164. R. D. Birkhoff
165. R. H. Ritchie166. J. A. Harter
167. W. G. Stone168. J. S. Cheka169. P. N. Hensley170. R. W. Peelle
EXTERNAL DISTRIBUTION
iia
171. C. P. Straub, Public Health Service, Robert A.172. R. M. Collier, University of Florida173. Physics and Engineering Group, Balcones Research Center, RFD 4, Box 189,
Austin, Texas174. R. F. Bacher, California Institute of Technology175. G. E. Thoma, USAF176. H. J. McAlduff, AEC, Oak Ridge177. Vanderbilt University, Physics Department Library178. Vanderbilt University, Joint University Library179. Massachusetts Institute of Technology, Department of Electrical Engr.180. University of California, Gerhard Klein181. R. M. Richardson, U.S. Geological Survey, 2-C P.O. Building, Knoxville,
Tennessee
182. C. V. Theis, U.S. Geological Survey, Box 433, Albuquerque, New Mexico183. Lola Lyons, Librarian, Olin Industries, Inc., East Alton, Illinois184. Jack Story, University of Chicago, Argonne Cancer Research Hospital,
950 East 59th Street, Chicago 37, Illinois185. J. H. Ebersole, USSS Nautilus, c/o Fleet Post Office, New York, New York186. David Smith, Electric Boat Division, Groton, Connecticut187. Division of Research and Development, AEC, 0R0188. S„ C. Sigoloff, USAF, The Radiobiological Laboratory, University of Texas
and U.S. Air Force, Austin, Texas189. Robert Wood, Department of Physics, Memorial Center, 444 E. 68th Street,
New York 21, New York190. F. N. Huffman, Glenn L. Martin Co., Baltimore, Maryland191. R. Schwaar, Chem. Engr. Lab., Princeton University, Princeton, New Jersey192. L. V. Spencer, National Bureau of Standards, Washington 25, D.C.193. H. Ho Rossi, Columbia University, 630 W. l68th St., New York 32, New York194. F. H. Attix, National Bureau of Standards, Washington 25, D. C.195. Duane Mayhew, Victoreen Instrument Co., 5806 Hough Ave., Cleveland 3, Ohio196. J. S. Laughlin, Memorial Center, 444 E. 68th Street, New York 21, New York197. M. Danzker, Memorial Center, 444 E. 68th Street, New York 21, New York198. Gail D. Adams, Jr., Radiological Lab., University of California, San
Francisco 22, California199-223. R. M. Johnson, Westinghouse Research Labs., Beulah Road, E. Pittsburgh,
Pennsylvania224-784. Given distribution as shown in TID 4500 (13th ed. ) under Instruments
category (100 copies - OTS)
Taft Sanitary Eng. Center
Unclassified
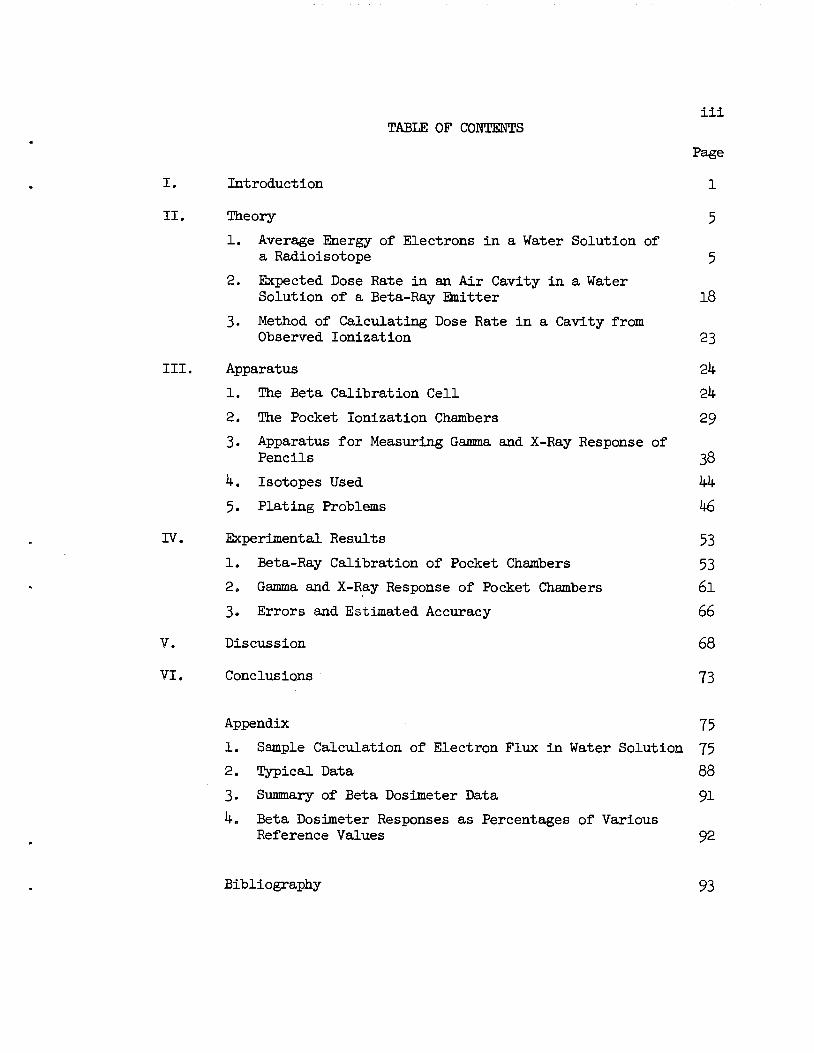
iii
TABLE OF CONTENTS
Page
I. Introduction 1
II. Theory 5
1. Average Energy of Electrons in a Water Solution ofa Radioisotope 5
2. Expected Dose Rate in an Air Cavity in a WaterSolution of a Beta-Ray Emitter 18
3. Method of Calculating Dose Rate in a Cavity fromObserved Ionization 23
III. Apparatus 24
1. The Beta Calibration Cell 24
2. The Pocket Ionization Chambers 29
3. Apparatus for Measuring Gamma and X-Ray Response ofPencils 38
4. Isotopes Used 44
5. Plating Problems 46
IV. Experimental Results 53
1. Beta-Ray Calibration of Pocket Chambers 53
2. Gamma and X-Ray Response of Pocket Chambers 6l
3. Errors and Estimated Accuracy 66
V. Discussion 68
VI. Conclusions 73
Appendix 75
1. Sample Calculation of Electron Flux in Water Solution 75
2. Typical Data 88
3. Summary of Beta Dosimeter Data 91
4. Beta Dosimeter Responses as Percentages of VariousReference Values 92
Bibliography 93
IV
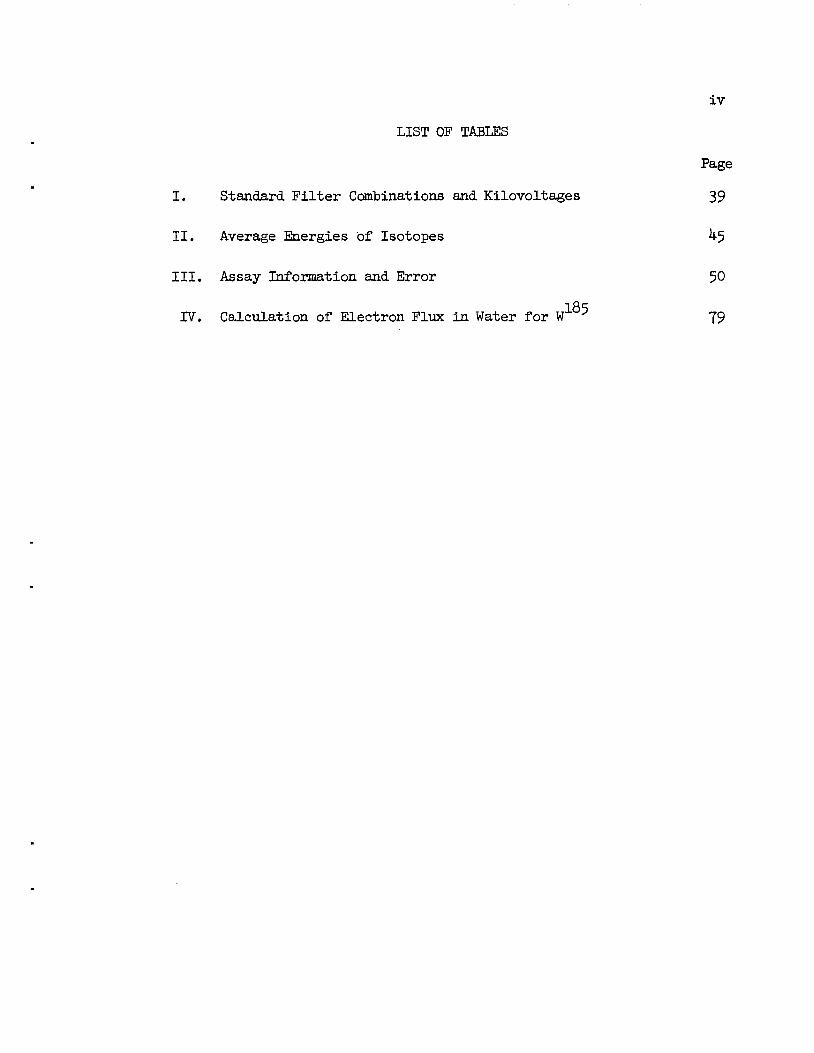
LIST OF TABLES
I. Standard Filter Combinations and Kilovoltages 39
II. Average Energies of Isotopes 45
III. Assay Information and Error 50
185IV. Calculation of Electron Flux in Water for W 79
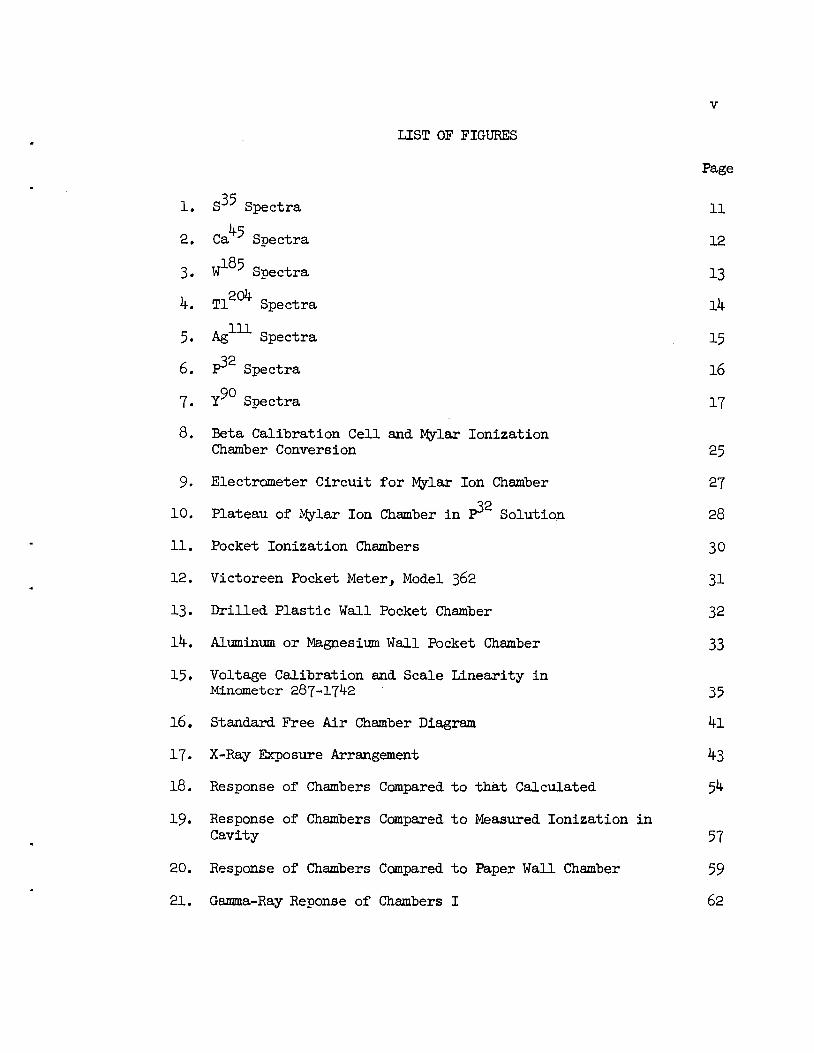
LIST OF FIGURES
Page
1. S35 Spectra 11452. Ca J Spectra 12
3. W ^Spectra 13. 2044. Tl Spectra l4
5. Ag Spectra 15
6. P3 Spectra 1690
7. lr Spectra 17
8. Beta Calibration Cell and Mylar IonizationChamber Conversion 25
9. Electrometer Circuit for Mylar Ion Chamber 27
10. Plateau of Mylar Ion Chamber in P3 Solution 28
11. Pocket Ionization Chambers 30
12. Victoreen Pocket Meter, Model 362 31
13. Drilled Plastic Wall Pocket Chamber 32
14. Aluminum or Magnesium Wall Pocket Chamber 33
15. Voltage Calibration and Scale Linearity inMinometer 287-1742 35
16. Standard Free Air Chamber Diagram 4l
17. X-Ray Exposure Arrangement 43
18. Response of Chambers Compared to that Calculated 5k
19. Response of Chambers Compared to Measured Ionization inCavity 57
20. Response of Chambers Compared to Paper Wall Chamber 59
21. Gamma-Ray Reponse of Chambers I 62
vi
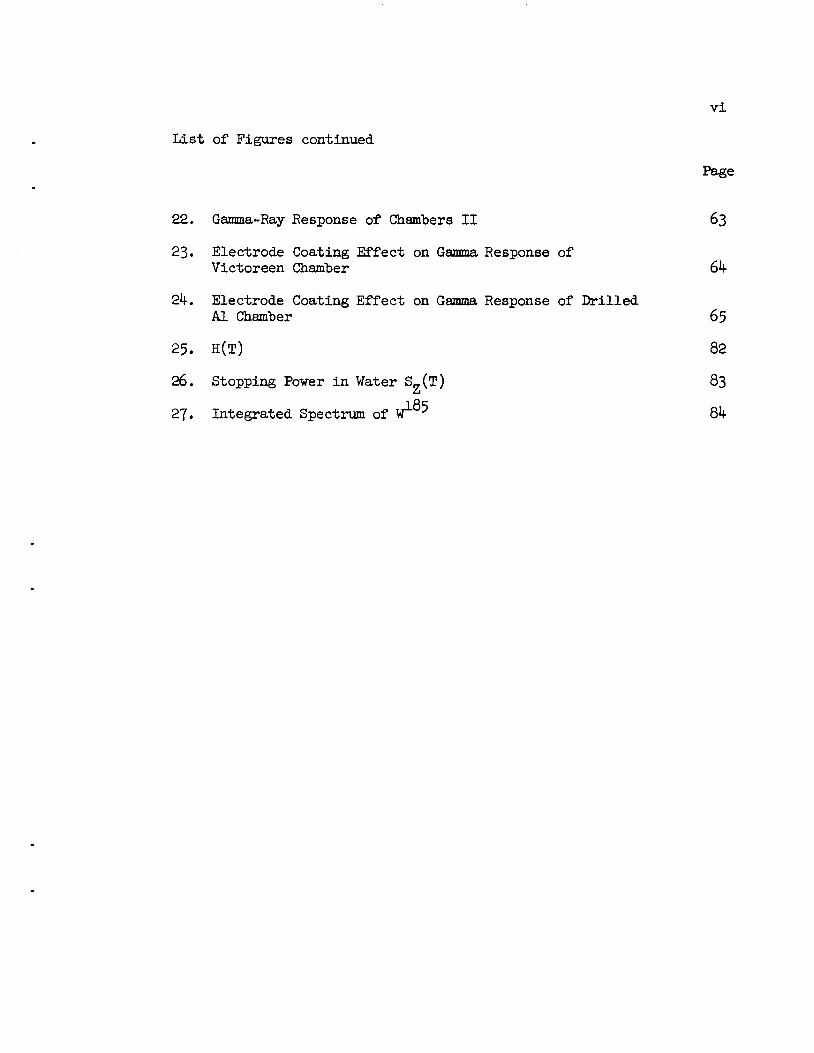
List of Figures continued
Page
22. Gamma-Ray Response of Chambers II 63
23. Electrode Coating Effect on Gamma Response ofVictoreen Chamber 64
24. Electrode Coating Effect on Gamma Response of DrilledAl Chamber 65
25. H(T) 82
26. Stopping Power in Water S_(T) 83
27. Integrated Spectrum of W~ * 84
VX1
ACKNOWLEDGMENTS
The authors wish to express their appreciation to L. B. Farabee,
B. H. Ketelle and B. Kahn for assistance with the chemical problems; to
R. H. Ritchie and J. S. Cheka for help on the calculations; and to
H. A. Parker and his group for making the radio-assays of the solutions.
The method of calibrating the dosimeters by immersing them in a
water solution was suggested to us by Dr. Harald H. Rossi, to whom
grateful acknowledgment is made.
One of us (RMJ) held a Radiological Physics Fellowship of the U. S.
Atomic Energy Commission during this work.

Vlll
ABSTRACT
A pocket ionization chamber has been developed which in conjunction
with a commercial gamma reading pocket chamber can be used to estimate the
beta dose received, or if used alone, to measure the combined beta-gamma
dose. The problem was to obtain a simple, rugged chamber which would have
a wall sufficiently thin to pass the lower energy beta rays and which would
give either no response for gamma rays or one of the same magnitude as the
gamma reading pocket meter. Of the six dosimeters constructed and tested,
the perforated aluminum walled chamber gave the best beta response. Its
response over the range of average energies from about 52 kev to 694 kev
varied from about 50$ to about Qofo of the dose received by the germinal
layer of the skin. The response of this chamber to low energy gamma
radiation (up to 700 kev) approximates that of the commercial Victoreen
pocket chamber. All beta rays of energies less than that which will reach
the basal layer of the epidermis were excluded by the 7mg/cm2 wall
surrounding the sensitive volume. A new method is described for calibrating
a pencil for a degraded spectrum of radiation, such as is commonly found in
the field. The dosimeter is inserted into the center of an infinite
homogeneous aqueous solution of a radioisotope whose beta ray spectrum is
known. The dose rate measured by the various pencils is expressed as a
percentage of the response of a 7 mg/cm paper walled laboratory standard
chamber; an effectively zero thickness wall Mylar ion chamber; or the dose
rate as calculated from the Bragg-Gray principle and the specific activity
of the solution. Included in this paper are the calculations of the flux
of electrons in water solution for the beta emitters S3-5, Ca ,W1 ^, Tl2 ,Ag111, P32, aaa y90.

I. INTRODUCTION
The health physicist has always concerned himself with the total
beta plus gamma dose received by a person working in a radiation field.
At ORNL this dose is estimated in advance by a surveyor using a "paper
chamber Cutie Pie." This instrument measures not only gamma radiation
but beta radiation as well, while the pocket chamber worn by the worker
in a radiation field measures essentially only the gamma radiation. As
a result, there may be a large discrepancy between the dose estimated by
the health physics surveyor and the dose that is read on the worker's
pocket chamber. There is need therefore for a personnel dosimeter
sensitive to beta rays.
The problems in attempting to build a beta-sensitive dosimeter
are two fold—first, engineering problems in design, construction, and
use, and, second, the problem of accurate calibration of such an instrument.
The first problem was solved by the use of a pencil with a sensitive volume
of the same size as that used in the standard gamma chambers. This volume
is defined by a layer of conducting paper 7 mg/cm thick, that being the
This is an instrument in which an ion chamber with a minimum wall
thickness of 7 mg/cm2 is coupled with a balanced bridge circuit having anelectrometer tube as one arm of the bridge. The ion current develops avoltage on the grid of the tube, unbalancing the bridge and allowing acurrent proportional to the ionization in the chamber to pass through amicroammeter calibrated in mr/hr.

assumed minimum depth of the cells in the basal layer of the human
2 3epidermis. ,J Thus the radiation seen by the pencil is the same as
is seen by the germinal layer of the skin. To give mechanical strength
to this paper chamber an outer cylinder of perforated aluminum,
magnesium or drilled plastic is slipped over the paper chamber. The
overall size is the same as the standard pocket pencil, and since the
sensitive volume is the same, it may be read with the same Minometer to
4approximately the same + 10$ accuracy ofreading.
The accurate calibration of the beta chamber involves securing a
strong, known spectrum of beta radiation. One cannot get point or plane
sources of sufficient activity to be useful which still emit an undis-
torted thin source spectrum. Due to the very short range of betas in a
finite medium, the spectrum is degraded to an unknown extent. In addition,
the range of betas in air is a limiting factor, being only 0.11 meter for
100 kev electrons and only 3.7 meters for a 1 Mev electron. Another
obstacle to the use of the source in air is the lack of accurate knowledge
of the coefficients of attenuation of betas in air. Attempts to calibrate
the chambers in cylinders of natural uranium were not satisfactory because
2National Bureau of Standards, "Permissible Dose from External Sources
of Ionizing Radiation," Handbook 59, p. 39, U. S. Department of Commerce,Washington, D. C. (September 1954).
3In commercial construction this paper might be replaced by a plastic
wall coated inside with graphite and having the same superficial density of7 mg/cm2.
14.Frank H. Day, "X-Ray Calibration of Radiation Survey Meters, Pocket
Chambers, and Dosimeters," p. 6, NBS Circular 507.
of the difficulties encounted in calculating the electron flux spectrum
in this material.
The calibration problem was solved by using a very thin walled
cavity in a homogeneous water solution of a beta emitting isotope. The
cell holding the solution was large in dimensions compared to the range
of highest energy betas emitted. Hence it was possible to calculate the
dose easily from a knowledge of the primary beta energy spectrum and the
specific activity of the solution.
The theoretical problems which are considered in this report are
then as follows:
1. The calculation of the average energy of the primary and
secondary electrons in this cavity. This required the calculation of
the spectra of these electrons for each isotope;
2. The method of calculating the expected dose rate in a cavity
in water solution of a beta-emitting radioisotope from its beta spectrum
and specific activity;
3. The method of determining experimentally the dose rate in the
cavity from the observed ionization there. These dose rates served as
checked on those calculated by method 1.
The experimental problems which are discussed are these:
1. The design of a reasonably strong pocket ionization chamber
with thin walls;
2. The design of a calibration cell for these chambers which has
a cavity with walls of negligible thickness surrounded by water solution;
3. The choice, handling and assay of the radioisotopes;
4. The comparison of the observed dose rates in water solutions
of beta ray emitting isotopes with those calculated;
5. The effect of cavity wall thickness on the dose rate in a
cavity in the solution;
6. The response of the pencil chambers to gamma and x rays;
7. The interpretation of the results on beta and gamma response
of the chambers in terms of permissible exposures to personnel.
II. THEORY
1. Average Energy of Electrons in a Water Solution of a Radioisotope
All pencil response curves for beta radiation were obtained from
isotopes in a water solution. Therefore, it was preferable that results
be given as a function of the average energy of the beta flux in that
medium rather than the maximum or average energy of the nuclear beta
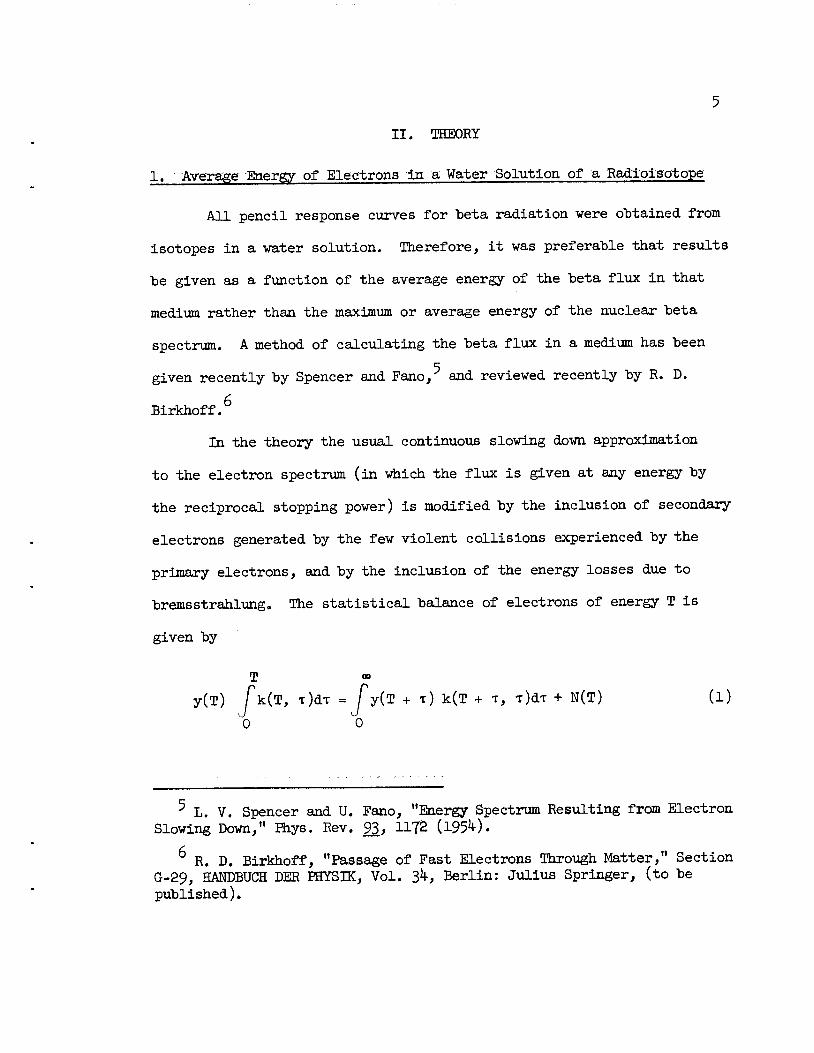
spectrum. A method of calculating the beta flux in a medium has been
given recently by Spencer and Fano, and reviewed recently by R. D.
Birkhoff.
In the theory the usual continuous slowing down approximation
to the electron spectrum (in which the flux is given at any energy by
the reciprocal stopping power) is modified by the inclusion of secondary
electrons generated by the few violent collisions experienced by the
primary electrons, and by the inclusion of the energy losses due to
bremsstrahlung. The statistical balance of electrons of energy T is
given by
T »
y(T) Tk(T, T)dT = Ty(T +t) k(T +t, *)dt +N(T) (l)
^ L. V. Spencer and U. Fano, "Energy Spectrum Resulting from ElectronSlowing Down," Fhys. Rev. 93., H72 (1954).
R. D. Birkhoff, "Passage of Fast Electrons Through Matter," SectionG-29, HANDBUCH DER PHYSIK, Vol. J>k, Berlin: Julius Springer, (to bepublished).

6
where y(T) has the dimensions cm energy" and represents the distance
covered by electrons of energy T per unit energy interval. (The
function y(T) may also be considered to represent the flux of electrons
2with dimensions of the number of electrons per cm per sec per unit
energy). The symbol k(T, t) indicates the probability per unit path of
an energy loss t from an electron of energy T, and the N(T) indicates
the number of electrons being born at energy T from the beta-ray
continuous spectrum. In principle the problem may now be solved as the
function k(T, t) is just the MSller' cross section. Stepwise numerical
methods may be used starting at the higher energy T-. and working down
in energy. However, the unfortunate large increase in k(T, t) as x
becomes very small renders such an approach unworkable. Recasting the
problem in integral form, the equivalent of the above equation may be
written,
00 00
fdT< y(T«) K(T«, T) = Tn(T')dT« (2)T T
where
DO
K(T', T) =J k(T«, T)dT (3)Tf-T
T C. Moller, Ann. d. Physik 14, 531 (1932).
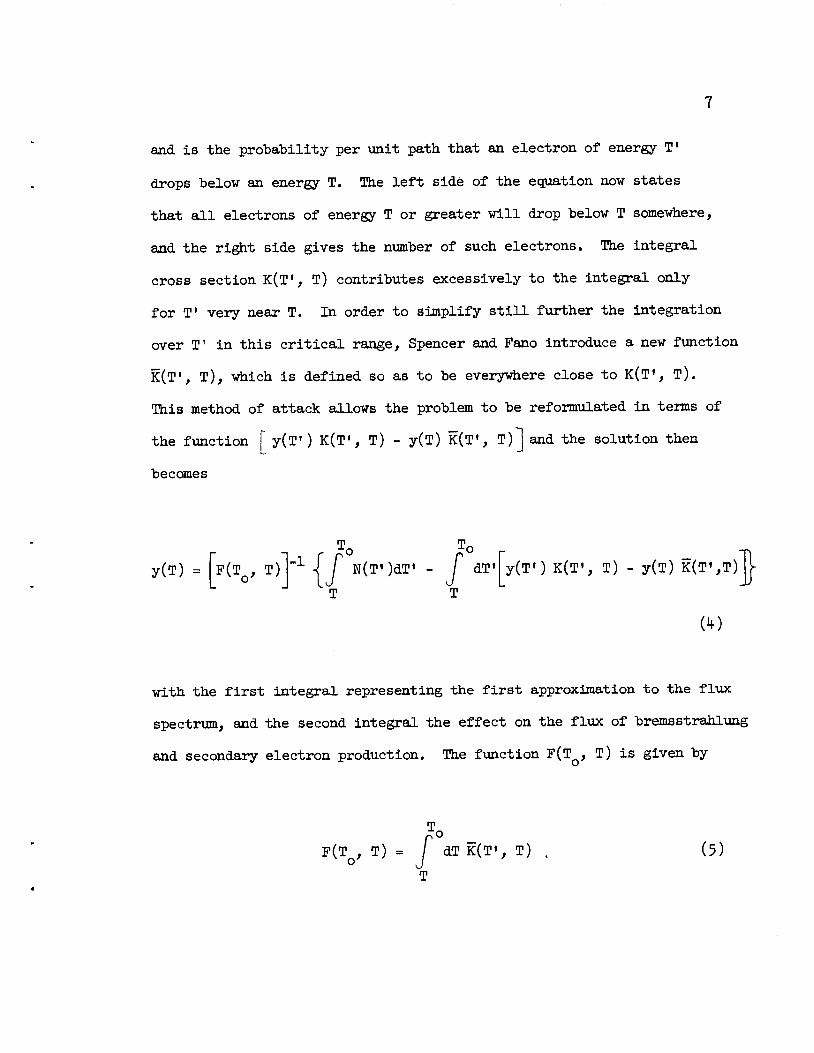
and is the probability per unit path that an electron of energy T'
drops below an energy T. The left side of the equation now states
that all electrons of energy T or greater will drop below T somewhere,
and the right side gives the number of such electrons. The integral
cross section K(T', T) contributes excessively to the integral only
for T' very near T. In order to simplify still further the integration
over T' in this critical range, Spencer and Fano introduce a new function
K(T', T), which is defined so as to be everywhere close to K(T', T).
This method of attack allows the problem to be reformulated in terms of
the function
becomes
y(T') K(T', T) -y(T) K(T', T)l and the solution then
To £oy(T) = F(Tq, T) 1I TN(T')dT« - fdT' y(T') K(T», T) -y(T) K(T',T) j
T T
00
with the first integral representing the first approximation to the flux
spectrum, and the second integral the effect on the flux of bremsstrahlung
and secondary electron production. The function F(TQ, T) is given by
T,0
F(Tq, T) = fdT K(T', T) . (5)T

8
In obtaining a solution to the above equation the electron-
electron collisions are considered as being responsible for both a
loss of energy from the primary flux and as a source of secondary
electrons which contribute to the flux at lower energies. The
bremsstrahlung losses are divided in such a way that the smaller losses
are considered as dissipating energy from the primary radiation while
the larger losses are treated as a negative source of electrons. The
final integral equation, although somewhat involved algebraically,
permits a straightforward numerical evaluation.
For moderate initial electron energies the bremsstrahlung may be
neglected if absorption takes place in a light material. Under these
conditions the theory may be approximated by the simple expression,
To *oy(T) = SZ(T) -1 jJ N(T')dT» + J Kg(T', T) y(T')dT» j- (6)
T 2T
where S„(T) is just the average stopping power at energy T; N(T') is the
source spectrum, and K (T', T) may be taken ass
2rtNer r ~sK (T1, T) = 5- 4t"X - (T« -T)"X \s (BM2 I J
(7)
2 2with N the electronic density in the medium and r = e /m c . The first

9
integral represents the contribution from the primary electrons, and the
second integral is the buildup of secondaries.
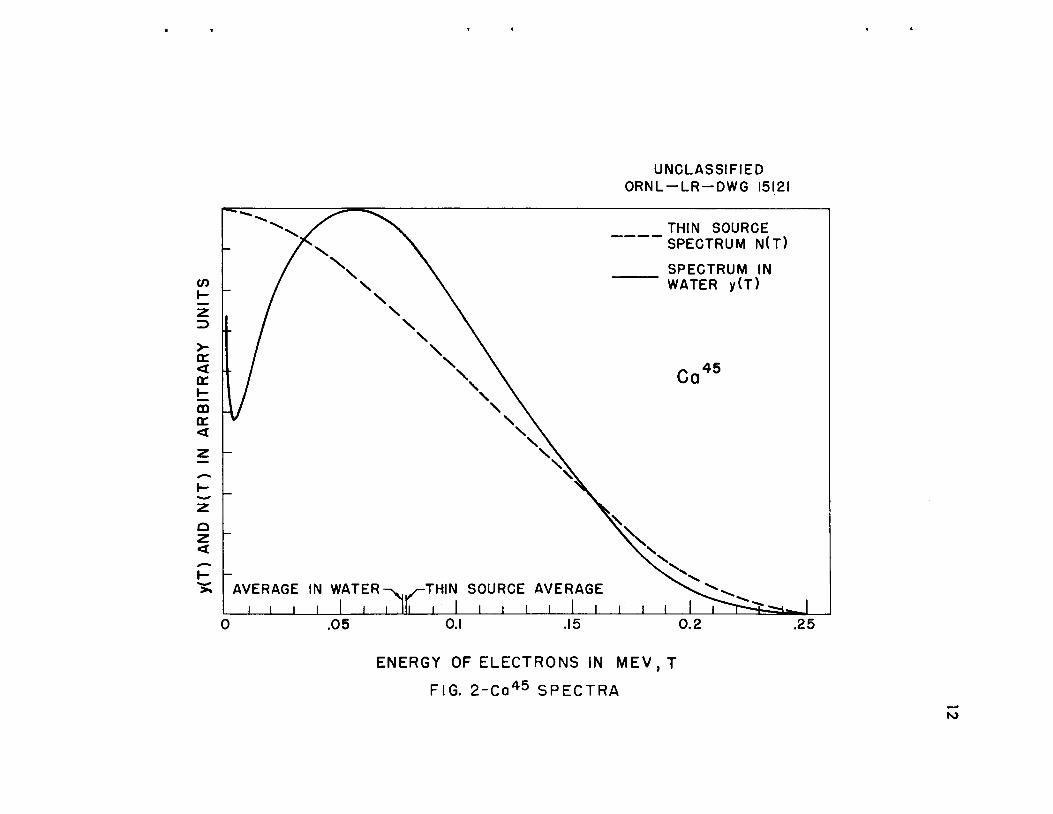
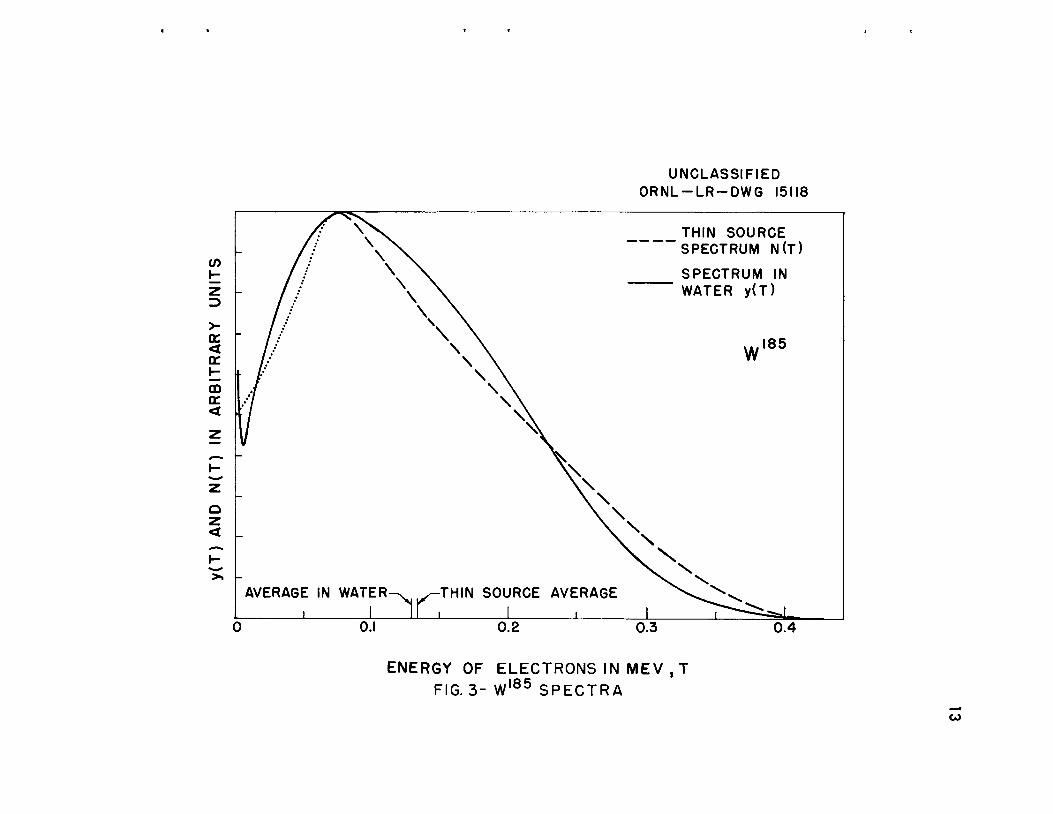
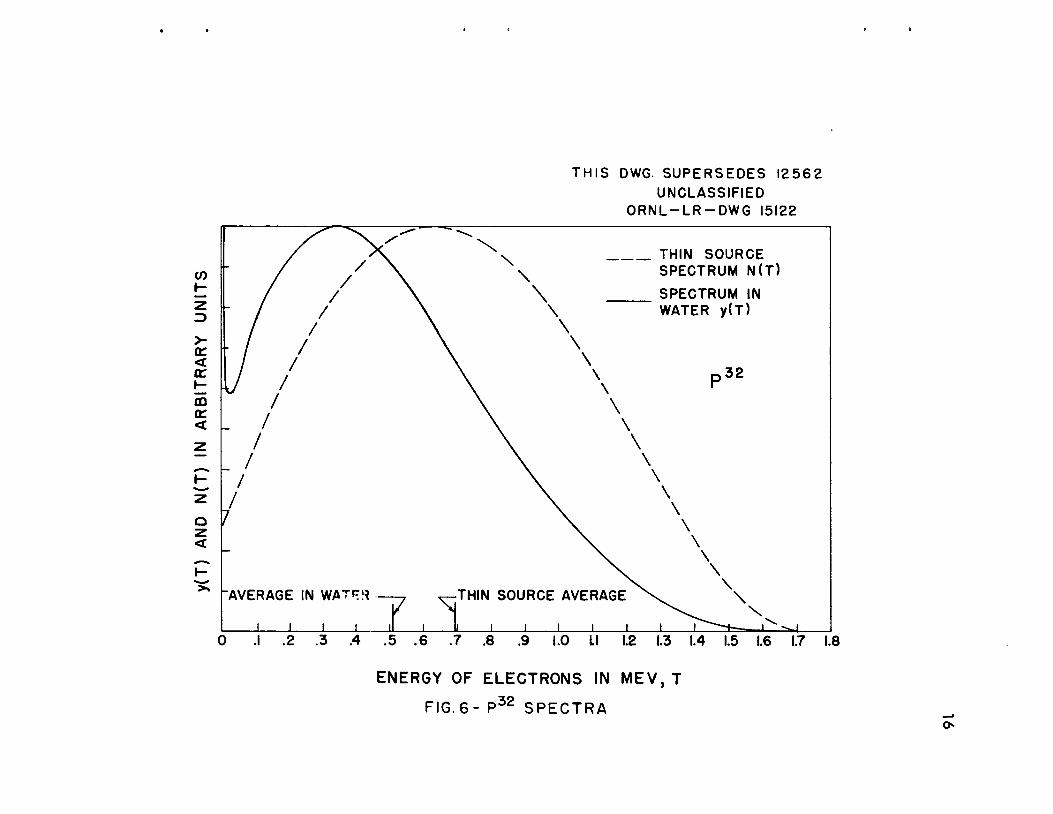
Calculations with the above simplification have been carried out
(see Appendix, SAMPLE CALCULATIONS, Part l) for sources used in the
experiment and the results are shown in Figs. 1-7- Although the
stopping power and electron-electron scattering cross section (contained
in K ) are not well known at low energy, calculations were carried downs
to 1 kev. The results indicate a large buildup of electrons at low
energy which may well be important biologically.
It is to be noted that N(T) and y(T) are physically and dimensionally
different quantities and are plotted on the same coordinates in Figs. 1-7
for convenience only. The relative heights of points on the two curves
at any energy are not comparable or significant because of normalization
used. Only the general shapes of the curves are to be compared.
The average energy of the electrons in each of these spectra was
calculated in the usual way as Tjj from the equation
TQ / TQT-/ T.(TM* // XT** (8)
0
and similarly for T for the flux y(T). The results are marked on the
abscissae scales of the figures.
The value f„ was used in computing the average energy absorbed in

10
the water per unit volume. The value T was considered to measure the
average energy of the flux of electrons traversing the water solution.
The energy loss for electrons in a small air cavity in the medium
will be negligible, so the spectrum of electrons in the cavity is also
y(T). Hence the abscissae of points on the response curves to be dis
cussed below for our chambers were taken as the values of T from the
y(T) spectra.
The values for T in each case depend on the shape of the spectrum
of the betas emitted. For those elements whose spectra are well known
we can assign the average energy within about + 3$, but in several
cases the spectra are not "allowed" spectra, and the accuracy of the
experimental data available for these spectra does not justify an
estimated limit of error smaller than + 10$. The experiments referred
to in some cases suffered from backscattering, thick sources, and
absorption in the counter walls.

<ach-
m
<
oz<
AVERAGE IN WATER-^ --THIN SOURCE AVERAGEMl , , i , L
UNCLASSIFIED
ORNL-LR-DWG 15119
THIN SOURCE
SPECTRUM N(T)
SPECTRUM IN
WATER y(T)
ENERGY OF ELECTRONS IN MEV,T
FIG. I- S35 SPECTRA
CO
Z
>-tr<en
m
tr<
<
AVERAGE IN WATER^^-THIN SOURCE AVERAGEi III i I I I I I I L_
UNCLASSIFIED
ORNL-LR-DWG 15121
THIN SOURCE
SPECTRUM N(T)
SPECTRUM IN
WATER y(T)
ENERGY OF ELECTRONS IN MEV,T
FIG. 2-Ca45 SPECTRAfO
en
>-cc<
m
<
z
Q
<
UNCLASSIFIED
ORNL-LR-DWG 15118
~^\/• \\ THIN SOURCE
/: \ xSPECTRUM N(T)
. 1 \ \\ \
\ \SPECTRUM IN
WATER y(T)
\ \I / V \
1 • \ \If \ \
\ \W'85
J\ \
\ \\\
i f \\
NX\\\\\\
\ \\ \
x \x \
— \ \AVERAGE IN WATER^^-THIN SOURCE
1 H i 1
AVERAGE ^O^I , ^r^as^L
O.I 0.2 0.3
ENERGY OF ELECTRONS IN MEV , TFIG. 3- W185 SPECTRA
0.4
GO

GO
>-CC<cc
CD
or
<
Q
z<
pAVERAGE IN WATER
I I
0.1 0.2 0.3 0.4 0.5
UNCLASSIFIED
ORNL-LR-DWG 15123
THIN SOURCE
SPECTRUM N(T)
SPECTRUM IN
WATER y(T)
0.6
•THIN SOURCE AVERAGE ^ ^J 1 I I I I L
Tl
0.7
204
0.8
ENERGY OF ELECTRONS IN MEV, T
FIG. 4- TI204SPECTRA

CO
H
z3
>-or<or
m
or<
<
P
AVERAGE IN WATER
_j I , I i_0.2
-THIN SOURCE AVERAGE
I I I I L
UNCLASSIFIED
ORNL-LR-DWG 15117
THIN SOURCE
SPECTRUM N(T)
SPECTRUM IN
WATER y(T)
ENERGY OF ELECTRONS IN MEV.T
FIG.5- Ag111 SPECTRAtn
CO
or<or
coor<
Q
<
THIS DWG- SUPERSEDES 12562
UNCLASSIFIED
ORNL-LR-DWG 15122
,^~ "N. ^»- 1 ^»
/ x^^ X\
\
THIN SOURCE
/ // /
SPECTRUM N(T)
\ SPECTRUM IN
^ \ WATER y(T)
/ / \ \\ \
/ / \ \\J / \ \
\ \p32
/ \ \_ / \ \
/ \ \/ \ \
/ \
/7
\\\\\\\
x \"AVERAGE IN WAT*^
i
^-THIN SOURCE AVERAGE^h i i I i ii i i i i
.1 .2 .3 .4 .5 .6 .7 .8 1.0 LI 1.2 1.3 1.4 1.5 1.6 1.7 1.8
ENERGY OF ELECTRONS IN MEV,T
FIG.6- P32 SPECTRA

CO
>-or<or
h-
00
or
<
o
z<
UNCLASSIFIED
ORNL-LR-DWG 15120
/^~ ^X"*—""' —.
/ y\ ^•"•^ THIN SOURCE
/ / \ •v. — SPECTRUM N(T)/ / \
/ / \ SPECTRUM IN
r / / \/ / \
X\
WATER y(T)
1/ / \ \/
/"/
/-/
\ \ Y90\ \
\ \\ \
/\
\\
\\
\—
\\
x \- \ \AVERAGE IN WATERy
i t j i 1 i L
.—THIN SOURCE AVERAGE
. 1 1 . i i i 1 i i i i---4—1\ i0.5 1.5
ENERGY OF ELECTRONS IN MEV, T
FIG7- Y90 SPECTRA
2.0
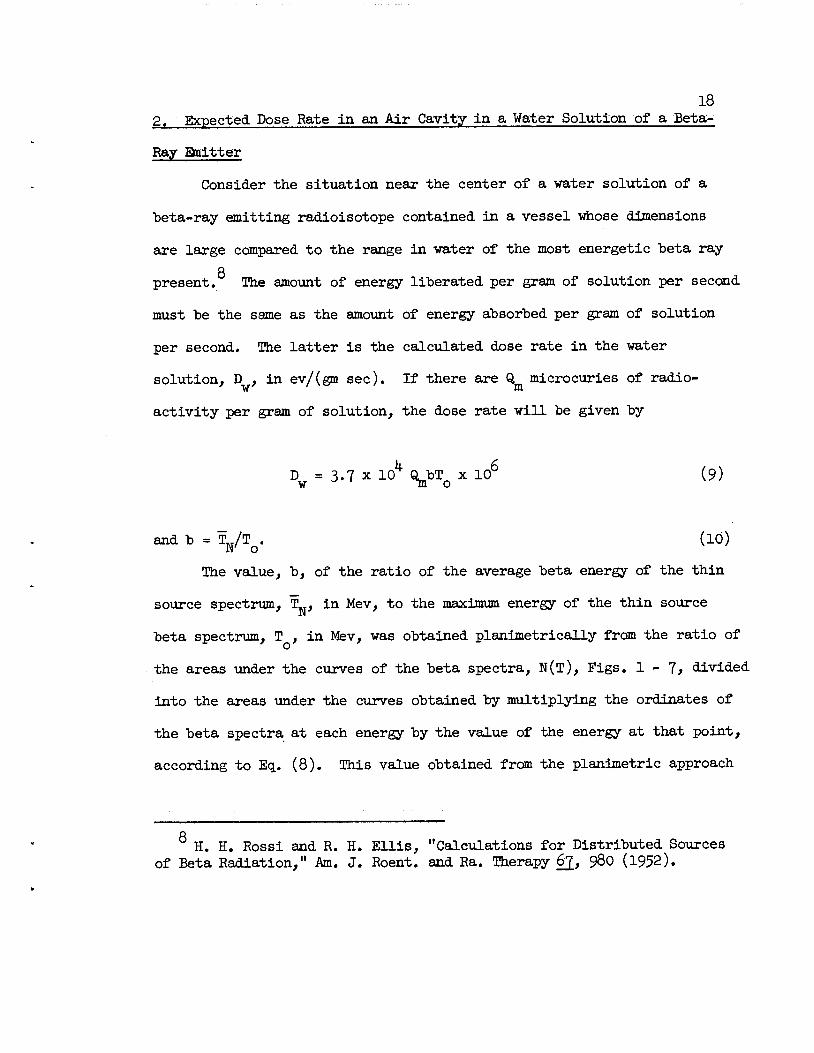
18
2. Expected Dose Rate in an Air Cavity in a Water Solution of a Beta-
Ray Emitter
Consider the situation near the center of a water solution of a
beta-ray emitting radioisotope contained in a vessel whose dimensions
are large compared to the range in water of the most energetic beta ray
Q
present. The amount of energy liberated per gram of solution per second
must be the same as the amount of energy absorbed per gram of solution
per second. The latter is the calculated dose rate in the water
solution, D , in ev/(gm sec). If there are Q^ microcuries of radio
activity per gram of solution, the dose rate will be given by
Dw =3-7 x10^ «y>To x106 (9)
and b =fN/T . (id)
The value, b, of the ratio of the average beta energy of the thin
source spectrum, T„, in Mev, to the maximum energy of the thin source
beta spectrum, T , in Mev, was obtained planimetrically from the ratio of
the areas under the curves of the beta spectra, N(T), Figs. 1 - 7> divided
into the areas under the curves obtained by multiplying the ordinates of
the beta spectra at each energy by the value of the energy at that point,
according to Eq.. (8). This value obtained from the planimetric approach
8H. H. Rossi and R. H. Ellis, "Calculations for Distributed Sourcesof Beta Radiation," Am. J. Roent. and Ra. Therapy 6j_, 980 (1952).

19
9may be approximated by an empirical equation given by K. Z. Morgan,
b=T/T =0,33 (1 -Z1/2/50)(l +T1/2/4). (11)
As an example we take P^ . From Eq, (ll) we get b = O.k-tik as compared
with a planimetric value of 0.409.
One then uses the Bragg-Gray principle to calculate the dose in
an air cavity in the solution. The principle states that the energy
deposited per gram of air in a small cavity in an irradiated medium is
equal to the energy deposited per gram in the medium, multiplied by the
ratio of the stopping power per gram of air to that per gram of medium
for the electrons traversing the cavity and medium. If the stopping
power per electron is denoted by Se, the energy deposited per cubic
centimeter in the cavity is
D _p (se)a W h0 ps (12)
" K. Z. Morgan, "Health Control and Nuclear Research," Chap. VI,Eq. 6-8, (to be published). K. Z. Morgan, "Handbook of Radiation Hygiene,"Hanson Blatz, ed., Chap. 15, Eq. 11, (to be published by McGraw-Hill, N.Y.)An earlier form of this equation was included by Morgan as the second termin Eq. C5, p. 35, in Suppl. Wo. 6, Brit. J. Radiol. (London 1955)*"Recommendations of the Int. Comm. on Radiological Protection,"
10 (a) W. Bragg, STUDIES IN RADIOACTIVITY, London, MacMillan and Co.(1912); (b) L. H. Gray, Proc0 Roy. Soc. (Lond,) 122A, 6k7 (1929); (c) L. H.Gray, Proc. Roy. Soc. (Land.) 156A, 578 (1936); (d) L. H. Gray, Brit. J.Radiol. 10, 600, 721 (1937); (e) L. H. Gray, Proc. Cambc Phil. Soc, kO,72 (19^77

20
.^„,m ..6 Paor Do = (3.7 x 10*) QbT x 10a" ^" — ' V*oAJ-w (13)
w w
where ,„, .. /„ /. \
B » v -»• v . (14)(Se) (Z^Aj
Bw is the ratio of the mass stopping power of the medium to that of air
and has values ranging from 1.025 at beta energy of 0.1 Mev to 1.019 at
1.0 Mev. The density p and p were taken to 0.001293 gm/cnr and
1.00 gm/cm and thus the above dose rate is assumed to be at 0° C. and
760 mm Hg. N is Avogadro's number; Z and A are the atomic number and
atomic weight.
The dose rate in the cavity may be expressed in "acres" per unit
time, D , where the acre (air cavity roentgen equivalent) is defined as
1 esu/cm3 at 0° C. and 760 mm Hg. Then11
, e 4.80 x 10""1Da = - D = D . (15)a W a 34.1 a
Substituting all the numerical values we get
Da =°'66° V>To (l6)
The value of W for air, 3^1 electron volts per ion pair, wasaveraged from Table I of W. P. Jesse and J. Sadauskis, Phys. Rev. 97,1688 (1955).
21
where D* is in milliacres/sec; Q is in microcuries/ml; bT is the
average beta energy in Mev released per disintegration.
12Gray found a lack of proportionality of ionization in his
chamber to air pressure at low pressure which may now be understood in
13the light of the Spencer-Attix J theory and which explains the work of
IkAttix and DeLaVergne as well. The relation between the ionization in
the cavity and the energy absorbed in the walls depends on two things,
first, the constant value w, and second, B which is the energy dissipatedw
in the cavity walls relative to that dissipated in the cavity gas. The
Spencer-Attix theory deals primarily with the second factor. The Bragg-
Gray theory is based on a simple schematization. Electrons are thought
of as slowing down continuously by a sort of "friction" process as they
travel through the medium, that is, the actual slowing down by a large
number of collisions is approximated by a continuous energy loss. Energy
is thought of as being dissipated only along the track at a rate given by
the local stopping power, Therefore, secondary electrons generated along
the track of the primaries by knock-on collisions are implicitly assumed
to dissipate their energy at the spot where they are generated.
The Spencer-Attix formalism is a bit more complex. They consider
12L. H. Gray, op. cit. Ref. 10cs
3 L. V. Spencer and F. H. Attix, "A Theory of Cavity Ionization,"Radiation Research 3_, 239 (1955).
F. H. Attix and L. DeLaVergne, "Cavity Ionization as a Function ofWall Atomic Number," (to be published).

22
all collisions which result in an energy transfer of less than some
arbitrary value of energy A as dissipating their energy on the spot.
The A can be thought of as roughly the kinetic energy required by an
electron to cross the cavity. They consider all collisions with net
energy transfer greater than A as not dissipating any energy at all;
that is, the resultant secondary electron is considered as a part of
the incident spectrum. The differences between the Bragg-Gray and
Spencer-Attix results are apparent only where the atomic numbers of
cavity gas and walls differ considerably. In the case of the air and
water used in this work, no differences would be expected.
23
3. Method of Calculating Dose Rate in a Cavity from Observed Ionization
An electrode was inserted in the cavity in the radioactive solution
and sufficient voltage applied between the electrode and the wall of the
cavity, which was conducting, to collect all the ions formed. This ion
current gave another measurement of the dose rate in the cavity to
compare with that calculated by method (2) above. The dose rate T>± in
milliacres per second would be
Q I t 760 «D. = 3 x 10y x 10-3 (17)1 V 273 P
3where I is the current in amperes; V is the volume in cor from which ions
are collected; t is the absolute temperature; and P is the corrected
barometric pressure in mm Hg.
2k
III. APPARATUS
1. The Beta Calibration Cell
The basic piece of apparatus was the beta calibration cell which
holds the radioactive solutions. The cell (see Fig. 8) was so designed
that the distance from the center sensitive volume to any wall is greater
than the range of the maximum energy beta ray from any of the isotiopes
used. This cell was fitted with a vacuum tight top so that a partial
vacuum could be obtained to keep the very thin walled central volume
a constant cylindrical shape. This vacuum was necessary because the
volume must be accurately defined to allow one to calculate the dose rate
in roentgens per second from the number of ion pairs per cubic centimeter
of volume. The central volume was defined by a one milligram per square
centimeter thick wall made of Mylar plastic coated on one side with
aluminum, and on the other side with about 75 micrograms per square
centimeter of gold. This plastic was obtained coated with aluminum on
both sides. The aluminum was digested off one side by floating the
plastic on the surface of a bath of saturated NaOH solution. The sheet
was then applied to the inner surface of a cylindrical metal backing
plate and a uniform layer of 75 micrograms per square centimeter of gold
was evaporated onto the plastic in a vacuum chamber. The Mylar sheet
was then fitted to the cell, with the gold side next to the solution,
and fastened to the stainless steel defining sleeves with Plyobond
30" cement and baked for 30 minutes at 110° C. to assure leak tight
adhesion. After a test with water to check for pin holes or leaks, the
cell was attached to a storage bottle containing the radioactive solution.

A. Solution ReservoirB. Complete CellC. Cell Showing Center Mylar Chamber
Photo-17171
UNCLASSIFIED
D. Cover and Gasket
E. Volume Defining PlugF. Center Electrode of Ion Chamber and Electrometer
FIG. 8. BETA CALIBRATION CELL AND MYLAR IONIZATION CONVERSIONto
26
Both the fluid inlet at the bottom and the air escape at the top were
attached to the isotope storage bottle which was similarly equipped with
top and bottom arms so that the whole system could be sealed from the
air, thus preventing evaporation. The necessary partial vacuum was
produced by sealing the top hose and lowering the storage bottle below
the level of the cell. For timing the exposures in the cell, a Standard
Electric Time Company timer, type S-60, was used.
To check the dose rate by the method discussed in Section II-3
an electrode from a Victoreen pocket ion chamber was placed in the center
of the cavity to make it an ion chamber (Fig. 8) and the ends of the
cavity were closed with aluminum plugs to define the volume. The ion
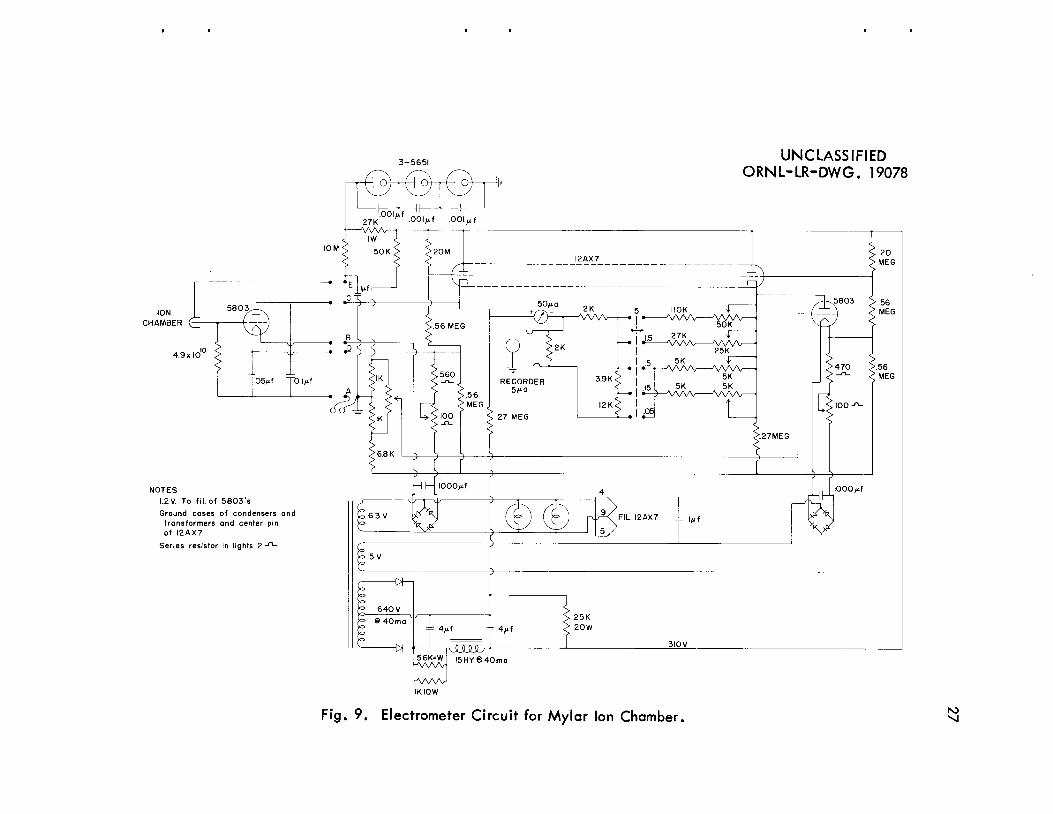
current was measured by an electrometer (Fig. 9) used as a null instrument
by bucking the voltage generated across a high resistor with a potentiometer.
This ion chamber had an excellent plateau (Fig. 10).
ION
CHAMBER £j-
4.9 x 10
05/if "0.1/J.f
NOTES:
1.2V. To fil. of 5803's
Ground cases of condensers and
transformers and center pinof I2AX7
Series resistor in lights 2-n-
3-5651
Of-rH Of-r^CH
Ht27K°OI'if -001/if .OOl^f
Hh
Fig. 9. Electrometer Circuit for Mylar Ion Chamber.
UNCLASSIFIEDORNL-LR-DWG. 19078
•.27MEG
. 20
•MEG
5803 S 56<" MEG
>470 >56"- <MEG
,100-
u lOOO^f
V

50
CO
i 40<
orro
zUlcr
30
20
<
E 10o
UNCLASSIFIED
ORNL-LR-DWG. 19079
f
1
50 100 kXjO 300 400 500 600 700
CHAMBER COLLECTING VOLTAGE (VOLTS)
FIG. 10
PLATEAU OF MYLAR ION CHAMBER IN P32 SOLUTION
800
oo

29
2. The Pocket Ionization Chambers
Seven types of pencils, shown in Fig. 11, were calibrated with
beta, gamma, and x-rays. The general designs of these pencil chambers
are shown in the accompanying figures.
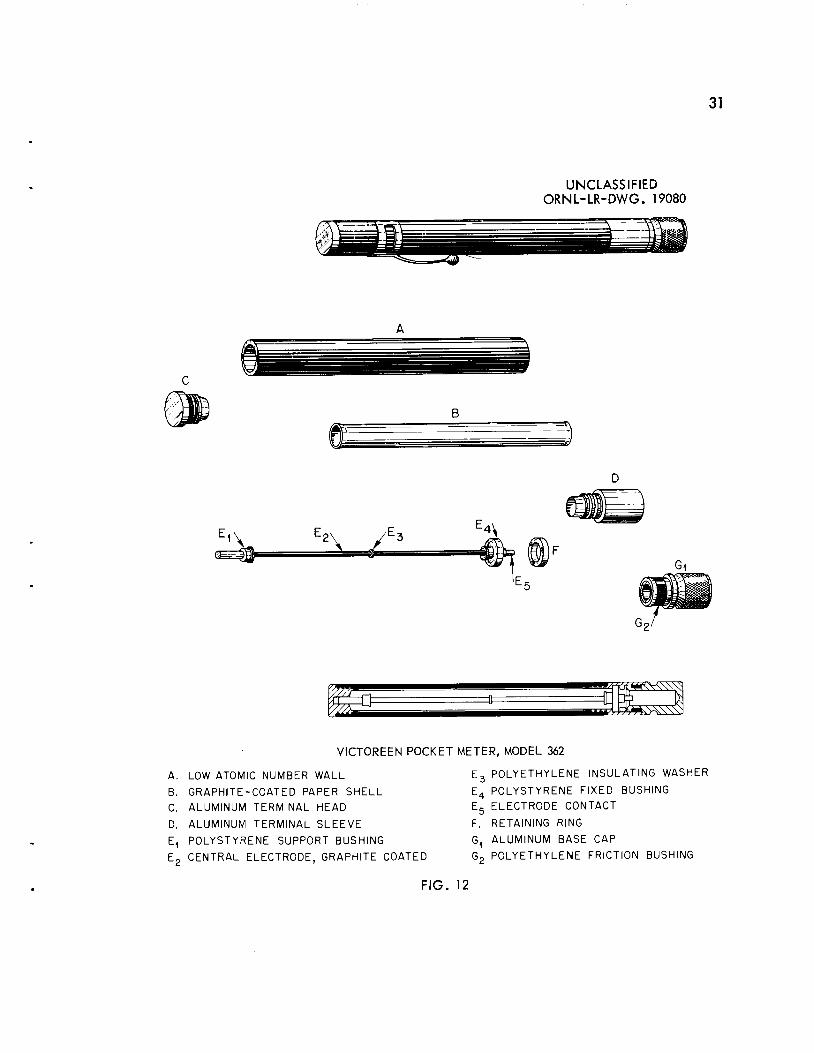
Fig. 11. A. Victoreen pocket chamber model 362 (Fig. 12).A cutaway view and two types of center electrodesused are shown at H, Fig. 11.
o
B. The reference chamber made with a 7 mg/cm conductingpaper wall enclosing the same sensitive volume as (A).
C. A chamber made like (B) and surrounded by a 0.010"wall'drilled aluminum tube (Fig. 1*0.
D. The Victoreen chamber modified by drilling away kC$of surface area and inserting a paper liner like (B)(Fig. 13).
E. A chamber like (c) but with the outer tube ofmagnesium (Fig. l4).
F. A chamber like (B) but surrounded by a stainlesssteel screen.
G. A chamber like (B) but surrounded by an aluminumscreen.
The Victoreen chambers chosen were those which gave the Minometer
fiber less than 2 mr kick when they were inserted or removed. The other
chambers were treated to remove this "zero kick" by polishing the center
electrode contact with emery cloth and treating them with a mild acid
saline solution.
The central paper chamber volumes of all the pencils were made
around the same mandril to insure the maximum possible uniformity of
volume. Black conducting photographic paper of the proper weight was
used and cut to size so that the overlap was as small as possible
(approximately 1 mm). In manufacturing, the perforated walls could be
stamped out of metal, or cast in plastic in a special die so that the

FIG. 11. POCKET IONIZATION CHAMBERS (SEE TEXT, P 29)
Photo-17172
UNCLASSIFIED
COo
A.
B.
C.
D.
EiEo
'V E2\ yE3
K
UNCLASSIFIEDORNL-LR-DWG. 19080
31
VICTOREEN POCKET METER, MODEL 362
LOW ATOMIC NUMBER WALL
GRAPHITE-COATED PAPER SHELL
ALUMINUM TERMINAL HEAD
ALUMINUM TERMINAL SLEEVE
POLYSTYRENE SUPPORT BUSHING
CENTRAL ELECTRODE, GRAPHITE COATED
E3 POLYETHYLENE INSULATING WASHERE4 POLYSTYRENE FIXED BUSHINGE5 ELECTRODE CONTACTF. RETAINING RING
G, ALUMINUM BASE CAPG, POLYETHYLENE FRICTION BUSHING
FIG. 12

- Center Drill Appr .030 Deep
Q.«> <&
55 mmm^m^m^^^§ in©kSto^
3ffA &AV Do5tMEJEI<>
Fig. 13. Drilled Plastic Wall Pocket Chamber.
UNCLASSIFIED
DWG. D-10499
CO

AsSLMFbLYScale 4V1"
:oe?©?e®50e?5^©®©°©e©ee®©®©®ef5tr->©0©©©©©©©©©©© © (? * I ^'
'*==*» <f=5 t==q <?=?• ^g^ j==^ < , o_g>„c>_,c>:
S«+ A
«uat spacas S> ii - 5—iohol<s a^ually spaced Qfe') qntach dia. fo+al no tpolgs
i<T5ScW:^W5^c^
UNCLASSIFIEDHP-17-D-199
I4«aual spaces §> i - 5 -lo hole* squally apacid ("34.0 on <zacH dis. IotsI no holes \• 1 1 1 I 1 1 1 I 1 1 1— 1 —t -H *H V_
*9y
Ma VI - 24 * + Alurv^
^cal« 4"-. i"
Lug PL.ua JTLM 14sf /
iJo, nt<fcJ - or\<zScal« 4*-t'
Uo. f-dd'd - on<•Seal* 4"-el"
Fig. 14. Aluminum or Magnesium Wall Pocket Chamber. COCO

3^
holes would he uniform from pencil to pencil. The central volume wall
might either be installed later, or molded into the plastic.
All pencils were read on a standard Victoreen Minometer, Serial
SN287-17^2, which was left operating continuously from a constant voltage
transformer. This procedure served to minimize any fluctuations due to
temperature changes, warm up, or line voltage changes. The milliroentgen
scale on the Minometer was calibrated with an electrostatic voltmeter
(see Pig. 15), and it was found that the zero reading was 135 volts
rather than the usual 150 volts. After some thought the conclusion was
reached that the actual voltage was of little importance so long as
it was sufficient to produce voltage saturation of the chamber (collect
all the ions), the argument being as follows: After a pencil has been
charged and then irradiated, let the charge and voltage on the pencil be
q and v, respectively, and let Q and V be the charge and voltage of the
Minometer before insertion of the pencil. Then after the two have been
joined again let q1 and v1 be the charge and voltage on the pencil and
Q* and V* be the charge and voltage on the Minometer. We know that after
they are joined,
v' = V . (18)
At all times the charges are equal,
Q + q = Q« + q' . (19)

UNCLASSIFIED
ORNL-LR-DWG. 19081
200
1180
160
cr
2 140z
to 120
Q
<UJ 100(T
crUJ 80h-Ul
o 60
40
20
0
^v
95 100 KD5 1 0 II5 120 125 130 135 14
CHAMBER VOLTAGE IN MINOMETER
FIG.15VOLTAGE CALIBRATION AND SCALE LINEARITY IN MINOMETER 287-1742
COOl

36
The loss of voltage on the pencil due to irradiation then is
Av = V - v = Aq/c (20)
where c is the capacitance of the pencil. Then from Eq. (19) and Q = CV,
we get
VC + vc = VC + v»c (21)
which from Eq. (l8) equals
VC + vc = V'(C + c) (22)
where C is the capacitance of the Minometer. The change read on the
meter is
AV = V - V (23)
Then by adding and subtracting Vc to the left of Eq. (2l) or Eq. (22) we
get
V(C + c) + c(v - V) = V'(C + c) (2k)
which is simplified using Eq. (23) to give
AV = -c(v - V)/(C + c) =Avc/(C + c) . (25)
37
This shows that the voltage change read on the Minometer is directly
proportional to the voltage loss in the pencil. Now a given amount of
radiation will discharge Aq coulombs from the pencil,
Aq = cAv . (26)
Now, since we are at saturation 5Aq is a function of the irradiation
only, c is a constant so Av is independent of V. Therefore, from Eq. (25)
AV is independent of Vj that is, it makes no difference what the initial
voltage of the Minometer and chamber were.
15The pencils are sufficiently saturated at any voltage above about
50 volts to be within about 90$ accuracy at dose rates of up to 8000r/hr. See, Edwin D. Gupton, "Recombination Losses in Pocket IonizationChambers," a thesis, Vanderbilt University, Nashville, Tennessee (1955).

38
3. Apparatus'-for Measuring Gamma- and X-Ray Response of Pencils
The irradiation of the pencils with low energy gamma rays was done
by a standard 250 kilovolt Westinghouse Quadrocondex x-ray machine. The
beam was heavily filtered, the filtration being approximately that
16suggested by Ehrlich and Fitch. The table of filters and effective
x-ray energies is given in Table I. The x-ray responses of the beta
pencils were obtained under conditions where the gamma rays were in
equilibrium with their secondary electrons by having the source at some
distance from them. A thick plastic plate behind the pencils produced
backscattered radiation, thus simulating actual wearing conditions.
The gamma response point at 700 kev was obtained by use of the
standard radium gamma calibration rack at the Health Physics Calibration
Building at Oak Ridge National Laboratory. For the radium exposures
the source-dosimeter distance was fixed at 15 cm, so that the desired
equilibrium was not quite reached.
The dosimeter used in obtaining the dose rates from the x-ray
machine was a Standard Free Air Chamber of a type very similar in con
struction to the chamber at the National Bureau of Standards '
16M. Ehrlich and S. H. Fitch, "Photographic X- and Gamma-Ray Dosimetry,"
Nucleonics 9, No. 3, 5 (1951).
IT(a) Research Paper No. 56 (1928), Dept. of Commerce, Bureau of
Standards, Washington, D. C; (b) Lauriston S, Taylor and George Singer,"An Improved Form of Standard Ion Chamber," read before the RadiologicalSociety of North America, Toronto, December, 1929; (c) Research Paper No.865, p. 16, Vol. 16, J. Res. National Bureau of Standards, Washington,D. C. (Feb. 1936).

Table I
Standard Filter Combinations and Kilovoltages
AppliedKilovolts
Filter Components Effective
Kilovolts
Lead
mm
Tin
mm
Copper Aluminummm mm
30 - - - O.ij-9 21.5
50 - - 0.26 0.^9 3^.5
76 - - 0.938 0.80 46.5
100 O.W - - 1.03 71
150 - 1.19 3.12 1.03 116
200 O.63 2.55 1.07 1.03 165
250 2.081 1.18 1.07 1.03 191
39
ko
(see Fig. 16). An accurately machined lead diaphragm, S, fits into the
lead block and defines the cross sectional area of the cone of radiation
from the source, C. The length of the volume of air, V, is fixed by
the length of the collecting plate, K. The current measured per unit
volume then gives the roentgens per second to the center of the volume.
Using the inverse square law, it is easily seen that this reading in
roentgens is the same as that which would be obtained in a cylinder of
diameter equal to that of the shield opening S, centered at the point S.
To assure a uniform parallel electric field between the high voltage
plate, H, and the collecting plate, K, use is made of guard plates, L,
and a potential dividing system of wires, w, spaced around the collecting
volume and connected to a resistance voltage divider. The source cone,
C, was confined and collimated by a thick lead shielding (not shown) to
minimize scattered radiation in the room, and the collecting volume was
similarly enclosed in a heavy lead cell to eliminate scattered radiation.
The beam was conducted out the end of the chamber for a distance of about
one yard and trapped in a deep lead well to minimize backseattering, A
sheet of very thin conducting plastic, P, was located at the exit of the
shielding portion of the chamber to prevent air currents or drafts from
carrying ions back into the sensitive volume. The arrows and wavy lines
lA(see Fig. l6) show typical paths of the secondary electrons. Thus
-. o
For energy and intensity distributions of both Compton and photo-electrons, see Figs. 6-10 and 6-11 in HEALTH CONTROL AND NUCLEAR RESEARCHby K. Z. Morgan (to be published).

TO ELECTROMETER
UNCLASSIFIED
ORNL-LR-DWG 15723
FIGURE-16
STANDARD FREE AIR CHAMBER DIAGRAM
41
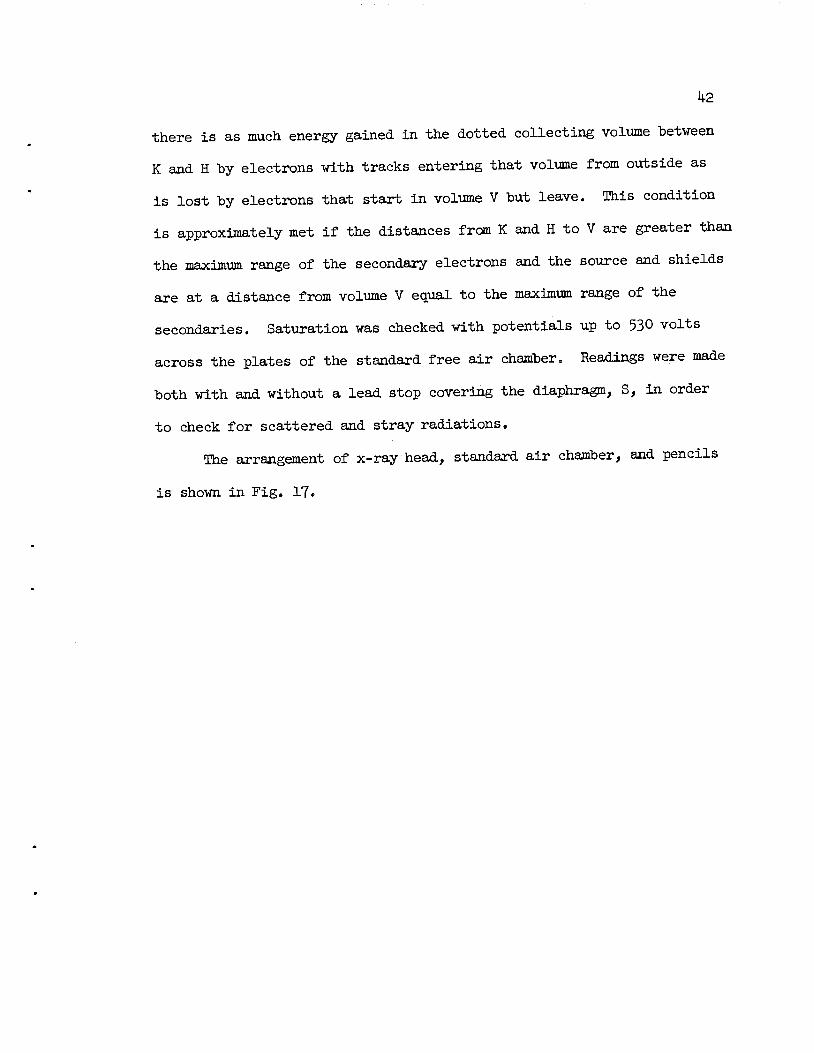
k2
there is as much energy gained in the dotted collecting volume between
K and H by electrons with tracks entering that volume from outside as
is lost by electrons that start in volume V but leave. This condition
is approximately met if the distances from K and H to V are greater than
the maximum range of the secondary electrons and the source and shields
are at a distance from volume V equal to the maximum range of the
secondaries. Saturation was checked with potentials up to 530 volts
across the plates of the standard free air chamber. Readings were made
both with and without a lead stop covering the diaphragm, S, in order
to check for scattered and stray radiations.
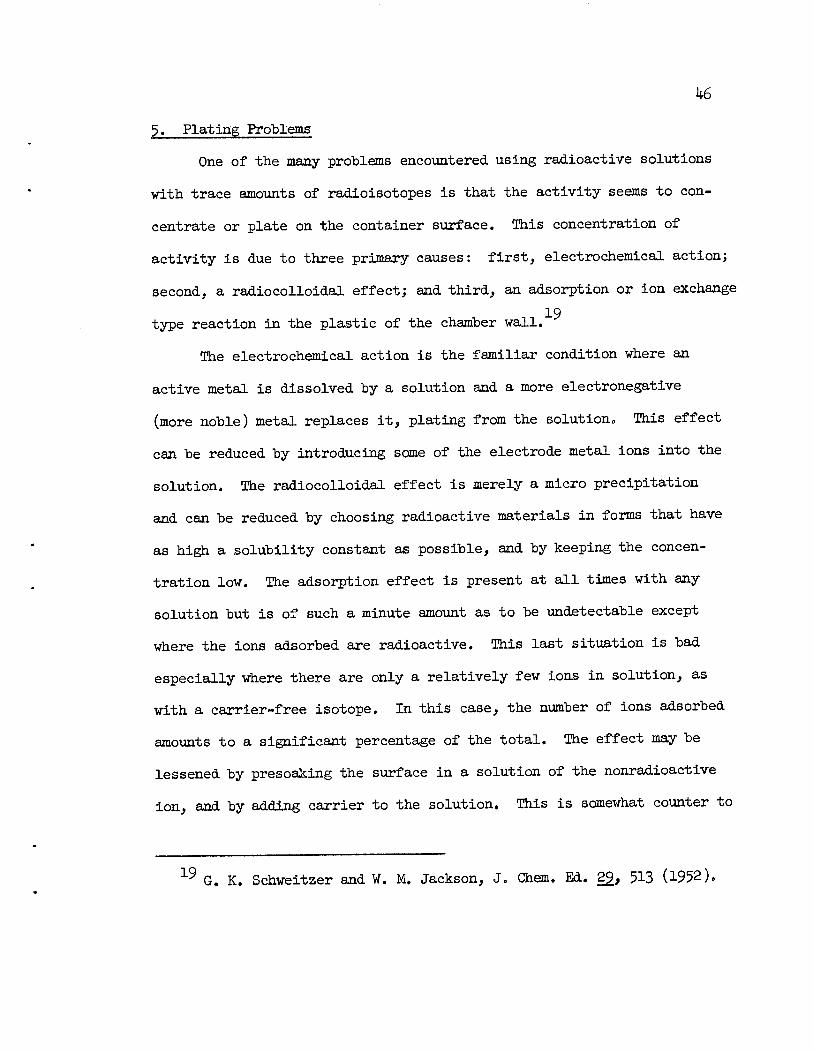
The arrangement of x-ray head, standard air chamber, and pencils
is shown in Fig. 17.

43
UNCLASSIFIED
PHOTO 17170
FIG. 17- X-RAY EXPOSURE ARRANGEMENT

kk
k. Isotopes Used
A series of isotopes were chosen to get as wide a range of beta
energies as possible for calibration of the pencils. Table II gives
the isotopes used, their maximum energies, average energies, and the
average energy of their spectra in water solution.
The isotopes used in this experiment were chosen on the following
basis. The first consideration was given to obtaining pure beta emitters
whose maximum energies covered the spectrum as uniformly as possible.
Careful thought was also given to trace contaminants (alpha or gamma
emitters), ease of handling, and solubility of the required salt in a
water medium. The half lives were chosen long enough wherever possible
to permit an adequate range of working time and yet short enough so that
a spill would not cause a permanent contamination. The decay schemes
were noted so that there would be no interference from the daughters.
An attempt was made to keep the amount of solid matter in the solution
down to a very low level to increase the accuracy of the assay since the
half thickness for the very lowest energy betas is in the range of a few
micrograms per square centimeter, and an appreciable amount of solids
renders the counting very difficult and inaccurate, if not impossible.

Table II
Average Energies of Isotopes
k5
Isotope Maximum
EnergyBeta Mev
AverageEnergyBeta Kev
TN
Average Energy* $ Doseof Electron Due to
Spectrum in PlatedWater Solution Activity
Ty
Average of Electrons in CavityIncluding Plated
Activity
Y902.19 900 + % 694 kev 0 69k kev
p321.701 690 + 2$ 506 kev 13.1 530 kev
a HIAg 1.C4 370 + 10$ 317 kev 0 317 kev
Tl 0.77 243 ± 3i> 237 kev 7.5 237 kev
¥l«5oM 13^ + 10$ 130 kev 15 131 kev
Ca^ 0.25 80 + 20$ 79 kev 0** 79 kev
S35 O.167 55 ± 5$ 52 kev 80 5k kev
#
Calculated from Spencer-Fano-Attix theory (Ref. 5).
Calcium plated on the glass storage bottle but apparently not onthe Mylar film used.
k6
5. Plating Problems
One of the many problems encountered using radioactive solutions
with trace amounts of radioisotopes is that the activity seems to con
centrate or plate on the container surface. This concentration of
activity is due to three primary causes: first, electrochemical action;
second, a radiocolloidal effect; and third, an adsorption or ion exchange
19type reaction in the plastic of the chamber wall.
The electrochemical action is the familiar condition where an
active metal is dissolved by a solution and a more electronegative
(more noble) metal replaces it, plating from the solution. This effect
can be reduced by introducing some of the electrode metal ions into the
solution. The radiocolloidal effect is merely a micro precipitation
and can be reduced by choosing radioactive materials in forms that have
as high a solubility constant as possible, and by keeping the concen
tration low. The adsorption effect is present at all times with any
solution but is of such a minute amount as to be undetectable except
where the ions adsorbed are radioactive. This last situation is bad
especially where there are only a relatively few ions in solution, as
with a carrier-free isotope. In this case, the number of ions adsorbed
amounts to a significant percentage of the total. The effect may be
lessened by presoaking the surface in a solution of the nonradioactive
ion, and by adding carrier to the solution. This is somewhat counter to
19 G. K. Schweitzer and W. M. Jackson, J. Chem. Ed. 29, 513 (1952).
kl
the requirement of low concentrations to keep the radiocolloidal effect
minimized, but the third effect is orders of magnitude greater than the
second in most cases, so the use of carrier is advised.
In this experiment several methods were used to try to overcome
the plating problem. The first and most obvious involved controlling the
pH of the solution to insure redissolution and to prevent any formation
of a precipitate or colloidal suspension. An early, unsuccessful method
of correcting for plating involved a radio-assay before the use of the
isotope and again after the measurements had been made. After correction
for decay the difference between the assays should have indicated any
marked loss of activity of the medium, but in practice it only served
to underscore the difficulty of obtaining an accurate assay on the low
energy beta emitters. The method was rejected since the loss in activity
was less than the probable error of the count.
To determine the amount of plating the radiation from the solution
was measured by converting the chamber into an ionization chamber as
mentioned above. After taking the Mylar ionization chamber readings the
cell was drained, and the outer walls rinsed to remove any remaining
radioactive solution. Care was taken not to rinse the Mylar. Then the
cell was refilled with a buffer solution composed of the nonradioactive
element in the same chemical form, concentration, and pH as in the radio
active solution. The readings taken at this time gave a reasonable idea
of what percentage of the radiation in the cell was due to the degenerate
spectrum of the solution and what percentage was due to the thin source
kd
spectrum of radiation from the plated material. If the spectrum in an
infinite radioactive solution is desired, free of the thin source spectrum,
it is desirable to presoak the cell for several days in a buffer solution
containing a concentration of nonradioactive element in excess of that to
be used in the radioactive solution, and acidified to two or three normal
with the acid of the salt used. This would tend to infuse the Mylar with
the element and to minimize later plating of the radioactive isotope.
The wall of the central volume should be made conducting with gold on both
sides rather than with aluminum, and the final solution should have a large
percentage of carrier added to the isotope immediately after removal of
the sample to be radio-assayed. With proper choice of pH these steps
should reduce the plating to a negligible amount. The next to the last
column in Table II gives the percent of the dose rate in the cell which
is due to the plating in each case. These figures are for solutions of
admittedly differing concentrations and pH values.
In a permanent setup where the several solutions would be used,
each in its individual cell, plating might be an advantage rather than a
disadvantage since its effect would be to superimpose a percentage of the
thin source spectrum on the normal flux spectrum in the solution which
we calculated from the Spencer-Fano-Attix theory. This would effectively
flatten the flux curve of the radiation passing through the chamber.
The radio-assays of the isotopes were performed by a method of
We are indebted to H. A. Parker and W. S. Lyons for these radio-assays.
^9
"absolute beta counting." In this technique the counting is done with
a proportional counter, with the isotope mounted on a low backscatter
polyethylene mount. The counting data is taken as a function of the
thickness of aluminum absorber placed before the tube. These data are
then extrapolated back through the air and window thickness to zero
absorber and multiplied by the appropriate "geometry" factor to get the
disintegration rate. For calcium and sulfur with their extremely low
energy betas, the isotopes were counted directly on the kit counter to
minimize the unavoidably large error at these energies. For the
estimated accuracy of the assays, see Table III.
Ideally, the experiment would be performed with one type of pencil
at a time and with perhaps nine or more calibration cells, so that the
complete response curve of any type of proposed beta dosimeter could be
obtained in a relatively short time. Practical considerations, however,
limited us to two cells. The first step after filling the cell and
noting the time of immersion of the central chamber was to obtain a series
of readings using the chamber as an ionization chamber. These readings
were then plotted against time. If plating occurred the data could be
extrapolated back to zero time to give an accurate basis for comparison
with the theoretical value of the dose rate in the cell as it was calcu
lated from the assay. The dose rates for the various pencils were then
obtained in sequence by inserting the pencil into the cavity in the
center of the radioactive medium for an accurately measured length of
time. If necessary, correction was then made for the decay rate of the

Table III
Assay Information and Error
Isotope Estimated Limit Precision (95$)of Error $ Confidence Level
y90± 10 + 3
p32± 3 + 2
A HIAg + 20 + 3
m-,2C4+ 20 + 3
wl85 + 20 + 3
Ca45 £ 20 ± 5
S35 + 20 + 5
50
51
isotope, and the data for all pencils of the same type averaged
together. The exposure times used were chosen so as to obtain readings
approximately 3/k of full scale. The results were then corrected for
leakage drift and cosmic ray or background radiation where necessary.
The cell was then used again as an ionization chamber to obtain a final
point on the curve to check for plating. It was then emptied and
rinsed out, great care being exercised not to rinse the central chamber,
refilled with a buffer solution of the same concentration of nonradio
active isotope and another reading taken. This gave the exact percentage
of the dose rate which was due to isotopes plated on the chamber. The
chamber was then emptied, decontaminated, the surface of the stainless
cell passivated with a solution of MO , and a new Mylar wall for the
central chamber installed and tested. Each of the isotopes was used in
this fashion.
The next step was to check the response of the pencils for gamma
radiation to determine how closely their response matched the response
of the standard pocket chamber. The procedure was to put a tissue
equivalent phantom around the entrance diaphragm, S, of the standard
free air chamber and use it as a primary standard (see Fig. 17) while
irradiating the pencils with x-rays. After installing the proper
filtration for each energy, the x-ray beam was directed at the standard
free air chamber until the observed reading had time to stabilize. The
scattered and background radiation was then determined with the opening
of the chamber plugged and the extent of the area of the x-ray field on
52
the phantom checked with a fluorescent screen and marked. Next the
charged pencils were arranged on the phantom in such a manner as to
minimize scattered radiation from one type of pencil to another.
Sufficient irradiation was then given to discharge the pencils to three
quarters of a full scale reading, and simultaneously the dose rate was
rechecked with the standard free air chamber. This procedure was
repeated for the remainder of the pencils, irradiating at the same time
the secondary standard, with each set of pencils. The pencils were then
read on the Minometer to the usual + 10$ accuracy and carefully reset to
zero. The secondary standard used in this experiment was a Victoreen
Condensor R-Meter, Model 70, Serial No. 2913, with a 0.25 r chamber.
This chamber was used as a primary standard for the gamma readings above
200 kev where the standard free air chamber is too small to collect all
the secondary electrons. During exposure to the radium source the
pencils were again backed with a phantom made of 3/k inch Lucite sheets
and were exposed long enough to give approximately a 3/k full scale
reading. These x- and gamma-ray exposures were all repeated, changing
the pencil center wires from the original type which was fully coated
with graphite to the newer half-coated center wires. All of the resulting
response curves for the beta pencils were surprisingly close to the curve
of the standard Victoreen gamma sensitive pocket pencil.

53
IV. EXPERIMENTAL RESULTS
1. Beta-Ray Calibration of Pocket Chambers
The results of the calibration of the various types of pocket
chambers are summarized in Figs. 18, 19; and 20. At the top of each
graph are given the isotopes used and the average energies, T , of the
electron fluxes in each case.
In Fig. 18 the observed dose rates are compared with those
calculated on an absolute basis for each isotope from its measured
concentration. Several points of basic physical interest are evident.
The curve for the ionization in the Mylar wall chamber, that is, in the
cavity itself, shows that for high energy electrons the dose rate is
given correctly by the Bragg-Gray principle. The deviations found by
Gray and Spencer-Attix are too small to be observed within the accuracy
of these measurements, and in any case would not arise here where the
cavity gas and its walls all have low atomic numbers.
In addition this curve shows that even a 1 mg/cm absorber (the
Mylar) produces a reduction in dose rate to 9kfo of that calculated at
700 kev average electron energy and to about 63$ at 79 kev. The
additional 7 mg/cm2 in the wall of the paper chamber cuts this dose rate
down to 14.7$ at 79 kev and 9»5$ at 52 kev average electron energy. The
loss is surprisingly large since the range of 52 kev electrons is about
6 to 8mg/cm2, and one would expect that electrons in the medium having
an energy higher than this average would have longer ranges.
Our observation that, contrary to the arguments just given, most

<CC
UlCO
OO
QUJ
I-<_J
o_l<o
o
100
S35Ca45 W18552 79
UNCLASSIFIED
ORNL-LR-DWG 17341
694 KEV
600 700
AVERAGE ELECTRON ENERGY IN WATER IN KEV
FIG I8-RESP0NSE OF CHAMBERS COMPARED TO THAT CALCULATED

55
of the dose is deposited at very small depths of penetration shows the
great importance of the build up of low energy secondaries and the large
proportion of the total dose they deposit. This secondary flux is
indicated on the curves, Figs. 1 - 7, by the sharp upturn and steep rise
in the flux spectra y(T) below 10 kev. The high dose rate in the first
8 mg/cm2 of absorber then represents the large fraction of the total
dose carried by this sea of low energy electrons.
This flux spectrum has been measured recently and agrees well
with that calculated down to- at least 50 kev. The work has been
20reported and will be described elsewhere.
The curves for the drilled plastic chambers and the aluminum and
magnesium walled chambers, which are also drilled, show that, as was
expected, the low energy electrons can only enter the ionization chamber
through the holes, while the high energy electrons also penetrate the
solid parts of the outer shells and still contribute to the dose in the
chamber. Since the plastic material is weaker mechanically, its wall
must be much thicker (.088") than the metal walls used (.010"). As a
result, electrons can reach the ionization chamber of the drilled
plastic chamber only if they are initially directed toward the pencil
axis and within a small cone about a normal to it. Electrons striking
20 Birkhoff, Cheka, Hubbell, Johnson, and Ritchie, "Measurement ofElectron Flux in a Radioactive Medium," Bull. Am. Phys. Soc, Ser« II,Vol. 1, No. k, p. 184 (1956).

56
the chamber at angles outside this cone will penetrate varying amounts
of plastic and have their energies lowered by varying and unknown degrees
before being recorded. This penumbra effect gives the response a strong
angular dependence, which is undesirable.
Electrons can reach the sensitive volume of the Al or Mg walled
chambers from a much wider cone; hence the higher sensitivity of these
pencils at low energies, even though the total superficial area of the
holes was practically the same for the metal and plastic walled chambers.
There was no significant difference in the response of pencils with
magnesium walls, pure (2S) aluminum walls, or alloy (24ST) aluminum walls
so the data for all three have been averaged.
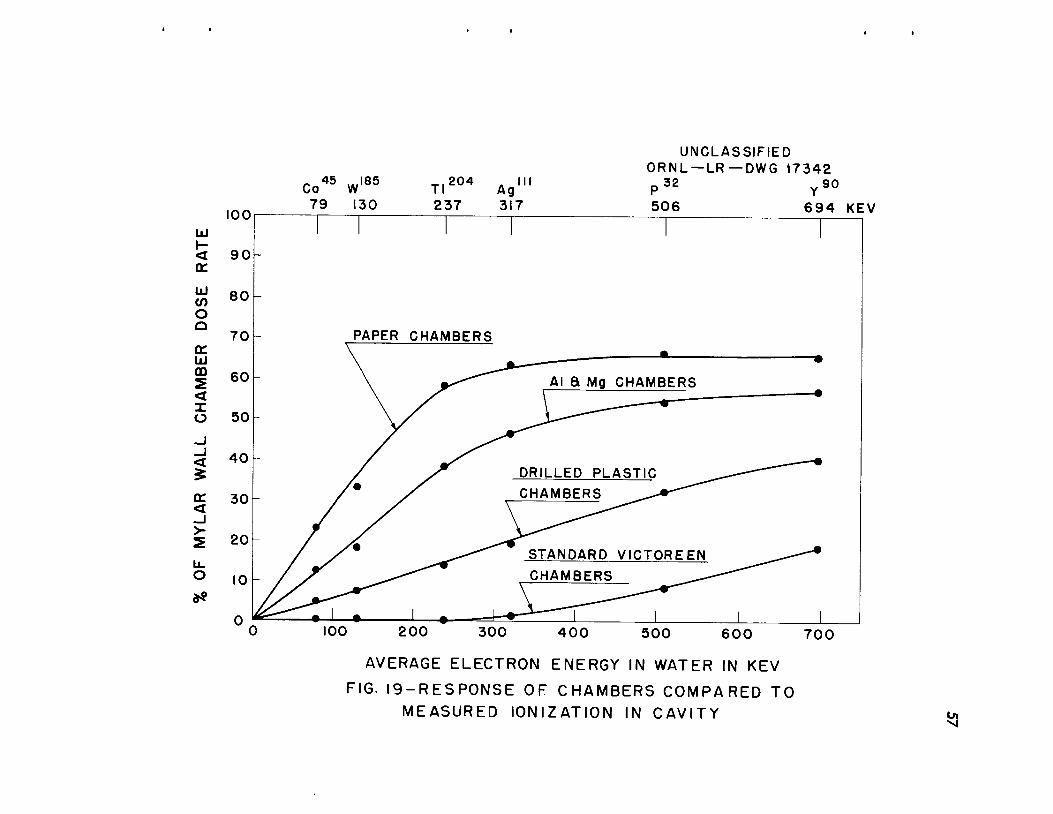
The responses of the various types of pocket dosimeters are compared
with the measured ionization in the cavity in Fig. 19. The dose rate in
the Mylar walled cavity as shown in Fig. 18 does not seem to extrapolate
to zero at zero electron energy, probably because the radioactive solution
infuses into the Mylar to some extent so that some beta rays are emitted
practically at the concave wall of the cavity. This infusion is,
however, not sufficient to raise the Mylar walled chamber dose rate to
that calculated. Since the dose in the cavity thus remains finite for
very low beta energies, while those in the pencils certainly approached
zero, we have drawn the curves for the pencils through the origin.
This Mylar wall represents the thinnest practical wall a dosimeter
could have, and even this wall does not give a dosimeter with 100$ response.
The Mylar walled chamber also permitted a measurement of the effect of
100
< 90or
UJCO
80
Oo
70orUJ00
60
<Io 50
_l_l
< 40
£
or 30<
o
Co45 W18579 130
100
Tl
237
200
204Ag317
300
III
400
UNCLASSIFIED
ORNL —LR—DWG 17342
P32506
500
90Y
694 KEV
600 700
AVERAGE ELECTRON ENERGY IN WATER IN KEV
FIG. 19-RESPONSE OF CHAMBERS COMPARED TOMEASURED IONIZATION IN CAVITY Oi
58
plating of the radioisotope on the walls of the cavity, as discussed
above.
Fig. 18 gives the answer to the question of how much of the beta
ray dose present will be recorded by the various pocket chambers. From
the health physicist's viewpoint, a more important question is how much
of the dose reaching the basal layer of the human epidermis is recorded
by the dosimeter. To answer this question the data on the pencils shown
in Fig. 18 are replotted in Fig. 20. The assumption is made that any
dose recorded in the paper walled chamber will reach the basal layer
of the epidermis. Hence in Fig. 20 the other chambers are compared to
the paper walled chamber.
The Victoreen pocket chamber gives a negligible response to beta rays
from isotopes whose maximum energy is below 1 Mev, as is evident from
the points on Figs. 18 - 20 for Ag whose T = I.06 Mev. The walls of
the Victoreen chamber are too thick for beta dosimetry, and it was never
designed or intended to measure beta rays. The drilled plastic chamber
offers a definite improvement. Its response ranges from 20$ of the dose
seen by the skin up to 60$. This pencil could serve as a reasonable
dosimeter for beta rays if its readings were multiplied by three. The
average curve for the magnesium and aluminum walled pencils shows a
response that ranges from about 55$ of the dose to the basal layer of
the epidermis at 55 kev to 90$ of the dose at 650 kev. This pencil
could be used for pure gamma radiation as is or read for pure beta dose
with a reasonable safety factor if its readings were multiplied by

UJ
<or
UJtooQ
orUJm
<xo
<
CL<t0.
U.O
lOOp
90-
80-
70-
60-
50-
40-
30-
20-
10-
s35Ca45 w.8552 79 130
Tl
237
204Ag317
III
CHAMBERS
100 200 300 400 500 600
AVERAGE ELECTRON ENERGY IN WATER IN KEV
FIG. 20-RESPONSE OF CHAMBERS
COMPARED TO PAPER WALL CHAMBER
UNCLASSIFIED
ORNL-LR-DWG I2563B
P32506
y90
694 KEV
700
Oi>o
60
two. The advantages of the perforated metal walled pencil over the
drilled plastic pencil are the former's lack of angular dependence, its
higher sensitivity, and its smaller attenuation of beta rays striking
the metal walls at angles to the axis.
If the readings of the aluminum wall chamber are taken simul
taneously with those of a standard Victoreen pocket chamber, the beta
dose is easily estimated by subtracting the Victoreen gamma reading
from the aluminum chamber reading and multiplying the remaining number
by a factor of two. This method will give a safety factor to the
determination that could be reduced at the discretion of the health
physicist using the pencils. However, since the maximum permissible
exposure for beta radiation (that is, MPE for dose to skin alone) is
twice that for gamma radiation, the aluminum chamber reading may be
expressed as a per cent of the permissible exposure to mixed beta and
gamma rays.
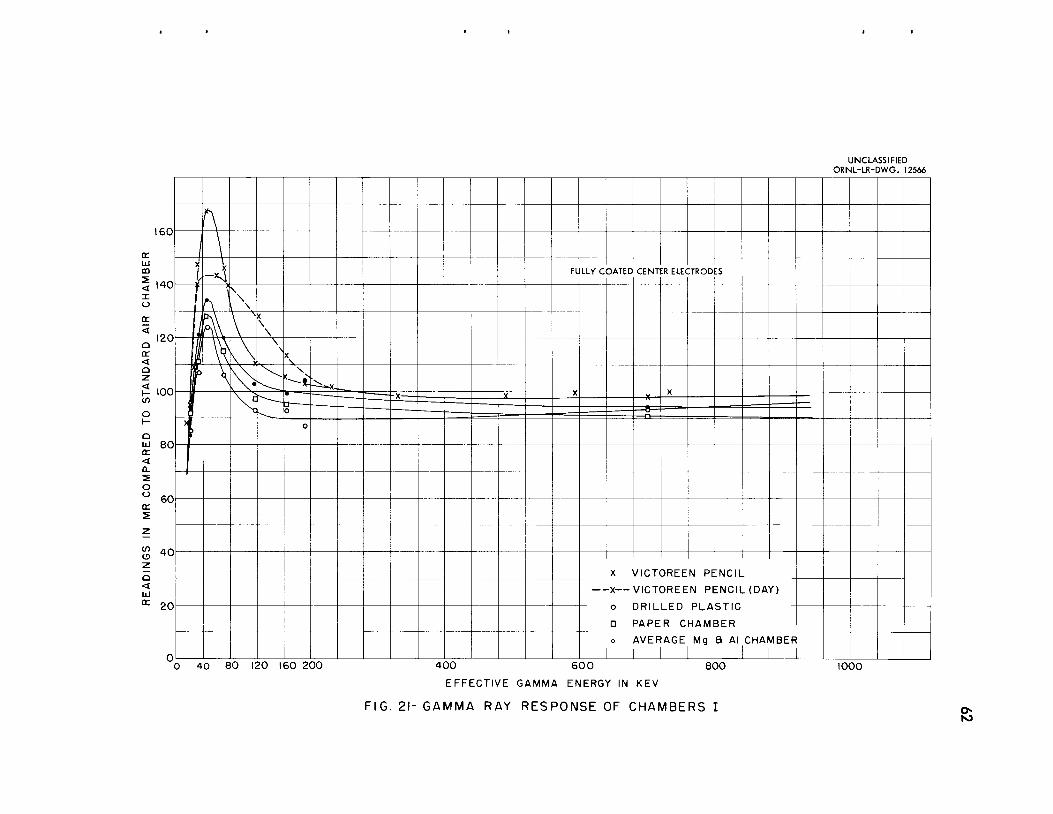
612. Gamma and X-Ray Response of Pocket Chambers
The chambers were irradiated with gamma and x-rays as described
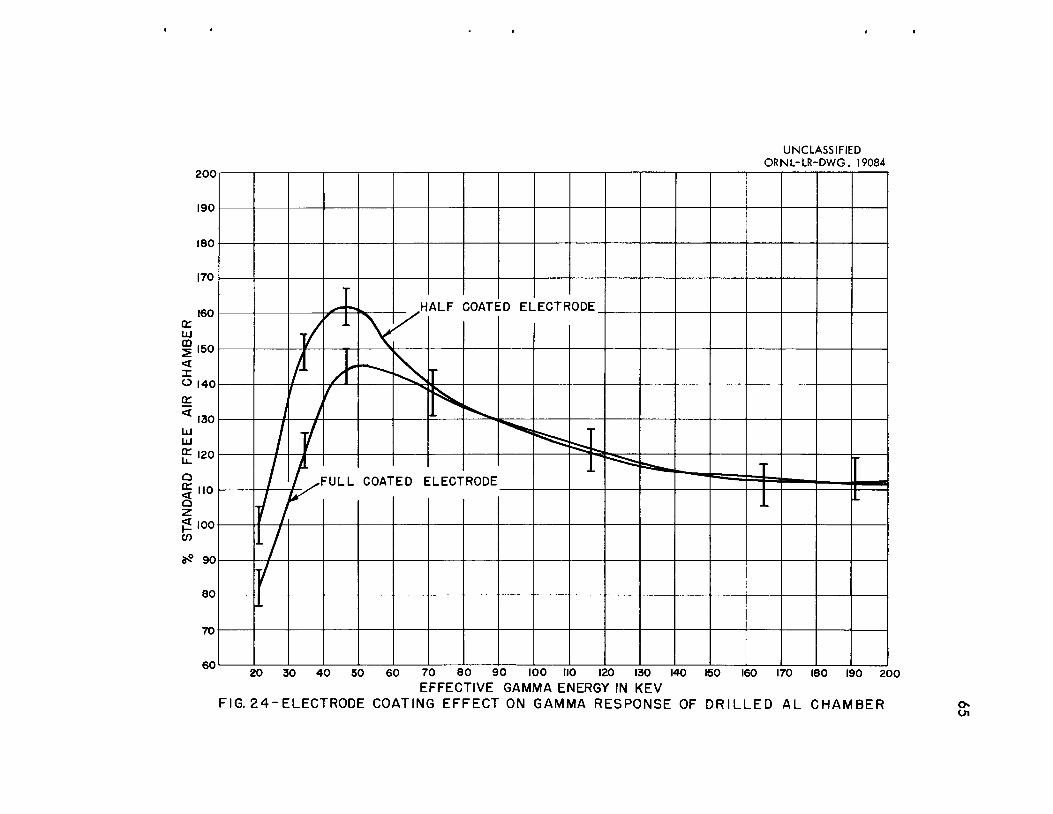
previously, and the results are shown in Figs. 21 - 2k. Our curves show
a narrower peak around k5 kev than Day obtained. His results are shown
in Fig. 21 as a dotted curve.
Except at the peak the chambers agree with each other within the
accuracy of the experiment. Our chambers seem to show a lower response
peak around k5 kev than the standard one, for reasons that are not clear.
There was no significant difference in the response to gamma and
x-rays of the pencils made with magnesium, 2S aluminum, or 2^ST aluminum
alloy, but stainless steel gave large variations and was rejected.
For the radium source the pure paper walled chamber dropped slightly
in efficiency, although it did not drop as much as had been expected.
Contrary to expectations, the chamber with the aluminum outer shell had a
response similar to the Victoreen chamber shell. Apparently, the photo-
electrons which give a peak at k5 kev are absorbed by the chamber wall
so that there is no appreciable effect on the measured dose.
The difference between the half coated center electrode and the
fully coated one is seen by comparing Figs. 21 and 22. It may be seen
directly for the special cases of the Victoreen and the average of the
Al-Mg pencils in Figs. 23 and 2k. The indication is that the older,
fully graphite coated, center wires are superior if one wishes to reduce
a spurious high reading for exposures in gamma and x-ray fields with
energies in the region of 30 to 110 kev. The half coated electrodes also
lacked the insulating lead in the center and are therefore more likely
to discharge when dropped.
UNCLASSIFIED
ORNL-LR-DWG. 12566
160
—
f\\ \
X
I FULLY COATED CENTER ELECTRODES
\
i <
\
1 X\
\•--—
N
1 —^-K.
-x X*
—x—-x—
0
o
—D—
X VICTOREEN PENCIL
-X—VICTOREEN PENCIL (DAY)
D PAPER CHAMBER
o AVERAGE
1
Mg a Al CHAMBER
I
DC
UJCO
2<X
o
a:
<
Q
<Q
z
<h-cn
ol-
Q
IxJ
CE
<Q_
soo
140
120
100
80
60
40
<
20
40 80 120 160 200 400 600
EFFECTIVE GAMMA ENERGY IN KEV
800
FIG. 21- GAMMA RAY RESPONSE OF CHAMBERS I
1000

200
a.UJ
m
z<xo
cr
<
aa:<az
?to
auia:
2zoo
COoz
a<UJ
CE
0 20 40 60 80 100 120 160 200 300 400
EFFECTIVE GAMMA ENERGY IN K.E.V.
FIG.22-GAMMA RAY RESPONSE OF CHAMBERS I
500 600 700
UNCLASSIFIED
ORNL-LR-DWG. 19082
800 900
CO

200
UNCLASSIFIED
DRNL-LR-DWG. 19083
180
CHAMBER ooH ALF (DOATE D ELECTRC)DE
FrULL ECTR0DE/or
<
UJ '20UJ
cc
COATED EL
•T-
acc
••-
<I 100az<P 90to
85 80
70
en
i
-r-
20 30 40 50 60 70 80 90 100 110 120 130 140 150 160 170 180 190 200
EFFECTIVE GAMMA ENERGY IN KEV
FIG. 23-ELECTRODE COATING EFFECT ON GAMMA RESPONSE OF VICTOREEN CHAMBERo^
UNCLASSIFIED
ORNL-LR-DWG. 19084200
190
180
170
160
150
140
130
120
110
100
90
80
70
60
H ALF COATED EL.ECTR ODE
1
// / t"III 1 rnAT en c •f en Done
/ / >"
/A1/t/
CCUJDO
<Xo
cc
<
UJ
UJ
ccu.
Qcc<
CO
20 30 40 50 60 70 80 90 100 110 120 130 140 150 160 170 180 190 200
EFFECTIVE GAMMA ENERGY IN KEV
FIG. 24-ELECTRODE COATING EFFECT ON GAMMA RESPONSE OF DRILLED AL CHAMBER

66
3. Errors and Estimated Accuracy
The thin source spectra calculated in this work and shown in Figs.
901-7 are probably correct within + lOfo at the upper end except for Y .
90The bump in the spectrum of Y around 1.2 Mev seems to have been
exaggerated by the methods used. The thin source spectra at their
185lower ends are much more uncertain, especially that for W . However,
the exact shapes of these curves have very little effect on the average
energies obtained, T„, or in the integral primary spectrum which is used
to calculate the flux.
The flux spectra are affected somewhat more strongly by the approxi
mations used in the Spencer-Attix calculation as discussed under THEORY
and in the APPENDIX. The results are probably accurate to + % at the
higher energies, but may be off by 20$ or perhaps more at low energies
20as evidenced by recent experiments. Again, however, the average electron
energy in the flux, T , will be very little affected by such errors, since
it depends only slightly on the shape of the spectrum in the low energy
region.
The experiment was planned to develop a practical dosimeter and
therefore was not expected to yield results closer than + lOfo. By
correcting the "zero kick" and averaging the results of at least four
pencils, the curves are probably accurate to + 5$> in the cases of Figs.
19 and 20. The estimated limits of error for assaying beta solutions
is generally + 20$ (see Table III, p. 50) so that the ordinates in Fig.
18 are only valid to that limit of absolute error. The internal self

67
consistency in these curves is better than this. The gamma and x-ray
response curves are likewise probably good to + 10$ or better.

68
V. DISCUSSION
The maximum permissible weekly dose as set forth in the National
21Bureau of Standards Handbook No. 59 is 0.300 rem (roentgen equivalent
man) for penetrating radiation (gamma) and 0.600 rem for radiation that
does not reach the blood forming organs (beta and soft x-ray). There
fore, our pocket chamber was designed to measure approximately 50$> of the
beta dose. This means that the pencil gives a response that conforms to
the standards set up for the protection of workers in the field of
radiation, that is, the pencil is calibrated to read penetrating radiation
directly in rem (under normal field conditions) and to read about half
value for the skin dose (betas) for which the maximum permissible exposure
is twice as great as it is for radiation which affects the blood forming
organs. This means that the observed pencil reading might well be
considered as the effective total beta and gamma dose, with a maximum
permissible exposure of 0.300 rem.
The pencil has several definite advantages when compared to other
usual means of personnel dosimetry. The most widely used instrument for
22personnel dosimetry is the film badge. The badge as used at Oak Ridge
is made of plastic with a total of 8l mg/cm of low atomic number material
21Handbook 59> "Permissible Dose from External Sources of Ionizing
Radiation," p. 76, National Bureau of Standards, Department of Commerce,Washington, D. C. (195*0.
22Roy L. Clark, Health Physics Division, Oak Ridge National Laboratory,
February 5, 1953 (unpublished data).
69
in front of the first sensitive layer of the film. This thickness is
equal to the maximum range of a 320 kev electron, or approximately to
210the range of the average energy beta from Bi , a fairly "hard" beta
(Em = 1.17 Mev). At the back of the badge the shielding is even greater,
for the absorber shielding in front of the first layer of sensitive film
is 186 mg/cm thick, or approximately 27 times as thick as the wall of
our pocket ion chamber. This is equivalent to the maximum range of a beta
particle of 560 kev energy. Thus the pencil is far more sensitive to
the low energy betas and has the additional advantage of giving a good
measurement of dose received from soft x-rays, or the gamma rays from
americium or other low energy gamma emitters. The film badge requires
large corrections in this range, since for about 200 kev above the "K"
absorption edge of silver (at 25.516 kev) the film is many times more
sensitive to electromagnetic radiation, though the cadmium and other
filters in the badge reduce these corrections.
The chamber has the disadvantage, compared to film, of being more
fragile and easily damaged. Also pocket chambers do not give permanent
records of legal value as do the filed film badge packs, but on the
other hand neither do they involve periodic film replacement costs.
The advantages of the beta sensitive chamber over the commercial
thick walled pocket chamber are three: first, one can read directly the
total dose in a mixed beta-gamma field (as a percentage of maximum
permissible exposure); second, one can determine the beta dose separately
by subtracting the gamma dose determined simultaneously with the thick

70
walled standard chamber; and third, one can get dose measurements in a
field of very low energy x-rays such as those due to internal conversion
K x-rays from iron, whose energy is about 7 kev. These soft x-rays are
appreciably absorbed in the wall of the standard chamber. Both chambers
share the disadvantage of being accurate to only + 10$ and of leaving
no permanent record. The beta chamber is not quite as rugged as the
standard commercial pocket chamber, but both can stand dropping from k
or 5 feet without damage, and in most cases without discharging the
meter.
A self-reading pocket dosimeter with an optical system has a
definite place in work in high radiation fields where a moment to moment
check on personal dose is needed, but for wide usage it has several
disadvantages. The original cost and upkeep are high, since a pocket
dosimeter costs about 6 or 7 times as much as a pocket ion chamber, is
more fragile, and is no more accurate. Repairs to the dosimeter
necessitate returning it to the factory, with resultant time loss and
expense. The self-reading pocket dosimeter as currently available
commercially has a low sensitivity to most beta rays and low energy x-rays.
One manufacturer has recently marketed several beta sensitive
chambers for a condenser R-meter. Of these new chambers there is one
skin equivalent chamber in the range of 0 to 250 mr. It uses the same
seven milligrams per square centimeter wall thickness as our pencils.
This low range chamber has a volume of 170 cc and thus makes a reasonable
standard chamber, but its volume and weight prevent its use as a

71
personnel dosimeter.
There are no commercial beta reading pocket dosimeters with which
to compare our chambers. However, the soft shell Cutie Pie should have
characteristics similar to the beta chamber.
The calibration system worked out for the beta pencil possesses
several important features. It has the advantage of calibrating the
sensitivity to beta rays against a known spectrum of radiation at a
known dose rate. In other words the self absorption, air absorption,
and weak sources which have constituted the principal problems with beta
calibrations in the past have been eliminated by calibrating against a
known spectrum of electrons in the medium. This calculation allows a
plot to be made of the actual response of the instruments against the
average beta energy in the solution, rather than merely giving a figure
of per cent response compared to some standard for a given isotope. Thus
the seven milligram wall pencil is a basic reference standard for the
health physicist, whose interest is in the effective dose to the human
being. Also the exposure cell described can give a more nearly absolute
standard for comparison with theory, since the dose in the cavity can
either be calculated, or determined by using the cavity as an ionization
chamber.
The main disadvantage of the method of calibration is the contami
nation hazard associated with using a liquid source rather than a solid
one. While the Mylar wall is extremely strong compared to the rubber
o
hydrochloride that was tried at the start of the experiment, a 1 mg/cm
72
wall may be torn if carelessly handled. The chances of permanently
contaminating the laboratory were minimized by the use of isotopes
having relatively short half lives. Dangers of contamination may be
further minimized by the use of radioisotopes which are distributed
through a solid rather than a liquid medium.

73
VI. CONCLUSIONS
The electron flux spectra in dilute water solutions have been cal
culated for seven beta-ray emitting isotopes (Figs. 1-7). The average
energies of these spectra and of the corresponding thin source beta-ray
spectra have been determined and are given in Table II.
A laboratory standard pencil ionization chamber was built with
o
conducting paper walls having the same 7 mg/cm density as the assumed
shielding over the basal layer of the human epidermis. It was therefore
assumed that this chamber read correctly the physiologically important
dose.
Several types of pocket ionization chambers suitable for personnel
monitoring were built and calibrated. The most successful had an outer
perforated wall of 24ST aluminum alloy 0.010" thick surrounding an
inner ionization chamber having the same construction as the laboratory
standard. All types had the same volume, geometry, and used the same
type of center electrode as the Victoreen pocket chamber and hence could
be read on the same Minometer.
A calibration cell was built having a central cavity with walls of
o
1 mg/cm Mylar for calibrating the chambers with dilute water solutions of
radioisotopes which emitted beta rays of various energies.
The dose rates in the cavity were determined theoretically from the
measured activities in the solutions, and experimentally from the measured
ionization currents to an electrode placed in the cavity. The paper
walled chamber read from 10$ of the calculated dose rate for S solution
with an average electron energy in the solution of 52 kev, to 6l$ for

7^
Y solution with average energy 69^ kev. The perforated aluminum walled
chamber read from about 55$ of the dose rate measured by the paper walled
chamber for S35 to 88$ for Y9 . The drilled Al chamber thus made a
suitable personnel dosimeter for beta radiation. For greater mechanical
strength the aluminum wall could be made thicker with some loss of sensi
tivity for intermediate and high energy beta rays. Such an increase in
thickness would result in a more energy independent response if the ratio
of hole area to wall area were maintained and if the walls were not of
such a great thickness that the "penumbra" effect would become important.
The new design pocket chambers and the Victoreen chamber were
checked against a standard free air chamber and it was found that all
the types of pocket chambers had practically the same response to x-rays
from 20 kev to 200 kev and at 700 kev which is the effective energy of
gamma rays from radium.
o
The reduction in the dose rate in the cavity due to its 1 mg/cmp
walls and the large reduction due to the additional 7 mg/cm wall of
the paper chamber gave experimental confirmation to a conclusion drawn
from the calculated electron flux curves. This conclusion was that a
large part of the dose in a thick absorber irradiated with beta rays
is produced by the large number of secondary electrons of very low
energies which arise from the degradation of the primary spectrum.

75
APPENDIX
1. Sample Calculation of Electron Flux in Water Solution
The calculation of the spectrum in the medium is made according
to the Spencer-Fano-Attix theory as outlined in Section II-l. A typical
calculation for tungsten W^ 5 is given in this section.
If the spectrum, y(T), is to be expressed as particles cm sec
energy"1 and is to represent the flux of electrons of energy T traversing
a small spherical probe per unit energy range of the spectrum, then the
source must be uniform in space and constant in time. The source term,
-^ -1S(T), must be expressed in particles cm -)sec . The spectral density ofn "I
electrons in the medium (particles cm'^sec" ) is given by y(T)v, where
v is the velocity corresponding to T. Equation 6 of Section II-l
may be written,
T
y(T) = SZ(T) 1|s(T) +PdT' H(T)2T
where H(T) is defined by
L T T' - Ty(T')|
(27)
2 ,„/.x Q-2H(T) =2*NQrod (Z/A) P~d (28)
where N is Avogadro's number; r the classical electron radius, and Ao o
and Z the atomic weight and number respectively. S(T) is defined by
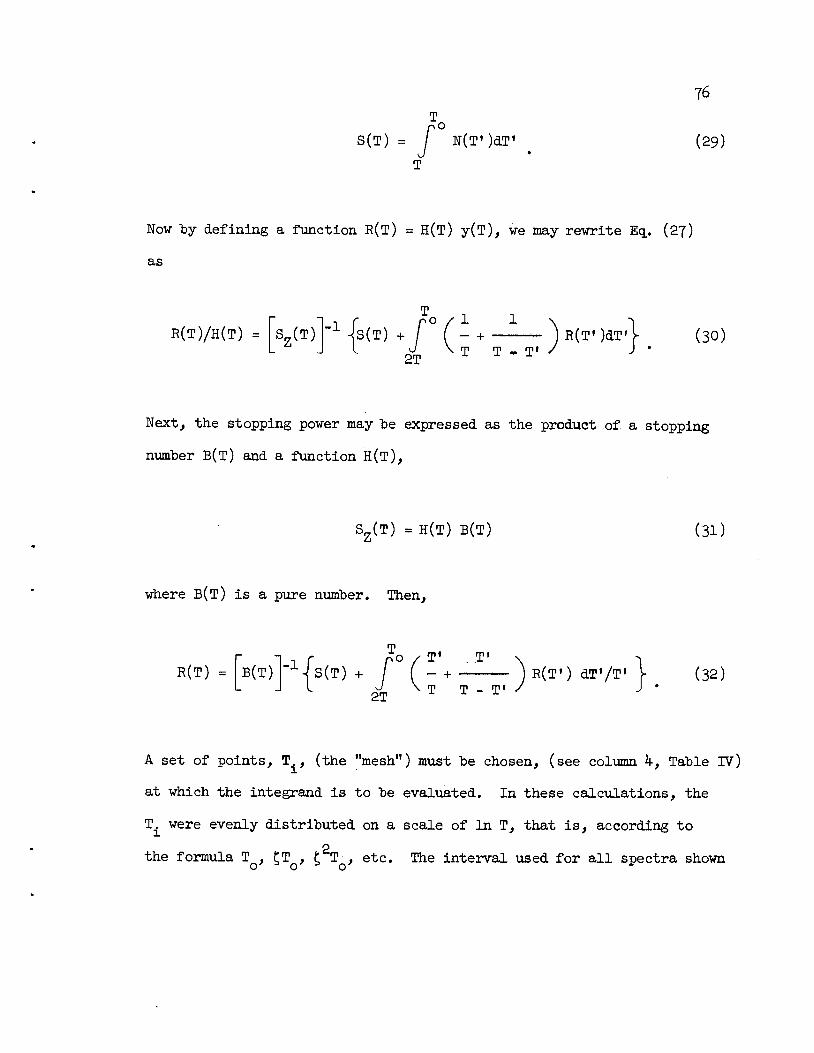
S(T) = J N(T')dT'
76
(29)
Now by defining a function R(t) = H(T) y(T), we may rewrite Eq. (27)
as
R(T)/H(T) SZ(T) 1-JS(T) +f (- + )R(T«)dT»} (30)2T T T " T
Next, the stopping power may be expressed as the product of a stopping
number B(T) and a function H(T),
SZ(T) =H(T) B(T)
where B(T) is a pure number. Then,
R(T) = B(T) S(T)
To / T* T1
2T
— +
T T - T'
(3D
R(T') dT'/T' V (32)
A set of points, T , (the "mesh") must be chosen, (see column k, Table TV)
at which the integrand is to be evaluated. In these calculations, the
T± were evenly distributed on a scale of In T, that is, according to
the formula Tq, ^Tq, £ T , etc. The interval used for all spectra shown

77
had amesh, £, chosen so that £3 =1/2 or £n =(l/2)n'3 (see column 3,
Table IV). A smaller mesh, t/ = l/2, was used for an additional calcu-32
lation for PJ , but proved to be little improvement over the rougher
mesh for the purpose at hand.
It is useful to introduce logarithmic energy intervals at this
point into Eq. (32). Let u =In T /T; then T =T e_ti and T' =T e"*1':O' * o o
it follows that
dLt' =-dT'/T' and (u')T,=2T =(in TQ/T,)T'=2T =^ V2T =^"ln2
and
so
R(u) = B(To,n) •1
(li')t,=t =(lnTo/T')T,=T =lnTo/TQ =0 (33)
u-ln2
S(TQ,n) +/ e"^'"^ +(e'^^-lV W)du'0 J
(3*0
The usual method of solving a Volterra type integral equation such as
Eq. (3k) is to approximate the integral by finite sums. Eq. (3*0 then
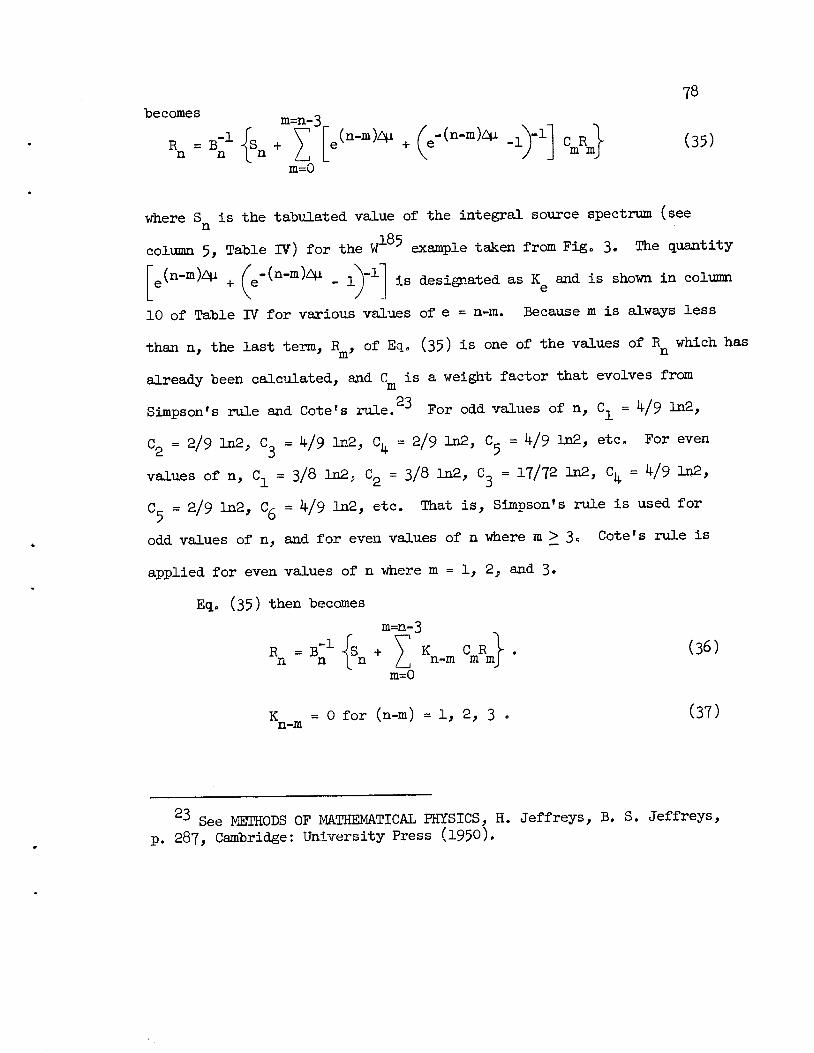
becomes m „ 0m=n-3
R =B"1 js^ +n n [_ n
m=0
78
.(n-nfci A^-(n-m)Ai .^ll CA (35)
where S is the tabulated value of the integral source spectrum (seen
column 5, Table IV) for the W 5example taken from Fig. 3. The quantity(n-mHi .( -(n-m)Au \-levu-«/^ + e ^ ~/<^ _ 1 is designated as K and is shown in column
10 of Table IV for various values of e = n-m. Because m is always less
than n, the last term, R , of Eq. (35) is one of the values of R which has
already been calculated, and C is a weight factor that evolves from
Simpson's rule and Cote's rule. 3 For odd values of n, C^ =k/9 ln2,
C2 =2/9 ln2, C =k/9 ln2, C^ =2/9 1*2, C? =k/9 ln2, etc. For even
values of n, C± =3/8 1*2, C2 =3/8 ln2, C^ =17/72 ln2, C^ =k/9 1*2,C =2/9 ln2, C6 =k/9 ln2, etc. That is, Simpson's rule is used for
odd values of n, and for even values of n where m > 3„ Cote's rule is
applied for even values of n where m = 1, 2, and 3.
Eq. (35) then becomes
<a +
1 n _m=0
m=n-3
R =B-J- ^S + > K CRf. (36)n n I n / , n-m m ml
K = 0 for (n-m) = 1, 2, 3 . (37)n-m
23 See METHODS OF MATHEMATICAL PHYSICS, H. Jeffreys, B. S. Jeffreys,p. 287, Cambridge: University Press (1950).
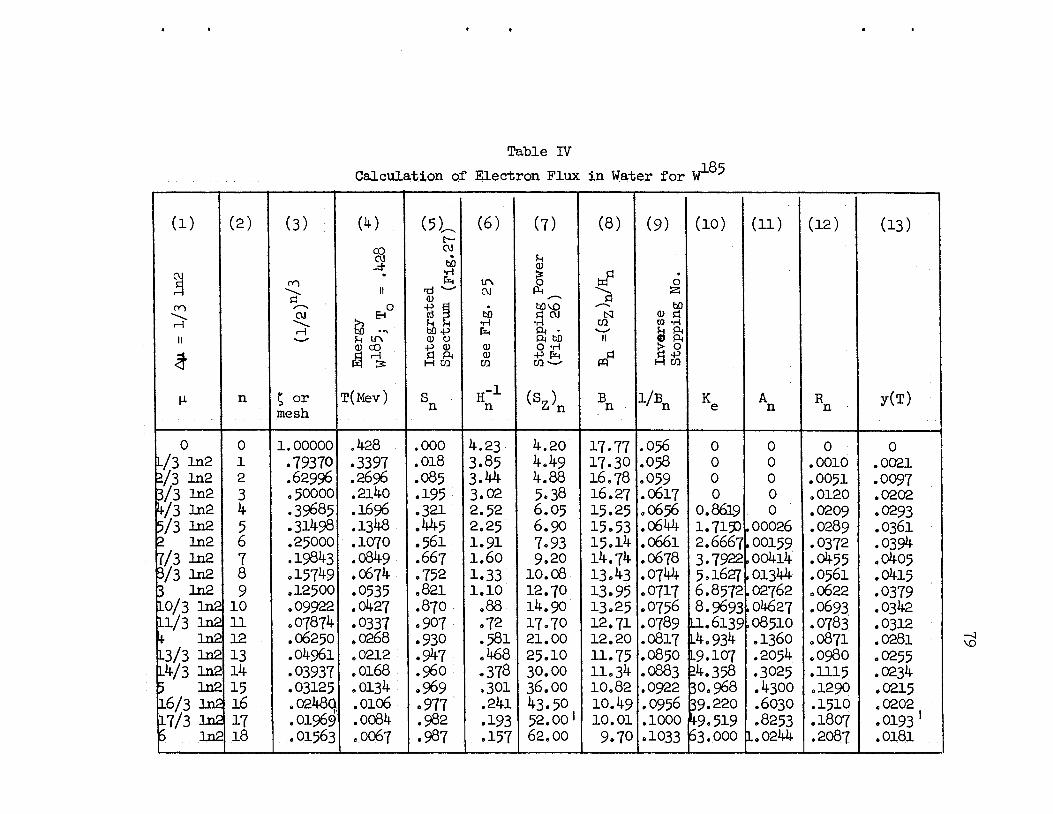
Table IV
Calculation of Electron Flux in Water for W ^
(1) (2) (3) (4) (5)_ (6) (7) (8) (9) (10) (11) (12) (13)
CJPO
COOJ
•
OJ
bO•H
in 6pj
11 OJ Pk > J25
PO 0 *> § . bOVO b0OJ EH c8 p bO a oj NI oj d
HS ••>
U U •H •H CQ 01 vH
H W-p P-4 ft • ^s U ftII S-t m
<D CO<u 0
+5 <D <uft bOO -H
II 4) ft
t &% G ftH CQ
(DCQ
-P hCQ-— P?
a +3H CO
H n £ ormesh
T(Mev) sn
H"1n
(sz)^ n
Bn v\ K
eA
nR
ny(T)
0 0 1.00000 .428 .000 4.23 4.20 17.77 .056 0 0 0 0
L/3 1*2 1 .79370 .3397 .018 3.85 4.49 17.30 .058 0 0 .0010 .0021
2/3 1*2 2 .62996 .2696 .085 3.44 4.88 I6.78 .059 0 0 .0051 .00973/3 1*2 3 .50000 .2140 .195 3.02 5.38 16.27 .0617 0 0 .0120 .0202
k/3 1*2 k .39685 .I696 .321 2.52 6.05 15.25 ,0656 0.8619 0 .0209 .02935/3 1*2 5 .31498 .1348 .445 2,25 6.90 15.53 .0644 1.7150 .00026 .0289 .03612 Ln2 6 .25000 .1070 .561 1.91 7.93 15.14 .0661 2.6667 .00159 .0372 .03947/3 1*2 7 .19843 .0849 .667 1.60 9.20 14.74 .0678 3.7922 ,oo4i4 .0455 .04053/3 1*2 8 0157^9 .0674 .752 1.33 10.08 13.43 .0744 5.I627 .01344 .0561 .04153 1*2 9 .12500 .0535 .821 1.10 12.70 13.95 .0717 6.8572 .02762 ,0622 .0379LO/3 ln2 10 .09922 .0427 .870 .88 14.90 13.25 .0756 8.9693 ,04627 .0693 .0342Ll/3 ln2 11 .07874 .0337 .907 .72 17.70 12.71 .0789 LL.6139 .08510 .0783 .0312t ln2 12 .06250 .0268 .930 .581 21.00 12.20 .0817 L4.934 .1360 .0871 .0281L3/3 1*2 13 .04961 .0212 .947 .468 25.10 11.75 .0850 L9.107 .2054 .0980 .0255L4/3 ln2 14 .03937 .0168 .960 .378 30.00 11.3^ .0883 24.358 .3025 .1115 .02345 ln2 15 .03125 . 0134 .969 .301 36.00 10.82 .0922 30,968 .4300 .1290 .0215
16/3 1*2 16 .0248c) .0106 .977 .241 43.50 10.49 .0956 39.220 .6030 .1510 .0202
17/3 1*2 17 .01969 .0084 .982 .193 52.00' 10.01 .1000 ^9.519 .8253 .1807 .0193 'p ln2i 18 .01563 .0067 .987 .157 62,00 9.70 .1033 63.OOO 1.0244 .2087 .0181
-JVO
8o
The calculation is started from a knowledge of R through R^. We know
that R = 0 since S =0. R_ = S^bT1; R_ = S^B"1; R, = S-Bl1; ando o 1 112 223 33
Rj, = sj,B. . These are special cases of Eq. (27) above, since for
e = 1, 2, 3, Kg = 0, and when n =4, K^(= 0.86l9)is multiplied by R
which is zero. From these values of R we may obtain R_. We see from
Eq. (36) that R_ is5
R5 =B"1 *|S5 +
Hence
R5 -B^ S5 +
m=5-3
m=0
Kc C R ,5-m mm).
CoRoK5 + C1R1K4 + C2R2K3
and for R^ we get by the same method,
R6 =B61 \ S6 +
RT -B"1 AS7 +
m=6-3-1
JV = B,'6=a6 1 b6 + K* C R6-m m m
m=0
K>C R + K_C,R. + K),C0R0 + K.C_R_600 51JL 422 333
K7CoRo +K6C1R1 +K5C2R2 +K4C3R3 +K3C4R4
(38)
(39)
(40)
(41)
(42)
R ^B"1n n
S + An n
81
The quantity in the square brackets, , is defined as An
and is tabulated in column 11, Table IV. In terms of Aq, Eq. (36) may
be written
(43)
To simply the calculation, graphs, shown in Figs. 25, 26, and 27,
were made— Fig. 25 of H(T)"1, Fig. 26 of the stopping power Sz(t), and
one like Fig. 27 of the integrated beta spectrum for each isotope. The
stopping power was calculated from Bethe's exact solution of Moller's
24relativistic electron-electron scattering formula written for the
weighted sum of the stopping powers of hydrogen and oxygen per unit
volume of the water medium.
2*N e*1" r-i r mv T ) o~' 2Sz(T) ._£_ p£(Vi/A±) {m—^-(2^T-i+P)-
+1-B2 +1/8 (1 -̂?)2} W
Here f . Z and A. are the fractional mass abundance, atomic number, andi' i 1
atomic weight of the ith constituent of the medium. If energies are
expressed in mc2 units and if 'K(T) is defined as
2k H. A. Bethe, HANDBUCH DER PHYSIK 24, 273 (1933).
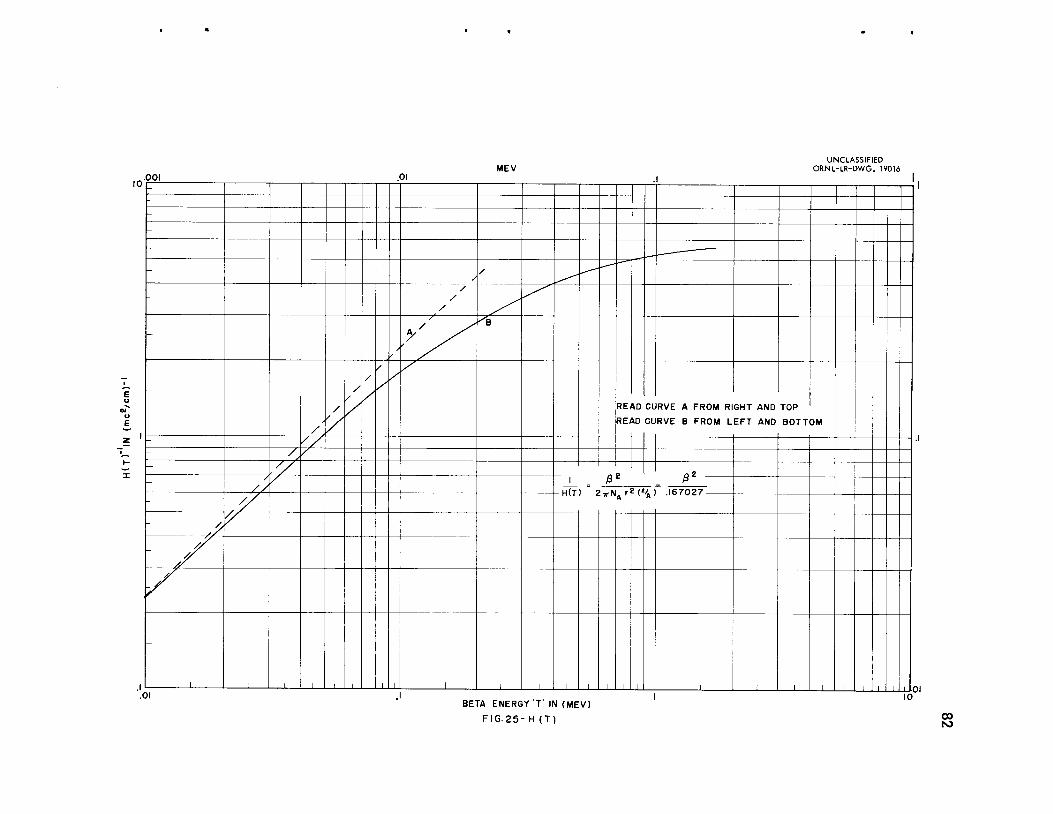
MEVUNCLASSIFIED
ORNL-LR-DWG. 19016001 . 01 1 ,
//
-
/
/
/
-
/
'
^B
/
/
/
'
READ CURVE A FROM RIGHT AND
READ CURVE B FROM LEFT AND
TOP
BOTTOM
/ //y
//a »
//1
H(T
V2 n >E ('/- 1 167027
// A > ft
^~
//
y
y
1 i i i i i i i i i i 1 1 1 1 I _L I 1 I 1 1 1 1 ! , 01.01 10
BETA ENERGY 'T' IN (MEV)
FIG.25- H (T) CD00

I00r
ir
oQ.
O
O
.003
I ' I ' I ' I 'I'
I I I I I 1
.01
i ' i ' r "I 1 I I I
I I hill ill _L J_.05 .1
BETA ENERGY T IN MEV
FIG. 26-STOPPING POWER IN WATER S7(T)
I
UNCLASSIFIED
ORNL-LR-DWG. 19017
00CO

3
OUJ
N
a.oz
e<0
Eu
O
CC
2
w
UNCLASSIFIEDORNL-LR-DWG. 19018
84
100 200
BETA ENERGY IN KEV
300 400
185FIG.27-INTEGRATED SPECTRUM OF W

H(T) =2«N r
e o
85
(45)
where N is the electron density of the medium and r is the classicale o
electron radius, Eq. (44) becomes
SZ(T) =H(T) jln U2(l -^ l-$d))/fl-prj/2 -(2-^/l-P2 -l+p2)ln2
+1-p2 +1/8 (1 -Vl^?)2 + ^(Zif^/Ai) lQ^./(2lf^/^(Zifi)/^
(46)
For water H(T) = (0.167/p ) and the last term in Eq. (46) has the value
17.0.
For the case of w the original beta spectrum was obtained from
25 32 35 45experimental data given in the literature. y P^ , S , and Ca y are
Fermi allowed and their spectral shapes were obtained from an article
by Marshall. There were two spectra which are first forbidden with a
90 204spin change of Al = 2. These two, Yp and Tl , have the "alpha"
spectrum shape factor which can also be obtained from the Marshall
25B. Schull, "Beta Ray Spectrum of Europium and Tungsten," Ehys.
Rev. 74, 917 (1948).
26 John H. Marshall, "How to Figure Shapes of Beta Ray Spectra,"Nucleonics 13_, No. 8 (1955).
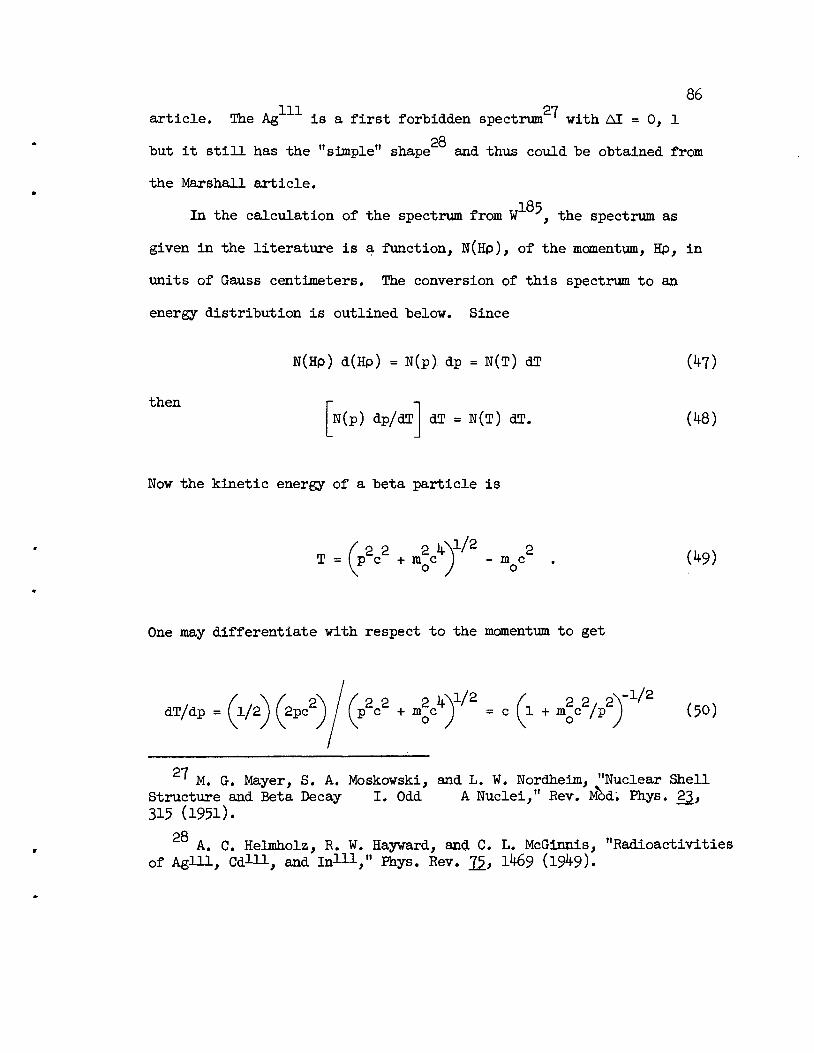
86111 27
article. The Ag is a first forbidden spectrum ' with Al = 0, 1
28but it still has the "simple" shape and thus could be obtained from
the Marshall article.
185In the calculation of the spectrum from W , the spectrum as
given in the literature is a function, N(Hp), of the momentum, Hp, in
units of Gauss centimeters. The conversion of this spectrum to an
energy distribution is outlined below. Since
N(Hp) d(Hp) = N(p) dp = N(T) dT (47)
then
N(p) dp/dT dT = N(T) dT. (48)
Now the kinetic energy of a beta particle is
T=(p2c2 +m2c^Y/2 -mQc2 . (49)
One may differentiate with respect to the momentum to get
4Y-/2 f 22/ 2V1/2dT/dp -(1/2) (2pc2) /(p2c2 +m2c4) =c(l +m2c2/p2J (50)
' M. G. Mayer, S. A. Moskowski, and L. W. Nordheim, "Nuclear ShellStructure and Beta Decay I. Odd A Nuclei," Rev. Mod. Phys. 23_,315 (1951).
28 A. C. Helmholz, R. W. Hayward, and C. L. McGinnis, "Radioactivitiesof Aglll, CdUl, and InlH," Riys. Rev. 25_, 1^9 (19^9).
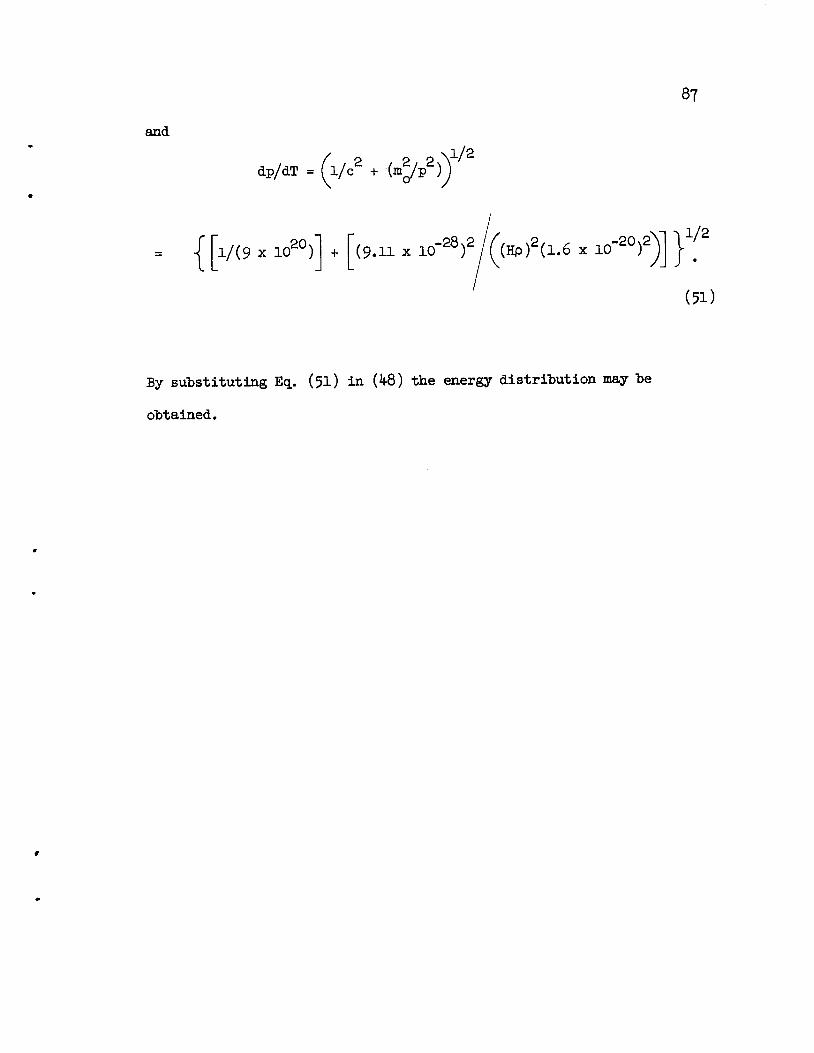
and
1/2dp/dT =(l/2 +(m2/p2n
{ 1/(9 x1020) (9.11 x10⁻²⁸)2/f(Hp)2(l.6 x10"20)2
By substituting Eq. (51) in (48) the energy distribution may be
obtained.
87
1/2
(51)

2. Typical Data
A. Dose rate from assayed activity, of solution
Isotope
Max. beta energy T,
Av. thin source energy T,
Av. in water
Half life
T
90Yr t Sample II
2.18 Mev
900 kev
694 kev
64.2 hr
Original sample approximately 2.0 ml of 15.51 me/ml at 0800on 11-9-56, diluted with 3 ell concentrated HNOo and made upwith water to 1 liter solution to give 0.05 N acidity.
-4 ,90Original assay showed < 5 x 10" mc/ml of Sr in sample, atO.36 N HC1.
Dilute solution assayed 28.85 uc/ml + 10$ at 1210 on 11-9-56.Dilute solution assayed 3.83 Ltc/ml +~~10# at 0925 on 11-17-56.
Calculated dose rate in air cavity, average corrected to1200 on 11-9-56.
= 17.33 macre/sec =(This assumes 0° C, 760 mm in cavity)
B. Dose rate from ionization in cavity (Mylar wall/ 2I mg/cm
Active length of cavity 9.1 cmDiameter (average) 1.6ll cmVolume 18.56 cm3
88
17.33 mr/sec
Date Time Barometer Temp.(24-hr clock) observed °
mm
11-12 1046
1107
11-14 1605
11-17 1510
11-19 1511
741.1
743.9
744
749.8
c.
23.1
23.5
23
22
Observed
volts across
electrometer
2.0762.061
I.236
0.0964
0.0571
Electrometer
input resistorohms
J-0
,10
10
5.30 x 105.30 x 10
5.30 x 10
9.13 x 1059.13 x 10'
Average dose rate corrected to 1200 on 11-9-56 at NTP 16.35 mr/sec
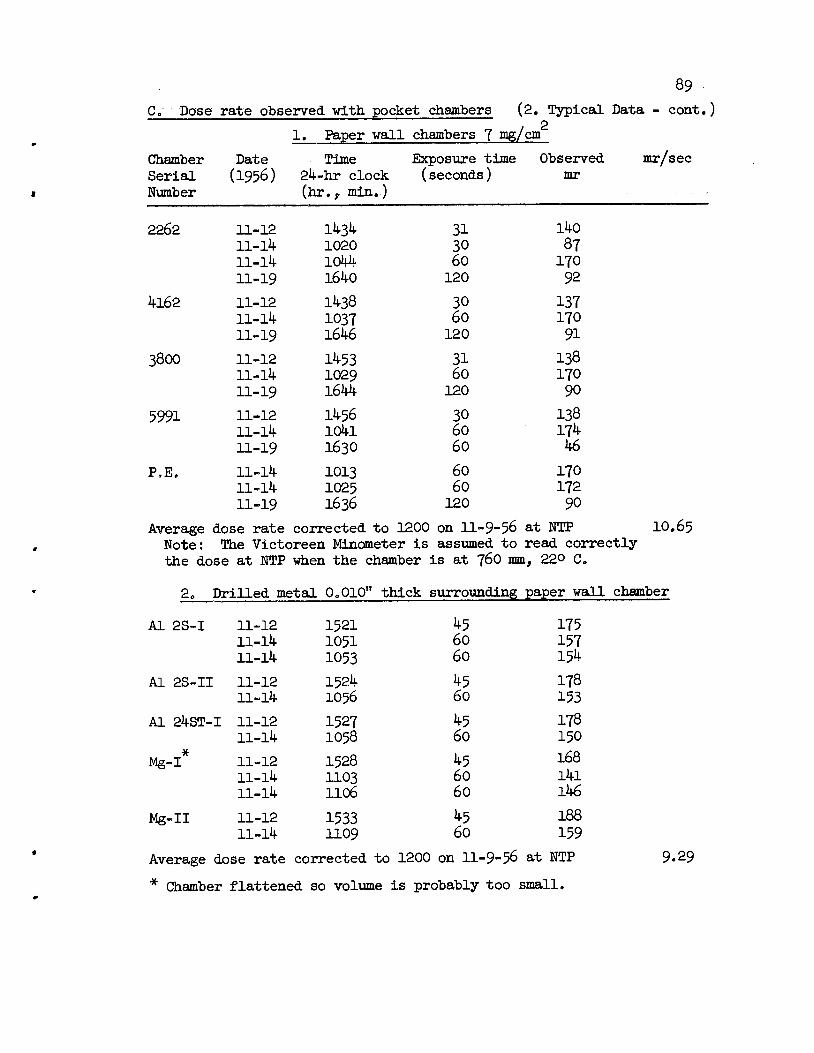
89
C. Dose rate observed with pocket chambers (2. Typical Data - cont.)
1. Paper wall chambers 7 mg/cm
Chamber
Serial
Number
Date
(1956)Time
24-hr clock
(hr., min.)
Exposure time(seconds)
Observed
mr
mr/sec
2262 11-12
11-1411-14
11-19
14341020
10441640
313060120
140
87170
92
4162 11-12
11-14
11-19
143810371646
3060120
137170
91
38CO 11-12
11-14
11-19
145310291644
3160120
138170
90
5991 11-12
11-14
11-19
14561041
1630
306060
13817446
P.E. 11-14
11-14
11-19
101310251636
60
60
120
170172
90
Average dose rate corrected to 1200 on 11-9-56 at NTPNote: The Victoreen Minometer is assumed to read correctlythe dose at NTP when the chamber is at 760 mm, 220 c.
10.65
2» Drilled metal 0,010" thick surrounding paper wall chamber
Al 2S-I 11-12
11-1411-14
1521
1051
1053
4560
60
175
157154
Al 2S-II 11-12
11-1415241056
4560
178153
Al 24ST-I 11-12
11-1415271058
4560
178150
Mg-I 11-12
11-1411-14
152811031106
4560
60
168
141
146
Mg-II 11-12
11-1415331109
4560
188
159
Average dose rate corrected to 1200 on 11-9-56 at NTP
* Chamber flattened so volume is probably too small.
9.29

90
C. Dose rate observed with pocket chambers - cont.
3. Drilled plastic 0.093" thick surrounding paper wall chamber
Chamber Date Time Exposure time Observed mr/secSerial (1956) 24-hr clock (seconds) mrNumber (hr., min.)
4000 11-12
11-1415351113
6090
173166
6554 11-12
11-1415371116
6090
169159
7231 11-12
11-1415411119
60
90
170161
9035 11-12
11-1415431123
6090
161
151
Average dose rate corrected to 1200 on 11-9-56 at NTP 6.58
4. Standard Victoreen pocket chambers
90 119150 124
120 160150 124
120 149150 116
120 160150 124
120 154
150 121
150 113
Average dose rate corrected to 1200 on 11-9-56 at NTP 3.O5
623 11-12
11-1415471208
1067 11-12
11-1415511210
1513 11-12
11-1415541213
1723 11-12
11-1415581215
2260 11-12 1602
2129 11-14 1217
2164 11-14 1221
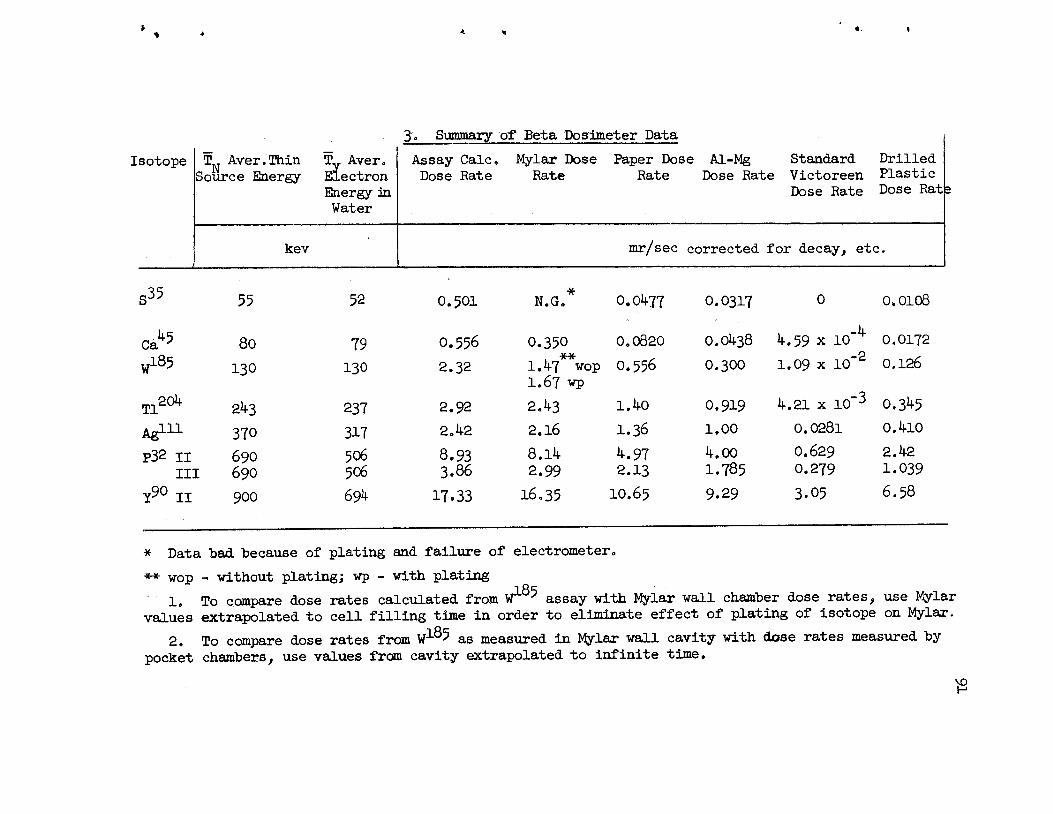
Isotope
,35
T„ Aver.Thin
Source Energy
kev
55
T Aver.
Electron
Energy inWater
52
3v Summary of Beta Dosimeter Data
Assay CalcDose Rate
Mylar Dose Paper Dose Al-MgRate Rate Dose Rate
Standard
Victoreen
Dose Rate
Drilled
Plastic
Dose Rat
mr/sec corrected for decay, etc.
0.501 N.G. 0.0477 0.0317 0 0.0108
Ca*5 80 79 0.556 0.350 0.0820 0.0438 4.59 x 10 0.0172
W185 130 130 2.32y y
1.47 wopI.67 wp
0.556 0.300 1.09 x 10~2 0.126
T1204243 237 2.92 2.43 1.40 0.919 4.21 x 10"3 0.345
AglH 370 317 2.42 2.16 1.36 1.00 0.0281 o.4io
P32 IIIII
690690
506506
8.933.86
8.14
2.99
4.972.13
4.00
1.7850.6290.279
2.42
1.039
Y90 1Z 900 694 17.33 16.35 IO.65 9.29 3.05 6.58
* Data bad because of plating and failure of electrometer.
** wop - without plating; wp - with plating
1. To compare dose rates calculated from W185 assay with Mylar wall chamber dose rates, use Mylarvalues extrapolated to cell filling time in order to eliminate effect of plating of isotope on Mylar,
2. To compare dose rates from W185 as measured in Mylar wall cavity with dose rates measured bypocket chambers, use values from cavity extrapolated to infinite time.
VOH

92
4. Beta Dosimeter Responses as Percentages of Various Reference ValuesA. Dose rates expressed as percentages of those calculated from
assay of solutions
Isotopei Ty in Mylar Paper Drilled Drilled Standard
water walled walled Al-Mg plastic Victoreen
cavity chamber chamber chamber chamber
S35
Ca^52 N.G. 9-5 6.3 2.2 0
79 63 14.7 7.9 3.1 0.08
wl85 130 64* 24 13 5.4 0.47Tl204 237 83 48 31 11.8 o.i4Aglll
317 89 56 4l 17 1.1
P32av 506 85 55 45 27 7.2
Y90 694 94 61 54 38 17.6
B. Dose rates expressed as percentages of those measured byionization in Mylar wall cavity
4.9Ca*5 79 23 12.5 0.1
W185 130 33 18 7.5 O.65T1204 237 58 38 14 0.17
AglH 317 63 46 19 1.3p32 506 66 54 32 8.4
Y90 694 65 57 40 18.6
C. Dose rates expressed as percentages of those :measured by paperwall chambers
s35 52 66 23 0
Ca^5 79 53 21 0.6
WI85 130 54 23 2.0
T1204 237 65 25 0.3Aglll 317 73 30 2.1
P32 506 82 49 13Y90 694 88 62 29
Plating effect deducted.
93
Bibliography
1. Attix, F. H., and DeLaVergne, L., "Cavity Ionization as a Functionof Wall Atomic Number," (to be published).
2. Bethe, H. A., HANDBUCH DER PHYSIK 24, 273, Berlin: Julius Springer(1933).
3. Birkhoff, R. D., Hubbell, H. H., Cheka, J. S., Johnson, R. M., andRitchie, R. H., "Electron Spectrum in a Radioactive Medium," paperread at the meeting of the American Physical Society, Washington,D. C. (1956).
4. Birkhoff, R. D., HANDBUCH DER PHYSIK _3_4, Berlin: Julius Springer(to be published).
5. Bragg, W., STUDIES IN RADIOACTIVITY, London: McMillan and Co. (1912).
6. Clark,R. L., "Absorbers in Film Badge," Memo to J. C. Hart, OakRidge National Laboratory (January 19, 1948).
7. Day, F. H., "X-Ray Calibration of Radiation Survey Meters, PocketChambers, and Dosimeters," Washington: Government Printing Office,National Bureau of Standards, Circular 507 (July 1951).
8. Duffield, R. B., and Langer, L. M., "Disintegrations of Sn121 andSnl23," Phys. Rev. 76, 1272 (1949).
9. Ehrlich, M., and Fitch, S. H., "Photographic X- and Gamma-Ray Dosimetry,"Nucleonics 9, No. 3, 5 (1951)•
10. Gray, L. H., "Absorption of Penetrating Radiation," Proc. Roy. Soc.Lond. 122A, 647 (1929).
11. Gray, L. H., "An Ionization Method for Absolute Measurement of X-RayEnergy," Proc. Roy. Soc. Lond. 15_6_A, 578 (1936).
12. Gray, L. H., "Ionization Produced in Air at a Given Distance from aStandard Radium Source," Brit. J. Radiol. 10, 600 (1937).
13. Gray, L. H., "The Ionization Method of Measuring Neutron Energy,"Proc. Camb. Phil. Soc. 40, 72 (1944).
14. Gupton, E. D., "Recombination Losses in Pocket Chambers," Nashville:A Thesis, Vanderbilt University (March 1955).
15. Helmholz, A. C, Hayward, R. W., and McGinnis, C. L., "Radioactivitiesof Aglll, cam, and Inlll/ Riys. Rev. J_5_, 1469 (1949).
16. Jeffreys, H., and Jeffreys, B. S., "Methods of MathematicalPhysics," Cambridge: University Press, 287 (1950).
94
17. Marshall, J. H., "How to Figure the Shapes of Beta-Ray Spectra,"Nucleonics 13, No. 8, 34 (1955).
18. Mayer, M. G., Moskowski, S. A., and Nordheim, L. W., "NuclearShell Structure and Beta Decay I. Odd A Nuclei," Rev.Mod. Phys. 23, 315 (1951).
19. Moller, C, "Zur Theorie Des Durchgangs Schneller ElektronenDurch Materie," Annalen Der Physik 14, 531 (1932).
20. Morgan, K. Z., HEALTH PHYSICS CONTROL AND NUCLEAR RESEARCH (tobe published).
21. National Bureau of Standards, Research Paper No. 56. Washington:U„ S. Department of Commerce (1928).
22. National Bureau of Standards, Research Paper No. 865. Washington:Journal of Research N.B.S. 16, (1928).
23. National Bureau of Standards, "Permissible Dose from ExternalSources of Ionizing Radiation," Handbook 59. Washington: U. S.Department of Commerce (1954).
24. Rossi, H. H., and Ellis, R. H., "Calculation for Distributed Sourcesof Beta Radiation," Amer. J. Roent. and Rad. Ther. 6j, 980 (1952).
25. Schweiter, G. K., and Jackson, W. M., "Radiocolloids," J. Chem. Ed.29, 513 (1952).
26. Schull, F. B„, "Beta-Ray Spectrum of Europium and Tungsten," Phys.Rev. J4, 917 (1948).
27. Spencer, L. V., and Attix, F. H., "A Theory of Cavity Ionization,"Rad. Res. 3_, No. 3,239 (1955).
28. Spencer, L. V., and Fano, U., "Energy Spectrum Resulting from ElectronSlowing Down," Phys. Rev. 93_, No. 6, 1172 (1954).
29. Taylor, L. S., and Singer, G., "Improved Form of Standard Ion Chamber,"read before Radiological Society of North America, Toronto (December1929).